21/12/2015 Document 296559.1 https://support.oracle.com/epmos/faces/DocumentDisplay?_adf.ctrlstate=ho4csv1e5_465&id=296559.1 1/14 FAQ: Common Tracing Techniques in Oracle EBusiness Applications 11i and R12 (Doc ID 296559.1) In this Document Purpose Questions and Answers 1a. What is a trace file? Example #1: ORAError Example #2: Rollback 1b. What are bind variables? Example #1: Binds Example #2: Binds 2. How to Enable Trace In... 2a. Forms 2b. Concurrent Program Checkbox Debug Options Button! (Binds and Waits) SQL Program (Binds and Waits) 2c. Trace ALL user actions 2d. Webbased screen 3. Finding Trace Files? 3a. In 11G: 3b. Before 11G: 4. Other Tools 4a. Using TKPROF 4b. Using TraceAnalyzer 4c. SQLT 4d. RDA 4. Before 11i? 5. Tracing API Calls References APPLIES TO: Oracle Inventory Management Version 12.1.3 to 12.1.3 [Release 12.1] Oracle EBS Applications Performance Version 11.5.10.2 to 12.2 [Release 11.5.10 to 12.2] Information in this document applies to any platform. ALL PRODUCT ACCESS TKProf and Tracing

Welcome message from author
This document is posted to help you gain knowledge. Please leave a comment to let me know what you think about it! Share it to your friends and learn new things together.
Transcript
21/12/2015 Document 296559.1
https://support.oracle.com/epmos/faces/DocumentDisplay?_adf.ctrlstate=ho4csv1e5_465&id=296559.1 1/14
FAQ: Common Tracing Techniques in Oracle EBusiness Applications 11i and R12 (Doc ID296559.1)
In this Document
Purpose
Questions and Answers
1a. What is a trace file?
Example #1: ORAError
Example #2: Rollback
1b. What are bind variables?
Example #1: Binds
Example #2: Binds
2. How to Enable Trace In...
2a. Forms
2b. Concurrent Program
Checkbox
Debug Options Button! (Binds and Waits)
SQL Program (Binds and Waits)
2c. Trace ALL user actions
2d. Webbased screen
3. Finding Trace Files?
3a. In 11G:
3b. Before 11G:
4. Other Tools
4a. Using TKPROF
4b. Using TraceAnalyzer
4c. SQLT
4d. RDA
4. Before 11i?
5. Tracing API Calls
References
APPLIES TO:
Oracle Inventory Management Version 12.1.3 to 12.1.3 [Release 12.1]Oracle EBS Applications Performance Version 11.5.10.2 to 12.2 [Release 11.5.10 to 12.2]Information in this document applies to any platform.ALL PRODUCT ACCESSTKProf and Tracing

21/12/2015 Document 296559.1
https://support.oracle.com/epmos/faces/DocumentDisplay?_adf.ctrlstate=ho4csv1e5_465&id=296559.1 2/14
PURPOSE
Here are some common questions or tips about Tracing, SQL Trace, TKProf, and Trace Analyzer related to the OracleEBusiness Applications 11i and R12.
QUESTIONS AND ANSWERS
1. Overview
1a. What is a trace file?
A trace file is a log of SQL run in a particular session or sessions focused on selects, inserts, updates, and deletes. Atrace file can be used in many circumstances including reviewing performance, finding tables and views referenced, orfinding the root of an error. More details about trace files can be read in the database user's guide related to yourversion.
Example #1: ORAError
The following is an snippet from a trace file that had an Oracle standard error. In this case it is a unique constraintviolation, ORA 1 unique constraint. See the line: ERROR #117:err=1 tim=1443801753. The ERROR flags the line andthe 'err=1' lists the Oracle error as ORA1:
===================== PARSING IN CURSOR #117 len=1828 dep=1 uid=173 oct=2 lid=173 tim=1203661932011076 hv=1015075934 ad='cc60a820'
INSERT INTO BOM_SUB_OPERATION_RESOURCES (OPERATION_SEQUENCE_ID, SUBSTITUTE_GROUP_NUM, RESOURCE_ID, SCHEDULE_SEQ_NUM,REPLACEMENT_GROUP_NUM, ACTIVITY_ID, STANDARD_RATE_FLAG, ASSIGNED_UNITS, USAGE_RATE_OR_AMOUNT, USAGE_RATE_OR_AMOUNT_INVERSE, BASIS_TYPE,SCHEDULE_FLAG, LAST_UPDATE_DATE, LAST_UPDATED_BY, CREATION_DATE, CREATED_BY, LAST_UPDATE_LOGIN, RESOURCE_OFFSET_PERCENT, AUTOCHARGE_TYPE,ATTRIBUTE_CATEGORY, REQUEST_ID, PROGRAM_APPLICATION_ID, PROGRAM_ID, PROGRAM_UPDATE_DATE, ATTRIBUTE1, ATTRIBUTE2, ATTRIBUTE3, ATTRIBUTE4,ATTRIBUTE5, ATTRIBUTE6, ATTRIBUTE7, ATTRIBUTE8, ATTRIBUTE9, ATTRIBUTE10, ATTRIBUTE11, ATTRIBUTE12, ATTRIBUTE13, ATTRIBUTE14, ATTRIBUTE15,PRINCIPLE_FLAG, SETUP_ID, CHANGE_NOTICE, ACD_TYPE, ORIGINAL_SYSTEM_REFERENCE ) SELECT DISTINCT A.OPERATION_SEQUENCE_ID,B.SUBSTITUTE_GROUP_NUM, D.RESOURCE_ID, B.SCHEDULE_SEQ_NUM, B.REPLACEMENT_GROUP_NUM, B.ACTIVITY_ID, B.STANDARD_RATE_FLAG,B.ASSIGNED_UNITS, B.USAGE_RATE_OR_AMOUNT, B.USAGE_RATE_OR_AMOUNT_INVERSE, B.BASIS_TYPE, B.SCHEDULE_FLAG, SYSDATE, :B4 ,SYSDATE, :B4 , NULL, B.RESOURCE_OFFSET_PERCENT, B.AUTOCHARGE_TYPE, B.ATTRIBUTE_CATEGORY, FND_GLOBAL.CONC_REQUEST_ID, NULL,FND_GLOBAL.CONC_PROGRAM_ID, SYSDATE, B.ATTRIBUTE1, B.ATTRIBUTE2, B.ATTRIBUTE3, B.ATTRIBUTE4, B.ATTRIBUTE5, B.ATTRIBUTE6, B.ATTRIBUTE7,B.ATTRIBUTE8, B.ATTRIBUTE9, B.ATTRIBUTE10, B.ATTRIBUTE11, B.ATTRIBUTE12, B.ATTRIBUTE13, B.ATTRIBUTE14, B.ATTRIBUTE15, B.PRINCIPLE_FLAG,B.SETUP_ID, DECODE (:B2 , 1, B.CHANGE_NOTICE, :B3 ), DECODE (:B2 , 1, B.ACD_TYPE, 1), B.ORIGINAL_SYSTEM_REFERENCEFROM BOM_OPERATION_RESOURCES A, BOM_SUB_OPERATION_RESOURCES B, BOM_RESOURCES C, BOM_RESOURCES DWHERE A.LAST_UPDATED_BY = B.OPERATION_SEQUENCE_ID AND B.RESOURCE_ID = C.RESOURCE_ID AND C.RESOURCE_CODE = D.RESOURCE_CODEAND D.ORGANIZATION_ID = :B1 AND NVL (D.DISABLE_DATE, SYSDATE + 1) > SYSDATE
END OF STMT EXEC #117:c=2099681,e=2436776,p=315,cr=5416,cu=19,mis=0,r=0,dep=1,og=1,tim=1203661932011073
ERROR #117:err=1 tim=1443801753 =====================
Example #2: Rollback
Another common thing to look for in trace files are rollbacks. There are several formats that you might see for arollback including the word 'rollback' or text like 'XCTEND rlbk=1, rd_only=1'.
=====================

21/12/2015 Document 296559.1
https://support.oracle.com/epmos/faces/DocumentDisplay?_adf.ctrlstate=ho4csv1e5_465&id=296559.1 3/14
PARSING IN CURSOR #118 len=30 dep=1 uid=173 oct=45 lid=173 tim=1203661932011639 hv=4099445834 ad='0'ROLLBACK TO BEGIN_ROUTING_COPY
END OF STMT EXEC #118:c=0,e=124,p=0,cr=0,cu=21,mis=0,r=0,dep=1,og=0,tim=1203661932011637
RPC EXEC:c=2105681,e=2524801 BINDS #116:
=====================
1b. What are bind variables?
A bind variable is a substitution value used within a trace file. To improve performance, the Oracle database will reuseSQL substituting values for variables as necessary. For example, the same SQL statement could be run for each of your employees. The employee id might be a variable that is changed before you run each SQL. This could betranslated to the database as a bind variable so that the same SQL can be used each time but the correct variable canbe substituted just before the SQL is run.
If someone requests that you enable bind variables for your trace file, this causes the database to document thesubstitution variables within the trace file as well as the SQL run. For example, we may see that a select statement ranagainst the employee table ten times, but without the binds, we would not know what employee was selected eachtime.
Example #1: Binds
Here is an example of a trace file with binds. In this example, we see a query against a table calledMTL_SYSTEM_ITEMS_VL. Bind variables are used in the whereclause to substitute for the following ":num",":SEGMENT1", and ":FND_FLEX_WHERE_BIND_0".
===================== PARSING IN CURSOR #78 len=785 dep=0 uid=173 oct=3 lid=173 tim=1203661928858323 hv=3885565797 ad='d16ab6f8'
SELECT ENABLED_FLAG, SUMMARY_FLAG, NVL(TO_CHAR(START_DATE_ACTIVE, 'J'), 0),NVL(TO_CHAR(END_DATE_ACTIVE, 'J'), 0),SEGMENT1,DESCRIPTION, PRIMARY_UOM_CODE, LOCATION_CONTROL_CODE, RESTRICT_LOCATORS_CODE, RESTRICT_SUBINVENTORIES_CODE,INVENTORY_ASSET_FLAG, product_family_item_id, BOM_ITEM_TYPE, SERIAL_NUMBER_CONTROL_CODE, INVENTORY_ITEM_IDFROM MTL_SYSTEM_ITEMS_VL WHERE ORGANIZATION_ID = :num AND SEGMENT1 = :SEGMENT1
AND ( bom_enabled_flag = 'Y' And bom_item_type <> 3 And pick_components_flag = 'N' And eng_item_flag = 'N'And not exists (Select null From bom_operational_routings bor Where bor.assembly_item_id = inventory_item_idAnd bor.organization_id = :FND_FLEX_WHERE_BIND_0 And bor.alternate_routing_designator is null And bor.routing_type <> 1)And eam_item_type IS NULL )
END OF STMT EXEC #78:c=0,e=108,p=0,cr=0,cu=0,mis=0,r=0,dep=0,og=1,tim=1203661928858320
FETCH #78:c=0,e=76,p=0,cr=10,cu=0,mis=0,r=1,dep=0,og=1,tim=1203661928858425 BINDS #78:
kkscoacd Bind#0 oacdty=02 mxl=22(22) mxlc=00 mal=00 scl=00 pre=00
oacflg=01 fl2=1000000 frm=00 csi=00 siz=2056 off=0 kxsbbbfp=2a9cff79f0 bln=22 avl=03 flg=05
value=101 Bind#1
oacdty=01 mxl=32(15) mxlc=00 mal=00 scl=00 pre=00 oacflg=01 fl2=1000000 frm=01 csi=873 siz=0 off=24 kxsbbbfp=2a9cff7a08 bln=32 avl=09 flg=01
value="MRS6814MC" Bind#2
oacdty=01 mxl=2000(255) mxlc=00 mal=00 scl=00 pre=00

21/12/2015 Document 296559.1
https://support.oracle.com/epmos/faces/DocumentDisplay?_adf.ctrlstate=ho4csv1e5_465&id=296559.1 4/14
oacflg=01 fl2=1000000 frm=01 csi=873 siz=0 off=56 kxsbbbfp=2a9cff7a28 bln=2000 avl=03 flg=01
value="101" EXEC #78:c=0,e=81,p=0,cr=0,cu=0,mis=0,r=0,dep=0,og=1,tim=1203661928859390
FETCH #78:c=0,e=36,p=0,cr=10,cu=0,mis=0,r=1,dep=0,og=1,tim=1203661928859438 =====================
Example #2: Binds
Here is another example where you see the bind numbers. This is more common. Note that the binds are off by one bind#0 goes with the variable :b1, bind#1 goes with variable :b2, etc.
===================== PARSING IN CURSOR #128 len=863 dep=0 uid=173 oct=6 lid=173 tim=1203661928862922 hv=1516422370 ad='d1d91940'
UPDATE BOM_OPERATIONAL_ROUTINGS SET ROUTING_SEQUENCE_ID = :b1,ASSEMBLY_ITEM_ID = :b2,ORGANIZATION_ID = :b3,ALTERNATE_ROUTING_DESIGNATOR = :b4,LAST_UPDATE_DATE = :b5,LAST_UPDATED_BY = :b6,LAST_UPDATE_LOGIN = :b7 WHERE ROWID = :b8
END OF STMT PARSE #128:c=0,e=442,p=0,cr=0,cu=0,mis=1,r=0,dep=0,og=1,tim=1203661928862919
BINDS #128: kkscoacd
Bind#0 oacdty=02 mxl=23(22) mxlc=00 mal=00 scl=00 pre=00
oacflg=03 fl2=1000000 frm=00 csi=00 siz=2200 off=0 kxsbbbfp=2a9cff7cd8 bln=23 avl=04 flg=05
value=30020 Bind#1
oacdty=02 mxl=23(22) mxlc=00 mal=00 scl=00 pre=00 oacflg=03 fl2=1000000 frm=00 csi=00 siz=0 off=24 kxsbbbfp=2a9cff7cf0 bln=23 avl=04 flg=01
value=13003 Bind#2
oacdty=02 mxl=23(22) mxlc=00 mal=00 scl=00 pre=00 oacflg=03 fl2=1000000 frm=00 csi=00 siz=0 off=48 kxsbbbfp=2a9cff7d08 bln=23 avl=03 flg=01
value=101 Bind#3
oacdty=01 mxl=2000(255) mxlc=00 mal=00 scl=00 pre=00 oacflg=03 fl2=1000000 frm=01 csi=873 siz=0 off=72
kxsbbbfp=2a9cff7d20 bln=2000 avl=00 flg=01 Bind#4
oacdty=12 mxl=07(07) mxlc=00 mal=00 scl=00 pre=00 oacflg=03 fl2=1000000 frm=00 csi=00 siz=0 off=2072 kxsbbbfp=2a9cff84f0 bln=07 avl=07 flg=01
value="1/21/2009 8:56:55" Bind#5
oacdty=02 mxl=23(22) mxlc=00 mal=00 scl=00 pre=00 oacflg=03 fl2=1000000 frm=00 csi=00 siz=0 off=2080 kxsbbbfp=2a9cff84f8 bln=23 avl=03 flg=01
value=1555 Bind#6
oacdty=02 mxl=23(22) mxlc=00 mal=00 scl=00 pre=00 oacflg=03 fl2=1000000 frm=00 csi=00 siz=0 off=2104 kxsbbbfp=2a9cff8510 bln=23 avl=04 flg=01
value=370867 Bind#7

21/12/2015 Document 296559.1
https://support.oracle.com/epmos/faces/DocumentDisplay?_adf.ctrlstate=ho4csv1e5_465&id=296559.1 5/14
oacdty=01 mxl=32(18) mxlc=00 mal=00 scl=00 pre=00 oacflg=03 fl2=1000000 frm=01 csi=873 siz=0 off=2168 kxsbbbfp=2a9cfef550 bln=32 avl=18 flg=01
value="AABDb6AAiAAAGBqAA3" =====================
2. How to Enable Trace In...
2a. Forms
How does one enable trace in the Oracle Application screens / forms?
One can enable trace through the forms by using the Help menu, choosing the diagnostics menu, trace and thenselecting the appropriate trace for your needs. Most commonly if debugging an error, you should at least provide tracewith binds. When debugging a performance issue, you may consider using trace with binds and waits.
For example, the following is the navigation to enable trace in a form: 1. Goto the Oracle Applications 2. Login 3. Open the form where the error occurs but do not yet cause the error. 4. Enable SQL*Trace by choosing Help > Diagnostics > Trace > Trace with binds 5. A message appears indicating that the trace will be recorded 6. Note the file name and location of the file 7. Now reproduce the error. 8. Once the error occurs, disable trace as soon as possible. 9. Disable SQL*Trace by choosing Help > Diagnostics > Trace > Trace off 10. The same file name and location will be noted in case you need it again. 11. Retrieve the trace file.

21/12/2015 Document 296559.1
https://support.oracle.com/epmos/faces/DocumentDisplay?_adf.ctrlstate=ho4csv1e5_465&id=296559.1 6/14
2b. Concurrent Program
How does one enable trace for a concurrent program?
Note: For R12.1 and higher, the concurrent program submission screen now has a "Debug Options" button whereyou can enable trace. Make sure you have the Patch 8743459 described in Note 1273539.1 for this to work.Without the patch it will not work.
Checkbox
With system administration privileges, a simple way to enable trace in a concurrent program is to review theconcurrent program definition and select trace enabled. This will enable trace without binds for all users that run theprogram.
For example, the following steps could be used. 1. Goto Sysadmin > Concurrent > Program > Define 2. Query the concurrent program 3. Check the trace box to enable trace

21/12/2015 Document 296559.1
https://support.oracle.com/epmos/faces/DocumentDisplay?_adf.ctrlstate=ho4csv1e5_465&id=296559.1 7/14
If you require bind variables for your trace file from a concurrent program, a more sophisticated method is required asnoted below.
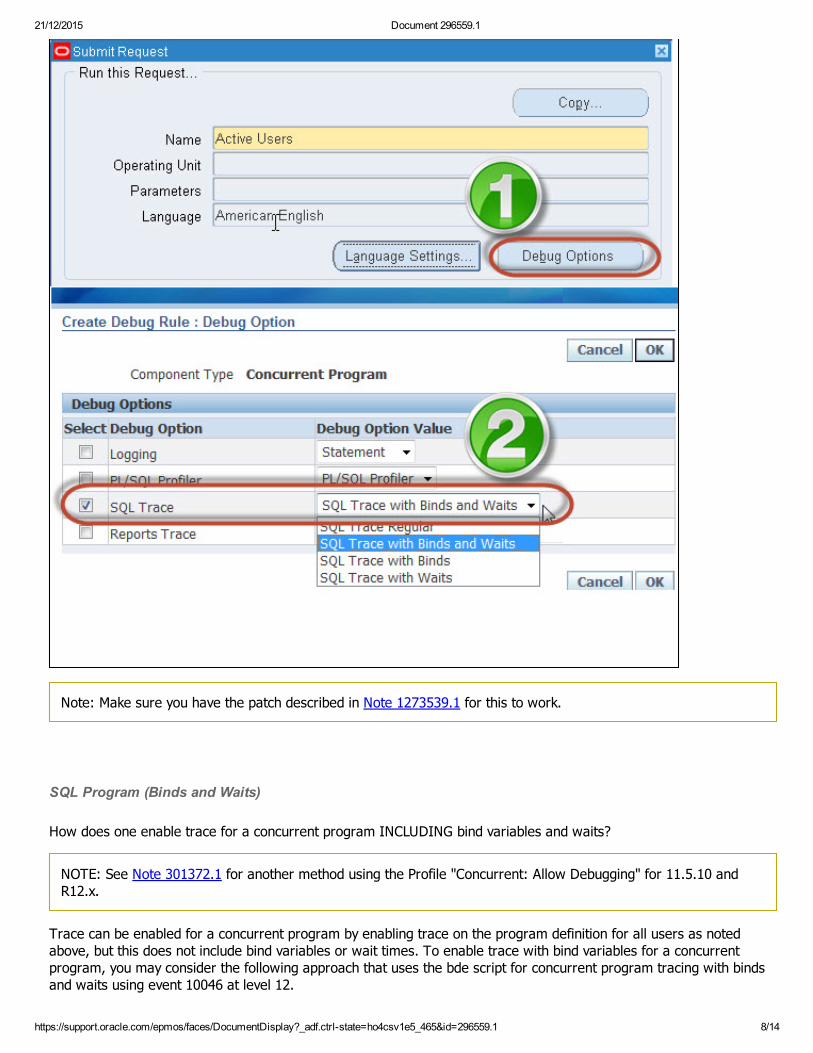
Debug Options Button! (Binds and Waits)
When submitting a concurrent program in R12.1 and higher, the concurrent program submission screen has a "DebugOptions" button where you can enable trace. The button opens a window with various SQL Tracing options includingBinds and Waits. The selection applies just to the current run of the program.
21/12/2015 Document 296559.1
https://support.oracle.com/epmos/faces/DocumentDisplay?_adf.ctrlstate=ho4csv1e5_465&id=296559.1 8/14
Note: Make sure you have the patch described in Note 1273539.1 for this to work.
SQL Program (Binds and Waits)
How does one enable trace for a concurrent program INCLUDING bind variables and waits?
NOTE: See Note 301372.1 for another method using the Profile "Concurrent: Allow Debugging" for 11.5.10 andR12.x.
Trace can be enabled for a concurrent program by enabling trace on the program definition for all users as notedabove, but this does not include bind variables or wait times. To enable trace with bind variables for a concurrentprogram, you may consider the following approach that uses the bde script for concurrent program tracing with bindsand waits using event 10046 at level 12.

21/12/2015 Document 296559.1
https://support.oracle.com/epmos/faces/DocumentDisplay?_adf.ctrlstate=ho4csv1e5_465&id=296559.1 9/14
*** This method will enable trace with binds for all new sessions and connections 1. Download and review the script, bde_system_event_10046.sql, from Note.179848.1. 2. Run the script and press enter when prompted:
SQL> bde_system_event_10046.sql
3. Return to the application 4. Execute the concurrent program 5. Monitor the program until it begins to run 6. Return to SQL*Plus and press enter to cancel tracing new programs
2c. Trace ALL user actions
How does one enable trace for all actions that occur for a user?
One can enable trace for all actions that a user takes by setting a profile option for the user. See Note 170223.1 fordetailed screen shots. This will function when the user logs into the Oracle Applications forms or when logging into theSelf Service Web Applications. This method uses an Event Trace.
The instructions for enabling the event trace follow: a. First enable trace for a specific user: Bring up the Core application System Administrator responsibility Move to Profile/System Check off the USER box and enter your username that you are using when getting the error Search on the following profile option 'Initialization SQL Statement Custom'
Please set this at the user level with the following string:
BEGIN FND_CTL.FND_SESS_CTL('','', '', 'TRUE','','ALTER SESSION SETTRACEFILE_IDENTIFIER='||''''||'4269824.999' ||''''||' EVENTS ='||''''||' 10046 TRACE NAMECONTEXT FOREVER, LEVEL 12 '||''''); END;
(Cut and paste the above sql statement into the User Level profile option: "Initialization SQL Custom") This must be one complete line of text so may be best to copy the string into notepad prior to putting it into theprofile.
b. Once the profile is set, please change responsibilities and directly go and reproduce the problem. To locate the trace file, use the following sql in sqlplus:
SQL> select name, value from v$parameter where name like 'user_dump_dest';
The value is the location of the trace file on the database server Please move to this directory and search for the file having 4269824.999 in the filename This is the trace file created please tkprof and upload BOTH the raw and tkprof trace file to My Oracle Support.
c. Ensure that the profile option is unset before exiting the Application. This is a very important step. If this is not unset, unnecessary trace files will be generated.
d. Note that a similar technique can be used for enabling trace with binds for a user in SQL*Plus. The commandswould look like the following:
SQL> ALTER SESSION SET TRACEFILE_IDENTIFIER='577' EVENTS ='10046 TRACE NAME CONTEXTFOREVER, LEVEL 12';

21/12/2015 Document 296559.1
https://support.oracle.com/epmos/faces/DocumentDisplay?_adf.ctrlstate=ho4csv1e5_465&id=296559.1 10/14
SQL> select 'x' from dual; or any SQL that you want to trace SQL> alter session set sql_trace = false;
2d. Webbased screen
How does one enable trace for a webbased screen like found in the self service applications?
You have a few options with webbased screens. You can use Diagnostics > Enable trace.
Or you can use the same method as noted above in "How does one enable trace for all actions that occur for a user?"Also review Note.245974.1, section "10. How To Generate and Retrieve Trace Files in SSA (Self Service Applications)". Section 10 discusses techniques available within Self Service for debugging and tracing.
3. Finding Trace Files?
How does one find a trace file?
Some trace files like in forms are specified when you enable and disable trace. Others are a bit trickier to identify. Inconcurrent programs for example, the user is not given the trace file number and location. It is common for people tolook for the last updated trace files or to use UNIX functions like 'grep' to parse the trace files looking for the onerelated to their concurrent program. However, the following SQL can be used to assist in identifying the trace fileassociated to a concurrent program. The SQL prompts the user for the request id and outputs the trace file name and

21/12/2015 Document 296559.1
https://support.oracle.com/epmos/faces/DocumentDisplay?_adf.ctrlstate=ho4csv1e5_465&id=296559.1 11/14
location.
Warning: Some users have pointed out that this SQL does not always point out the exact filename and location. Ona multinode database environment, the user might not know what machine to look at. Also, the construction of theactual filename may be different on your environment as this is configurable. If your filenames are configureddifferently, you may want to use number part of the filename (the process id), then search for files in your tracedirectory with the same id. A trick that may help you find the correct trace file directory is to enable trace via theApplication user using Help > Diagnostics > Trace > Trace On. This will popup a window indicating the directorywhere trace files are written.
Finally, the oracle_process_id is selected from v$process so this ID is only available during runtime of the process.It gets cleared shortly after the process terminated. Then you cannot find the trace file for a concurrent programanymore. Therefore, you should run this SQL shortly after running the concurrent program.
3a. In 11G:
This PL/SQL does not link to the Concurrent Request Id but attempts to point to the directory where trace files arelocated based on your database version:
Set Serveroutput ON
DECLARE DB_Version VARCHAR2(2);
Trace_location VARCHAR2(240); BEGIN
SELECT SUBSTR(vi.version, 1, INSTR(vi.version, '.')1) INTO DB_Version FROM v$instance vi;
IF TO_NUMBER(DB_Version) >= 11 THEN /* Following Line included as Execute Immediate as V$DIAG_INFO does not exist in DB Versions
prior to 11g */ EXECUTE IMMEDIATE 'SELECT value FROM V$DIAG_INFO WHERE NAME = ''Diag Trace''' INTO
Trace_location ; ELSE
SELECT value INTO Trace_location FROM v$parameter WHERE name = 'user_dump_dest'; END IF ;
dbms_output.put_line('Trace File should be located in the directory : '|| trace_location); END;
/
3b. Before 11G:
This SQL attempts to lookup the trace filename and location based on the request id. This is no longer accurate in 11Gand higher.
SQL>
prompt accept request prompt 'Please enter the concurrent request id for the appropriate
concurrent program:' prompt
column traceid format a8

21/12/2015 Document 296559.1
https://support.oracle.com/epmos/faces/DocumentDisplay?_adf.ctrlstate=ho4csv1e5_465&id=296559.1 12/14
column tracename format a80 column user_concurrent_program_name format a40
column execname format a15 column enable_trace format a12
set lines 80 set pages 22 set head off
SELECT 'Request id: '||request_id , 'Trace id: '||oracle_Process_id,
'Trace Flag: '||req.enable_trace, 'Trace Name:
'||dest.value||'/'||lower(dbnm.value)||'_ora_'||oracle_process_id||'.trc', 'Prog. Name: '||prog.user_concurrent_program_name,
'File Name: '||execname.execution_file_name|| execname.subroutine_name , 'Status : '||decode(phase_code,'R','Running')
||''||decode(status_code,'R','Normal'), 'SID Serial: '||ses.sid||','|| ses.serial#,
'Module : '||ses.module from fnd_concurrent_requests req, v$session ses, v$process proc,
v$parameter dest, v$parameter dbnm, fnd_concurrent_programs_vl prog, fnd_executables execname
where req.request_id = &request and req.oracle_process_id=proc.spid(+)
and proc.addr = ses.paddr(+) and dest.name='user_dump_dest' and dbnm.name='db_name'
and req.concurrent_program_id = prog.concurrent_program_id and req.program_application_id = prog.application_id
and prog.application_id = execname.application_id and prog.executable_id=execname.executable_id;
4. Other Tools
Are there any other tools that can assist in reviewing trace files (what is TraceAnalyzer)?
4a. Using TKPROF
A trace file can be reviewed using TKPROF. TKPROF reformats the raw data so that it is easier to review. The TKPROFcommands are normally run at the operating system command prompt. This will be signified with a $ as this is acommon prompt in UNIX.1. Retrieve the trace file. 2. Issue a command like the following to create a TKPROF version of the trace file. The explain option will look to seehow each query is handled by the database in terms of what tables and indexes are referenced.
$ tkprof <filename.trc> <output_filename> sys=no explain=apps/<password>
However, TKPROF does not take into account bind variables. Therefore, these are ignored in the output. When youneed to analyze bind variables, consider using TraceAnalyzer.
A handy technique when trouble shooting performance issues is to use TKPROF to look at the longest running queries. Since trace files related to performance can be huge, one might spend hours looking through the results to find thequeries causing the issue. If you sort the file by the longest running queries first, it makes it much easier toinvestigate. The following example sorts by longest running queries first with the sort options selected as

21/12/2015 Document 296559.1
https://support.oracle.com/epmos/faces/DocumentDisplay?_adf.ctrlstate=ho4csv1e5_465&id=296559.1 13/14
"sort='(prsela,exeela,fchela)'" and limits the results to the "Top 10" long running queries with the "print=10"command:
$ tkprof <filename.trc> <output_filename> sys=no explain=apps/<password> sort='(prsela,exeela,fchela)' print=10
4b. Using TraceAnalyzer
Please refer to Note 224270.1: Trace Analyzer
TraceAnalyzer reformats the raw data so that it is easier to review. It is a more powerful tool than TKPROF. Ittranslates things like bind variables and make them easy to find.
1. Download TraceAnalyzer from Note 224270.12. Install trace analyzer in SQL:
SQL> start TRCACREA.sql
3. Retrieve the trace file. 4. In SQL*Plus, issue a command like the following to create a TraceAnalyzer version of the trace file:
SQL> start TRCANLZR.sql UDUMP vis015_ora_22854.trc
4c. SQLT
Please refer to Note 215187.1 for details on SQLTXPLAIN (SQLT).
4d. RDA
Is RDA Another technique for finding / supplying trace files?
Check out the RDA output that can grab the last trace file and you could then upload the RDA to the Service Request.
Note 559800.1 How To Run Application Collection Tool (ACT/RDA) Diagnostics Test?
... 4e. AWR
See Note 748642.1 What is AWR( Automatic workload repository ) and How to generate the AWR report?
4. Before 11i?
Will these techniques work in previous versions before 11i (For example, 10.7 and 11.0.3)?
Many of the same techniques will work in previous versions of the Oracle Applications. However, there are somelimitations for example, in 10.7 and 11.0.3, the application did not indicate the trace file name when a user enabledtrace using Help > Diagnostics > Trace. Also, the previous versions of the application did not allow for the user toenable trace with binds using the Help > Diagnostics navigation path.
See also : Note 171647.1 Tracing Oracle Applications using Event 10046 in 10.7, 11.0, and 11i
https://support.oracle.com/epmos/faces/DocumentDisplay?parent=DOCUMENT&sourceId=296559.1&id=224270.1
https://support.oracle.com/epmos/faces/DocumentDisplay?parent=DOCUMENT&sourceId=296559.1&id=224270.1
https://support.oracle.com/epmos/faces/DocumentDisplay?parent=DOCUMENT&sourceId=296559.1&id=215187.1
https://support.oracle.com/epmos/faces/DocumentDisplay?parent=DOCUMENT&sourceId=296559.1&id=559800.1

21/12/2015 Document 296559.1
https://support.oracle.com/epmos/faces/DocumentDisplay?_adf.ctrlstate=ho4csv1e5_465&id=296559.1 14/14
5. Tracing API Calls
See Note 869386.1.
REFERENCES
NOTE:115698.1:117129.1 NOTE:130182.1:142898.1 NOTE:179848.1:224270.1 NOTE:1007808.6:100964.1 NOTE:76338.1:869386.1 NOTE:245974.1:279132.1 NOTE:301372.1:38018.1
Didn't find what you are looking for?
Related Documents


![Joxean Koret - Hackproofing Oracle Financials 11i & R12 [RootedCON 2010]](https://static.cupdf.com/doc/110x72/5483e8dbb07959380c8b4a44/joxean-koret-hackproofing-oracle-financials-11i-r12-rootedcon-2010.jpg)