Oracle Applications Cloud Creating and Administering Analytics and Reports 21C

Welcome message from author
This document is posted to help you gain knowledge. Please leave a comment to let me know what you think about it! Share it to your friends and learn new things together.
Transcript
Oracle ApplicationsCloud
Creating and AdministeringAnalytics and Reports
21C

Oracle Applications CloudCreating and Administering Analytics and Reports
21CPart Number F42724-02Copyright © 2011, 2021, Oracle and/or its affiliates.
Authors: Dan Hilldale, Essan Ni Jirman
This software and related documentation are provided under a license agreement containing restrictions on use and disclosure and are protectedby intellectual property laws. Except as expressly permitted in your license agreement or allowed by law, you may not use, copy, reproduce, translate,broadcast, modify, license, transmit, distribute, exhibit, perform, publish, or display any part, in any form, or by any means. Reverse engineering,disassembly, or decompilation of this software, unless required by law for interoperability, is prohibited.
The information contained herein is subject to change without notice and is not warranted to be error-free. If you find any errors, please reportthem to us in writing.
If this is software or related documentation that is delivered to the U.S. Government or anyone licensing it on behalf of the U.S. Government, thenthe following notice is applicable:
U.S. GOVERNMENT END USERS: Oracle programs (including any operating system, integrated software, any programs embedded, installed oractivated on delivered hardware, and modifications of such programs) and Oracle computer documentation or other Oracle data delivered to oraccessed by U.S. Government end users are "commercial computer software" or "commercial computer software documentation" pursuant to theapplicable Federal Acquisition Regulation and agency-specific supplemental regulations. As such, the use, reproduction, duplication, release, display,disclosure, modification, preparation of derivative works, and/or adaptation of i) Oracle programs (including any operating system, integratedsoftware, any programs embedded, installed or activated on delivered hardware, and modifications of such programs), ii) Oracle computerdocumentation and/or iii) other Oracle data, is subject to the rights and limitations specified in the license contained in the applicable contract. Theterms governing the U.S. Government's use of Oracle cloud services are defined by the applicable contract for such services. No other rights aregranted to the U.S. Government.
This software or hardware is developed for general use in a variety of information management applications. It is not developed or intended foruse in any inherently dangerous applications, including applications that may create a risk of personal injury. If you use this software or hardwarein dangerous applications, then you shall be responsible to take all appropriate fail-safe, backup, redundancy, and other measures to ensure its safeuse. Oracle Corporation and its affiliates disclaim any liability for any damages caused by use of this software or hardware in dangerous applications.
Oracle and Java are registered trademarks of Oracle and/or its affiliates. Other names may be trademarks of their respective owners.
Intel and Intel Inside are trademarks or registered trademarks of Intel Corporation. All SPARC trademarks are used under license and are trademarksor registered trademarks of SPARC International, Inc. AMD, Epyc, and the AMD logo are trademarks or registered trademarks of Advanced MicroDevices. UNIX is a registered trademark of The Open Group.
This software or hardware and documentation may provide access to or information about content, products, and services from third parties. OracleCorporation and its affiliates are not responsible for and expressly disclaim all warranties of any kind with respect to third-party content, products, andservices unless otherwise set forth in an applicable agreement between you and Oracle. Oracle Corporation and its affiliates will not be responsiblefor any loss, costs, or damages incurred due to your access to or use of third-party content, products, or services, except as set forth in an applicableagreement between you and Oracle.
The business names used in this documentation are fictitious, and are not intended to identify any real companies currently or previously in existence.
Oracle Applications CloudCreating and Administering Analytics and Reports
Contents
Preface i
1 Overview 1About This Guide ........................................................................................................................................................................... 1
Overview of Transactional Business Intelligence .................................................................................................................... 1
More About Oracle Business Intelligence Components ....................................................................................................... 3
View Analytics, Reports, and Dashboards ............................................................................................................................... 4
How You Use the Analytics Page .............................................................................................................................................. 6
Where to Save Analytics and Reports ...................................................................................................................................... 6
FAQs for Overview ........................................................................................................................................................................ 7
2 Setup and Configuration 9Overview of Setup and Configuration ..................................................................................................................................... 9
Map to Work Areas ....................................................................................................................................................................... 9
Set Up Currency .......................................................................................................................................................................... 10
Configure Business Intelligence Publisher ............................................................................................................................. 15
Set Up the Delivery Channel .................................................................................................................................................... 23
Configure Deep Links ................................................................................................................................................................ 28
FAQs for Deep Links .................................................................................................................................................................. 30
Embed Analyses and Dashboards ........................................................................................................................................... 31
3 Subject Areas 33How Data Is Structured for Analytics ..................................................................................................................................... 33
4 Flexfields 35Overview of Flexfield Use in Analyses ................................................................................................................................... 35
Configure Key Flexfields for Transactional Business Intelligence .................................................................................... 35
Configure Descriptive Flexfields for Transactional Business Intelligence ....................................................................... 41
Configure Extensible Flexfields for Transactional Business Intelligence ........................................................................ 42
Import Changes to Flexfields Automatically ........................................................................................................................ 44
Disable Flexfields as BI-Enabled ............................................................................................................................................. 45
Repository and Session Variables for Business Intelligence ............................................................................................. 47
Oracle Applications CloudCreating and Administering Analytics and Reports
5 OTBI Analytics and Dashboards Modification 49Create and Modify Analyses and Dashboards ..................................................................................................................... 49
Analyses ........................................................................................................................................................................................ 49
Cross-Subject Area Joins .......................................................................................................................................................... 53
Dashboards .................................................................................................................................................................................. 54
FAQs for Analyses and Dashboards ....................................................................................................................................... 55
6 Infolets 57Overview of Infolets ................................................................................................................................................................... 57
Personalize Infolets ..................................................................................................................................................................... 57
Configure Infolets ....................................................................................................................................................................... 58
FAQs for Infolets ......................................................................................................................................................................... 62
7 Reports Modification 65Overview of Business Intelligence Publisher ........................................................................................................................ 65
Style Templates ........................................................................................................................................................................... 65
Subtemplates ............................................................................................................................................................................... 66
How You Create and Edit Reports .......................................................................................................................................... 67
How You Access and Modify Report Components ............................................................................................................. 68
How You Modify Copies of Predefined Reports .................................................................................................................. 69
How Links Between Original and Modified Reports Are Managed ................................................................................. 70
Layouts ........................................................................................................................................................................................... 71
Data Models ................................................................................................................................................................................. 77
New Reports ................................................................................................................................................................................ 84
Configurable Workflow Notifications ..................................................................................................................................... 84
8 OTBI Analytics and Reports Management 97Manage OTBI Folders ................................................................................................................................................................ 97
Briefing Books ............................................................................................................................................................................ 103
Schedule Analytics and Reports ............................................................................................................................................ 104
9 Maintenance and Migration 111Performance Tuning ................................................................................................................................................................... 111
Localize Catalog Objects .......................................................................................................................................................... 116
Migration ...................................................................................................................................................................................... 117
Common Issues .......................................................................................................................................................................... 118
Oracle Applications CloudCreating and Administering Analytics and Reports
Preface
i
PrefaceThis preface introduces information sources that can help you use the application.
Using Oracle Applications
HelpUse help icons to access help in the application. If you don't see any help icons on your page, click your user imageor name in the global header and select Show Help Icons. Not all pages have help icons.
If you don't see Show Help Icons in the Settings and Actions menu, you can access the Oracle Help Center to findguides and videos.
Watch: This video tutorial shows you how to find and use help.
You can also read about it instead.
Additional Resources
• Community: Use Oracle Cloud Customer Connect to get information from experts at Oracle, the partnercommunity, and other users.
• Training: Take courses on Oracle Cloud from Oracle University.
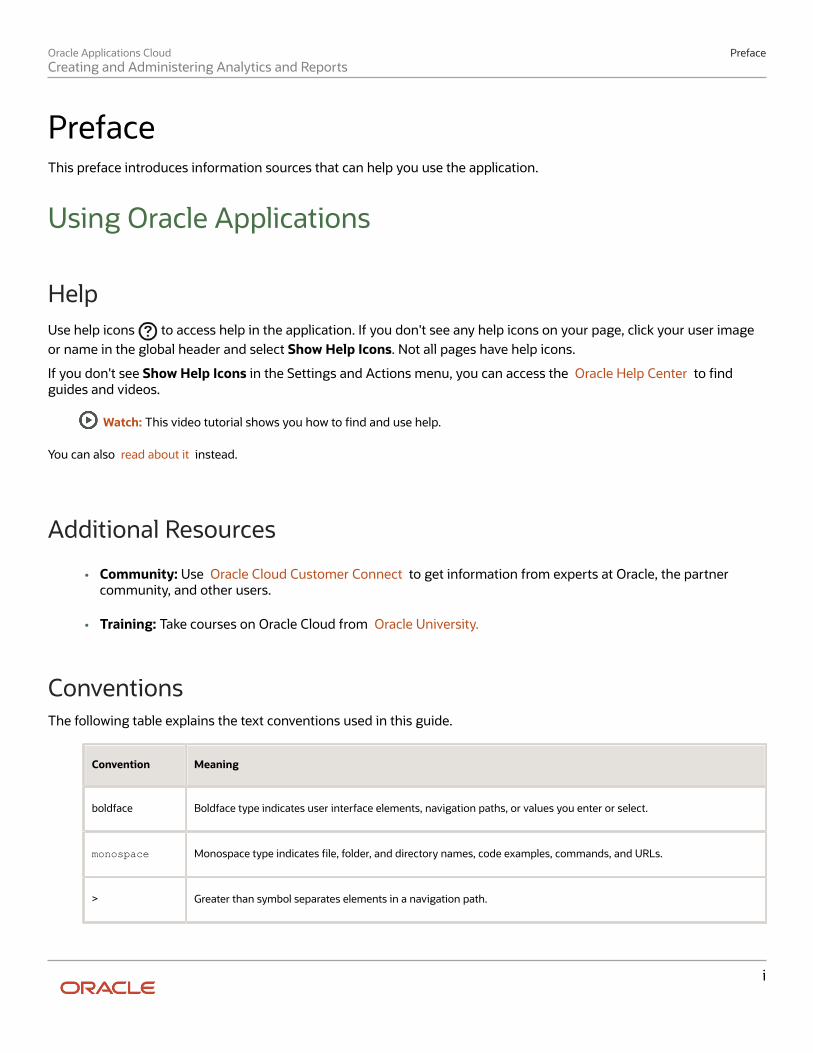
ConventionsThe following table explains the text conventions used in this guide.
Convention Meaning
boldface Boldface type indicates user interface elements, navigation paths, or values you enter or select.
monospace Monospace type indicates file, folder, and directory names, code examples, commands, and URLs.
> Greater than symbol separates elements in a navigation path.
Oracle Applications CloudCreating and Administering Analytics and Reports
Preface
ii
Documentation AccessibilityFor information about Oracle's commitment to accessibility, visit the Oracle Accessibility Program website.
Videos included in this guide are provided as a media alternative for text-based help topics also available in this guide.
Diversity and InclusionOracle is fully committed to diversity and inclusion. Oracle respects and values having a diverse workforce that increasesthought leadership and innovation. As part of our initiative to build a more inclusive culture that positively impacts ouremployees, customers, and partners, we're working to remove insensitive terms from our products and documentation.We're also mindful of the necessity to maintain compatibility with our customers' existing technologies and the need toensure continuity of service as Oracle's offerings and industry standards evolve. Because of these technical constraints,our effort to remove insensitive terms is ongoing and will take time and external cooperation.
Contacting Oracle
Access to Oracle SupportOracle customers that have purchased support have access to electronic support through My Oracle Support. Forinformation, visit My Oracle Support or visit Oracle Accessibility Learning and Support if you are hearing impaired.
Comments and SuggestionsPlease give us feedback about Oracle Applications Help and guides! You can send an e-mail to:[email protected].
Oracle Applications CloudCreating and Administering Analytics and Reports
Chapter 1Overview
1
1 Overview
About This GuideIf you administer, modify, maintain, set up, or secure business intelligence (BI) reports, analytics, and dashboards, thisguide is for you. Here are some examples of what the guide covers.
• Set up BI components
• Manage the BI catalog, where reports and dashboards are organized and stored
• Make copies of predefined analyses, reports, and dashboards in the BI catalog and refine them
• Create your own analytics, reports, and dashboards
• Migrate analytics, reports, and dashboards
This guide doesn't cover everything for all product families. For product-specific tasks and examples, see the Creatingand Administering Analytics and Reports guide for your family.
Overview of Transactional Business IntelligenceYou use Oracle Transactional Business Intelligence (OTBI) to analyze your business and take action with embedded andad-hoc analysis of your transactional data. Key metrics and attributes of your business and organization are organizedinto subject areas of data you use as building blocks to answer your business questions.
• Use embedded analyses and reports to gain insights and report on key business metrics
• Build ad-hoc analyses, reports, and dashboards.
• Create business intelligence (BI) catalog folders and define who has access to what in the catalog.
• Organize your analytics in dashboards and embed them in your work areas.
ArchitectureOTBI uses Oracle Business Intelligence Enterprise Edition (OBIEE) with integration to Application DevelopmentFramework (ADF) to run your real-time analysis of your business subject areas.
The BI Server creates physical queries based on metadata mappings between the subject areas you work with in youranalysis and ADF view objects and their underlying database tables. The BI Presentation Server compiles and formatsthe results in the BI client or as embedded analytics.
Oracle Applications CloudCreating and Administering Analytics and Reports
Chapter 1Overview
2
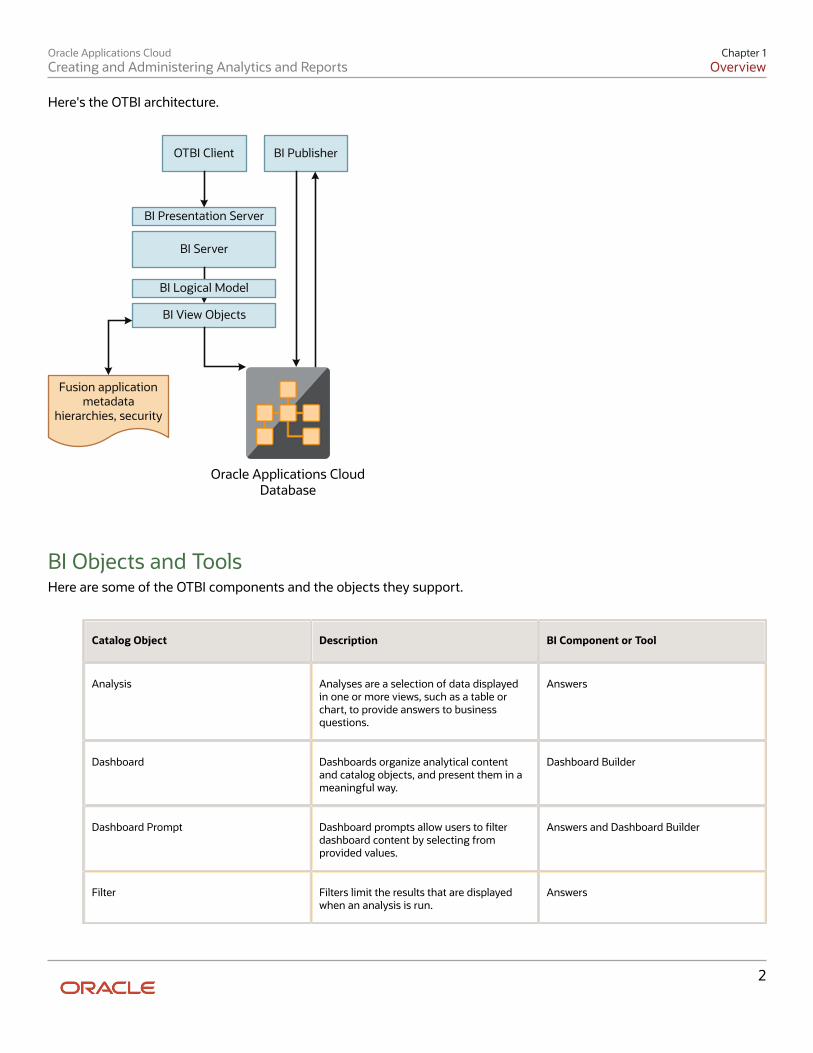
Here's the OTBI architecture.
BI Presentation Server
OTBI Client
BI Server
BI Logical Model
BI View Objects
BI Publisher
Fusion application metadata
hierarchies, security
Oracle Applications Cloud Database
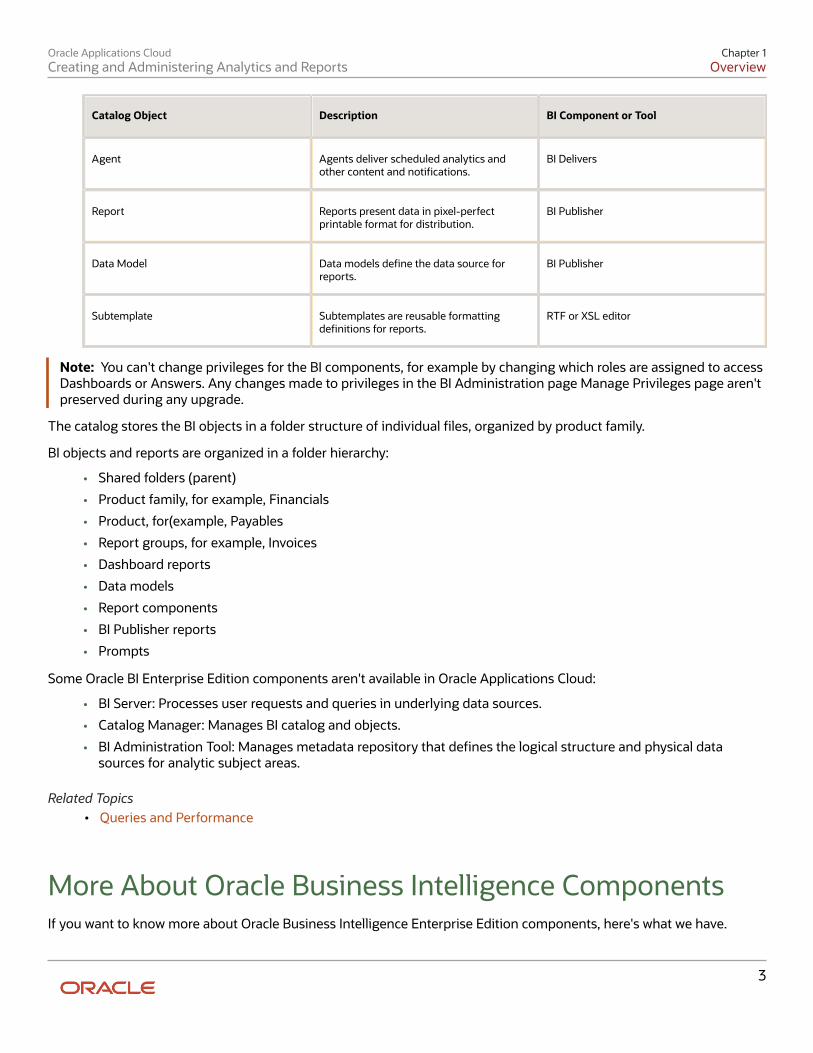
BI Objects and ToolsHere are some of the OTBI components and the objects they support.
Catalog Object Description BI Component or Tool
Analysis Analyses are a selection of data displayedin one or more views, such as a table orchart, to provide answers to businessquestions.
Answers
Dashboard Dashboards organize analytical contentand catalog objects, and present them in ameaningful way.
Dashboard Builder
Dashboard Prompt Dashboard prompts allow users to filterdashboard content by selecting fromprovided values.
Answers and Dashboard Builder
Filter Filters limit the results that are displayedwhen an analysis is run.
Answers
Oracle Applications CloudCreating and Administering Analytics and Reports
Chapter 1Overview
3
Catalog Object Description BI Component or Tool
Agent Agents deliver scheduled analytics andother content and notifications.
BI Delivers
Report Reports present data in pixel-perfectprintable format for distribution.
BI Publisher
Data Model Data models define the data source forreports.
BI Publisher
Subtemplate Subtemplates are reusable formattingdefinitions for reports.
RTF or XSL editor
Note: You can't change privileges for the BI components, for example by changing which roles are assigned to accessDashboards or Answers. Any changes made to privileges in the BI Administration page Manage Privileges page aren'tpreserved during any upgrade.
The catalog stores the BI objects in a folder structure of individual files, organized by product family.
BI objects and reports are organized in a folder hierarchy:
• Shared folders (parent)
• Product family, for example, Financials
• Product, for(example, Payables
• Report groups, for example, Invoices
• Dashboard reports
• Data models
• Report components
• BI Publisher reports
• Prompts
Some Oracle BI Enterprise Edition components aren't available in Oracle Applications Cloud:
• BI Server: Processes user requests and queries in underlying data sources.
• Catalog Manager: Manages BI catalog and objects.
• BI Administration Tool: Manages metadata repository that defines the logical structure and physical datasources for analytic subject areas.
Related Topics• Queries and Performance
More About Oracle Business Intelligence ComponentsIf you want to know more about Oracle Business Intelligence Enterprise Edition components, here's what we have.
Oracle Applications CloudCreating and Administering Analytics and Reports
Chapter 1Overview
4
Oracle Business Intelligence Enterprise EditionHere's the information about the parts of Oracle BI Enterprise Edition that support analysis against your transactionaldata.
• Create and work with analyses, dashboards, and advanced analytical content, including dashboard prompts,conditions, actions, and key performance indicators.See: Oracle Fusion Middleware User's Guide for Oracle Business Intelligence Enterprise Edition
Oracle Business Intelligence PublisherBI Publisher is the part of Oracle BI Enterprise Edition you use for reports.
• Run and view reports.See: Oracle Fusion Middleware User's Guide for Oracle Business Intelligence Publisher
• Create and edit reports, layouts, templates, and subtemplates.See: Oracle Fusion Middleware Report Designer's Guide for Oracle Business Intelligence Publisher
• Create and modify data models.See: Oracle Fusion Middleware Data Modeling Guide for Oracle Business Intelligence Publisher
View Analytics, Reports, and DashboardsWatch video
There are different ways to view and work with your analytics and reports. You can view analyses, dashboards, andreports in the course of your work, on your usual pages and infolets. Or you can find them in the business intelligencecatalog with the Reports and Analytics work area and the Reports and Analytics panel tab.
View Analytics in InfoletsUse your favorite infolet pages to find analytics.
1. Use the page controls and Previous and Next icons to explore infolet pages in the home page, where they mayappear in infolets with summaries and aggregations or performance metrics. You may also find infolets in somework areas.
2. Click an infolet to open a detailed analysis. So for example, if an infolet has transactions summed to a total, clickit to view details of the underlying transactions.
3. Click Done.
View Objects in Familiar Work Areas and PagesUse analyses, dashboards, and reports available in your usual pages and work areas.
1. Explore your pages. Some may include analysis and report links or embedded objects, sometimes in tabs orpanel tabs.
Oracle Applications CloudCreating and Administering Analytics and Reports
Chapter 1Overview
5
2. Some work areas have a Reports and Analytics panel tab, where you explore catalog folders for relevantanalyses and reports for the work area. And if you have permission, you can map more objects to the work areaif they're appropriate.
a. Open the panel tab.b. Expand the Shared Reports and Analytics folder and explore the available content.c. Click the link for any object and see its type to determine whether it's an analysis, a report, or a
dashboard.d. Click View to open the object.
View Objects in the Reports and Analytics Work AreaUse the Reports and Analytics work area to search or browse the catalog and view any analysis, dashboard, or reportyou have access to. It opens at the highest level of the catalog's folder hierarchy with all objects you have marked asfavorites.
Here are some things you can do in the Reports and Analytics work area.
1. Click Navigator > Tools > Reports and Analytics.2. Filter and search for objects:
a. From the Filter list, select what you want to find.b. To view objects you have marked as favorites, select Favorites in the list. Or select Recent Items to view
objects you recently worked with, or a recent search to run it again. Enter a name or part of a name andclick the Search icon.
c. In the search results, use the icons to identify what the objects are.d. Click the name of an object to open it, or click More and select an action.
3. In the breadcrumbs, browse the catalog folders for analytics and reports. Click any Hierarchical Selector iconto select a different node for the next level in the hierarchy.
4. Mark objects as favorites.
◦ Select Favorites in the Saved Searches to display your favorite objects.
◦ Click the Add Favorites icon for an object to mark it as a favorite.
◦ Click the Remove from Favorites icon to remove an object from your favorites.
5. Create and edit analyses and reports.
a. Click Create and select Report or Analysis.b. Use wizards to create your analysis or report.
6. Click the Browse Catalog button (or click the More icon for a specific report, dashboard, or analysis) to usemore features.
View AnalysesAn analysis queries against your company's data and answers business questions with visualizations, such as chartsand tables. They may appear on your pages, or as parts of a dashboard.
1. From the catalog folders or search results, open an analysis to view.2. Click Refresh to rerun the analysis and refresh its data.3. Click Print and select either Printable PDF or Printable HTML to open a printable version.4. Click Export to get analysis data in various formats, for example PDF, Excel, PowerPoint, comma-separated
value (CSV), and XML.
Oracle Applications CloudCreating and Administering Analytics and Reports
Chapter 1Overview
6
Note: When you export data in a CSV format, dates are exported in raw format and converted toUTC time zone.
View Grouped Analyses in DashboardsSome analyses are grouped in dashboards to give you meaningful related information. A dashboard contains pages ofanalyses, prompts that filter information, and other objects.
1. From the catalog folders or search results, open a dashboard to view.2. Select values for any dashboard prompts to filter the dashboard.3. Click Apply to refine the results of all of the analyses in the dashboard.
View ReportsReports show data in a predefined format that's optimized for printing.
1. From the catalog folders or search results, open a report.2. Click the View Report icon if you want a different format.
◦ Choose HTML or PDF to display the report in a format for printing. Because it's optimized for printing,PDF often provides the best results.
◦ You can also export the report as RTF for editing in a word processor, or as Excel or PowerPoint.
3. From the catalog folders or search results, you can also do these tasks:
◦ Click Edit to edit the report properties, layout, and data model.
◦ Click Report History to see details about past submissions of the report.
◦ Click Schedule to schedule the report to be run.
How You Use the Analytics PageThe Analytics page shows up to five of your favorite analyses for easy access. To add an analytic to your page, searchfor it in the panel tab and mark it as a favorite so that it's shown each time you navigate to the page.
• The Analytics page is available only for some product families. See the Analyze and Report page for these cloudservices in the Oracle Help Center (http://docs.oracle.com).
◦ CX Sales
See: CX Sales Reports and Analytics
◦ Human Capital Management
See: Global Human Resources Reports and Analytics
• On these Help Center pages, you can review lists of predefined analytics that you might be able to add to yourAnalytics page. You can also find guides and other resources for using and creating analytics and reports.
Oracle Applications CloudCreating and Administering Analytics and Reports
Chapter 1Overview
7
Where to Save Analytics and ReportsYou save analyses, dashboards, and reports in the catalog, along with other objects like prompts and filters. Besides thehierarchy of folders organized by product family, another important folder is Custom, found in Shared Folders. This iswhere you save the analytics and reports you create or edit for others to use.
Shared Folders and the Custom SubfolderAnyone with the correct access can get to objects stored in Shared Folders. If you have the appropriate roles, youcan save in Shared Folders so that your objects are available for other users. You should save objects in the Customsubfolder, and use the product family subfolders to organize and publish analytics and objects for the correct audiences.
Here are a few things to know while working with analytics in the catalog. Keep all modified analyses and reports inthe Custom folder. Directly edit predefined analytics only when it's necessary to make sure that any references to theanalysis or dashboard still work properly.
• Preserve modified predefined objects during updates, which can make changes to predefined analytics,reports, and other objects outside the Custom folder. You might lose changes saved outside the Custom folderduring updates.
• You can easily find modified objects if they're not spread around the catalog.
• You can edit objects in the Custom folder without compromising security on the original objects.
• For predefined reports only, you can use a special Customize option to copy the report and also the folderstructure and permissions. The copy is linked to the original, so editing the copy is like directly editing theoriginal.
When you copy an object into the Custom folder, the copied object inherits the permission settings of the Customfolder. An administrator can reset the permissions on the object and the folder that it's in.
Note: When you create folders in the catalog, don't use special characters (~, !, #, $, %, ^, &, *, +, `, |, :, ", \\, <, >, ?, ,, /)in their names.
My FoldersMy Folders is your personal storage; you're the only one who can access anything that you save there. What you savethere is available in the Reports and Analytics work area, but not in My Folders in the Reports and Analytics panel tab onany other work area. But an exception is when you create an analysis using the wizard in the Reports and Analytics workarea. If you save a wizard analysis in My Folders, it's available in any panel tab that appears in any work area.
Note: Don't store analyses or reports in the predefined Temp folder in My Folders. That folder is used by BI Publisherand purged automatically every 24 hours.
Related Topics
• How You Create and Edit Reports
• Create and Modify Analyses and Dashboards
• How You Modify Copies of Predefined Reports
Oracle Applications CloudCreating and Administering Analytics and Reports
Chapter 1Overview
8
FAQs for Overview
Do I need to create copies of predefined reports and analyses foreach user?No, you don't need to create multiple versions of the same analysis or report for different users. When you view anobject, it includes only the data that you have permission to view from your data security profile.
What happens to modified analytics and reports when a releaseupdate is applied?Updates don't affect the Custom folder or My Folder in the catalog. Anything saved there is preserved, including theanalytics and reports you edited or created. But anything saved outside those folders, in the predefined catalog, ispreserved only if the update doesn't include a new version of those BI objects.
If an update includes a new version of a predefined object that you edited outside the Custom folder, the changes youmade are saved as a new object. The new version from the update overwrites the existing predefined object. And a copyof the existing object (with your edits) is automatically created in the same folder, with a new name that indicates it's anew version.
If the update includes a new version of both the predefined object and a folder in its file path, the new folder name,along with the new version of the object, overwrites the existing predefined folder and object. And a copy of the existingfolder (along with your edited object) is automatically created. The folder is renamed to indicate that it's a new version,but your edited object isn't renamed.
Note: Future updates won't affect renamed objects or anything within a renamed folder.
Oracle Applications CloudCreating and Administering Analytics and Reports
Chapter 2Setup and Configuration
9
2 Setup and Configuration
Overview of Setup and Configuration
Tools for Administering Analyses and ReportsYou can use several different tools to manage and administer your analytics. Analytics can be reports or analyses,depending on how you intend to display and distribute them.
These components support modification and administration of your analyses and reports:
• Use the Business Intelligence catalog to interact directly with your reports and analyses. Use this interface tomanage permissions, properties, and the organization of your analyses and reports.
• Use the Oracle Business Intelligence Publisher administration pages to configure settings specific to therunning and scheduling of operational reports, such as setting up your delivery servers, managing schedulerwork load, and setting run-time properties for reports.
Map to Work Areas
Set Up the Reports and Analytics Panel TabThe Reports and Analytics panel tab appears in many work areas, and shows analytics and reports related to the workareas. You map and unmap the objects for a specific work area from the business intelligence (BI) catalog. Your changesapply to all users who have access to the work area you're mapping.
Map and Remove Objects from Your Work Area1. Expand the Reports and Analytics panel tab.2. Click the Edit Settings icon.
You see all the analytics and reports that are currently mapped to your work area.3. Click Select and Add.4. Select the object in the catalog.5. Click OK.6. To remove any mapping, select the object and click Remove.7. Click Save.
Map and Remove Objects from Any Work Area1. In the Setup and Maintenance work area, go to the Map Reports to Work Areas task.2. Select the application of the work area you want to map to.3. Select the work area.4. Click Search and see all the reports that are currently mapped to that work area.5. Click Select and Add.
Oracle Applications CloudCreating and Administering Analytics and Reports
Chapter 2Setup and Configuration
10
6. Select the object in the catalog.7. Click OK.8. To remove any mapping, select the object and click Remove.
Tip: Click Synchronize to remove all mappings to any objects that are no longer in the catalog. Yousynchronize all work areas, not just the one you're mapping.
9. Click Save.
Related Topics
• Update Existing Setup Data
• Set Up Reports for Scheduling
Why can't I see reports when mapping reports to work areas forthe Reports and Analytics panel tab?Either no reports are currently mapped to the work area you select on the Map Reports to Work Areas page, or you don'thave access to the reports that are mapped.
Similarly, when you're selecting a report to map, you can see only the reports that you have access to. Ask youradministrator to either:
• Assign you roles that have access to the reports you want to map to work areas.
• Grant the Reports and Analytics Region Administration Duty to someone who already has access to thosereports.
Why can't I see analytics and reports when I edit settings for theReports and Analytics panel tab?In the Edit Settings window, you might not see a currently mapped report because you don't have access to it.
Similarly, when you're selecting an object to map, you can only see objects you have access to. Your administrator cangrant access to the objects or let someone with access map them.
• Assign you roles with access to the objects you want to map.
• Grant the Reports and Analytics Region Administration Duty to someone who already has access to the objects.
Set Up Currency
Currency and Exchange Rate Settings for AnalyticsCX Sales applications let you to decide how currency is shown in the application, as well as preferences for how analyticsshow currency and calculate exchange rates. Currency can be set in different regional currency types, depending onwhere you do business and what currency types you want to see.
Oracle Applications CloudCreating and Administering Analytics and Reports
Chapter 2Setup and Configuration
11
There are three ways you set up currency:
• User Currency - Set by the business user in Regional settings. This setting applies to the entire applicationinterface for that user only. The available currency options are set by your application administrator.
• Analytics Currency - Set by the business user in BI in My Account settings in the Reports area. The settingapplies to that user only and is only relevant for analyses.
• Corporate Currency - Set by the application administrator. This setting applies to all users in that company.
Note: The time zone preferences that you set in your fuse simplified user interface are inherited in OTBI and will beused as the time zone setting for your existing and new analytics.
Set General User CurrencyUser currency settings determine the currency used as the default for what you see in your application. User currencyapplies to your entire interface for your signed-in session.
1. Navigate to Tools, Set Preferences.2. Select General Preferences > Regional.3. Select the preferred currency to be used. Available currencies include those set up for your company by your
application administrator.
Set Analytics CurrencyThe analytics currency settings determine the currency type that's displayed in all your analytics. It also determines howand when your currency conversion rates are calculated.
1. Navigate to Business Intelligence.2. Click Analytics in the navigator menu.3. Click Browse Catalog.4. Click your user name and select My Account.5. Go to the Preference.6. Select your choice in Currency.
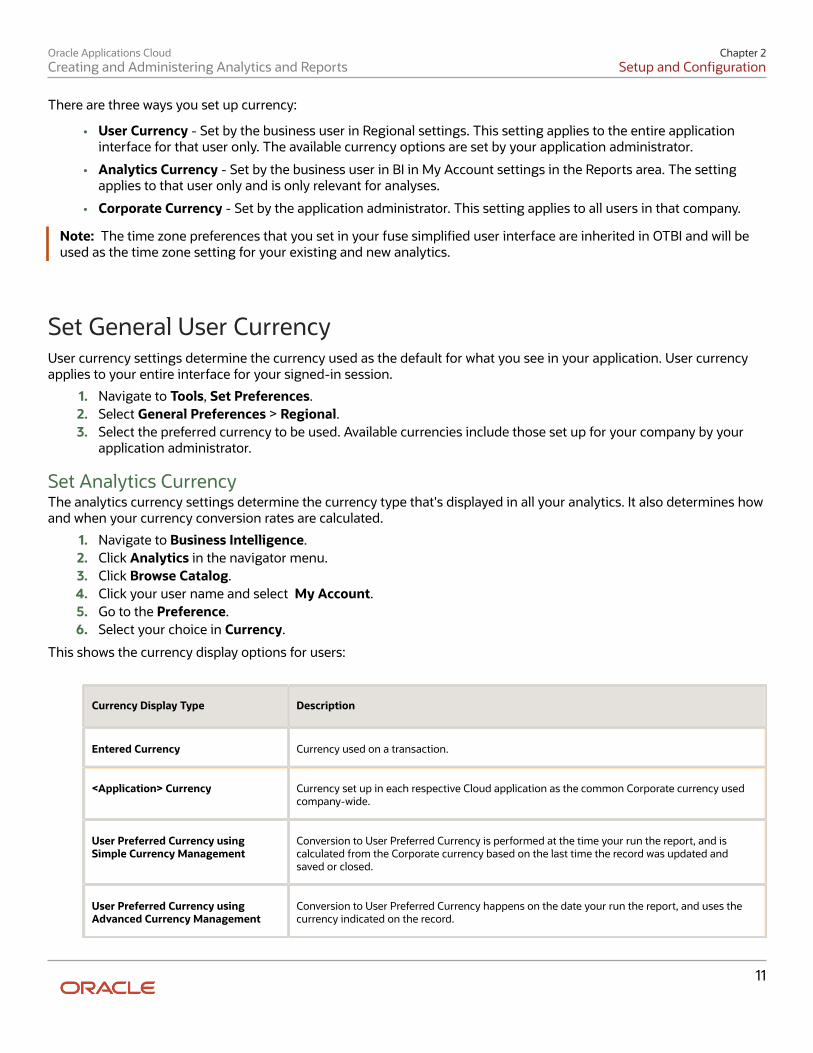
This shows the currency display options for users:
Currency Display Type Description
Entered Currency Currency used on a transaction.
<Application> Currency Currency set up in each respective Cloud application as the common Corporate currency usedcompany-wide.
User Preferred Currency usingSimple Currency Management
Conversion to User Preferred Currency is performed at the time your run the report, and iscalculated from the Corporate currency based on the last time the record was updated andsaved or closed.
User Preferred Currency usingAdvanced Currency Management
Conversion to User Preferred Currency happens on the date your run the report, and uses thecurrency indicated on the record.
Oracle Applications CloudCreating and Administering Analytics and Reports
Chapter 2Setup and Configuration
12
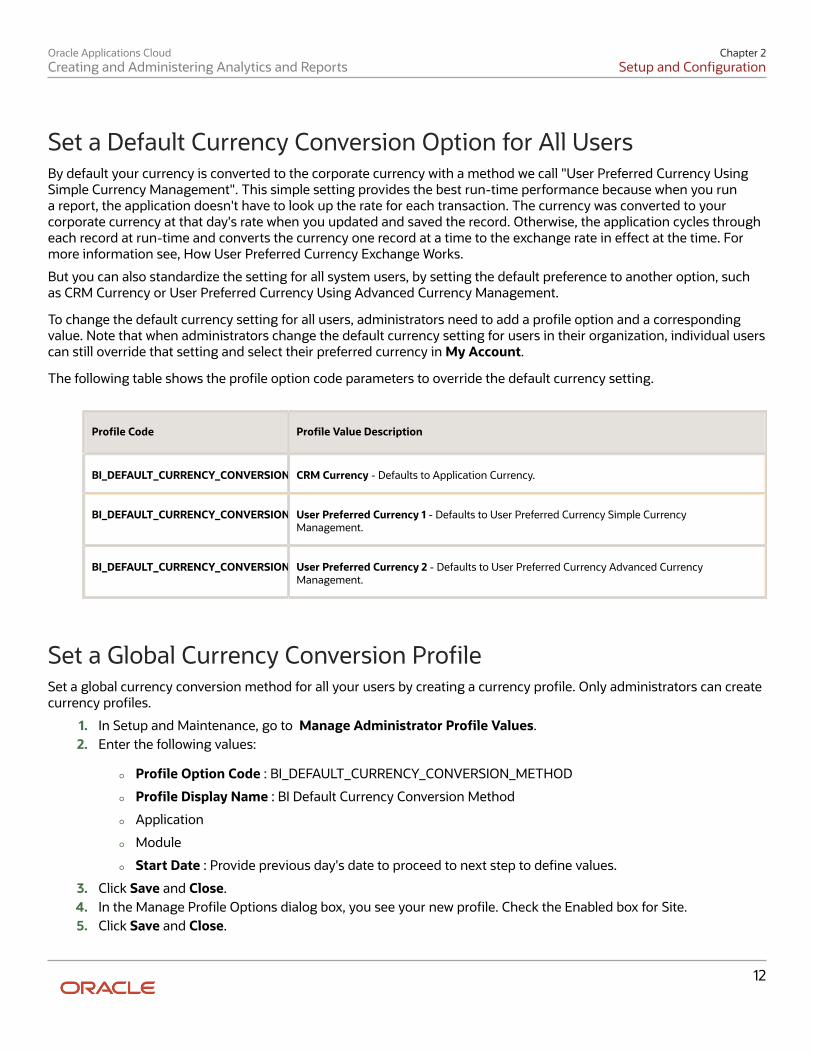
Set a Default Currency Conversion Option for All UsersBy default your currency is converted to the corporate currency with a method we call "User Preferred Currency UsingSimple Currency Management". This simple setting provides the best run-time performance because when you runa report, the application doesn't have to look up the rate for each transaction. The currency was converted to yourcorporate currency at that day's rate when you updated and saved the record. Otherwise, the application cycles througheach record at run-time and converts the currency one record at a time to the exchange rate in effect at the time. Formore information see, How User Preferred Currency Exchange Works.
But you can also standardize the setting for all system users, by setting the default preference to another option, suchas CRM Currency or User Preferred Currency Using Advanced Currency Management.
To change the default currency setting for all users, administrators need to add a profile option and a correspondingvalue. Note that when administrators change the default currency setting for users in their organization, individual userscan still override that setting and select their preferred currency in My Account.
The following table shows the profile option code parameters to override the default currency setting.
Profile Code Profile Value Description
BI_DEFAULT_CURRENCY_CONVERSION_METHODCRM Currency - Defaults to Application Currency.
BI_DEFAULT_CURRENCY_CONVERSION_METHODUser Preferred Currency 1 - Defaults to User Preferred Currency Simple CurrencyManagement.
BI_DEFAULT_CURRENCY_CONVERSION_METHODUser Preferred Currency 2 - Defaults to User Preferred Currency Advanced CurrencyManagement.
Set a Global Currency Conversion ProfileSet a global currency conversion method for all your users by creating a currency profile. Only administrators can createcurrency profiles.
1. In Setup and Maintenance, go to Manage Administrator Profile Values.2. Enter the following values:
◦ Profile Option Code : BI_DEFAULT_CURRENCY_CONVERSION_METHOD
◦ Profile Display Name : BI Default Currency Conversion Method
◦ Application
◦ Module
◦ Start Date : Provide previous day's date to proceed to next step to define values.
3. Click Save and Close.4. In the Manage Profile Options dialog box, you see your new profile. Check the Enabled box for Site.5. Click Save and Close.
Oracle Applications CloudCreating and Administering Analytics and Reports
Chapter 2Setup and Configuration
13
Related Topics
• Update Existing Setup Data
Define Currency Profile ValuesAfter you create your currency profile, the last step is to define the profile value. This step defines which currencymanagement option is assigned to that profile.
1. In the Setup and Maintenance work area, use Manage Administrator Profile Values.2. In Profile Option Code search for your profile: BI_DEFAULT_CURRENCY_CONVERSION_METHOD.3. In Manage Administrator Profile Values, Click Add (+ icon).4. Select Site as the Profile level.5. Enter "User Preferred Currency 2" in Profile Value.6. Click Save and Close.
How User Preferred Currency Exchange WorksThe simple and advanced user-preferred currency choices determine how and when your currency exchange rates arecalculated for your reports. For both simple and advanced currency management, when you save or close a report, theapplication sets the exchange rate at that time. The option you choose impacts how quickly your reports are generatedat run time. Each case includes trade-offs, as detailed in the examples.
User Preferred Currency using Simple Currency ManagementThe advantage of this option is performance - the application doesn't have to look up the rate for each transactionbecause when you close or save a record, the application converts it to your corporate currency at that day's rate. Whenyou run the opportunity report, the application multiplies that value by your preferred currency exchange rate for thedate you run the report. This eliminates the need for the application to cycle through each record, and calculate thecorresponding exchange rate to your preferred exchange rate at the time that record was closed or last saved. It simplytakes the value on record for the original transaction exchange to corporate currency, and multiplies it by your preferredcurrency exchange rate at the time your run the report.
As an example of user preferred currency using simple currency management, a user updates and saves or closes anopportunity record with associated revenue of one million Indian Rupees on January 31st with an exchange rate of0.01401 Rupees to one US Dollar. The user then runs an opportunity report in US Dollars on March 31st. In the report,the US Dollar Corporate Currency is set at the January 31st rate it was saved at, in this case reporting as $14,010, or onemillion multiplied by 0.01401. Finally, an opportunity report on March 31st in Euros uses the March 31st conversion ratefor US Dollars to Euros of 0.75017 to convert the recorded US Dollar amount into Euros, in this example one millionmultiplied by 0.01401, which is the January 31st Rupee to US Dollar exchange rate, multiplied by 0.75013, which is theMarch 31st rate for Euros. This requires less processing, because the January 31st Rupee to US Dollar exchange rate,while not exact on March 31st, is used as the basis for the calculation of the March 31st opportunity revenue conversionto Euros at the later exchange rate.
Oracle Applications CloudCreating and Administering Analytics and Reports
Chapter 2Setup and Configuration
14
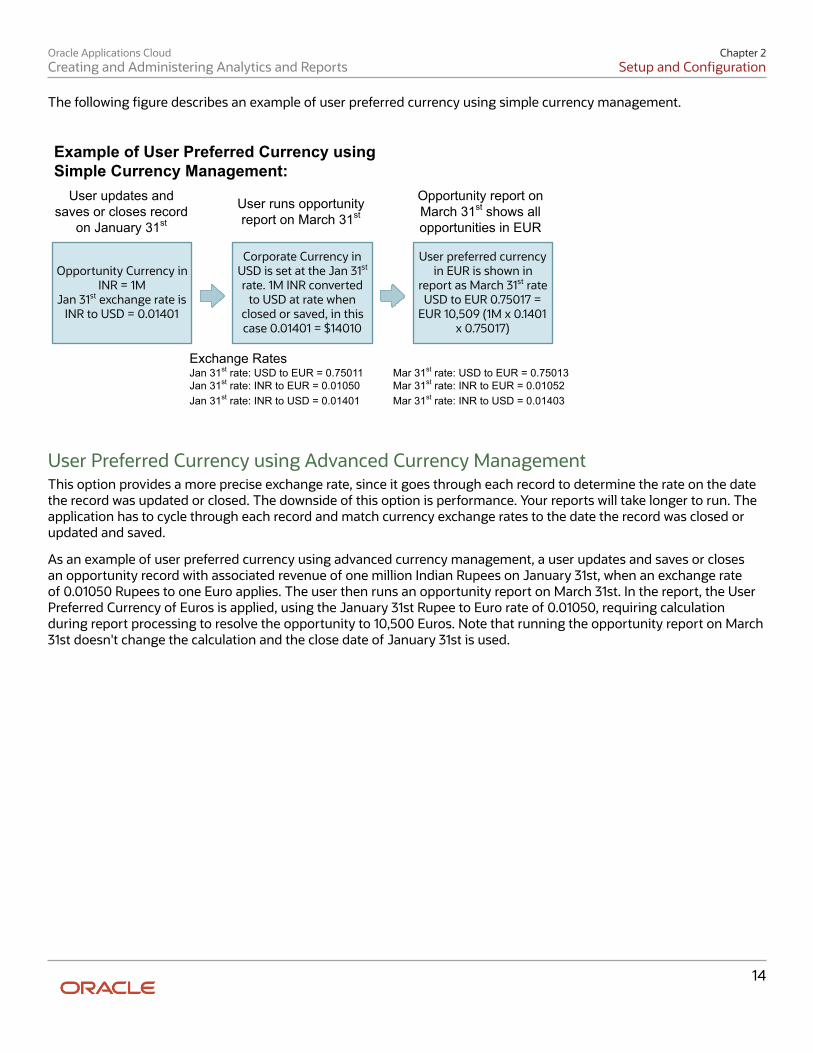
The following figure describes an example of user preferred currency using simple currency management.
Opportunity Currency in INR = 1M
Jan 31st exchange rate is INR to USD = 0.01401
Corporate Currency in USD is set at the Jan 31st rate. 1M INR converted
to USD at rate when closed or saved, in this case 0.01401 = $14010
User preferred currency in EUR is shown in
report as March 31st rate USD to EUR 0.75017 =
EUR 10,509 (1M x 0.1401 x 0.75017)
Example of User Preferred Currency using Simple Currency Management:
User updates and saves or closes record
on January 31st
User runs opportunity report on March 31st
Opportunity report on March 31st shows all opportunities in EUR
Exchange RatesJan 31st rate: USD to EUR = 0.75011Jan 31st rate: INR to EUR = 0.01050Jan 31st rate: INR to USD = 0.01401
Mar 31st rate: USD to EUR = 0.75013Mar 31st rate: INR to EUR = 0.01052Mar 31st rate: INR to USD = 0.01403
User Preferred Currency using Advanced Currency ManagementThis option provides a more precise exchange rate, since it goes through each record to determine the rate on the datethe record was updated or closed. The downside of this option is performance. Your reports will take longer to run. Theapplication has to cycle through each record and match currency exchange rates to the date the record was closed orupdated and saved.
As an example of user preferred currency using advanced currency management, a user updates and saves or closesan opportunity record with associated revenue of one million Indian Rupees on January 31st, when an exchange rateof 0.01050 Rupees to one Euro applies. The user then runs an opportunity report on March 31st. In the report, the UserPreferred Currency of Euros is applied, using the January 31st Rupee to Euro rate of 0.01050, requiring calculationduring report processing to resolve the opportunity to 10,500 Euros. Note that running the opportunity report on March31st doesn't change the calculation and the close date of January 31st is used.
Oracle Applications CloudCreating and Administering Analytics and Reports
Chapter 2Setup and Configuration
15
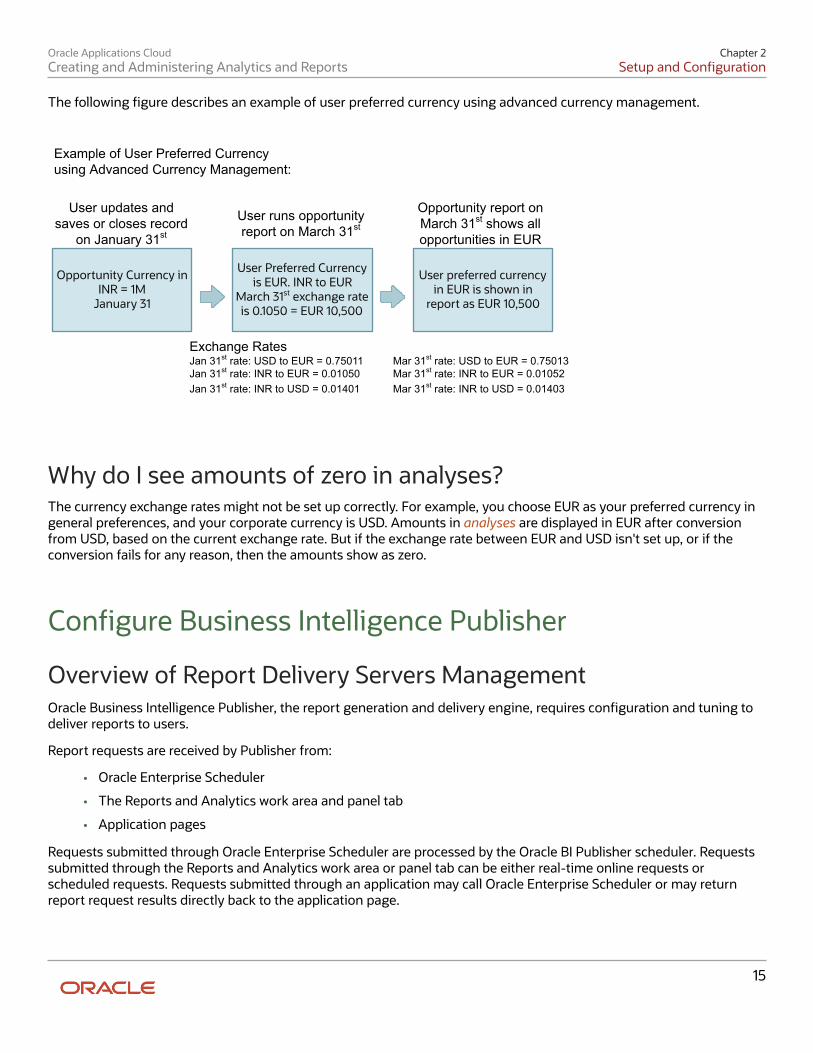
The following figure describes an example of user preferred currency using advanced currency management.
Opportunity Currency in INR = 1M
January 31
User Preferred Currency is EUR. INR to EUR
March 31st exchange rate is 0.1050 = EUR 10,500
User preferred currency in EUR is shown in
report as EUR 10,500
Example of User Preferred Currencyusing Advanced Currency Management:
User updates and saves or closes record
on January 31st
User runs opportunity report on March 31st
Opportunity report on March 31st shows all opportunities in EUR
Exchange RatesJan 31st rate: USD to EUR = 0.75011Jan 31st rate: INR to EUR = 0.01050Jan 31st rate: INR to USD = 0.01401
Mar 31st rate: USD to EUR = 0.75013Mar 31st rate: INR to EUR = 0.01052Mar 31st rate: INR to USD = 0.01403
Why do I see amounts of zero in analyses?The currency exchange rates might not be set up correctly. For example, you choose EUR as your preferred currency ingeneral preferences, and your corporate currency is USD. Amounts in analyses are displayed in EUR after conversionfrom USD, based on the current exchange rate. But if the exchange rate between EUR and USD isn't set up, or if theconversion fails for any reason, then the amounts show as zero.
Configure Business Intelligence Publisher
Overview of Report Delivery Servers ManagementOracle Business Intelligence Publisher, the report generation and delivery engine, requires configuration and tuning todeliver reports to users.
Report requests are received by Publisher from:
• Oracle Enterprise Scheduler
• The Reports and Analytics work area and panel tab
• Application pages
Requests submitted through Oracle Enterprise Scheduler are processed by the Oracle BI Publisher scheduler. Requestssubmitted through the Reports and Analytics work area or panel tab can be either real-time online requests orscheduled requests. Requests submitted through an application may call Oracle Enterprise Scheduler or may returnreport request results directly back to the application page.
Oracle Applications CloudCreating and Administering Analytics and Reports
Chapter 2Setup and Configuration
16
Oracle BI Publisher is configured to accept requests from Oracle Applications Cloud. However, before you can deliverreport documents to their destinations, you must define the delivery servers in Oracle BI Publisher. Use the Oracle BIPublisher Administration page to define your delivery servers.
Once delivery servers are defined, you can further configure the number of report processor and delivery threads tobest handle your processing and delivery requirements. In addition, you can configure report properties for the deliveryservers or at the report level to tune performance of your reports. To diagnose report processing issues, BI Publisherprovides a set of scheduler diagnostics.
Navigate to the BI Publisher Administration PageYou use the Oracle BI Publisher Administration Page to perform most tasks related to report delivery and performance.
Use the Oracle BI Publisher Administration page to:
• Configure delivery servers
• Manage report and delivery processors
• View scheduler diagnostics
• Set system properties and report runtime configuration properties
Request the Oracle Applications Cloud security administrator to assign the BI Platform Administrator duty role (BI stripe)to the person responsible for administering BI analyses, dashboards, and BI Publisher reports. Administration tasksinclude security permissions for objects, organizing objects into folders, accessing log files, and several other tasks.
Navigating to the Administration PageTo navigate to the Oracle BI Publisher Administration page:
1. Click Tools > Reports and Analytics in the Navigator.2. In the Reports and Analytics work area, click Browse Catalog.3. In the Catalog page, click Administration, then click Manage BI Publisher.
Configure Report Delivery ServersSet up the report delivery servers to support printing.
Configuring ServersTo configure delivery servers:
1. From the BI Publisher Administration page, click Delivery Configuration.2. Enter values in the Delivery Configuration Options tab to set general properties for email deliveries and
notifications.3. To configure a delivery server, click the appropriate tab. You can also configure role-based access to delivery
servers.
Oracle Applications CloudCreating and Administering Analytics and Reports
Chapter 2Setup and Configuration
17
Configure PrintersYou can set a default printer for your account and restrict access to a printer by roles.
Set a Default PrinterYou can set a default printer for your account so that when you schedule a job with the destination as Printer, thisprinter is selected. However, you can select another printer assigned to your role.
To set a default printer:
1. Navigate to BI Publisher using the https://<FA_instance_host>/xmlpserver URL.2. Click your user name and select My Account.3. In the General tab, select a printer from the list and click OK.
Restrict Access to a Printer by RolesBy default, the access to a printer is set to Public, which makes it available to all users. But you can configure which rolescan access a printer.
1. Navigate to the Administration page.2. In the Delivery section, select Printer.3. In the Printer tab, add a new printer or select an existing one.4. In the Access Control section, deselect Public.5. Select one or more roles you want to provide access to the printer, and click Move to add them to the Allowed
Roles.6. Click Apply.
Overview of Report and Delivery ProcessorsWhen Oracle Enterprise Scheduler initiates a job, it is picked up by the BI Publisher scheduler queue.
• Job Processor: Listens for requests from the scheduler queue. When the job information is received, thejob processor executes the data model (and splits the data for bursting jobs), stores the data in the sharedtemporary folder, and sends the report metadata to the report queue.
• Report Processor: Listens for requests from the report queue. When the report information is received, thereport processor generates the report documents, stores it in the shared temporary folder and puts the deliveryinformation in the delivery queue.
• Delivery Processor: Listens to the delivery queue and handles the delivery of reports for its channel. Thedelivery processors are:
◦ Email Processor
◦ File Processor
◦ FTP Processor
◦ Print Processor
◦ WebDAV Processor
◦ Fax Processor
Oracle Applications CloudCreating and Administering Analytics and Reports
Chapter 2Setup and Configuration
18
Manage Report Processing and Delivery Server LoadManage the processors in the BI Publisher Scheduler Configuration page.
Managing Processing and Server LoadBy default, each processor is enabled and the thread count for each is set to five. For each managed server that isrunning in the BI cluster, a table for that instance's processors is displayed. Use the table to enable or disable processorsfor the instance and configure the thread counts.
To configure processor threads:
1. From the BI Publisher Administration page, click Scheduler Configuration.2. In the Cluster Instances region of the Scheduler Configuration page, enter the Number Threads value in the
processor configuration table.3. All processors are automatically set to use the number of threads defined in the Threads Per JMS Processor
value of the JMS Configuration region of the page. Enter a value in the Number Threads column to change thevalue from this default.
After performing the scale-out procedure, configure the processor threads for each cluster instance using the samesteps.
Diagnose Report Processing IssuesThe Scheduler Diagnostics page provides the runtime status of the scheduler. Among others, it provides status of itsJMS configuration, JMS queues, cluster instances, scheduler Database, and Oracle Enterprise Scheduler.
Diagnosing IssuesTo access the Scheduler Diagnostics page:
1. Navigate to the Oracle Business Intelligence Publisher Administration page.2. In the System Maintenance group, click Scheduler Diagnostics.
Configure System Properties for ReportsUse the Oracle BI Publisher Runtime Configuration page to set the system-level runtime properties for reports.
Configure Reporting PropertiesTo access the Runtime Configuration page:
1. Navigate to the Oracle Business Intelligence Publisher Administration page.2. In the Runtime Configuration group, click Properties.
Oracle Applications CloudCreating and Administering Analytics and Reports
Chapter 2Setup and Configuration
19
FTP and SFTP Delivery Retry PropertyBy default, if FTP or SFTP delivery fails, another attempt is made to deliver the file to the failed destination 10 secondslater. When you set the Enable FTP/SFTP delivery retry property to False, no retry attempt is made. This setting affectsall of the FTP and SFTP delivery requests, and can't be configured for individual servers.
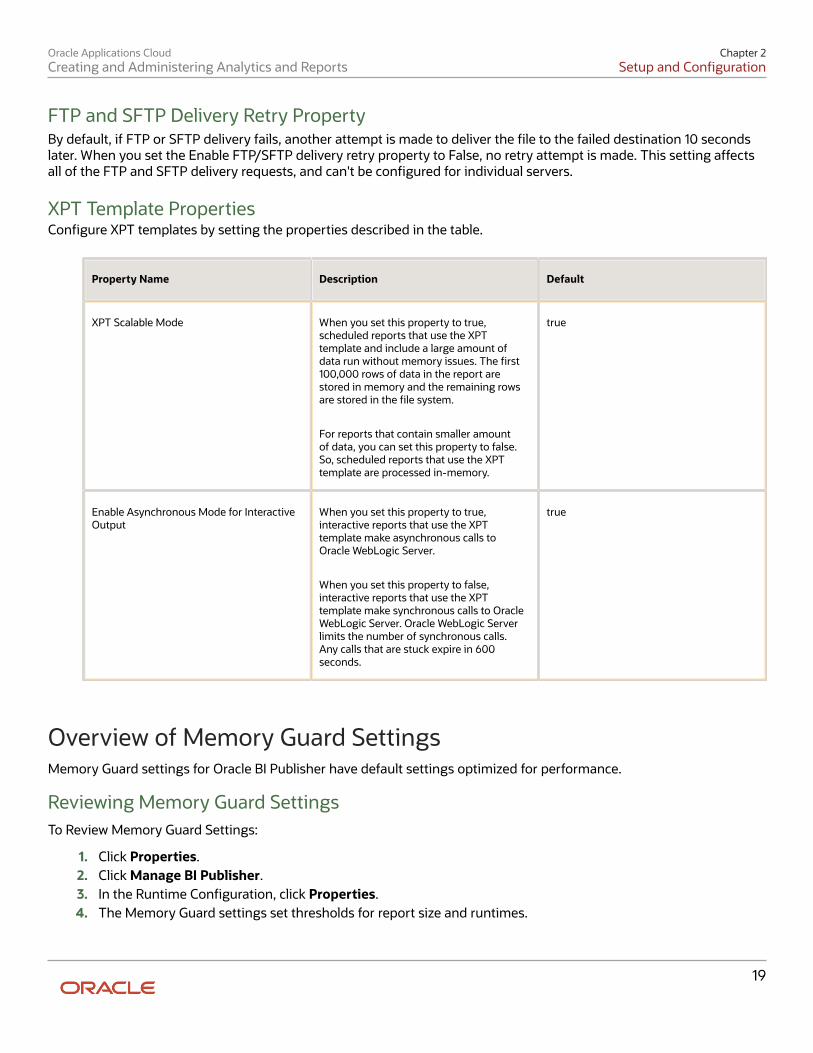
XPT Template PropertiesConfigure XPT templates by setting the properties described in the table.
Property Name Description Default
XPT Scalable Mode When you set this property to true,scheduled reports that use the XPTtemplate and include a large amount ofdata run without memory issues. The first100,000 rows of data in the report arestored in memory and the remaining rowsare stored in the file system.
For reports that contain smaller amountof data, you can set this property to false.So, scheduled reports that use the XPTtemplate are processed in-memory.
true
Enable Asynchronous Mode for InteractiveOutput
When you set this property to true,interactive reports that use the XPTtemplate make asynchronous calls toOracle WebLogic Server.
When you set this property to false,interactive reports that use the XPTtemplate make synchronous calls to OracleWebLogic Server. Oracle WebLogic Serverlimits the number of synchronous calls.Any calls that are stuck expire in 600seconds.
true
Overview of Memory Guard SettingsMemory Guard settings for Oracle BI Publisher have default settings optimized for performance.
Reviewing Memory Guard SettingsTo Review Memory Guard Settings:
1. Click Properties.2. Click Manage BI Publisher.3. In the Runtime Configuration, click Properties.4. The Memory Guard settings set thresholds for report size and runtimes.
Oracle Applications CloudCreating and Administering Analytics and Reports
Chapter 2Setup and Configuration
20
Use a Dedicated Business Intelligence Publisher Cluster for CriticalJobsFor some time-sensitive reports, including for example paycheck and invoice generation, you can use a dedicatedBusiness Intelligence Publisher cluster by setting the report's priority as critical, ensuring that reports are run duringcritical time windows.
Critical jobs are assigned to a dedicated cluster. To set a report as critical:
1. Open the report.2. Click Properties.3. In the Advanced Report Properties in the General tab, select Critical in the Job Priority list.
Determining Which Reports Are Prioritized as CriticalTo review which reports have been marked as critical, navigate to Report Job Histories, where critical jobs arehighlighted.
Download Armored PGP Public Key FilesTo support encrypted communication channel from the BI Publisher Server to an FTP site, you download a Pretty GoodPrivacy (PGP) public key file in ASCII armor format and configure your FTP server to use PGP encrypted files in thatformat.
Download PGP Public FileDownload PGP keys in the BI Publisher Administration page.
To download a PGP key in armored format:
1. Navigate to the BI Publisher Administration page.2. In the Security Center section, click the PGP Keys link to open the PGP Keys page.3. In the PGP Keys section, click the Download BI Publisher Key [name] (ASCII armored) Download icon.4. In the Opening [email protected] dialog box, click OK. Enter a name for the key or accept the default
in the Save dialog box and click OK.
Upload and Apply PGP Keys for PGP Encryption for FTP DeliveryTo secure report delivery through the FTP/SFTP channel, you can encrypt the report using PGP Encryption.
Upload PGP KeysYou upload, test, and delete PGP keys in the BI Publisher Administration page.
To upload PGP keys:
1. Navigate to the BI Publisher Administration page.2. In the Security Center section, click the PGP Keys link to open the PGP Keys page.3. In the PGP Keys section, click Browse and select the PGP key file in the Open dialog box.4. Click OK.
Oracle Applications CloudCreating and Administering Analytics and Reports
Chapter 2Setup and Configuration
21
5. Click Upload. After the file is uploaded, it is imported into the keystore and its details are visible in the PGP Keystable. If a key with the same ID is imported again, the file is overwritten.
6. Click the Download icon of the key in the Encrypted Test Output column of the PGP Keys table to download anddecrypt a test output file using the secret key of the imported public key. Successful decryption confirms theencryption is working for your keys.
Delete a PGP KeyTo delete an imported public key, click the Delete icon.
Apply PGP Encryption to FTP Delivery ChannelTo create an FTP channel:
1. Navigate to the BI Publisher Administration page.2. In the Delivery section, click the FTP link to open the FTP page.3. Add a new FTP Server, using the user name and the password and private key password set when you created
the PGP key. The Filter Command field is read-only and is updated automatically when you select a PGP key.4. Click Test Connection.5. Select the PGP Key ID of the key you uploaded from the list.6. If you want PGP encrypted output in ASCII armored format on the destination FTP server, select the ASCII
Armored Output check box. The Filter Command is updated with a -a option.7. Select the true check box for Sign Output to sign the encrypted document. If you select this check box, a -s
parameter is added to the existing filter command.8. Test the connection again. The FTP delivery channel can now be used in a scheduled job.
Configure the Email Addresses and Allowed Email Domains forNotificationsUse the Delivery Configuration tab to set e-mail addresses and restrict email delivery to allowed email domains forreport deliveries and notifications from BI Publisher.
1. Navigate to the BI Publisher administration page.2. In the Delivery section, click the Delivery Configuration link to open the Delivery page.3. In the Delivery Configuration tab, enter the email addresses in the Email From Address and Delivery Notification
Email From Address fields. Note that Domain Keys Identified Mail email authentication is supported.4. Enter the email subject text in the following fields:
◦ Success Notification Subject
◦ Warning Notification Subject
◦ Failure Notification Subject
◦ Skipped Notification Subject
5. Enter the domains, separated by a comma, you want to allow email to in the Allowed Email Recipient Domainsfield. The default, *, allows all domains.
6. Click Apply.
Oracle Applications CloudCreating and Administering Analytics and Reports
Chapter 2Setup and Configuration
22
Use Non-Standard FontsIf you want to use non-standard fonts, you can upload them using either the Upload Center tab on the SystemMaintenance page, or the Font Mappings tab on the Runtime Configuration page. Fonts uploaded through either arelisted in the other.
You can map a font for a report or globally. If you map fonts at the report level, then map fonts at the globally, thereport-level fonts override the newer fonts. You can change this in the report properties.
Upload and Manage Configuration-Specific FilesUse Upload Center to upload and manage the configuration-specific files for font, digital signature, ICC profile, SSHprivate key, and SSL certificate.
To upload and manage configuration-specific files:
1. From the BI Publisher Administration page, click Upload Center.2. Click Browse and select the file you want to upload.3. Select the configuration file type.
Note: A digital signature file should have a .pfx or .p12 extension. Signature files with otherexceptions fail to upload due to incorrect extension.
4. If you want to overwrite an existing file with the new file, select Overwrite.5. Click Upload.6. To manage the uploaded files, use the Filter By Type field to filter the files in the table.
Set Up and Configure Auditing and MonitoringBI Publisher logs statistics about user activity using that can be reported on in reports. An administrator can set the levelof auditing and monitoring or turn them off.
Logged User EventsImportant report publishing events are logged in the audit database, including the following. You can control the level ofauditing.
• Tracks the start and end time of request events for reports (normal and scheduled).
• Tracks the relationship between requested start time, report execution events (data processing, bursting,rendering, and delivery), and request end events for report requests
Access Audit RecordsTo access audit records:
1. Configure the AuditDB data source.
a. Click Administration.b. Click the JNDI Connection.
Oracle Applications CloudCreating and Administering Analytics and Reports
Chapter 2Setup and Configuration
23
c. Click Add Data Source, and enter:
• Data Source Name: AuditDB• JNDI Name: jdbc/AuditViewDataSource
d. Click Test Connection to confirm the connection.e. Click Apply.
2. Create a data model.
a. In the Home page, click New and select Data Model.b. Click New Data Set and select SQL Query.c. In the Edit Data Set dialog box, select AuditDB in the Data Source list.d. Accept the default, Standard SQL, in the Type of SQL list.e. Enter the following SQL statement:
SELECT IAU_TSTZORIGINATING, IAU_INITIATOR, IAU_EVENTTYPE, IAU_RESOURCE from BIPUBLISHER_V ORDER BY IAU_TSTZORIGINATING DESC
f. Click OK.g. Click Save to save the data model.h. Click View Data.i. In the Data tab, click View.j. Click Save As Sample Data.
k. Click Save to save the data model.l. Click Create Report.
3. Create a simple report with table layout.
Configure Auditing and Monitoring LevelsAdministrators can configure auditing and monitoring in the BI Publisher Server Configuration page.
To manage auditing and monitoring:
1. Click the Administration link.2. In System Maintenance, click Server Configuration.3. In the Monitor and Audit section, select the appropriate option:
◦ To enable both auditing and monitoring, select Enable Monitor and Audit, and select Medium from theAudit Level list.
◦ To disable both auditing and monitoring, deselect Enable Monitor and Audit.
◦ To disable auditing and enable monitoring, select Enable Monitor and Audit, and select None from theAudit Level list.
4. Click Apply.
Set Up the Delivery Channel
Oracle Applications CloudCreating and Administering Analytics and Reports
Chapter 2Setup and Configuration
24
Set Up the Delivery Channel and Enable EncryptionBI Publisher supports Oracle WebCenter Content as the recommended delivery channel for delivering reports fordistribution. You can use the provisioned connection to deliver files from BI Publisher to WebCenter Content, orconfigure a custom connection to deliver Pretty Good Privacy (PGP) encrypted files from BI Publisher.
Using the Default ConnectionBy default, a provisioned WebCenter Content connection, FA_UCM_Provisioned, uses a provisionedFUSION_APPS_OBIA_BIEE_APPID user to connect to WebCenter Content with security groups and accounts to supportthe most common use cases.
Creating a Custom ConnectionIf you have specific requirement to access WebCenter Content using user credentials other thanFUSION_APPS_OBIA_BIEE_APPID, or if you want to use PGP key encryption, you can add a custom connection.
When you create a custom connection for WebCenter Content, it must use the same Uniform Resource Identifier (URI)as the provisioned connection, but should have its own user name and password.
To create a custom connection:
1. In the BI Publisher Administration page, navigate to the Content Server tab in the Delivery section, and clickAdd Server.
2. Enter the same URI used by the provisionedFA_UCM_Provisioned WebCenter Content server.3. Enter the server name, URI, user name, and password.4. Leave Enable Custom Metadata deselected. Custom metadata isn't used.5. Click Test Connection to ensure that you can connect.6. Click Apply.
Configuring File EncryptionYou can use PGP encryption to secure the file delivery.
To use PGP encryption:
1. Upload the PGP public keys to import the PGP keys of WebCenter Content.
a. Navigate to the Security Center section in the BI Publisher Administration page.b. Click PGP Keys to open the PGP Keys page.c. In the PGP Keys section, click Browse and select the PGP key file in the Open dialog box.d. Click Upload. The uploaded file is imported into the keystore and its details are visible in the PGP Keys
table. If a key with the same ID is imported again, the file is overwritten.e. Click Download for the key in the Encrypted Test Output column of the PGP Keys table to download and
decrypt a test output file using the secret key of the imported public key. Successful decryption confirmsthe encryption is working for your keys.
2. Enable delivery of PGP encrypted files in a custom connection to WebCenter Content.
a. Navigate to the Delivery section and the Content Server page.b. Select the custom content server connection you want to configure.c. Select the imported key by its ID from the PGP Keys list and verify that the GPG command is populated in
the Filter Command.d. Click Apply.
Oracle Applications CloudCreating and Administering Analytics and Reports
Chapter 2Setup and Configuration
25
Deliver ContentUse a scheduled job to deliver content and documents.
Scheduling a Job to Deliver ContentTo schedule a job to deliver documents:
1. In BI Publisher, click Create and select Report Job.2. In Schedule Report Job, on the General tab, click search for the Report field.3. In the Open dialog box, navigate to and select the report, and then click Open.4. In Schedule Report Job, in the Frequency list on the Schedule tab, select the option to use for this report.5. (Optional) In Schedule Report Job, on the Output tab, select Compress output prior to delivery to compress
the output for all formats except HTML. When the output is delivered, it's compressed except for zippedPDF format in all delivery channels and HTML Output format in the Email delivery channel. If the deliverydestination is Email, reports are attached to emails in <Name>_<Output Format>.zip format.
6. In Schedule Report Job, on the Output tab, choose Content Server in the Destination Type list.7. Click Add Destination.8. Select the server from the Server list.9. Select the WebCenter Content security group to assign to the report.
10. (Optional) Select an account within the Security Group to assign to the report.11. (Optional) Select the Folder Path to deliver files to an existing folder in the content server.12. (Optional) Enter a value for Author. If you don't enter an author, your user name is used for the Author
metadata in WebCenter Content.13. (Optional) Type a Title for the report. If you don't enter a title, the layout name is used for the title.14. Enter the file name to assign to the delivered document on the remote server, for example, myreport.pdf.15. Ensure that you don't include files with the same name in one folder. The File Name field is used as the Native
File Name in WebCenter Content. If you don't supply a file name value, the Output name is used.16. (Optional) Type a description to include with the document in WebCenter Content.17. Deselect Include Custom Metadata.18. Click Submit.19. In the Submit dialog box, type a name in the Report Job Name field, and click OK.20. Click Home and navigate to the Report Job History page to verify the report delivery status.
Defining a Bursting Query to Deliver ContentBursting is a process of splitting data into blocks, generating documents for each block, and delivering the documentsto one or more destinations. The data for the report is generated by executing a query once and then splitting the databased on a key value. For each data block, a separate document is generated and delivered. The bursting query is a SQLquery that you define to provide the required information to format and deliver the report.
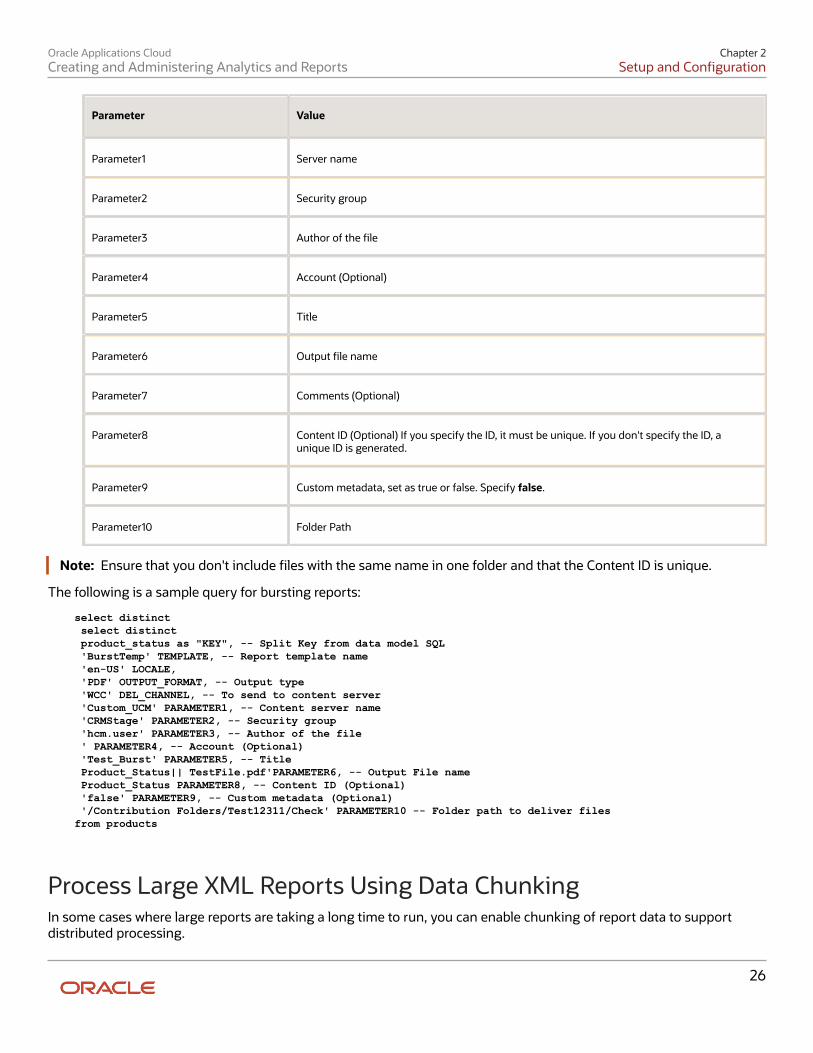
To deliver reports to WebCenter Content, define the bursting job with WCC as the delivery channel, and configure theparameter values as shown in the table.
Parameter Value
DEL_CHANNEL Delivery channel. Specify WCC for WebCenter Content.
Oracle Applications CloudCreating and Administering Analytics and Reports
Chapter 2Setup and Configuration
26
Parameter Value
Parameter1 Server name
Parameter2 Security group
Parameter3 Author of the file
Parameter4 Account (Optional)
Parameter5 Title
Parameter6 Output file name
Parameter7 Comments (Optional)
Parameter8 Content ID (Optional) If you specify the ID, it must be unique. If you don't specify the ID, aunique ID is generated.
Parameter9 Custom metadata, set as true or false. Specify false.
Parameter10 Folder Path
Note: Ensure that you don't include files with the same name in one folder and that the Content ID is unique.
The following is a sample query for bursting reports:
select distinct select distinct product_status as "KEY", -- Split Key from data model SQL 'BurstTemp' TEMPLATE, -- Report template name 'en-US' LOCALE, 'PDF' OUTPUT_FORMAT, -- Output type 'WCC' DEL_CHANNEL, -- To send to content server 'Custom_UCM' PARAMETER1, -- Content server name 'CRMStage' PARAMETER2, -- Security group 'hcm.user' PARAMETER3, -- Author of the file ' PARAMETER4, -- Account (Optional) 'Test_Burst' PARAMETER5, -- Title Product_Status|| TestFile.pdf'PARAMETER6, -- Output File name Product_Status PARAMETER8, -- Content ID (Optional) 'false' PARAMETER9, -- Custom metadata (Optional) '/Contribution Folders/Test12311/Check' PARAMETER10 -- Folder path to deliver filesfrom products
Process Large XML Reports Using Data ChunkingIn some cases where large reports are taking a long time to run, you can enable chunking of report data to supportdistributed processing.
Oracle Applications CloudCreating and Administering Analytics and Reports
Chapter 2Setup and Configuration
27
If you enable data chunking, the data model pre-processor uses a designated split key to split large amounts of XMLdata into several chunks of data of manageable size. The layout processor outputs individual XML data chunks andmerges them to generate a consolidated final report output.
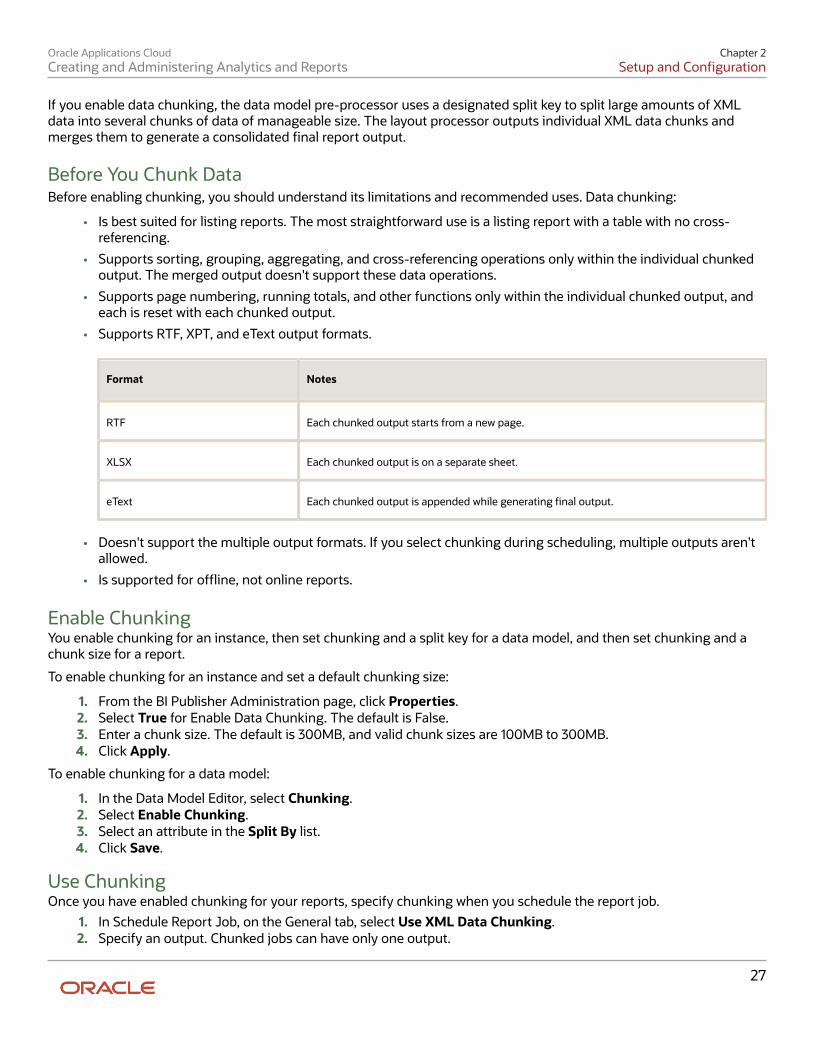
Before You Chunk DataBefore enabling chunking, you should understand its limitations and recommended uses. Data chunking:
• Is best suited for listing reports. The most straightforward use is a listing report with a table with no cross-referencing.
• Supports sorting, grouping, aggregating, and cross-referencing operations only within the individual chunkedoutput. The merged output doesn't support these data operations.
• Supports page numbering, running totals, and other functions only within the individual chunked output, andeach is reset with each chunked output.
• Supports RTF, XPT, and eText output formats.
Format Notes
RTF Each chunked output starts from a new page.
XLSX Each chunked output is on a separate sheet.
eText Each chunked output is appended while generating final output.
• Doesn't support the multiple output formats. If you select chunking during scheduling, multiple outputs aren'tallowed.
• Is supported for offline, not online reports.
Enable ChunkingYou enable chunking for an instance, then set chunking and a split key for a data model, and then set chunking and achunk size for a report.
To enable chunking for an instance and set a default chunking size:
1. From the BI Publisher Administration page, click Properties.2. Select True for Enable Data Chunking. The default is False.3. Enter a chunk size. The default is 300MB, and valid chunk sizes are 100MB to 300MB.4. Click Apply.
To enable chunking for a data model:
1. In the Data Model Editor, select Chunking.2. Select Enable Chunking.3. Select an attribute in the Split By list.4. Click Save.
Use ChunkingOnce you have enabled chunking for your reports, specify chunking when you schedule the report job.
1. In Schedule Report Job, on the General tab, select Use XML Data Chunking.2. Specify an output. Chunked jobs can have only one output.
Oracle Applications CloudCreating and Administering Analytics and Reports
Chapter 2Setup and Configuration
28
3. Click Submit.
Consolidated Output with Attachments from a Bursting JobA bursting job splits data, generates reports, and delivers the reports to one or more destinations. When you create abursting job, you have an option to create a consolidated output. The consolidated output combines all the reports froma bursting job in a single consolidated PDF file. If the bursting output format is zipped PDF (PDFZ), then a consolidatedPDFZ output is created. If the reports of the bursting job include attachments, then the consolidated output alsoincludes the attachments of all the reports.
When the consolidated output is a PDFZ file, it includes a docindex.xml file that provides an index of all PDF outputsand attachments in the consolidated PDFZ file.
LimitationThe PDFZ output format isn't suitable if you want to:
• Enable password protection for the compressed PDF output.
• Use the PDF splitting feature in the RTF template. The index.xml and index.html files in the consolidated outputdon't have the corresponding catalog index if you use the splitting feature in the RTF template.
• Generate individual files from the consolidated PDFZ file.
• Retain the page numbers of all the reports and attachments in the consolidated PDFZ file. The page numberschange because the reports and attachments are merged in the PDFZ file.
• Include angular brackets (<>) or special characters (such as &,',", and so on) in the index variables. The XMLparser doesn't support these characters.
Note: It is recommended that you don't create a single consolidated PDF output of extremely large size. You mustassess the size of PDF attachments, individual outputs through bursting, and count of associated jobs to avoidcreating extremely large consolidated output file.
Configure Deep Links
Register Business Intelligence to Support Deep LinkingDeep linking lets you to navigate from an analysis on the interface pages to specific attributes and objects in your workareas so that you can work with them directly. What does that mean? It means that if you're looking at an analysison leads, for example, you can click a record on the analytic and go edit the lead record on the edit object page. Tosupport deep links, use the Setup and Maintenance work area to register the Business Intelligence Server as a third-party application.
Register Business Intelligence Server as a Third-Party ApplicationTo register the BI Server:
1. Use the Manage Third Party Applications page.2. Click Create.3. Enter AnalyticsApp as the application name.4. Enter the full URL for the BI Server (for example: http://host:port/analytics/saw.dll).
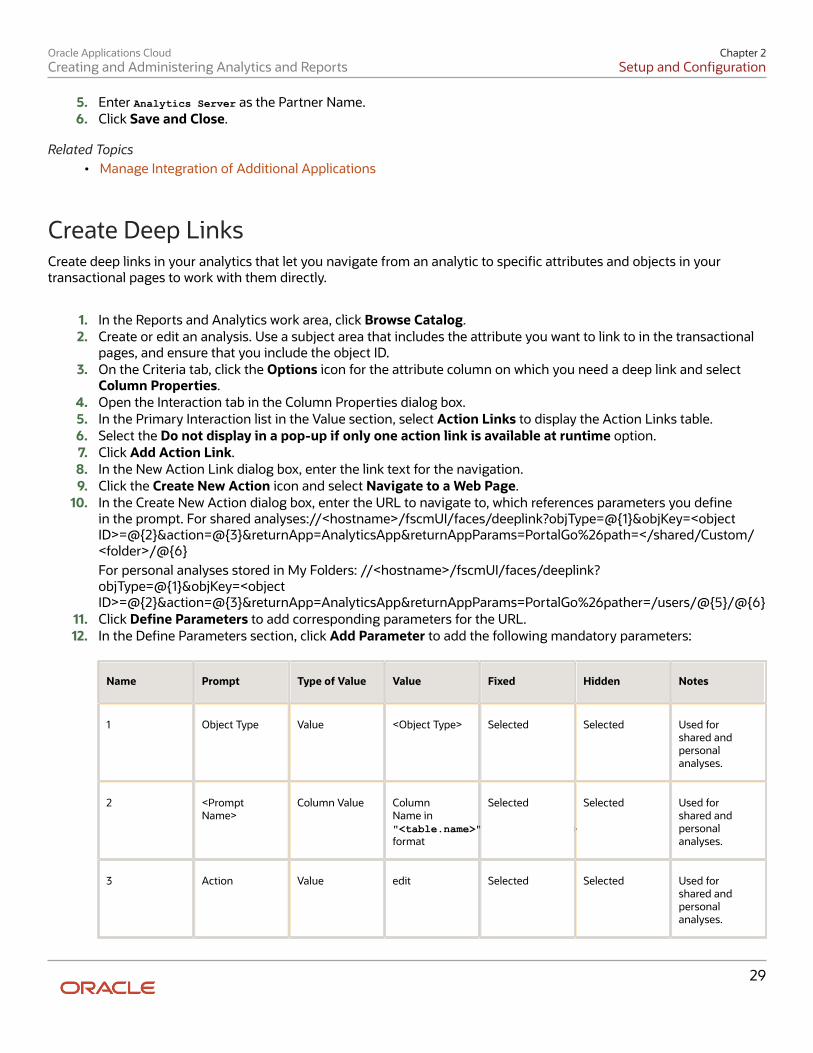
Oracle Applications CloudCreating and Administering Analytics and Reports
Chapter 2Setup and Configuration
29
5. Enter Analytics Server as the Partner Name.6. Click Save and Close.
Related Topics• Manage Integration of Additional Applications
Create Deep LinksCreate deep links in your analytics that let you navigate from an analytic to specific attributes and objects in yourtransactional pages to work with them directly.
1. In the Reports and Analytics work area, click Browse Catalog.2. Create or edit an analysis. Use a subject area that includes the attribute you want to link to in the transactional
pages, and ensure that you include the object ID.3. On the Criteria tab, click the Options icon for the attribute column on which you need a deep link and select
Column Properties.4. Open the Interaction tab in the Column Properties dialog box.5. In the Primary Interaction list in the Value section, select Action Links to display the Action Links table.6. Select the Do not display in a pop-up if only one action link is available at runtime option.7. Click Add Action Link.8. In the New Action Link dialog box, enter the link text for the navigation.9. Click the Create New Action icon and select Navigate to a Web Page.
10. In the Create New Action dialog box, enter the URL to navigate to, which references parameters you definein the prompt. For shared analyses://<hostname>/fscmUI/faces/deeplink?objType=@{1}&objKey=<objectID>=@{2}&action=@{3}&returnApp=AnalyticsApp&returnAppParams=PortalGo%26path=</shared/Custom/<folder>/@{6}For personal analyses stored in My Folders: //<hostname>/fscmUI/faces/deeplink?objType=@{1}&objKey=<objectID>=@{2}&action=@{3}&returnApp=AnalyticsApp&returnAppParams=PortalGo%26pather=/users/@{5}/@{6}
11. Click Define Parameters to add corresponding parameters for the URL.12. In the Define Parameters section, click Add Parameter to add the following mandatory parameters:
Name Prompt Type of Value Value Fixed Hidden Notes
1 Object Type Value <Object Type> Selected Selected Used forshared andpersonalanalyses.
2 <PromptName>
Column Value ColumnName in"<table.name>"."<column.name>"format
Selected Selected Used forshared andpersonalanalyses.
3 Action Value edit Selected Selected Used forshared andpersonalanalyses.
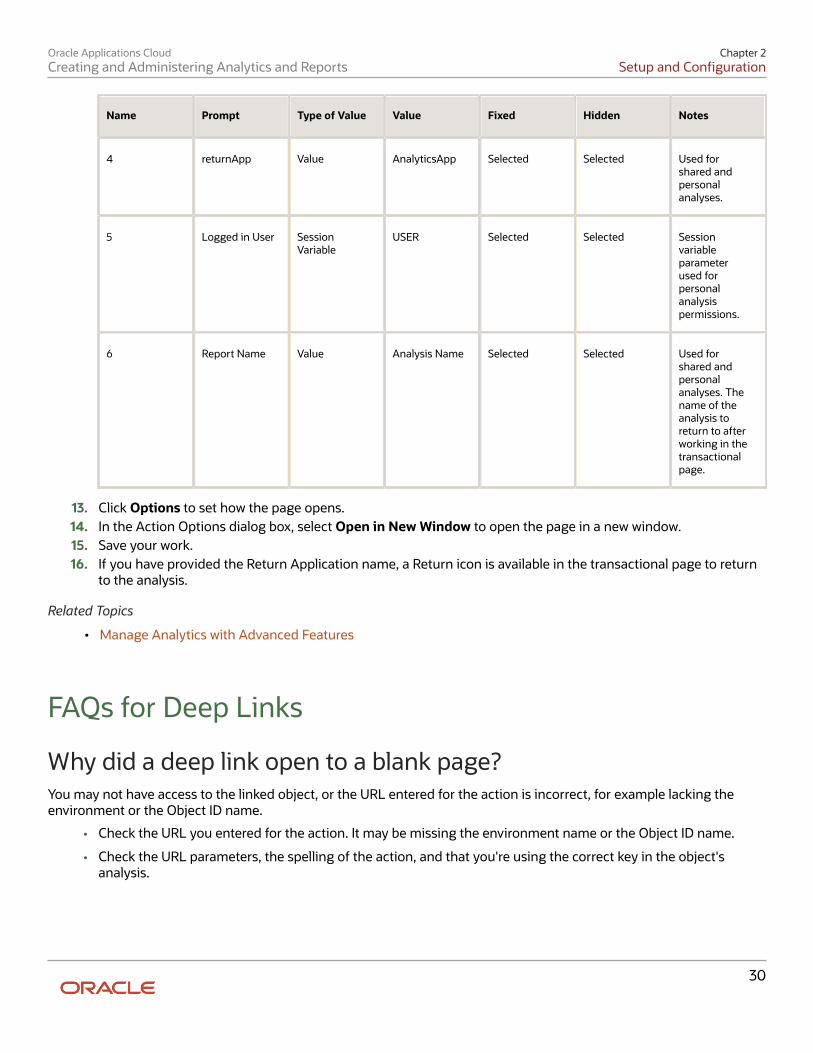
Oracle Applications CloudCreating and Administering Analytics and Reports
Chapter 2Setup and Configuration
30
Name Prompt Type of Value Value Fixed Hidden Notes
4 returnApp Value AnalyticsApp Selected Selected Used forshared andpersonalanalyses.
5 Logged in User SessionVariable
USER Selected Selected Sessionvariableparameterused forpersonalanalysispermissions.
6 Report Name Value Analysis Name Selected Selected Used forshared andpersonalanalyses. Thename of theanalysis toreturn to afterworking in thetransactionalpage.
13. Click Options to set how the page opens.14. In the Action Options dialog box, select Open in New Window to open the page in a new window.15. Save your work.16. If you have provided the Return Application name, a Return icon is available in the transactional page to return
to the analysis.
Related Topics
• Manage Analytics with Advanced Features
FAQs for Deep Links
Why did a deep link open to a blank page?You may not have access to the linked object, or the URL entered for the action is incorrect, for example lacking theenvironment or the Object ID name.
• Check the URL you entered for the action. It may be missing the environment name or the Object ID name.
• Check the URL parameters, the spelling of the action, and that you're using the correct key in the object'sanalysis.
Oracle Applications CloudCreating and Administering Analytics and Reports
Chapter 2Setup and Configuration
31
Do I have to display the ID for my object?No, you can add it, format the column as a number with zero decimals, and then hide the column.
Can I display actions for some users and not others?Yes, you define conditions for the action to display.
Embed Analyses and Dashboards
Allow Safe DomainsYou allow safe domains to approve access to specific content. For security reasons, external content can't be added toreports and reports can't be embedded in other applications unless it's safe to do so. Only administrators can allow safedomains.
Only authorized users may access the content. Except in cases where Single Sign On (SSO) is enabled, users areprompted to sign in when they access content on safe domains. After you have added a safe domain, users need to signout and sign back in to access content from that source.
1. Click Navigator > Reports and Analytics.2. Click Browse Catalog.3. Click the Administration link on the BI Home page.4. Click the Manage Safe Domains link.5. To allow users to embed their analyses in content located on other domains, enter the name of the safe domain
as well as the port. Here are a few formats you can use for port names:
◦ www.example.com:<port number>
◦ *.example.com:<port number>
◦ https:
6. Select the types of resources you want to allow and block any resource types you think aren't safe. For example,to allow embedding, select Embedding.
Embed Your Content in Other ApplicationsYou can embed your reports in other non-Oracle applications and portals. This is a good way to share content and dataamong multiple systems. When other users click on embedded content, if you don't have single sign-on, they mighthave to sign in again to see the content.
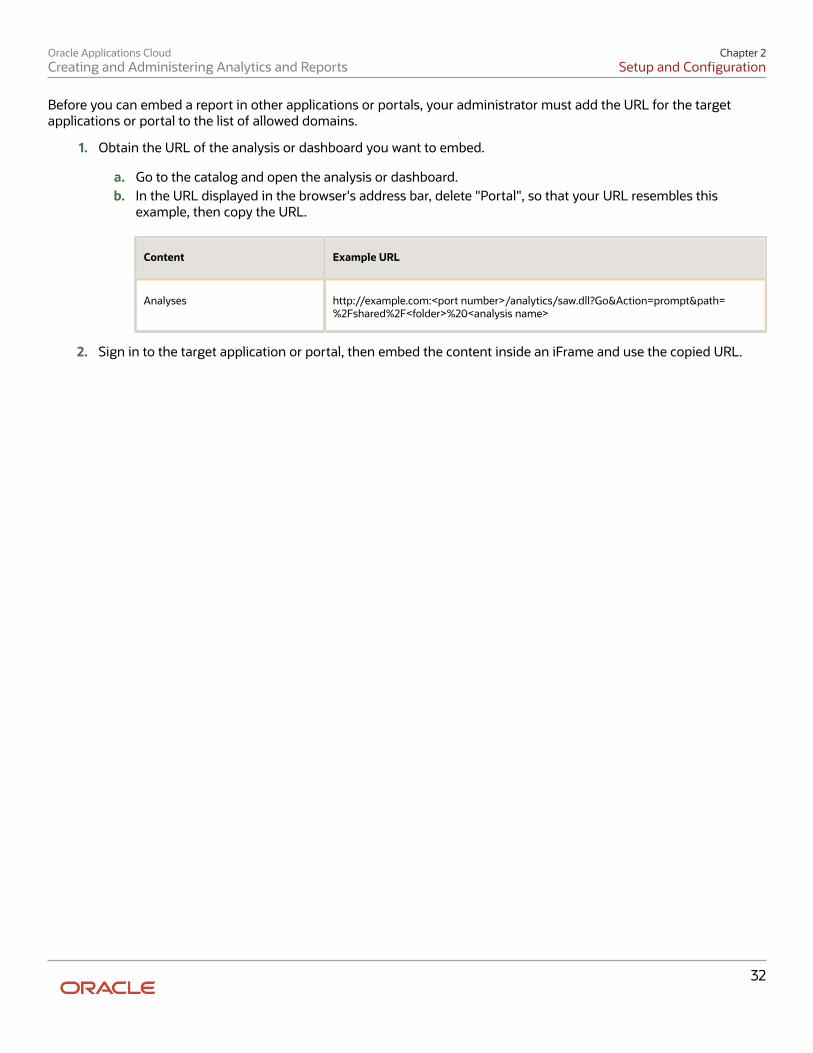
Oracle Applications CloudCreating and Administering Analytics and Reports
Chapter 2Setup and Configuration
32
Before you can embed a report in other applications or portals, your administrator must add the URL for the targetapplications or portal to the list of allowed domains.
1. Obtain the URL of the analysis or dashboard you want to embed.
a. Go to the catalog and open the analysis or dashboard.b. In the URL displayed in the browser's address bar, delete "Portal", so that your URL resembles this
example, then copy the URL.
Content Example URL
Analyses http://example.com:<port number>/analytics/saw.dll?Go&Action=prompt&path=%2Fshared%2F<folder>%20<analysis name>
2. Sign in to the target application or portal, then embed the content inside an iFrame and use the copied URL.
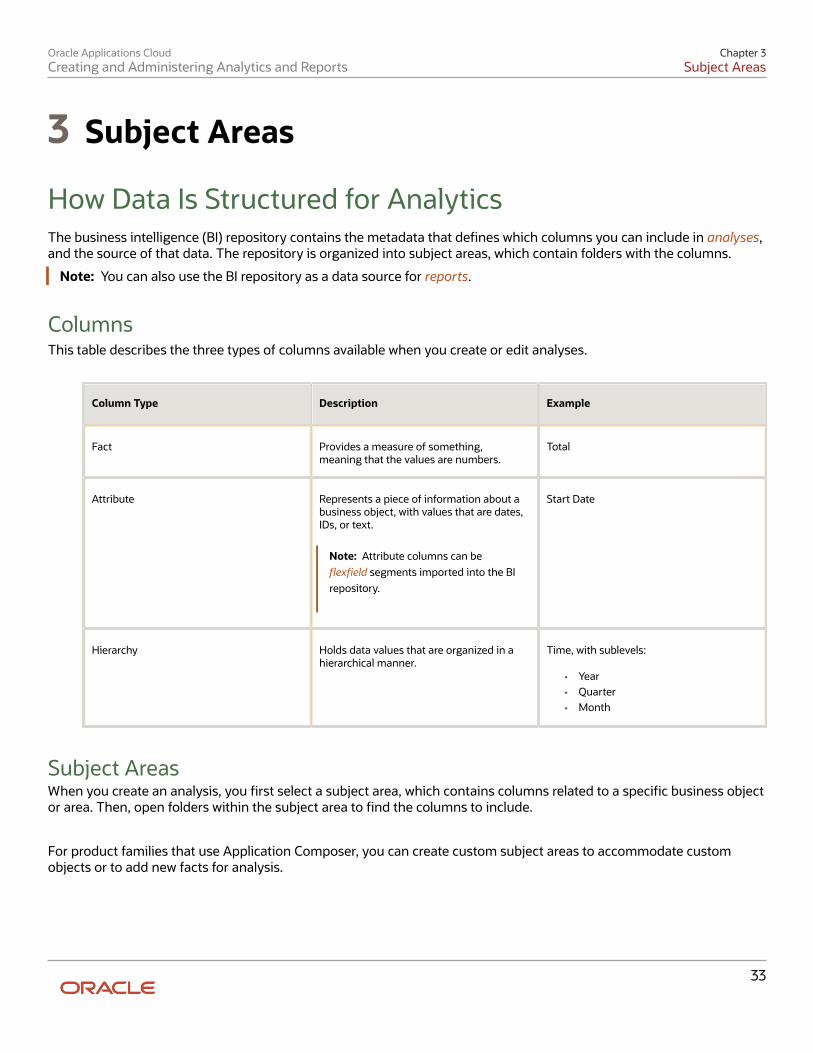
Oracle Applications CloudCreating and Administering Analytics and Reports
Chapter 3Subject Areas
33
3 Subject Areas
How Data Is Structured for AnalyticsThe business intelligence (BI) repository contains the metadata that defines which columns you can include in analyses,and the source of that data. The repository is organized into subject areas, which contain folders with the columns.
Note: You can also use the BI repository as a data source for reports.
ColumnsThis table describes the three types of columns available when you create or edit analyses.
Column Type Description Example
Fact Provides a measure of something,meaning that the values are numbers.
Total
Attribute Represents a piece of information about abusiness object, with values that are dates,IDs, or text.
Note: Attribute columns can beflexfield segments imported into the BIrepository.
Start Date
Hierarchy Holds data values that are organized in ahierarchical manner.
Time, with sublevels:
• Year• Quarter• Month
Subject AreasWhen you create an analysis, you first select a subject area, which contains columns related to a specific business objector area. Then, open folders within the subject area to find the columns to include.
For product families that use Application Composer, you can create custom subject areas to accommodate customobjects or to add new facts for analysis.
Oracle Applications CloudCreating and Administering Analytics and Reports
Chapter 3Subject Areas
34
FoldersEach subject area has one fact folder and a number of dimension folders. Folders can have subfolders.
• Fact folders:
◦ Contain fact columns.
◦ Are usually the last in a list of folders and are usually named after the subject area.
• Dimension folders:
◦ Contain attribute and hierarchical columns.
◦ Are joined to the fact folder within a subject area.
For example, if your analysis has the Currency attribute from a dimension folder, you see currencies inthe results. If you also add the Total fact, then your analysis includes only records with both a currencyand a total amount. The more columns you add, the smaller the query set for your analysis.
◦ Can be common folders, or common dimensions, that appear in more than one subject area.
If your analysis has columns from multiple subject areas, then you:
• Should include columns only from dimension folders that are common to all of those subject areas.At least one such column is required.
• Must include one column from the fact folder in each of those subject areas.
Related Topics
• Create and Modify Analyses and Dashboards
• Manage Analytics with Advanced Features
• Create and Edit Analyses Using a Wizard
• About Custom Subject Areas
Oracle Applications CloudCreating and Administering Analytics and Reports
Chapter 4Flexfields
35
4 Flexfields
Overview of Flexfield Use in AnalysesFlexfields are extensible sets of placeholder fields associated with business objects which can be placed on applicationpages. You can use flexfields to extend business objects and meet your data management requirements withoutchanging the data model or performing any database programming. To include flexfields you have used for extensionfor use in analyses, you must enable them for business intelligence.
Extension of analyses using flexfields is available for Oracle Enterprise Resource Planning Cloud and Oracle HumanCapital Management Cloud.
Flexfield TypesThe following types of flexfields are available and provide a means to modify application features without programming:
• Descriptive
• Extensible
• Key
Depending on the flexfield type, business intelligence enablement is performed differently and has differentrequirements. Once they are enabled for business intelligence, you can import any changes made to flexfieldsautomatically using an import scheduled process.
Configure Key Flexfields for Transactional BusinessIntelligence
Enable Key Flexfields for Business Intelligence ReportingTo include flexfields in your analyses, you must enable them for Business Intelligence. Extensibility of analysis usingflexfields is used for Enterprise Resource Planning and Human Capital Management. For Customer RelationshipManagement, the Extensibility Framework supports this.
To designate key flexfields as BI-enabled:
1. In the Setup and Maintenance work area, go to the Manage Key Flexfields task.2. On the Manage Key Flexfields page, enter your search value in Key Flexfield Code.3. Click Manage Structure Instances.4. Enter your search value in Structure Instance Code.5. Click Edit to display the Edit Key Flexfield Structure Instance dialog box.6. Select the BI Enabled option, then click OK.7. For each flexfield segment instance, repeat steps 5 through 6.
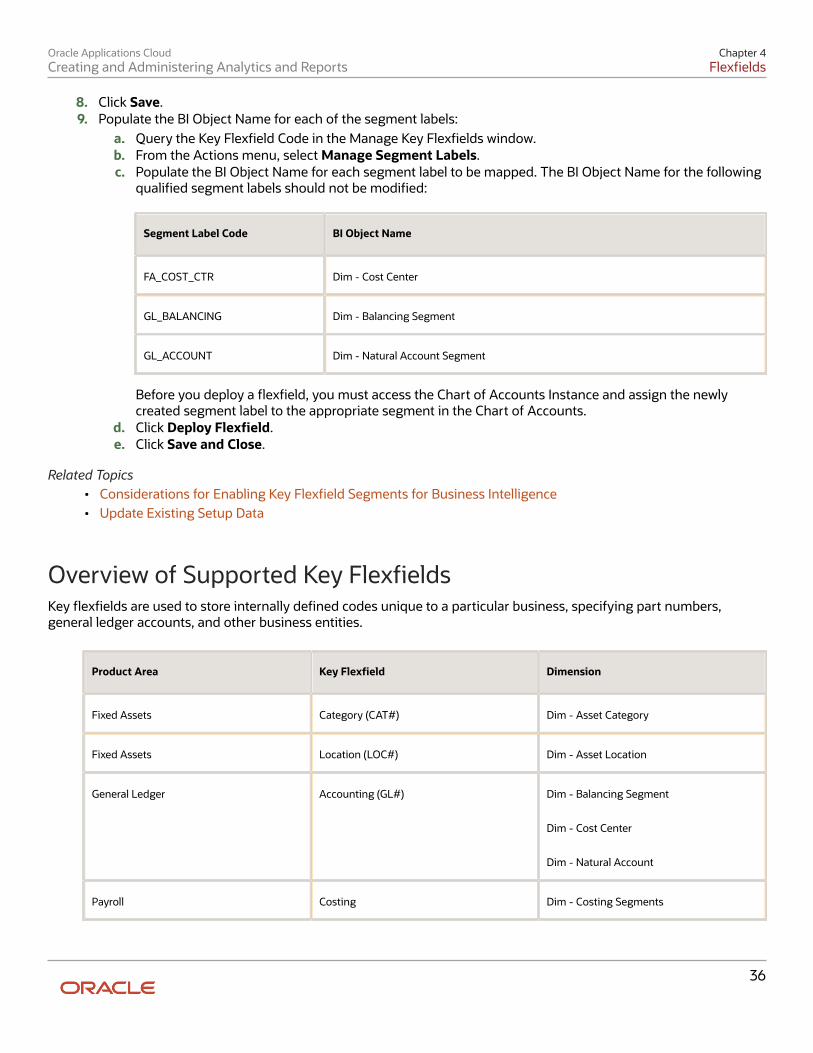
Oracle Applications CloudCreating and Administering Analytics and Reports
Chapter 4Flexfields
36
8. Click Save.9. Populate the BI Object Name for each of the segment labels:
a. Query the Key Flexfield Code in the Manage Key Flexfields window.b. From the Actions menu, select Manage Segment Labels.c. Populate the BI Object Name for each segment label to be mapped. The BI Object Name for the following
qualified segment labels should not be modified:
Segment Label Code BI Object Name
FA_COST_CTR Dim - Cost Center
GL_BALANCING Dim - Balancing Segment
GL_ACCOUNT Dim - Natural Account Segment
Before you deploy a flexfield, you must access the Chart of Accounts Instance and assign the newlycreated segment label to the appropriate segment in the Chart of Accounts.
d. Click Deploy Flexfield.e. Click Save and Close.
Related Topics• Considerations for Enabling Key Flexfield Segments for Business Intelligence• Update Existing Setup Data
Overview of Supported Key FlexfieldsKey flexfields are used to store internally defined codes unique to a particular business, specifying part numbers,general ledger accounts, and other business entities.
Product Area Key Flexfield Dimension
Fixed Assets Category (CAT#) Dim - Asset Category
Fixed Assets Location (LOC#) Dim - Asset Location
General Ledger Accounting (GL#) Dim - Balancing Segment
Dim - Cost Center
Dim - Natural Account
Payroll Costing Dim - Costing Segments
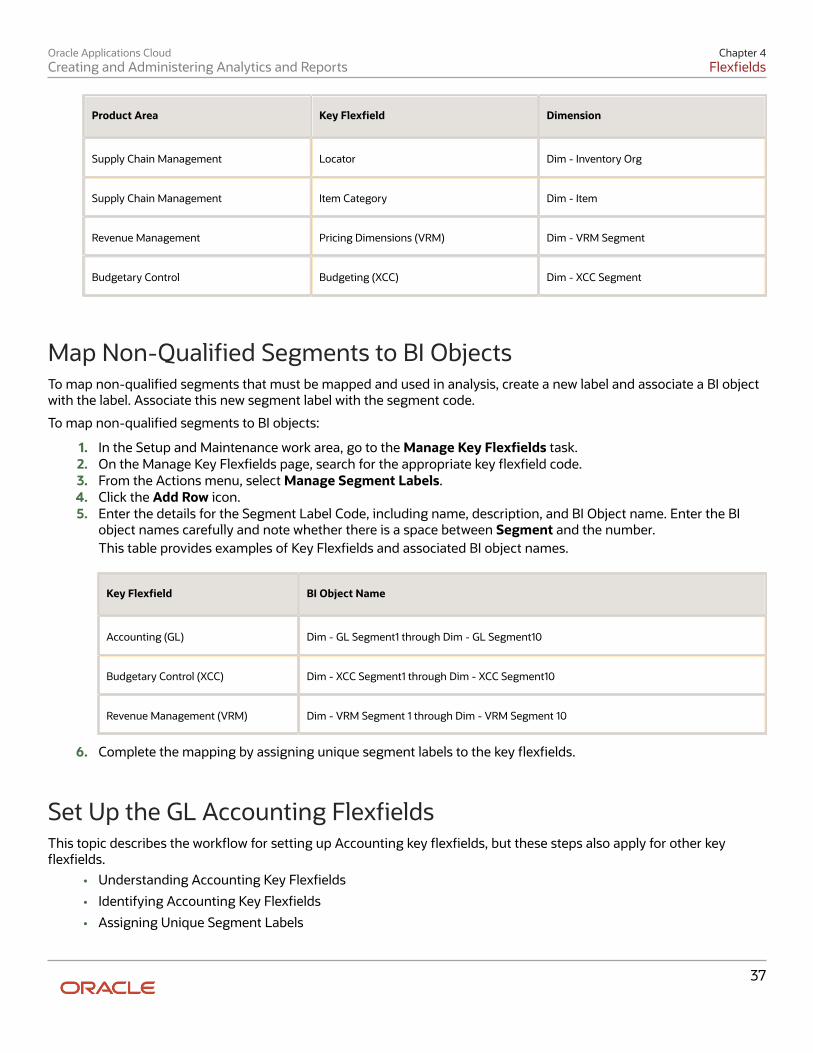
Oracle Applications CloudCreating and Administering Analytics and Reports
Chapter 4Flexfields
37
Product Area Key Flexfield Dimension
Supply Chain Management Locator Dim - Inventory Org
Supply Chain Management Item Category Dim - Item
Revenue Management Pricing Dimensions (VRM) Dim - VRM Segment
Budgetary Control Budgeting (XCC) Dim - XCC Segment
Map Non-Qualified Segments to BI ObjectsTo map non-qualified segments that must be mapped and used in analysis, create a new label and associate a BI objectwith the label. Associate this new segment label with the segment code.
To map non-qualified segments to BI objects:
1. In the Setup and Maintenance work area, go to the Manage Key Flexfields task.2. On the Manage Key Flexfields page, search for the appropriate key flexfield code.3. From the Actions menu, select Manage Segment Labels.4. Click the Add Row icon.5. Enter the details for the Segment Label Code, including name, description, and BI Object name. Enter the BI
object names carefully and note whether there is a space between Segment and the number.This table provides examples of Key Flexfields and associated BI object names.
Key Flexfield BI Object Name
Accounting (GL) Dim - GL Segment1 through Dim - GL Segment10
Budgetary Control (XCC) Dim - XCC Segment1 through Dim - XCC Segment10
Revenue Management (VRM) Dim - VRM Segment 1 through Dim - VRM Segment 10
6. Complete the mapping by assigning unique segment labels to the key flexfields.
Set Up the GL Accounting FlexfieldsThis topic describes the workflow for setting up Accounting key flexfields, but these steps also apply for other keyflexfields.
• Understanding Accounting Key Flexfields
• Identifying Accounting Key Flexfields
• Assigning Unique Segment Labels
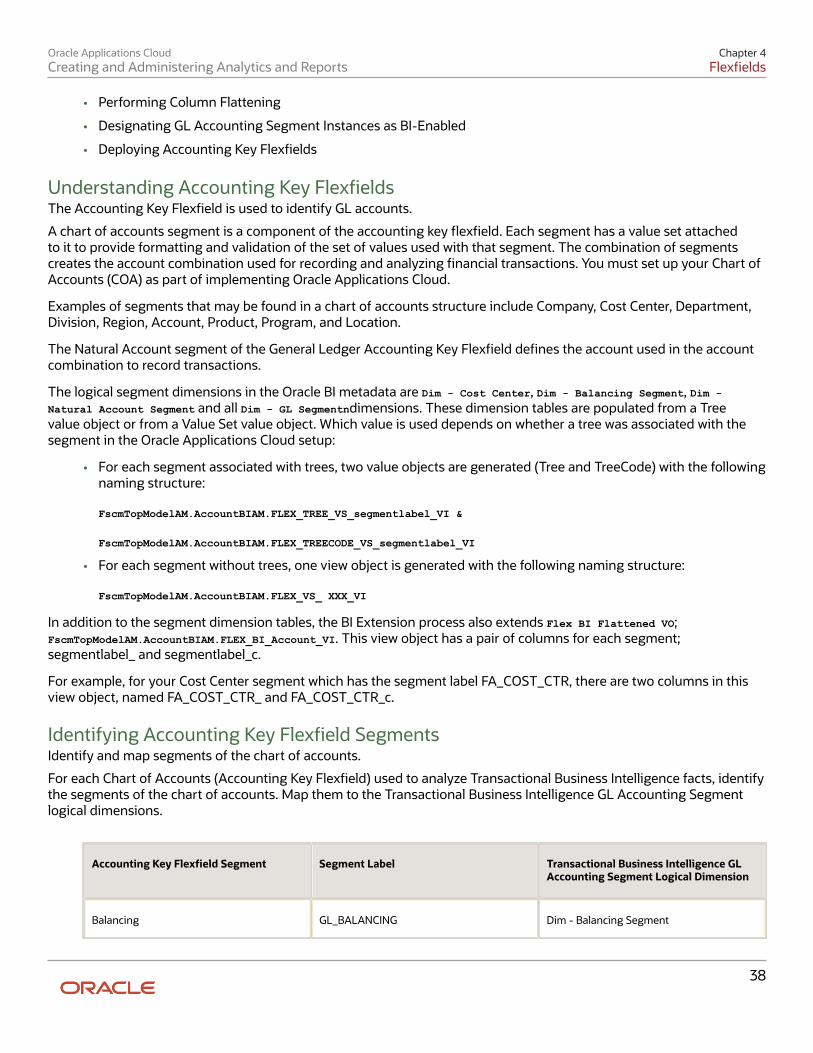
Oracle Applications CloudCreating and Administering Analytics and Reports
Chapter 4Flexfields
38
• Performing Column Flattening
• Designating GL Accounting Segment Instances as BI-Enabled
• Deploying Accounting Key Flexfields
Understanding Accounting Key FlexfieldsThe Accounting Key Flexfield is used to identify GL accounts.
A chart of accounts segment is a component of the accounting key flexfield. Each segment has a value set attachedto it to provide formatting and validation of the set of values used with that segment. The combination of segmentscreates the account combination used for recording and analyzing financial transactions. You must set up your Chart ofAccounts (COA) as part of implementing Oracle Applications Cloud.
Examples of segments that may be found in a chart of accounts structure include Company, Cost Center, Department,Division, Region, Account, Product, Program, and Location.
The Natural Account segment of the General Ledger Accounting Key Flexfield defines the account used in the accountcombination to record transactions.
The logical segment dimensions in the Oracle BI metadata are Dim - Cost Center, Dim - Balancing Segment, Dim -Natural Account Segment and all Dim - GL Segmentndimensions. These dimension tables are populated from a Treevalue object or from a Value Set value object. Which value is used depends on whether a tree was associated with thesegment in the Oracle Applications Cloud setup:
• For each segment associated with trees, two value objects are generated (Tree and TreeCode) with the followingnaming structure:
FscmTopModelAM.AccountBIAM.FLEX_TREE_VS_segmentlabel_VI &
FscmTopModelAM.AccountBIAM.FLEX_TREECODE_VS_segmentlabel_VI
• For each segment without trees, one view object is generated with the following naming structure:
FscmTopModelAM.AccountBIAM.FLEX_VS_ XXX_VI
In addition to the segment dimension tables, the BI Extension process also extends Flex BI Flattened VO;FscmTopModelAM.AccountBIAM.FLEX_BI_Account_VI. This view object has a pair of columns for each segment;segmentlabel_ and segmentlabel_c.
For example, for your Cost Center segment which has the segment label FA_COST_CTR, there are two columns in thisview object, named FA_COST_CTR_ and FA_COST_CTR_c.
Identifying Accounting Key Flexfield SegmentsIdentify and map segments of the chart of accounts.
For each Chart of Accounts (Accounting Key Flexfield) used to analyze Transactional Business Intelligence facts, identifythe segments of the chart of accounts. Map them to the Transactional Business Intelligence GL Accounting Segmentlogical dimensions.
Accounting Key Flexfield Segment Segment Label Transactional Business Intelligence GLAccounting Segment Logical Dimension
Balancing GL_BALANCING Dim - Balancing Segment
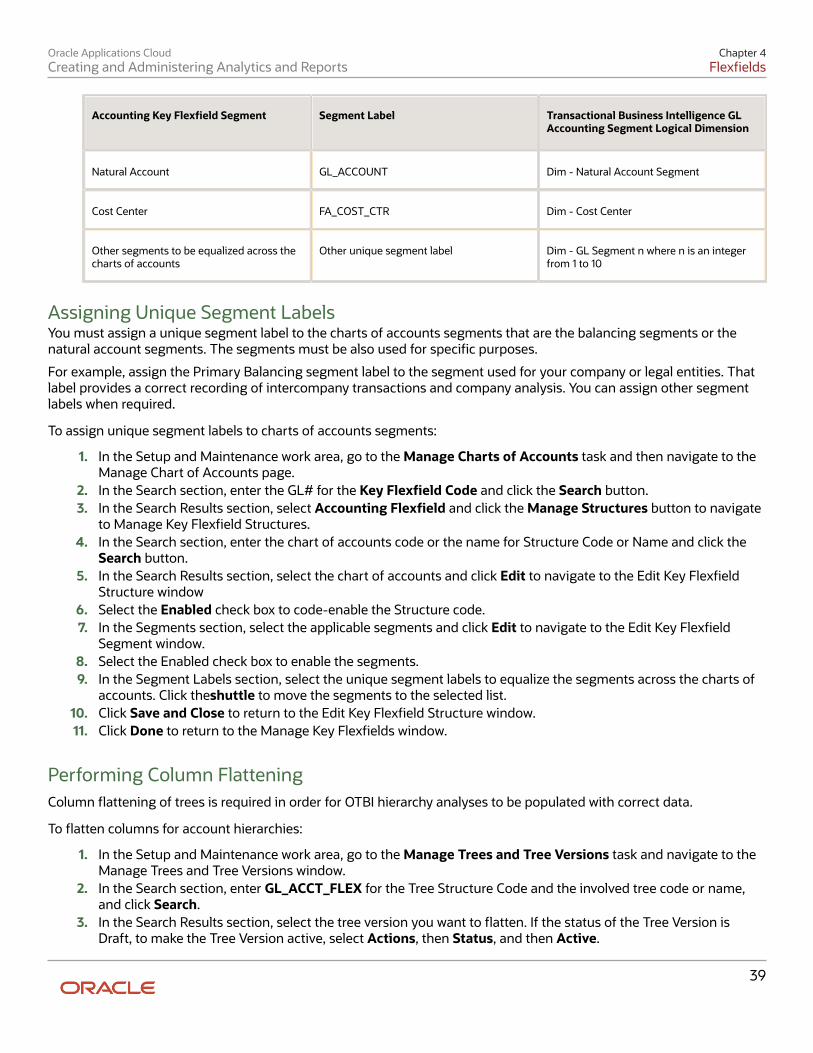
Oracle Applications CloudCreating and Administering Analytics and Reports
Chapter 4Flexfields
39
Accounting Key Flexfield Segment Segment Label Transactional Business Intelligence GLAccounting Segment Logical Dimension
Natural Account GL_ACCOUNT Dim - Natural Account Segment
Cost Center FA_COST_CTR Dim - Cost Center
Other segments to be equalized across thecharts of accounts
Other unique segment label Dim - GL Segment n where n is an integerfrom 1 to 10
Assigning Unique Segment LabelsYou must assign a unique segment label to the charts of accounts segments that are the balancing segments or thenatural account segments. The segments must be also used for specific purposes.
For example, assign the Primary Balancing segment label to the segment used for your company or legal entities. Thatlabel provides a correct recording of intercompany transactions and company analysis. You can assign other segmentlabels when required.
To assign unique segment labels to charts of accounts segments:
1. In the Setup and Maintenance work area, go to the Manage Charts of Accounts task and then navigate to theManage Chart of Accounts page.
2. In the Search section, enter the GL# for the Key Flexfield Code and click the Search button.3. In the Search Results section, select Accounting Flexfield and click the Manage Structures button to navigate
to Manage Key Flexfield Structures.4. In the Search section, enter the chart of accounts code or the name for Structure Code or Name and click the
Search button.5. In the Search Results section, select the chart of accounts and click Edit to navigate to the Edit Key Flexfield
Structure window6. Select the Enabled check box to code-enable the Structure code.7. In the Segments section, select the applicable segments and click Edit to navigate to the Edit Key Flexfield
Segment window.8. Select the Enabled check box to enable the segments.9. In the Segment Labels section, select the unique segment labels to equalize the segments across the charts of
accounts. Click theshuttle to move the segments to the selected list.10. Click Save and Close to return to the Edit Key Flexfield Structure window.11. Click Done to return to the Manage Key Flexfields window.
Performing Column FlatteningColumn flattening of trees is required in order for OTBI hierarchy analyses to be populated with correct data.
To flatten columns for account hierarchies:
1. In the Setup and Maintenance work area, go to the Manage Trees and Tree Versions task and navigate to theManage Trees and Tree Versions window.
2. In the Search section, enter GL_ACCT_FLEX for the Tree Structure Code and the involved tree code or name,and click Search.
3. In the Search Results section, select the tree version you want to flatten. If the status of the Tree Version isDraft, to make the Tree Version active, select Actions, then Status, and then Active.
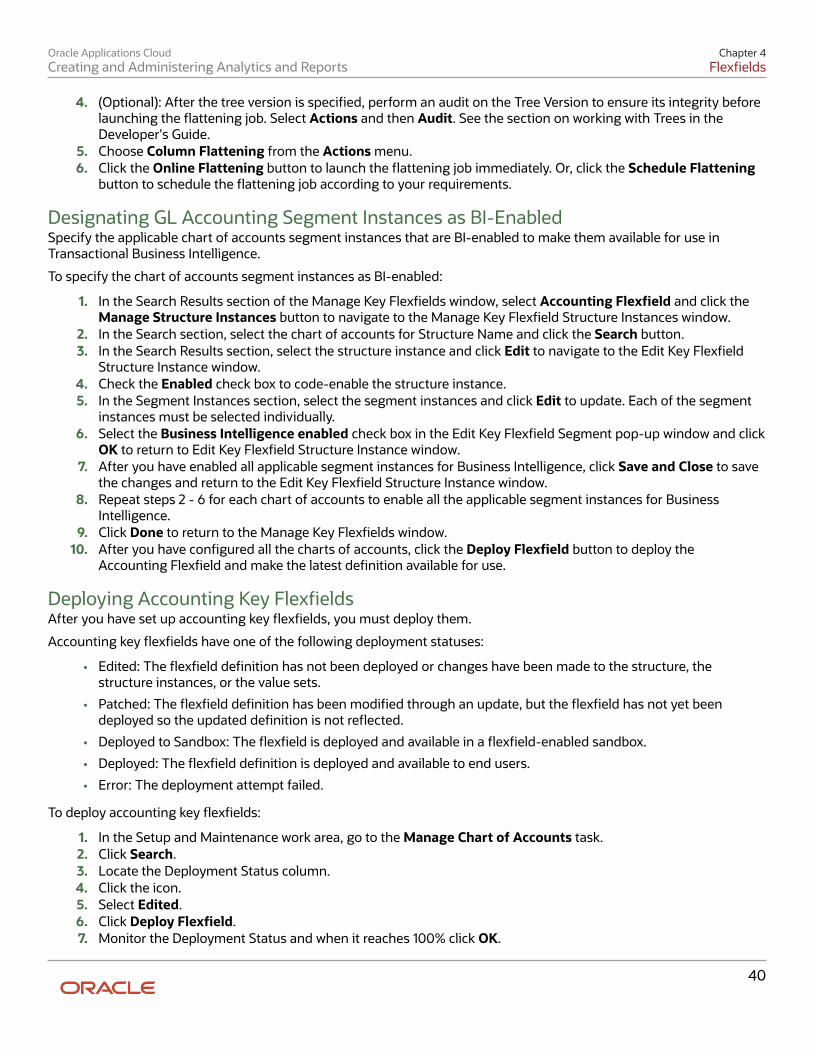
Oracle Applications CloudCreating and Administering Analytics and Reports
Chapter 4Flexfields
40
4. (Optional): After the tree version is specified, perform an audit on the Tree Version to ensure its integrity beforelaunching the flattening job. Select Actions and then Audit. See the section on working with Trees in theDeveloper's Guide.
5. Choose Column Flattening from the Actions menu.6. Click the Online Flattening button to launch the flattening job immediately. Or, click the Schedule Flattening
button to schedule the flattening job according to your requirements.
Designating GL Accounting Segment Instances as BI-EnabledSpecify the applicable chart of accounts segment instances that are BI-enabled to make them available for use inTransactional Business Intelligence.
To specify the chart of accounts segment instances as BI-enabled:
1. In the Search Results section of the Manage Key Flexfields window, select Accounting Flexfield and click theManage Structure Instances button to navigate to the Manage Key Flexfield Structure Instances window.
2. In the Search section, select the chart of accounts for Structure Name and click the Search button.3. In the Search Results section, select the structure instance and click Edit to navigate to the Edit Key Flexfield
Structure Instance window.4. Check the Enabled check box to code-enable the structure instance.5. In the Segment Instances section, select the segment instances and click Edit to update. Each of the segment
instances must be selected individually.6. Select the Business Intelligence enabled check box in the Edit Key Flexfield Segment pop-up window and click
OK to return to Edit Key Flexfield Structure Instance window.7. After you have enabled all applicable segment instances for Business Intelligence, click Save and Close to save
the changes and return to the Edit Key Flexfield Structure Instance window.8. Repeat steps 2 - 6 for each chart of accounts to enable all the applicable segment instances for Business
Intelligence.9. Click Done to return to the Manage Key Flexfields window.
10. After you have configured all the charts of accounts, click the Deploy Flexfield button to deploy theAccounting Flexfield and make the latest definition available for use.
Deploying Accounting Key FlexfieldsAfter you have set up accounting key flexfields, you must deploy them.
Accounting key flexfields have one of the following deployment statuses:
• Edited: The flexfield definition has not been deployed or changes have been made to the structure, thestructure instances, or the value sets.
• Patched: The flexfield definition has been modified through an update, but the flexfield has not yet beendeployed so the updated definition is not reflected.
• Deployed to Sandbox: The flexfield is deployed and available in a flexfield-enabled sandbox.
• Deployed: The flexfield definition is deployed and available to end users.
• Error: The deployment attempt failed.
To deploy accounting key flexfields:
1. In the Setup and Maintenance work area, go to the Manage Chart of Accounts task.2. Click Search.3. Locate the Deployment Status column.4. Click the icon.5. Select Edited.6. Click Deploy Flexfield.7. Monitor the Deployment Status and when it reaches 100% click OK.
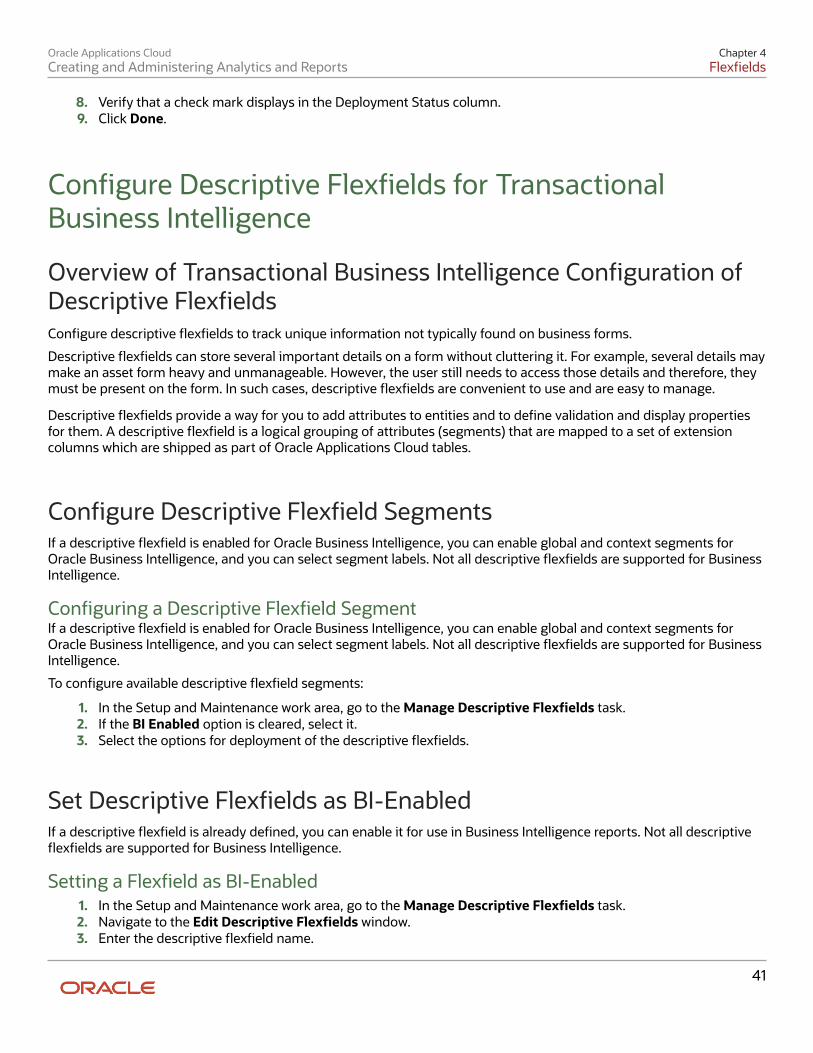
Oracle Applications CloudCreating and Administering Analytics and Reports
Chapter 4Flexfields
41
8. Verify that a check mark displays in the Deployment Status column.9. Click Done.
Configure Descriptive Flexfields for TransactionalBusiness Intelligence
Overview of Transactional Business Intelligence Configuration ofDescriptive FlexfieldsConfigure descriptive flexfields to track unique information not typically found on business forms.
Descriptive flexfields can store several important details on a form without cluttering it. For example, several details maymake an asset form heavy and unmanageable. However, the user still needs to access those details and therefore, theymust be present on the form. In such cases, descriptive flexfields are convenient to use and are easy to manage.
Descriptive flexfields provide a way for you to add attributes to entities and to define validation and display propertiesfor them. A descriptive flexfield is a logical grouping of attributes (segments) that are mapped to a set of extensioncolumns which are shipped as part of Oracle Applications Cloud tables.
Configure Descriptive Flexfield SegmentsIf a descriptive flexfield is enabled for Oracle Business Intelligence, you can enable global and context segments forOracle Business Intelligence, and you can select segment labels. Not all descriptive flexfields are supported for BusinessIntelligence.
Configuring a Descriptive Flexfield SegmentIf a descriptive flexfield is enabled for Oracle Business Intelligence, you can enable global and context segments forOracle Business Intelligence, and you can select segment labels. Not all descriptive flexfields are supported for BusinessIntelligence.
To configure available descriptive flexfield segments:
1. In the Setup and Maintenance work area, go to the Manage Descriptive Flexfields task.2. If the BI Enabled option is cleared, select it.3. Select the options for deployment of the descriptive flexfields.
Set Descriptive Flexfields as BI-EnabledIf a descriptive flexfield is already defined, you can enable it for use in Business Intelligence reports. Not all descriptiveflexfields are supported for Business Intelligence.
Setting a Flexfield as BI-Enabled1. In the Setup and Maintenance work area, go to the Manage Descriptive Flexfields task.2. Navigate to the Edit Descriptive Flexfields window.3. Enter the descriptive flexfield name.
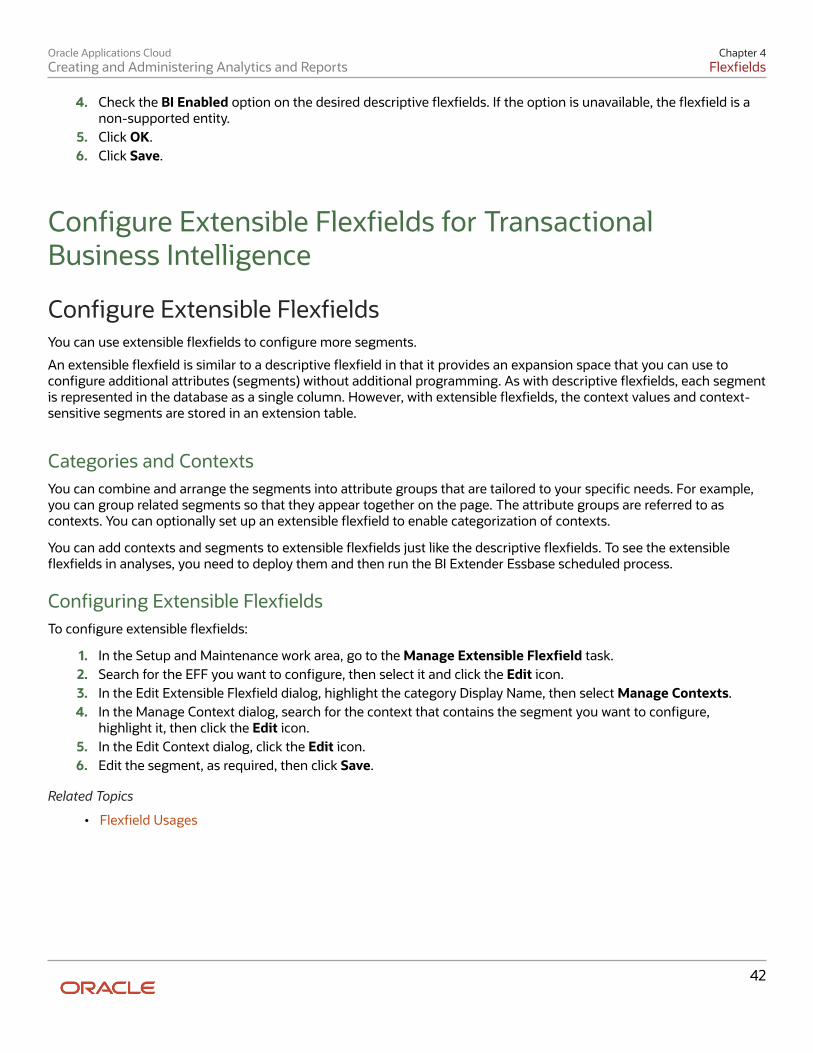
Oracle Applications CloudCreating and Administering Analytics and Reports
Chapter 4Flexfields
42
4. Check the BI Enabled option on the desired descriptive flexfields. If the option is unavailable, the flexfield is anon-supported entity.
5. Click OK.6. Click Save.
Configure Extensible Flexfields for TransactionalBusiness Intelligence
Configure Extensible FlexfieldsYou can use extensible flexfields to configure more segments.
An extensible flexfield is similar to a descriptive flexfield in that it provides an expansion space that you can use toconfigure additional attributes (segments) without additional programming. As with descriptive flexfields, each segmentis represented in the database as a single column. However, with extensible flexfields, the context values and context-sensitive segments are stored in an extension table.
Categories and ContextsYou can combine and arrange the segments into attribute groups that are tailored to your specific needs. For example,you can group related segments so that they appear together on the page. The attribute groups are referred to ascontexts. You can optionally set up an extensible flexfield to enable categorization of contexts.
You can add contexts and segments to extensible flexfields just like the descriptive flexfields. To see the extensibleflexfields in analyses, you need to deploy them and then run the BI Extender Essbase scheduled process.
Configuring Extensible FlexfieldsTo configure extensible flexfields:
1. In the Setup and Maintenance work area, go to the Manage Extensible Flexfield task.2. Search for the EFF you want to configure, then select it and click the Edit icon.3. In the Edit Extensible Flexfield dialog, highlight the category Display Name, then select Manage Contexts.4. In the Manage Context dialog, search for the context that contains the segment you want to configure,
highlight it, then click the Edit icon.5. In the Edit Context dialog, click the Edit icon.6. Edit the segment, as required, then click Save.
Related Topics
• Flexfield Usages
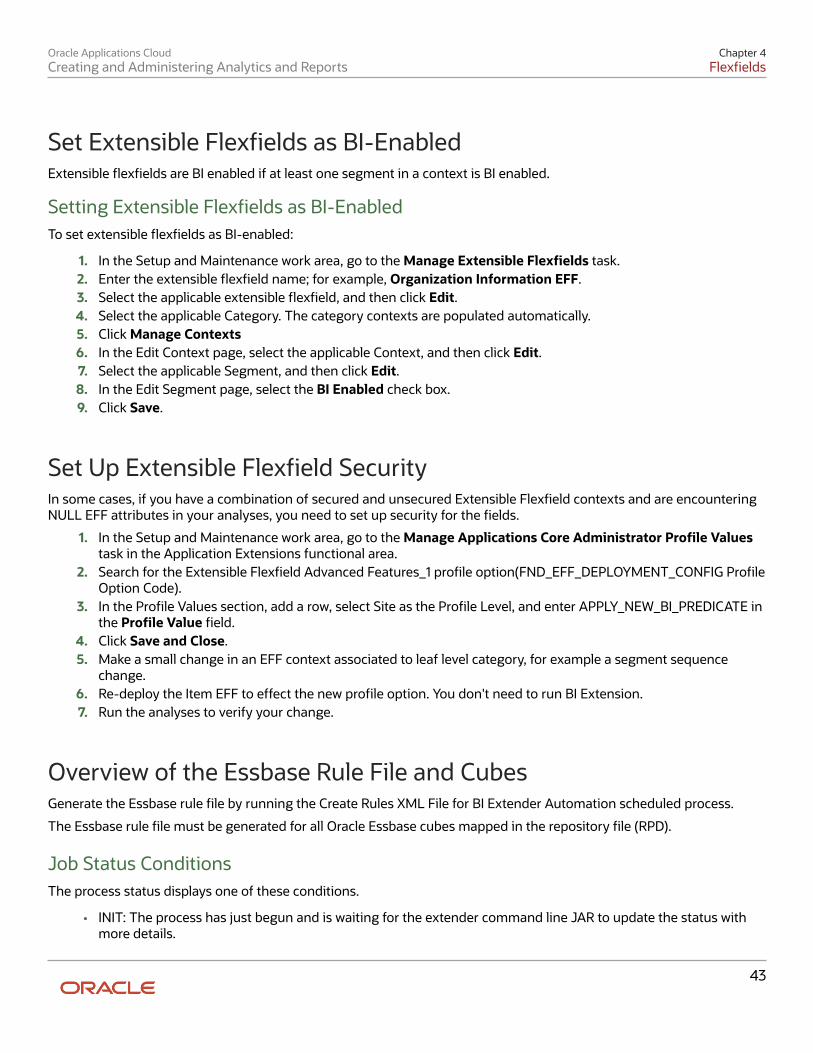
Oracle Applications CloudCreating and Administering Analytics and Reports
Chapter 4Flexfields
43
Set Extensible Flexfields as BI-EnabledExtensible flexfields are BI enabled if at least one segment in a context is BI enabled.
Setting Extensible Flexfields as BI-EnabledTo set extensible flexfields as BI-enabled:
1. In the Setup and Maintenance work area, go to the Manage Extensible Flexfields task.2. Enter the extensible flexfield name; for example, Organization Information EFF.3. Select the applicable extensible flexfield, and then click Edit.4. Select the applicable Category. The category contexts are populated automatically.5. Click Manage Contexts6. In the Edit Context page, select the applicable Context, and then click Edit.7. Select the applicable Segment, and then click Edit.8. In the Edit Segment page, select the BI Enabled check box.9. Click Save.
Set Up Extensible Flexfield SecurityIn some cases, if you have a combination of secured and unsecured Extensible Flexfield contexts and are encounteringNULL EFF attributes in your analyses, you need to set up security for the fields.
1. In the Setup and Maintenance work area, go to the Manage Applications Core Administrator Profile Valuestask in the Application Extensions functional area.
2. Search for the Extensible Flexfield Advanced Features_1 profile option(FND_EFF_DEPLOYMENT_CONFIG ProfileOption Code).
3. In the Profile Values section, add a row, select Site as the Profile Level, and enter APPLY_NEW_BI_PREDICATE inthe Profile Value field.
4. Click Save and Close.5. Make a small change in an EFF context associated to leaf level category, for example a segment sequence
change.6. Re-deploy the Item EFF to effect the new profile option. You don't need to run BI Extension.7. Run the analyses to verify your change.
Overview of the Essbase Rule File and CubesGenerate the Essbase rule file by running the Create Rules XML File for BI Extender Automation scheduled process.
The Essbase rule file must be generated for all Oracle Essbase cubes mapped in the repository file (RPD).
Job Status ConditionsThe process status displays one of these conditions.
• INIT: The process has just begun and is waiting for the extender command line JAR to update the status withmore details.
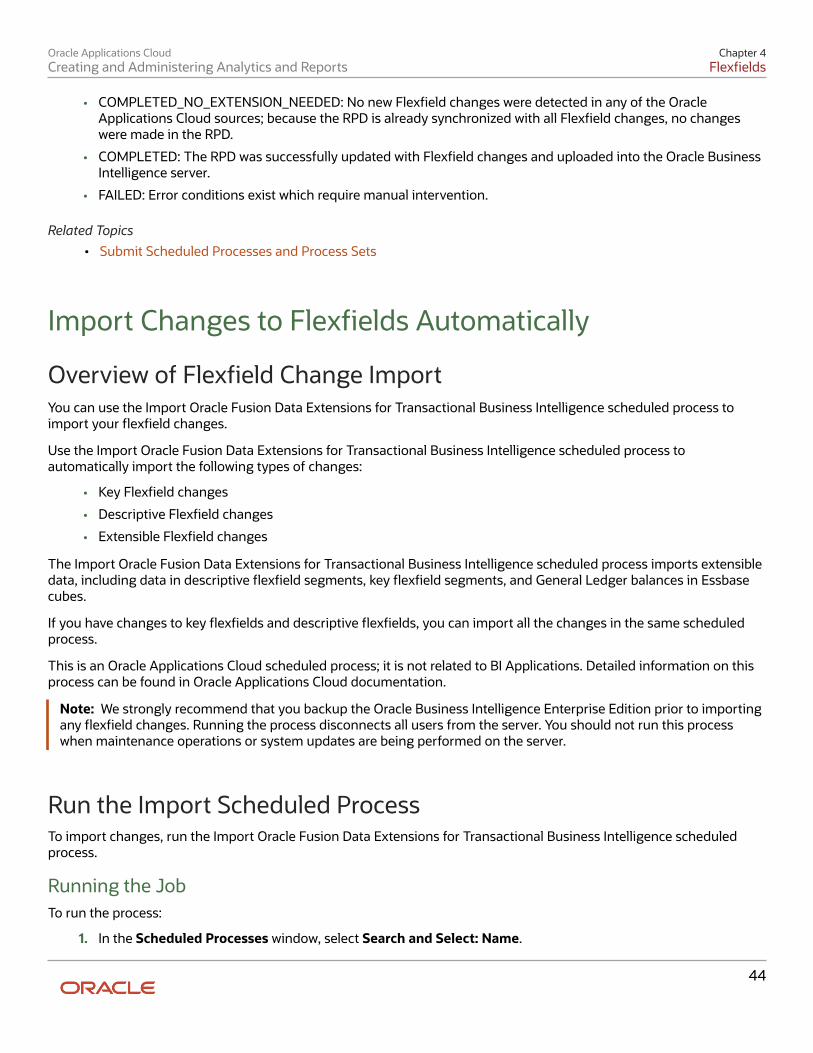
Oracle Applications CloudCreating and Administering Analytics and Reports
Chapter 4Flexfields
44
• COMPLETED_NO_EXTENSION_NEEDED: No new Flexfield changes were detected in any of the OracleApplications Cloud sources; because the RPD is already synchronized with all Flexfield changes, no changeswere made in the RPD.
• COMPLETED: The RPD was successfully updated with Flexfield changes and uploaded into the Oracle BusinessIntelligence server.
• FAILED: Error conditions exist which require manual intervention.
Related Topics• Submit Scheduled Processes and Process Sets
Import Changes to Flexfields Automatically
Overview of Flexfield Change ImportYou can use the Import Oracle Fusion Data Extensions for Transactional Business Intelligence scheduled process toimport your flexfield changes.
Use the Import Oracle Fusion Data Extensions for Transactional Business Intelligence scheduled process toautomatically import the following types of changes:
• Key Flexfield changes
• Descriptive Flexfield changes
• Extensible Flexfield changes
The Import Oracle Fusion Data Extensions for Transactional Business Intelligence scheduled process imports extensibledata, including data in descriptive flexfield segments, key flexfield segments, and General Ledger balances in Essbasecubes.
If you have changes to key flexfields and descriptive flexfields, you can import all the changes in the same scheduledprocess.
This is an Oracle Applications Cloud scheduled process; it is not related to BI Applications. Detailed information on thisprocess can be found in Oracle Applications Cloud documentation.
Note: We strongly recommend that you backup the Oracle Business Intelligence Enterprise Edition prior to importingany flexfield changes. Running the process disconnects all users from the server. You should not run this processwhen maintenance operations or system updates are being performed on the server.
Run the Import Scheduled ProcessTo import changes, run the Import Oracle Fusion Data Extensions for Transactional Business Intelligence scheduledprocess.
Running the JobTo run the process:
1. In the Scheduled Processes window, select Search and Select: Name.
Oracle Applications CloudCreating and Administering Analytics and Reports
Chapter 4Flexfields
45
2. Select Search and Select: Name.3. Highlight Import Oracle Fusion Data Extensions for Transactional Business Intelligence.4. Click OK.5. Schedule the process.
Process Status ConditionsWhen the process is finished, the biExtenderCMDUtility.jar writes the status of the process into the JNDI fileess_biExtenderEssJob_jobStatus, which can be viewed in Oracle WebLogic Server.
The process status displays one of the following conditions:
• INIT: The process has just begun and is waiting for the extender command line JAR to update the status withmore details.
• COMPLETED_NO_EXTENSION_NEEDED: No new Flexfield changes were detected in any of the OracleApplications Cloud sources; because the Oracle Business Intelligence is already synchronized with all Flexfieldchanges, no changes were made in the Oracle Business Intelligence.
• COMPLETED: Oracle Business Intelligence was successfully updated with Flexfield changes and uploaded intothe Oracle Business Intelligence Server.
• COMPLETED: PROCESS_ERRORS: Oracle Business Intelligence was updated with the Flexfield changes but withsome warnings that require manual intervention.
• FAILED: Error conditions exist that require manual intervention.
Successful Import ProcessIf the import process is successful, you can perform the following actions:
• Query subject areas by segment dimensions such as Balancing Segment and Cost Center.
• Access DFF attributes for analyses.
• Use the General Ledger - Balances Real Time subject area to query Oracle Essbase cubes.
Disable Flexfields as BI-Enabled
OverviewIf you created a flexfield that you no longer want to use or report against, you can disable the flexfield as BI-enabled.
There may be times, such as during development phases, when you try using a flexfield and later determine it is nolonger needed.
Note: If you are considering disabling flexfields, keep in mind that any flexfields created in Oracle Applications Cloudmust be designated as BI-enabled to be exposed in Transactional Business Intelligence. If you disable a flexfield, itcannot be deployed. Also, error conditions may occur if you disable a descriptive flexfield that has been implementedin BI Applications. If error conditions arise from disabling flexfields as BI-enabled, troubleshooting the errors can bedifficult and time-consuming.
Oracle Applications CloudCreating and Administering Analytics and Reports
Chapter 4Flexfields
46
Disable Key Flexfields as BI-EnabledIf you created a flexfield that you no longer want to use or report against, you can disable the flexfield as BI-enabled.
If you are considering disabling key flexfields, keep in mind that any flexfields created in Oracle Applications Cloud mustbe designated as BI-enabled to be exposed in Transactional Business Intelligence.
Disabling Key FlexfieldsTo disable key flexfields as BI-enabled:
1. In the Setup and Maintenance work area, go to the Manage Key Flexfields task.2. Enter your search value in Key Flexfield Code.3. Click Manage Structure Instances.4. Enter your search value in Structure Instance Code.5. Click Edit. The Edit Key Flexfield Structure Instance dialog box displays.6. In Edit Key Flexfield Segment Instance, deselect the BI Enabled option.7. Click OK, then Save.
Disable Descriptive Flexfields as BI-EnabledIf you created a flexfield that you no longer want to use or report against, you can disable the flexfield as BI-enabled.
If you are considering disabling descriptive flexfields, keep in mind that any flexfields created in Oracle ApplicationsCloud must be designated as BI-enabled to be exposed in Transactional Business Intelligence.
Disabling Descriptive FlexfieldsTo disable descriptive flexfields as BI-enabled:
1. In the Setup and Maintenance work area, go to the Manage Descriptive Flexfields task.2. Enter the Descriptive Flexfield Name.3. Deselect the BI Enabled option on the desired descriptive flexfields.4. Click OK, then Save.
Disable Extensible Flexfields as BI-EnabledIf you created a flexfield that you no longer want to use or report against, you can disable the flexfield as BI-enabled.
If you are considering disabling extensible flexfields, keep in mind that any flexfields created in Oracle ApplicationsCloud must be designated as BI-enabled to be exposed in Oracle Transactional Business Intelligence.
Disabling Extensible FlexfieldsTo disable extensible flexfields as BI-enabled:
1. In the Setup and Maintenance work area, go to the Manage Extensible Flexfields task.2. Enter the extensible flexfield Name; for example, "Organization Information EFF."3. Select the applicable extensible flexfield and click Edit to navigate to Edit Extensible Flexfield.4. Select the applicable Category. The category contexts are populated automatically.
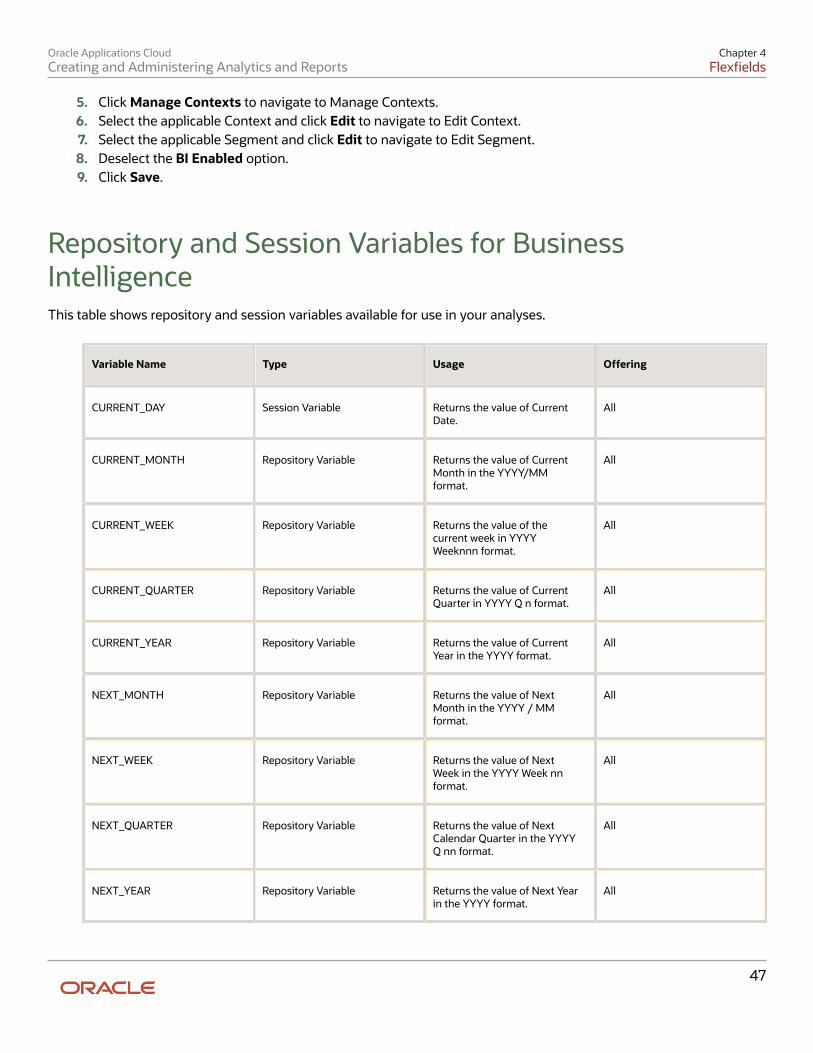
Oracle Applications CloudCreating and Administering Analytics and Reports
Chapter 4Flexfields
47
5. Click Manage Contexts to navigate to Manage Contexts.6. Select the applicable Context and click Edit to navigate to Edit Context.7. Select the applicable Segment and click Edit to navigate to Edit Segment.8. Deselect the BI Enabled option.9. Click Save.
Repository and Session Variables for BusinessIntelligenceThis table shows repository and session variables available for use in your analyses.
Variable Name Type Usage Offering
CURRENT_DAY Session Variable Returns the value of CurrentDate.
All
CURRENT_MONTH Repository Variable Returns the value of CurrentMonth in the YYYY/MMformat.
All
CURRENT_WEEK Repository Variable Returns the value of thecurrent week in YYYYWeeknnn format.
All
CURRENT_QUARTER Repository Variable Returns the value of CurrentQuarter in YYYY Q n format.
All
CURRENT_YEAR Repository Variable Returns the value of CurrentYear in the YYYY format.
All
NEXT_MONTH Repository Variable Returns the value of NextMonth in the YYYY / MMformat.
All
NEXT_WEEK Repository Variable Returns the value of NextWeek in the YYYY Week nnformat.
All
NEXT_QUARTER Repository Variable Returns the value of NextCalendar Quarter in the YYYYQ nn format.
All
NEXT_YEAR Repository Variable Returns the value of Next Yearin the YYYY format.
All
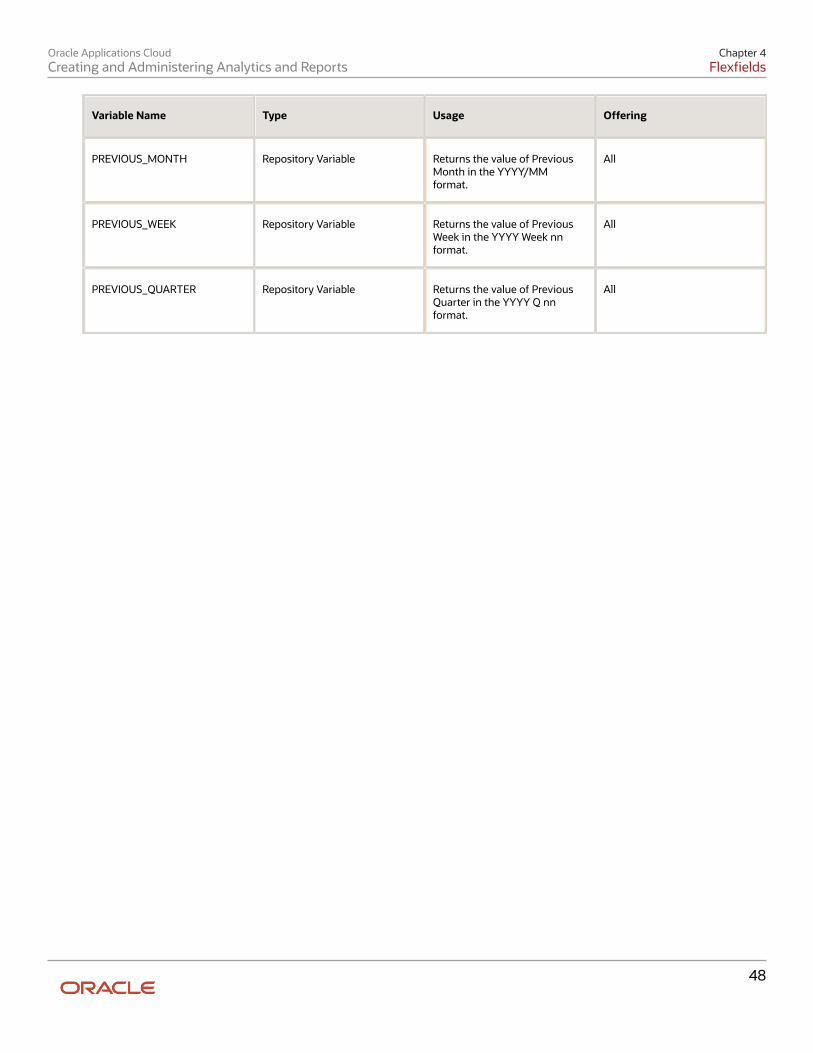
Oracle Applications CloudCreating and Administering Analytics and Reports
Chapter 4Flexfields
48
Variable Name Type Usage Offering
PREVIOUS_MONTH Repository Variable Returns the value of PreviousMonth in the YYYY/MMformat.
All
PREVIOUS_WEEK Repository Variable Returns the value of PreviousWeek in the YYYY Week nnformat.
All
PREVIOUS_QUARTER Repository Variable Returns the value of PreviousQuarter in the YYYY Q nnformat.
All
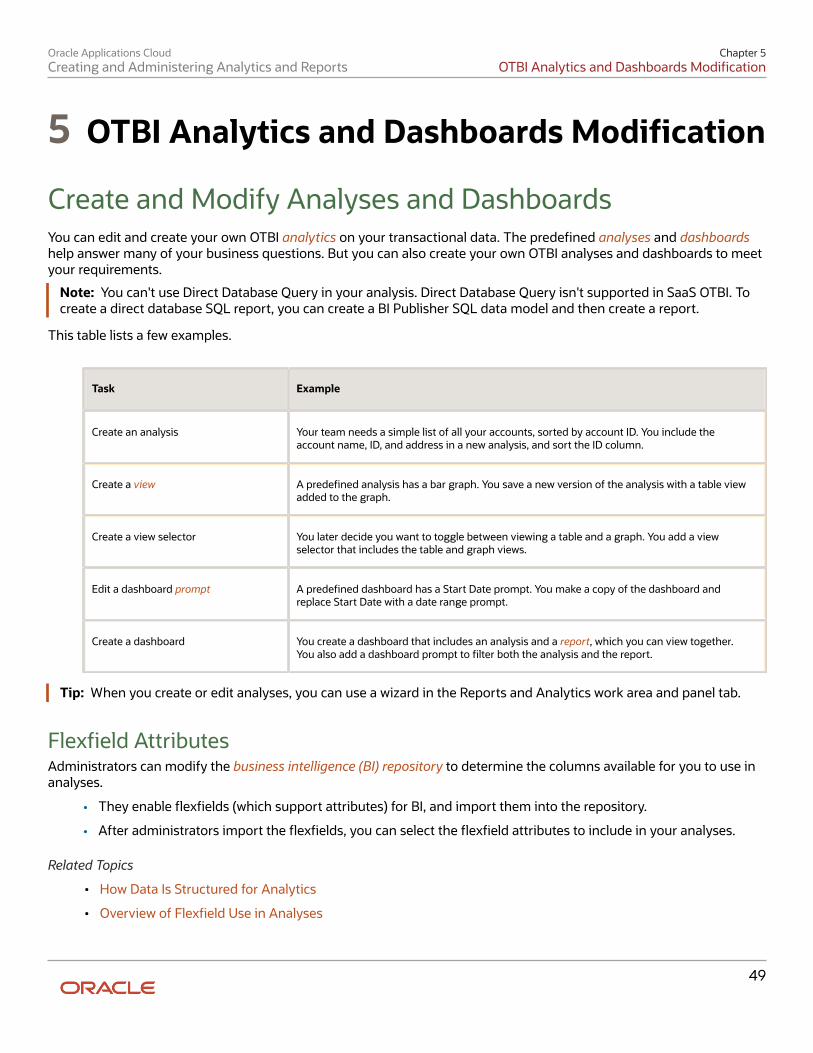
Oracle Applications CloudCreating and Administering Analytics and Reports
Chapter 5OTBI Analytics and Dashboards Modification
49
5 OTBI Analytics and Dashboards Modification
Create and Modify Analyses and DashboardsYou can edit and create your own OTBI analytics on your transactional data. The predefined analyses and dashboardshelp answer many of your business questions. But you can also create your own OTBI analyses and dashboards to meetyour requirements.
Note: You can't use Direct Database Query in your analysis. Direct Database Query isn't supported in SaaS OTBI. Tocreate a direct database SQL report, you can create a BI Publisher SQL data model and then create a report.
This table lists a few examples.
Task Example
Create an analysis Your team needs a simple list of all your accounts, sorted by account ID. You include theaccount name, ID, and address in a new analysis, and sort the ID column.
Create a view A predefined analysis has a bar graph. You save a new version of the analysis with a table viewadded to the graph.
Create a view selector You later decide you want to toggle between viewing a table and a graph. You add a viewselector that includes the table and graph views.
Edit a dashboard prompt A predefined dashboard has a Start Date prompt. You make a copy of the dashboard andreplace Start Date with a date range prompt.
Create a dashboard You create a dashboard that includes an analysis and a report, which you can view together.You also add a dashboard prompt to filter both the analysis and the report.
Tip: When you create or edit analyses, you can use a wizard in the Reports and Analytics work area and panel tab.
Flexfield AttributesAdministrators can modify the business intelligence (BI) repository to determine the columns available for you to use inanalyses.
• They enable flexfields (which support attributes) for BI, and import them into the repository.
• After administrators import the flexfields, you can select the flexfield attributes to include in your analyses.
Related Topics
• How Data Is Structured for Analytics
• Overview of Flexfield Use in Analyses
Oracle Applications CloudCreating and Administering Analytics and Reports
Chapter 5OTBI Analytics and Dashboards Modification
50
Analyses
Create and Edit Analyses Using a WizardUse the wizards to quickly create and edit your analyses. You can use a wizard to create and edit most of your analytics,for example to select columns, add filters or views. You can also use advanced business intelligence features to create oredit dashboards or manage analyses and other objects in the catalog.
1. Start the wizard from the Reports and Analytics work area or the Reports and Analytics panel tab (if available).
◦ To create a new analysis click Create and select Analysis. Select a subject area for your analysis and clicktheContinue button.
◦ To edit an existing analysis, in the Reports and Analytics work area, select it in a folder or the favorites list,click its ellipsis icon and select Edit. In the Reports and Analytics panel tab, click the analysis, then clickEdit.
2. In the Select Columns page, optionally, click Add/Remove Subject Areas and, in the Add/Remove SubjectAreas dialog box, select more subject areas or remove any that you no longer need, and click OK. You can'tremove the original subject area selected for the analysis. To remove any other subject area, first remove itscolumns from the analysis.
3. From here on, make selections in a series of analysis-definition pages, selecting Next or Back to navigateamong them.
◦ In the Select Columns page, expand your subject area and folders within it to choose the columns toinclude in your analysis. Also set options for those columns.
◦ In the Select Views page, determine whether your analysis is to include a table, a graph, or both. Foreither, select among several types. If you include both, select the order in which they appear.
◦ In Edit Table and Edit Graph pages, select options that apply to your table and graph layouts. Each ofthese pages is active only if you selected the item it applies to in the Select Views page.
◦ In the Sort and Filter page, optionally apply filters to columns to refine the selection of records in youranalysis, and apply sorts to them to order your results.
◦ In the Highlight page, optionally add color highlights based on numeric thresholds you set.
◦ In the Save page, enter a name for the analysis, select a catalog folder to save it in, and click Submit.
In general, these pages are designed so that procedures for using them are readily apparent. Even so, here are somethings you will want to know.
Select Columns PageFor each column in your analysis, you select an Interaction option.
• Two of the options, Default and Drill, do the same thing: If you click on a column header, the analysis adds acolumn displaying values at the next hierarchical level. (For example, if you click on Control Name, the analysisadds a Control ID column.) If you click on a column value, the analysis adds the subordinate column, but alsofilters to display only records containing the value you clicked.
• Navigate to Transaction: If you click on a value from a column for which this option is set, the analysis presentsa link to the record of an object the value applies to.
For such links to work, however, further configuration is required: You need to define paths to the recordsthat are to be opened. If you want to use this option, you're probably better off creating the analysis in the BI
Oracle Applications CloudCreating and Administering Analytics and Reports
Chapter 5OTBI Analytics and Dashboards Modification
51
Catalog. However, you can create it in the wizard, then edit it in the BI Catalog. See the topic titled Link Analysesto Application Pages.
• None: This option in effect turns the Default option off and turns nothing on. Nothing happens if you click on avalue in a column for which this option is set.
For each column, you can also select a Hidden option. This prevents the analysis from displaying the column, but leavesits values available for use behind the scenes, for example in filters.
Select Views PageYou can add a graph to your analysis only if it includes at least one column from a fact folder. (You can include a tablein your analysis no matter what columns you select for it.) A fact column contains numeric values, such as counts ofincidents returned by advanced controls. Other columns contain attributes of objects, such as names of advancedcontrols. Without numeric values, there's nothing to base a graph on.
You can create a title for the analysis in this page, but doing so is optional. You also create a name for the analysis in theSave page, and that one is required. If you create both, the analysis displays both; they don't have to be the same.
You can use a Preview option to ensure the analysis returns data you expect. Turn it on or off in this page or insubsequent wizard pages. Once it's on, the preview remains on in other wizard pages you navigate to, unless you turn itoff.
Edit Table PageHere are the layout options you can select for tables:
• Columns: This is the default. Each column you assign this value to appears as a column in the table.
• Prompt For: In a prompt field, you select among values from the column you're configuring. For example, youwould select a date if the column were Calendar Month Start Date. The table would then display only rowscontaining the value you selected.
• Section By: The table is divided into sections. Each value of the column you're configuring becomes a header,and the section beneath each header includes rows containing that value.
• Excluded: The column you select is no longer available to the view you're configuring. The column is hidden,and its values are unavailable for behind-the-scenes tasks such as filtering. However, the column remainsavailable to other views in your analysis.
Edit Graph PageYou can't apply layout options to fact columns. For other columns, graph layout options include Prompt For, Section By,and Excluded, which have the same effect as they do in tables. You can also apply these options in graphs:
• Vary Color By: Each value in the column you're configuring is represented by a distinct color in the graph.
• Group By: Values in the columns you assign this option to are combined in the graph. For example, if you selectthis option for the State and Calendar Month Start Date columns in a bar graph, each bar represents a particularstatus on a particular date.
Highlight PageYou can use this feature only if your analysis includes at least one fact column, and you can apply it only to factcolumns.
Related Topics
• View Analytics, Reports, and Dashboards
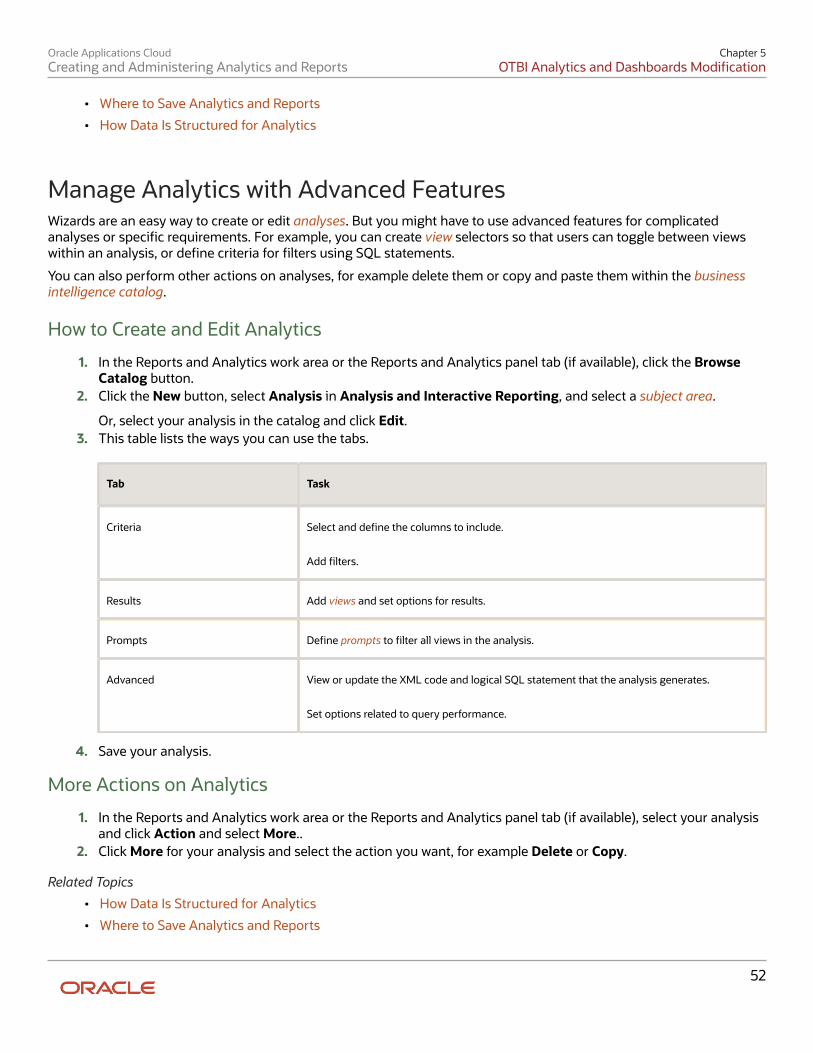
Oracle Applications CloudCreating and Administering Analytics and Reports
Chapter 5OTBI Analytics and Dashboards Modification
52
• Where to Save Analytics and Reports
• How Data Is Structured for Analytics
Manage Analytics with Advanced FeaturesWizards are an easy way to create or edit analyses. But you might have to use advanced features for complicatedanalyses or specific requirements. For example, you can create view selectors so that users can toggle between viewswithin an analysis, or define criteria for filters using SQL statements.
You can also perform other actions on analyses, for example delete them or copy and paste them within the businessintelligence catalog.
How to Create and Edit Analytics
1. In the Reports and Analytics work area or the Reports and Analytics panel tab (if available), click the BrowseCatalog button.
2. Click the New button, select Analysis in Analysis and Interactive Reporting, and select a subject area.
Or, select your analysis in the catalog and click Edit.3. This table lists the ways you can use the tabs.
Tab Task
Criteria Select and define the columns to include.
Add filters.
Results Add views and set options for results.
Prompts Define prompts to filter all views in the analysis.
Advanced View or update the XML code and logical SQL statement that the analysis generates.
Set options related to query performance.
4. Save your analysis.
More Actions on Analytics
1. In the Reports and Analytics work area or the Reports and Analytics panel tab (if available), select your analysisand click Action and select More..
2. Click More for your analysis and select the action you want, for example Delete or Copy.
Related Topics
• How Data Is Structured for Analytics
• Where to Save Analytics and Reports
Oracle Applications CloudCreating and Administering Analytics and Reports
Chapter 5OTBI Analytics and Dashboards Modification
53
How can I provide access to a custom analysis or report to multipleusers?By default, shared analyses and reports are owned by the duty role of the user who created them. All users with thatduty role are able to view, modify, and save the objects.
Cross-Subject Area Joins
Overview of Cross-Subject Area JoinsYou can create analyses that combine data from more than one subject area, or cross-subject area analyses. Reviewguidelines for creating these joins in MyOracle Support (Doc ID 1567672.1). Cross-subject area analyses can be classifiedinto three broad categories:
• Using common dimensions.
• Using common and local dimensions.
• Combining more than one result set from different subject areas using set operators such as union, union all,intersection and difference.
Common DimensionsA common dimension is a dimensional attribute that exists in all subject areas in the analysis. These dimensions areconsidered common dimensions between subject areas and can be used to build a cross-subject area report.
Common and Local DimensionsA local dimension is available only in one of the combined subject areas in a cross-subject area query.
Create a Cross-Subject Area AnalysisTo create a cross-subject area analysis, include a measure from each subject area to support the join if it uses a localdimension. You can hide the measure in the results if you don't want it to appear in your analysis. Note that the subjectareas have to be from the same Oracle Cloud application.
How to Create a Cross-Subject Area Analysis
1. In the Reports and Analytic work area, click Browse Catalog.2. Click New and select Analysis3. Select a subject area.4. In the Criteria tab, expand the dimensions and add a column to the analysis.5. In the Subject Areas region, click Add/Remove Subject Areas.6. In the Subject Area region of the Criteria tab, expand the dimensions and add a column to the analysis.
Oracle Applications CloudCreating and Administering Analytics and Reports
Chapter 5OTBI Analytics and Dashboards Modification
54
7. If the column is a local dimension, add a measure from the subject area. In any join query, you must add atleast one measure from all subject areas involved, otherwise unexpected results or errors might occur. If it'spreferable to hide the measure in your analysis, select its Column Properties, and in the Column Format tab ofthe Column Properties dialog box, select the Hide check box and click OK.
8. If you're using a local dimension, in the Advanced tab, navigate to the Advanced SQL Clauses section, selectShow Total value for all measures on unrelated dimensions, then click Apply SQL.
9. Click the Results tab to see the analysis results.10. Click the Criteria tab again to return to the analysis definition.
Dashboards
Create and Edit DashboardsYou can create and edit dashboards and define their content and layout to organize your analytics and other objects tocreate meaningful and navigable palettes of information. In addition to objects in the business intelligence (BI) catalog,such as analyses, reports, and prompts, you can add text, sections, and more to a dashboard.
Create a Dashboard
1. Open the Reports and Analytics work area, or the Reports and Analytics panel tab (if available).2. Click Browse Catalog.3. Click New and select Dashboard.4. Enter the dashboard's name and description, and select a folder to save in.5. With the Add content now option selected, click OK.6. Optionally, add more pages, or tabs, within the dashboard.7. Bring items from the Dashboard Objects or Catalog pane to add content to a page.8. Click Save.
Note: The first dashboard page is saved with the page 1 name by default. To rename this page:1. Click the Catalog link.2. In the Folders pane, select your dashboard.3. For page 1, click More and select Rename.4. Enter the new name and click OK.
Edit a Dashboard
1. In the Reports and Analytics work area or the Reports and Analytics panel tab (if available) select yourdashboard in the pane and click More.
2. Select your dashboard in the pane and click More.3. Click Edit.4. Perform steps 6 and 7 from the preceding Creating Dashboards task, and make other changes as needed, for
example:
◦ Remove content from the dashboard.
◦ Move content around.
◦ Change the layout of a page.
Oracle Applications CloudCreating and Administering Analytics and Reports
Chapter 5OTBI Analytics and Dashboards Modification
55
Related Topics
• Where to Save Analytics and Reports
FAQs for Analyses and Dashboards
What are subject areas, dimensions, attributes, facts, and metrics?Information for your analytics is grouped into related functional areas called subject areas that contain fact anddimension folders with metrics and columns you can add to your analyses.
Dimension folders include the grouping of dimensional attributes for the subject area. Columns (such as date of birthor name) that are grouped for a dimension are known as attributes. Fact folders contain formulas for getting calculatednumeric values, such as counts, sums, and percentages.
What's the relationship between dimensions and fact in a subjectarea?A subject area is based around a single fact. The dimensions are all related to each other through the fact only. The factis automatically included in any query that's created, even if none of the measures in the fact appear in the analysis.
What's a common dimension?A common dimension is shared across multiple subject areas. For example, Time, Department, and Location arecommon dimensions. When constructing a cross-subject area analysis, only common dimensions can be used.
How can I determine which dimensions are shared across twosubject areas?If the dimensions exist in both subject areas, they're common dimensions, and are often among the first folders in asubject area. You can join any subject areas you have access to in Answers, but analyses are subject to the normalizeddata structure. Unless the underlying tables are joined by design, joining subject areas in Answers results in errors.
How can I identify subject areas to create analyses?All OTBI subject area names end with the words "Real Time".
Oracle Applications CloudCreating and Administering Analytics and Reports
Chapter 5OTBI Analytics and Dashboards Modification
56
Can I change the columns in subject areas?You can use only the available subject areas and their dimensions and facts. You can use other The data elements thatare provided out of the box are the only ones that the customers can make use of. You can potentially use BI-enabledflexfields to analyze any column in the transactional tables.
Do analyses query transactional tables to display data?Analyses run real-time queries of transactional tables through View Objects. Oracle Fusion data security, flexfields, userinterface hints, lists of values, and other metadata are delivered through the View Objects.
Why did my agent not translate according to my locationpreferences?The translation of your agents depends on how you run them and how the session is established.
If you navigate to the BI Catalog from the Reports and Analytics work area, the session information doesn't affecttranslation, so the default location is applied. If you navigate directly to Oracle Business Intelligence Enterprise Edition(for example: http://host:port/analytics/saw.dll), the Locale (location) settings for your session in My Account areapplied to the data.
What's a dashboard?A dashboard is a container page to display analyses, reports, and other objects. Administrators can create shareddashboards for groups of users with common responsibilities or job functions. Personalized views can be created basedon a user's permissions.
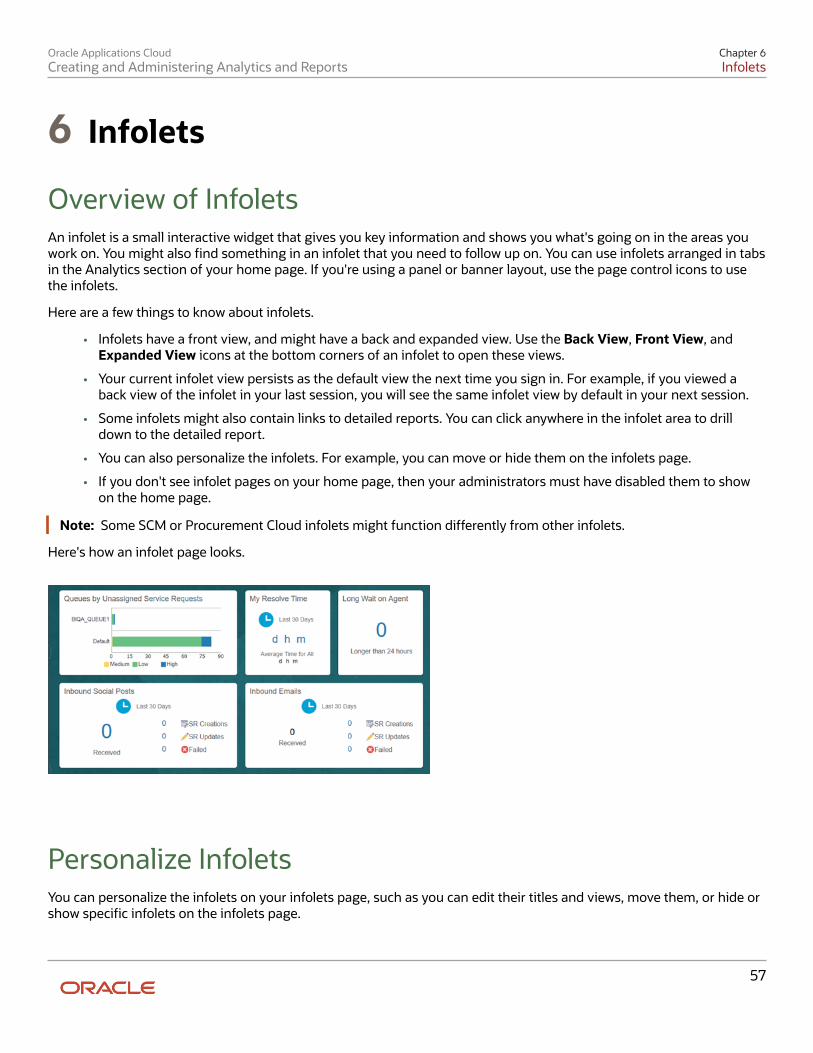
Oracle Applications CloudCreating and Administering Analytics and Reports
Chapter 6Infolets
57
6 Infolets
Overview of InfoletsAn infolet is a small interactive widget that gives you key information and shows you what's going on in the areas youwork on. You might also find something in an infolet that you need to follow up on. You can use infolets arranged in tabsin the Analytics section of your home page. If you're using a panel or banner layout, use the page control icons to usethe infolets.
Here are a few things to know about infolets.
• Infolets have a front view, and might have a back and expanded view. Use the Back View, Front View, andExpanded View icons at the bottom corners of an infolet to open these views.
• Your current infolet view persists as the default view the next time you sign in. For example, if you viewed aback view of the infolet in your last session, you will see the same infolet view by default in your next session.
• Some infolets might also contain links to detailed reports. You can click anywhere in the infolet area to drilldown to the detailed report.
• You can also personalize the infolets. For example, you can move or hide them on the infolets page.
• If you don't see infolet pages on your home page, then your administrators must have disabled them to showon the home page.
Note: Some SCM or Procurement Cloud infolets might function differently from other infolets.
Here's how an infolet page looks.
Personalize InfoletsYou can personalize the infolets on your infolets page, such as you can edit their titles and views, move them, or hide orshow specific infolets on the infolets page.
Oracle Applications CloudCreating and Administering Analytics and Reports
Chapter 6Infolets
58
Edit Infolet Titles and Views1. Click the Actions icon on the top right corner of the infolet, and select Edit Title and Views.2. Edit the infolet title, and enable or disable the infolet views.3. Click Save and Close.
Reorder InfoletsYou can change the position of an infolet within an infolet page.
1. Click the Infolet Repository icon, and select Reorder Infolets.2. In the Reorder Infolets dialog box, select the infolets, and use the arrows to reorder them.
Tip: To select multiple infolets, press the Ctrl key, and then select them.
3. Click Apply.
Hide or Show InfoletsTo hide an infolet from an infolet page, click the Infolet Repository icon, and deselect the infolet from the list ofinfolets.
Tip: Alternatively, click the Actions icon on the top right corner of the infolet, and select Hide.
To show a hidden infolet on an infolet page, click the Infolet Repository icon, and select the infolet from the list ofinfolets.
Related Topics• Configure Infolet Display
Configure Infolets
Overview of Configuring InfoletsYou can configure infolets that aggregate key information for a specific area, for example, social networking or personalprofile. Your users use infolets arranged in tabs in the Analytics section of the home page. Or, if it's a home page with apanel or banner layout, they use the page control icons.
If your users don't find infolet pages on the home page, you can enable them by using the Home Configuration tab inthe Structure work area. Let's look at some tasks you can do to configure infolets.
• Create infolets.
• Add content to infolets. For example, you can add a task flow or a performance tile report, and if an infoletcontains a performance tile report, then you can add a link to a detailed report in the same infolet.
Note: In the context of infolets, a report is an analysis, not a BI Publisher report.
• Edit infolets. For example, edit infolet content and add, change, or remove link to detailed report.
Oracle Applications CloudCreating and Administering Analytics and Reports
Chapter 6Infolets
59
• Delete infolets.
But before you start creating and editing infolets, here are a few things to keep in mind:
• You can add analyses from the catalog to an infolet, but not BI Publisher reports, or other objects like filters orprompts.
• To create or edit infolets, you must first either create and activate a sandbox, or activate an existing one. Butmake sure the sandbox has the Page Composer tool selected. If you want to make changes in a context layerthat isn't the default layer, Site, you must create a separate sandbox just to use Page Composer in it. You canthen change the context layer from Site to the other layer. For example, to create or edit infolets for a user witha specific job role, you must select the Job Role context layer.
• You can validate your changes in the sandbox in preview mode before you publish it.
Related Topics• Configure Infolet Display• Best Practices for Using Page Composer in Sandboxes
Create InfoletsWatch video
Use infolet pages to create infolets. You can create an infolet, add content to it, and link detailed reports. For someproduct-specific infolet pages, you can't create infolets.
1. Activate a sandbox that has the Page Composer tool in it.2. Open an infolet page.3. Click your user image or name in the global header, and on the Settings and Actions menu, select Edit Pages.4. Click the Infolet Repository icon, and select Create Infolet.
Note: If you can't find the Create Infolet menu item, it means you can't create infolets for thispage.
5. Enter a title for the infolet and set its views.
◦ Specify the dimensions for the front view.
◦ Enable or disable the back view.
◦ Enable or disable the expanded view, and specify its dimensions. The dimensions of the front and theback views must be the same, but the expanded view must be bigger because it displays more details.
6. Click Save and Close. You can now add content to infolets.
Add Content to InfoletsYou can add content to the infolet's front, back, or expanded view. You can't add a business intelligence dashboard to aninfolet because a dashboard report is generally bigger than an infolet.
1. Select the infolet's view that you want to add content to.
Note: To open infolet's back view, click the Back View icon on the bottom right corner of the infolet. Andto open expanded view, click the Expanded View icon on the bottom right corner of the infolet's back view.
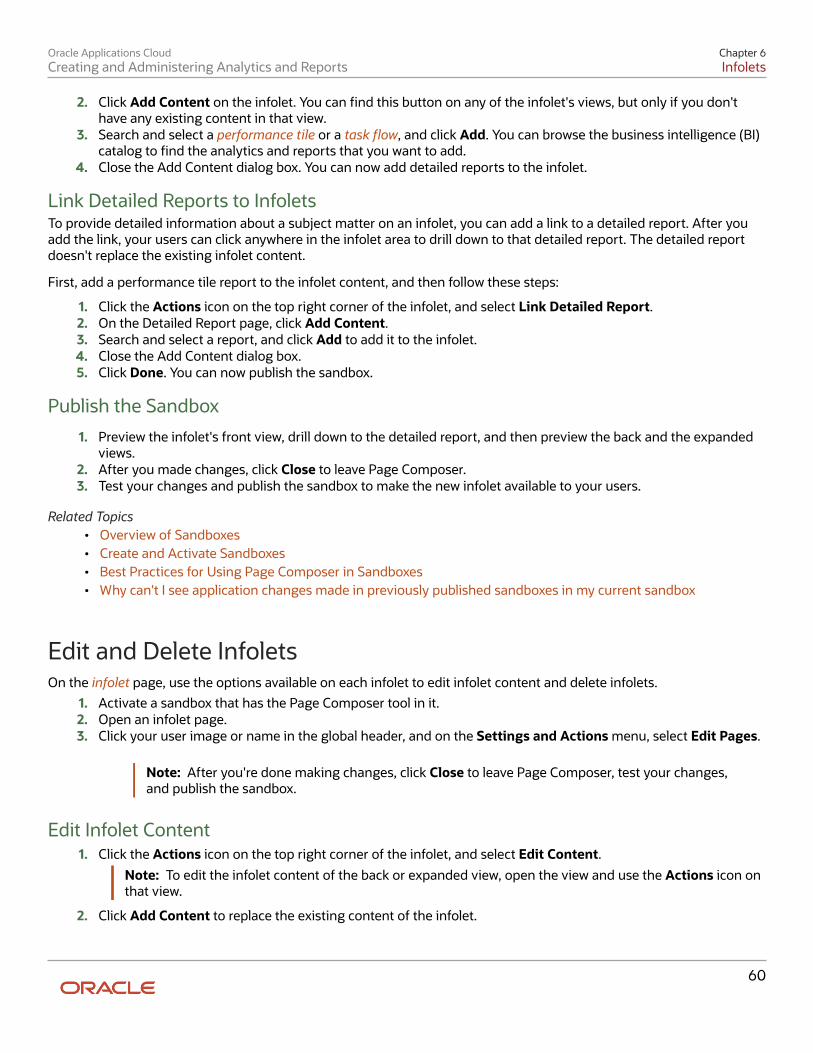
Oracle Applications CloudCreating and Administering Analytics and Reports
Chapter 6Infolets
60
2. Click Add Content on the infolet. You can find this button on any of the infolet's views, but only if you don'thave any existing content in that view.
3. Search and select a performance tile or a task flow, and click Add. You can browse the business intelligence (BI)catalog to find the analytics and reports that you want to add.
4. Close the Add Content dialog box. You can now add detailed reports to the infolet.
Link Detailed Reports to InfoletsTo provide detailed information about a subject matter on an infolet, you can add a link to a detailed report. After youadd the link, your users can click anywhere in the infolet area to drill down to that detailed report. The detailed reportdoesn't replace the existing infolet content.
First, add a performance tile report to the infolet content, and then follow these steps:
1. Click the Actions icon on the top right corner of the infolet, and select Link Detailed Report.2. On the Detailed Report page, click Add Content.3. Search and select a report, and click Add to add it to the infolet.4. Close the Add Content dialog box.5. Click Done. You can now publish the sandbox.
Publish the Sandbox
1. Preview the infolet's front view, drill down to the detailed report, and then preview the back and the expandedviews.
2. After you made changes, click Close to leave Page Composer.3. Test your changes and publish the sandbox to make the new infolet available to your users.
Related Topics• Overview of Sandboxes• Create and Activate Sandboxes• Best Practices for Using Page Composer in Sandboxes• Why can't I see application changes made in previously published sandboxes in my current sandbox
Edit and Delete InfoletsOn the infolet page, use the options available on each infolet to edit infolet content and delete infolets.
1. Activate a sandbox that has the Page Composer tool in it.2. Open an infolet page.3. Click your user image or name in the global header, and on the Settings and Actions menu, select Edit Pages.
Note: After you're done making changes, click Close to leave Page Composer, test your changes,and publish the sandbox.
Edit Infolet Content1. Click the Actions icon on the top right corner of the infolet, and select Edit Content.
Note: To edit the infolet content of the back or expanded view, open the view and use the Actions icon onthat view.
2. Click Add Content to replace the existing content of the infolet.
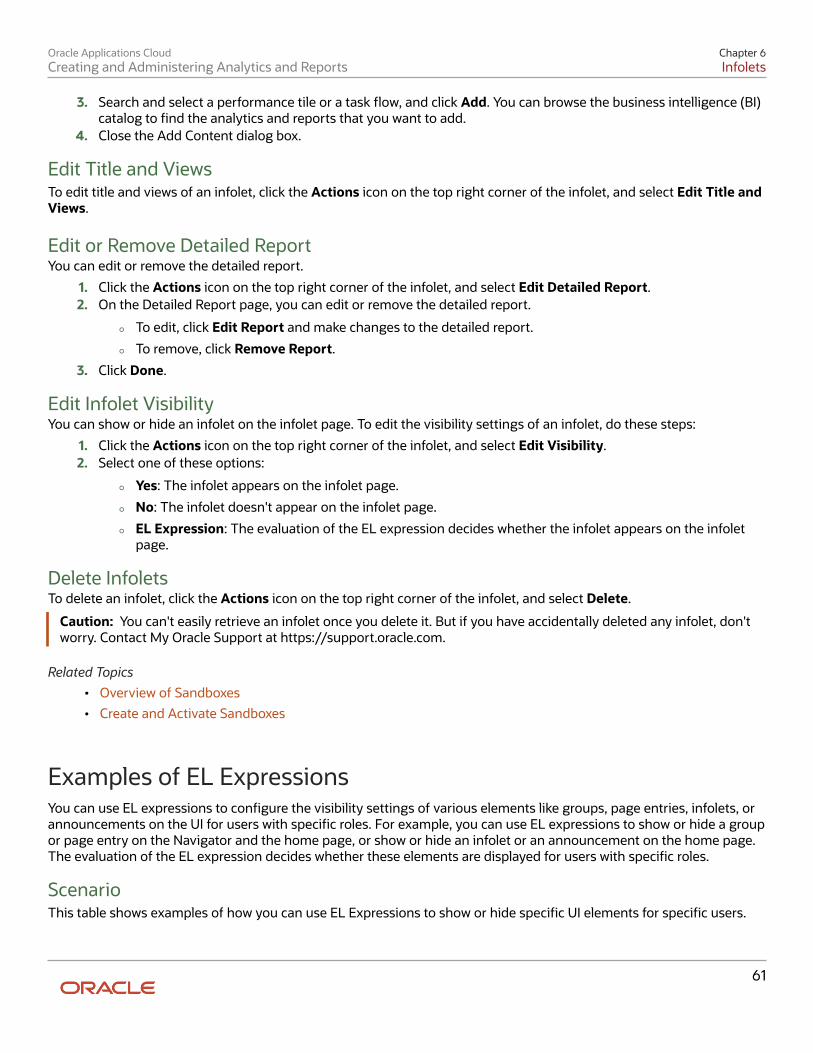
Oracle Applications CloudCreating and Administering Analytics and Reports
Chapter 6Infolets
61
3. Search and select a performance tile or a task flow, and click Add. You can browse the business intelligence (BI)catalog to find the analytics and reports that you want to add.
4. Close the Add Content dialog box.
Edit Title and ViewsTo edit title and views of an infolet, click the Actions icon on the top right corner of the infolet, and select Edit Title andViews.
Edit or Remove Detailed ReportYou can edit or remove the detailed report.
1. Click the Actions icon on the top right corner of the infolet, and select Edit Detailed Report.2. On the Detailed Report page, you can edit or remove the detailed report.
◦ To edit, click Edit Report and make changes to the detailed report.
◦ To remove, click Remove Report.
3. Click Done.
Edit Infolet VisibilityYou can show or hide an infolet on the infolet page. To edit the visibility settings of an infolet, do these steps:
1. Click the Actions icon on the top right corner of the infolet, and select Edit Visibility.2. Select one of these options:
◦ Yes: The infolet appears on the infolet page.
◦ No: The infolet doesn't appear on the infolet page.
◦ EL Expression: The evaluation of the EL expression decides whether the infolet appears on the infoletpage.
Delete InfoletsTo delete an infolet, click the Actions icon on the top right corner of the infolet, and select Delete.
Caution: You can't easily retrieve an infolet once you delete it. But if you have accidentally deleted any infolet, don'tworry. Contact My Oracle Support at https://support.oracle.com.
Related Topics• Overview of Sandboxes• Create and Activate Sandboxes
Examples of EL ExpressionsYou can use EL expressions to configure the visibility settings of various elements like groups, page entries, infolets, orannouncements on the UI for users with specific roles. For example, you can use EL expressions to show or hide a groupor page entry on the Navigator and the home page, or show or hide an infolet or an announcement on the home page.The evaluation of the EL expression decides whether these elements are displayed for users with specific roles.
ScenarioThis table shows examples of how you can use EL Expressions to show or hide specific UI elements for specific users.
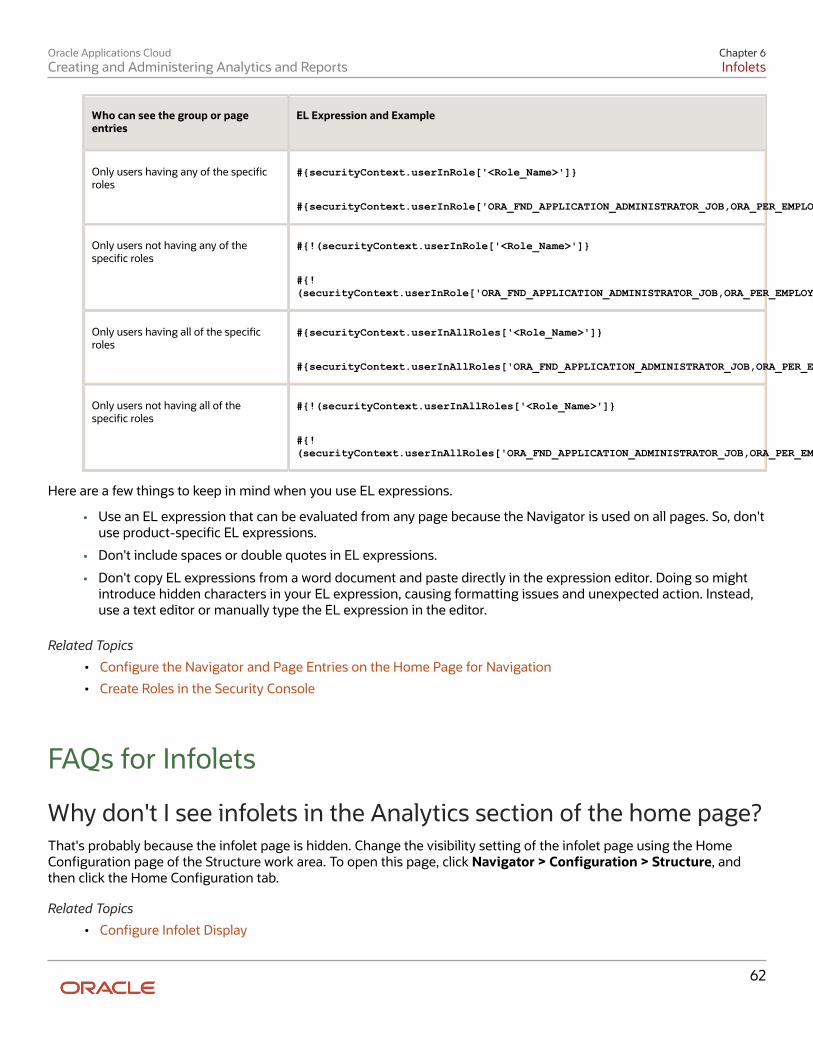
Oracle Applications CloudCreating and Administering Analytics and Reports
Chapter 6Infolets
62
Who can see the group or pageentries
EL Expression and Example
Only users having any of the specificroles
#{securityContext.userInRole['<Role_Name>']}
#{securityContext.userInRole['ORA_FND_APPLICATION_ADMINISTRATOR_JOB,ORA_PER_EMPLOYEE_ABSTRACT']}
Only users not having any of thespecific roles
#{!(securityContext.userInRole['<Role_Name>']}
#{!(securityContext.userInRole['ORA_FND_APPLICATION_ADMINISTRATOR_JOB,ORA_PER_EMPLOYEE_ABSTRACT'])}
Only users having all of the specificroles
#{securityContext.userInAllRoles['<Role_Name>']}
#{securityContext.userInAllRoles['ORA_FND_APPLICATION_ADMINISTRATOR_JOB,ORA_PER_EMPLOYEE_ABSTRACT']}
Only users not having all of thespecific roles
#{!(securityContext.userInAllRoles['<Role_Name>']}
#{!(securityContext.userInAllRoles['ORA_FND_APPLICATION_ADMINISTRATOR_JOB,ORA_PER_EMPLOYEE_ABSTRACT'])}
Here are a few things to keep in mind when you use EL expressions.
• Use an EL expression that can be evaluated from any page because the Navigator is used on all pages. So, don'tuse product-specific EL expressions.
• Don't include spaces or double quotes in EL expressions.
• Don't copy EL expressions from a word document and paste directly in the expression editor. Doing so mightintroduce hidden characters in your EL expression, causing formatting issues and unexpected action. Instead,use a text editor or manually type the EL expression in the editor.
Related Topics
• Configure the Navigator and Page Entries on the Home Page for Navigation
• Create Roles in the Security Console
FAQs for Infolets
Why don't I see infolets in the Analytics section of the home page?That's probably because the infolet page is hidden. Change the visibility setting of the infolet page using the HomeConfiguration page of the Structure work area. To open this page, click Navigator > Configuration > Structure, andthen click the Home Configuration tab.
Related Topics
• Configure Infolet Display
Oracle Applications CloudCreating and Administering Analytics and Reports
Chapter 6Infolets
63
How can I rename an icon for an infolet page in the page controlon the home page?You can rename an icon for an infolet page using the Home Configuration page of the Structure work area. To open thispage, select Configuration > Structure from the Navigator menu, and then click the Home Configuration tab.
Related Topics
• Configure Infolet Display
What's the difference between a performance tile report and adetailed report added to the infolets content?Performance tile report shows data in the small infolet format. When you add a performance tile report to an infolet,users can see only the summary information about the subject matter. But this report doesn't provide detailedinformation.To provide detailed information about the subject matter on the same infolet, add a link to a detailed report. Users canclick this link to gather more information.

Oracle Applications CloudCreating and Administering Analytics and Reports
Chapter 6Infolets
64
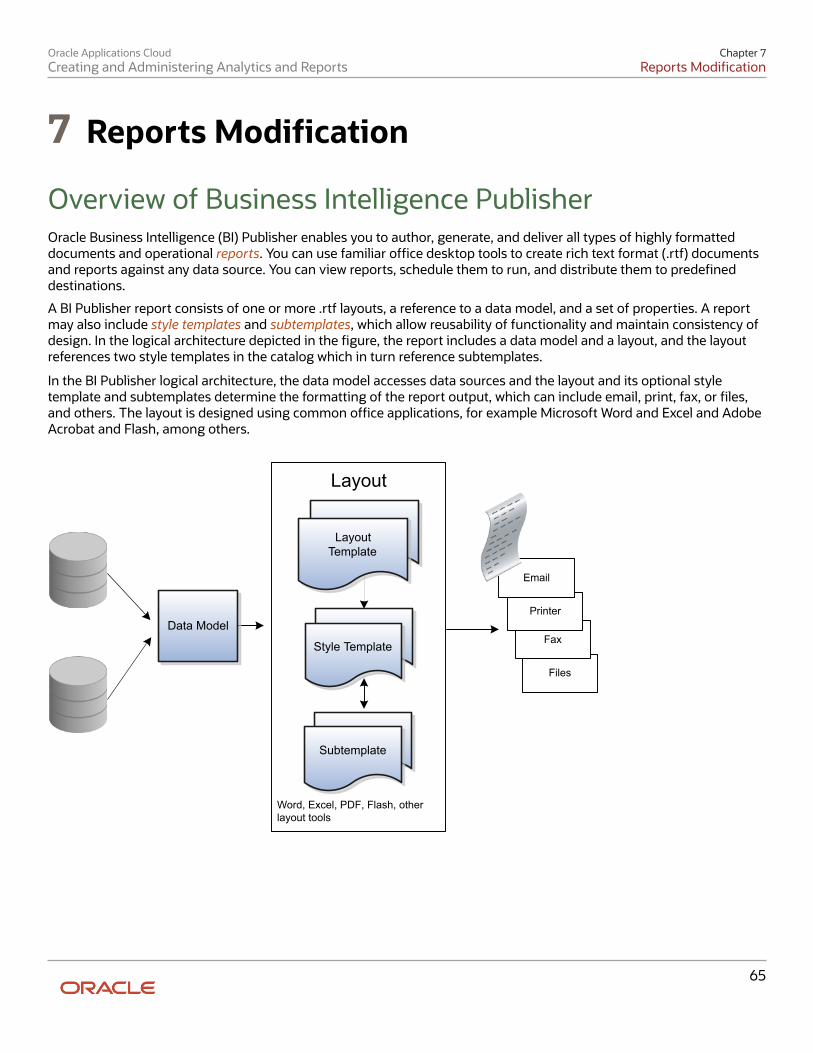
Oracle Applications CloudCreating and Administering Analytics and Reports
Chapter 7Reports Modification
65
7 Reports Modification
Overview of Business Intelligence PublisherOracle Business Intelligence (BI) Publisher enables you to author, generate, and deliver all types of highly formatteddocuments and operational reports. You can use familiar office desktop tools to create rich text format (.rtf) documentsand reports against any data source. You can view reports, schedule them to run, and distribute them to predefineddestinations.
A BI Publisher report consists of one or more .rtf layouts, a reference to a data model, and a set of properties. A reportmay also include style templates and subtemplates, which allow reusability of functionality and maintain consistency ofdesign. In the logical architecture depicted in the figure, the report includes a data model and a layout, and the layoutreferences two style templates in the catalog which in turn reference subtemplates.
In the BI Publisher logical architecture, the data model accesses data sources and the layout and its optional styletemplate and subtemplates determine the formatting of the report output, which can include email, print, fax, or files,and others. The layout is designed using common office applications, for example Microsoft Word and Excel and AdobeAcrobat and Flash, among others.
Files
Layout
Word, Excel, PDF, Flash, other layout tools
Fax
Printer
TemplateLayout
Template
SubtemplateStyle Template
Data Model
SubtemplateSubtemplate
Oracle Applications CloudCreating and Administering Analytics and Reports
Chapter 7Reports Modification
66
Style TemplatesA style template is a .rtf template that contains style information that can be applied to report layouts.
A style template is a .rtf template that contains style information that can be applied to report layouts at runtime toachieve a consistent look and feel across your enterprise reports. You associate a style template to a report layout in thereport definition. Using a style template has the following benefits:
• Enables the same look and feel across your reports
• Enables consistent header and footer content, such as company logos, headings, and page numbering
• Simplifies changing elements and styles across all reports
Use style templates to define paragraph and heading styles, table styles, and header and footer content.
Paragraph and Heading StylesWhen the named style is used in a report layout, the report layout inherits the following from the style templatedefinition:
• font family
• font size
• font weight (normal, bold)
• font style (normal, italic)
• font color
• text decoration (underline or strike through)
Table StylesStyle elements inherited from the table style definition include:
• font style
• border style
• line definition
• shading
• text alignment
Header and Footer ContentThe header and footer regions of the style template are applied to the report layout. This includes images, dates, pagenumbers, and any other text-based content. If the report layout also includes header and footer content, then it isoverwritten.
Oracle Applications CloudCreating and Administering Analytics and Reports
Chapter 7Reports Modification
67
SubtemplatesA subtemplate is a piece of formatting functionality in .rtf or .xsl format that can be defined once and used multipletimes within a single layout template or across multiple report layout template files. Rich Text Format (RTF)subtemplates are easy to design using native features in Microsoft Word, while subtemplates using ExtensibleStylesheet Language (XSL) can be used for complex layout and data requirements. Both .rtf and .xsl subtemplates arestored in the business intelligence catalog as a subtemplate object, and both can be called from .rtf layout templates.
Some common uses for subtemplates include:
• Reusing a common layout or component (such as a header, footer, or address block)
• Handling parameterized layout
• Handling dynamic or conditional layouts
• Handling lengthy calculations or reusing formulas
RTF SubtemplatesAn RTF subtemplate is an RTF file that consists of one or more <?template:?> definitions, each containing a block offormatting or commands, that when uploaded to Business Intelligence (BI) Publisher as a subtemplate object in thecatalog can be called from within another RTF template.
XSL SubtemplatesAn XSL subtemplate is an XSL file that contains formatting or processing commands in XSL for the Business IntelligencePublisher formatting engine to execute. Use an XSL template to include complex calculations or formatting instructionsnot supported by the RTF standard.
How You Create and Edit ReportsUse reports to generate and print documents for internal operations, external business transactions, or legalrequirements. To meet specific requirements, you must create or edit reports to capture different data, or present datain another way.
Report ComponentsEach report has components that you can modify, as described in this table:
Report Component Description Tool for Modifying
Data model Defines the data source, data structure,and parameters for the report. Multiple
Data model editor in the application
Oracle Applications CloudCreating and Administering Analytics and Reports
Chapter 7Reports Modification
68
Report Component Description Tool for Modifying
reports can use the same data model.Each report has one data model.
Layout Defines the presentation, formatting, andvisualizations of the data. A report canhave multiple layouts. Different types oflayout templates are available, for exampleExcel and RTF.
Depending on the template file type:
• XPT: Layout editor in theapplication
• RTF: Microsoft Word• PDF: Adobe Acrobat Professional• Excel: Microsoft Excel• eText: Microsoft Word
Properties Specifies formatting and other settings forthe report.
Report editor in the application
What You Can Create or EditThis table gives just a few examples of creating or editing reports.
Task Example
Edit the layout of a report. Add your company logo to the report output.
Add a new layout to a report. Design a new layout template that provides less detail than the existing template.
Edit a data model. Add two fields to the data model used by a report so you can add those new fields to a layoutfor the report.
Create a new report based on a newdata model.
Create a new data model based on data from an external system, and create reports using thedata model.
How You Access and Modify Report ComponentsTo create or edit reports, you must access the business intelligence (BI) catalog. In the catalog, objects of type Reportrepresent the report definition, which includes report properties and layouts. Data models are separate objects in thecatalog, usually stored in subfolders called Data Models.
Oracle Applications CloudCreating and Administering Analytics and Reports
Chapter 7Reports Modification
69
Accessing the BI CatalogYou can access the BI catalog in any of the following ways:
• In the Reports and Analytics work area, click Browse Catalog to open the BI catalog, and find your report ordata model in the Folders pane.
• In the Reports and Analytics work area, find your report and select More to go to the report directly in thecatalog. The data model associated with the report should be in the Data Models subfolder within the samefolder as the report.
• Sign in to the application directly (for example: http://host:port/analytics/saw.dll) to open the catalog.
• Sign in to the BI Publisher server directly (for example: http://hostname.com:7001/xmlpserver) to open thecatalog.
◦ Alternatively, once you are in the catalog using another method, for example, through the Reportsand Analytics work area, change the final node of the URL. For example, change (http://host:port/analytics/saw.dll) to xmlpserver. So the URL you use would be: http://host:port/xmlpserver.
Predefined ReportsA special Customize option is available only:
• For predefined reports, not data models.
• Through direct access to the BI Publisher server using the /xmlpserver URL. When you find your report in the BIcatalog, select Customize from the More menu.
The Customize option automatically creates a copy of a predefined report and stores it in the Shared Folders > Customfolder within the catalog. The new report is linked to the original, so that when users open or schedule the original, theyare actually using the copied version.
If you don't have access to the Customize option or don't want the original version linked to the new report, make a copyof the predefined report and save it in the Custom folder.
Predefined Data ModelsDon't edit predefined data models. Instead, copy the data model into the Custom folder and edit the copy. You can'tcreate a new data model based on the transactional tables.
Related Topics
• Where to Save Analytics and Reports
• What happens to modified analytics and reports when a release update is applied
How You Modify Copies of Predefined ReportsThe Customize option automatically creates a copy of a predefined report and stores it in the Shared Folders > Customwithin the business intelligence (BI) catalog. The copy includes the report definition, folder structure, and original reportpermissions, and is linked internally to the original report. You can edit the copy of the report, leaving the original reportintact. When users open or schedule the original report, they are actually using the newer version.
Oracle Applications CloudCreating and Administering Analytics and Reports
Chapter 7Reports Modification
70
Benefits of the Customize OptionIn addition to conveniently copying a predefined report to the Custom folder, the Customize option:
• Makes it unnecessary to update processes or applications that call the report. For example, if the original reportis set up to run as a scheduled process, you don't need to change the setup. When users submit the samescheduled process, the newer report runs instead of the original.
• Automatically copies the security settings of the original report.
• Removes the risk of patches overwriting your edits. If a patch updates the original report, the newer report isnot updated in any way.
Note: The report still references the original data model. The data model is not copied. A patch thatupdates the data structure of the data model might affect your report.
Accessing the Customize OptionTo access the Customize option:
1. Sign in to the BI server (for example, http://hostname.com:7001/xmlpserver).2. In the Folders pane, select the predefined report.3. Select Customize from the More menu for the report.4. The copied report in the Custom folder opens, so proceed to edit this report.
To edit the copied report again later, you don't need to be in the BI server. Just go to the BI catalog and either:
• Select the Customize option for the original report.
• Find your report in the Custom folder and select Edit.
Related Topics• Where to Save Analytics and Reports• What happens to modified analytics and reports when a release update is applied
How Links Between Original and Modified Reports AreManagedThe Customize option for predefined reports creates a copy of the report that is linked to the original. Consider thefollowing points when you work with both the original and modified versions.
Maintaining the Link Between ReportsThe link between the predefined and modified report is based on the name of the modified report and its locationwithin the Custom folder in the business intelligence (BI) catalog.
• If you manually create a report with the same name as a predefined report, and give it the same folder path inthe Custom folder, then the new report becomes a version of the original. It would be as if you had used theCustomize option to create a copy of the predefined report.
• You can edit the report so that it uses a different data model. But if the original data model is updated later,then your newer report doesn't benefit from the change.
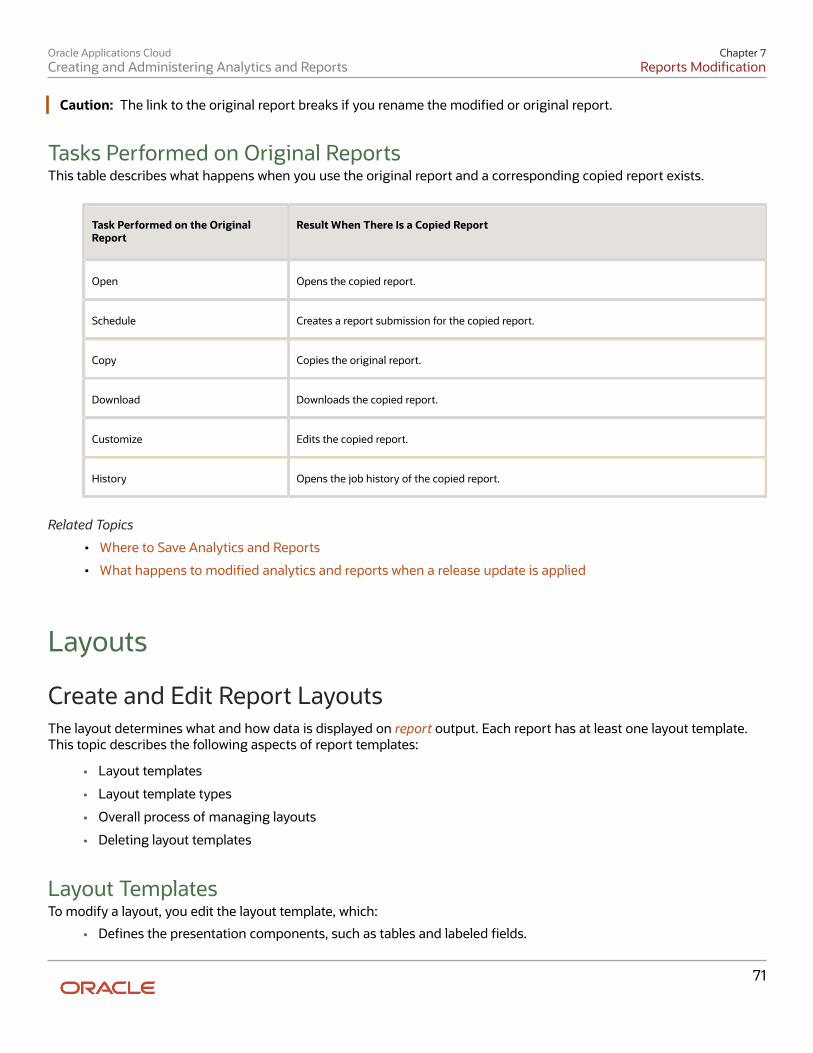
Oracle Applications CloudCreating and Administering Analytics and Reports
Chapter 7Reports Modification
71
Caution: The link to the original report breaks if you rename the modified or original report.
Tasks Performed on Original ReportsThis table describes what happens when you use the original report and a corresponding copied report exists.
Task Performed on the OriginalReport
Result When There Is a Copied Report
Open Opens the copied report.
Schedule Creates a report submission for the copied report.
Copy Copies the original report.
Download Downloads the copied report.
Customize Edits the copied report.
History Opens the job history of the copied report.
Related Topics
• Where to Save Analytics and Reports
• What happens to modified analytics and reports when a release update is applied
Layouts
Create and Edit Report LayoutsThe layout determines what and how data is displayed on report output. Each report has at least one layout template.This topic describes the following aspects of report templates:
• Layout templates
• Layout template types
• Overall process of managing layouts
• Deleting layout templates
Layout TemplatesTo modify a layout, you edit the layout template, which:
• Defines the presentation components, such as tables and labeled fields.
Oracle Applications CloudCreating and Administering Analytics and Reports
Chapter 7Reports Modification
72
• Maps columns from the data model to these components so that the data is displayed in the correct place.
• Defines font sizes, styles, borders, shading, and other formatting, including images such as a company logo.
Layout Template TypesThere are a few types of template files to support different report layout requirements.
• RTF: Rich text format (RTF) templates created using Microsoft Word.
• XPT: Created using the application's layout editor, these templates are for interactive and more visuallyappealing layouts.
• eText: These templates are specifically for Electronic Data Interchange (EDI) and electronic funds transfer (EFT)information.
You can also create and edit other types of templates using Adobe PDF, Microsoft Excel, Adobe Flash, and XSL-FO.
Overall Process to Create or Edit LayoutsEditing or creating report layout, for example using Microsoft Word or the layout editor, involves making the actualchanges to the template file. But that task is just one part of the entire process for modifying layouts.
1. Copy the original report and save the new version in Shared Folders > Custom in the business intelligence (BI)catalog. You create or edit templates for the new copy of the report.
Tip: You can use the Customize option if the original is a predefined report.
2. Review report settings for online viewing.3. Generate sample data for the report.4. Edit or create the layout template file.5. Upload the template file to the report definition. Skip this step if you're using the layout editor.6. Configure the layout settings.
Deleting Layout TemplatesTo remove a layout template for a report:
1. Select your report in the BI catalog and click Edit.2. In the report editor, click View a list.3. Select the layout template and click Delete.
Make Reports Available for Online ViewingSome reports are set up so that you can only view them through another application or submit them as scheduledprocesses. To view your report online while you're editing it, you must define a few settings. When you're done editingyour report, make sure that you reset these settings as needed.
Updating Report Properties
1. Select your report in the business intelligence catalog and click Edit.2. In the report editor, click Properties.3. In the Report Properties dialog box, select Run Report Online and deselect Report is Controlled by External
Application.
Oracle Applications CloudCreating and Administering Analytics and Reports
Chapter 7Reports Modification
73
Updating Layout Settings
1. Back in the report editor, click View a list.2. Make sure that the View Online check box is selected.
Generate Sample Report DataDepending on the type of report layout changes you're making, sample data can be required or optional. You generatesample data, and then load it for use with your layout so that you can map data fields to layout components. Forexample, for the Start Date table column in your layout, you can set it so that the data displayed in that column comesfrom the Start Date field in the sample data.
You can generate sample data from the:
• Report data model
• Report viewer
• Scheduler
Generate Sample Data from the Data ModelFollow these steps:
1. Select your data model in the business intelligence (BI) catalog and click Edit. Alternatively:a. In the catalog, find the report to generate sample data for and click Edit.b. Click the data model name in the report editor.
2. In the data model editor, click View Data.3. Enter values for any required parameters, select the number of rows to return, and click View.4. To save the sample data to the data model, click Save As Sample Data.
If you're designing a .rtf template, click Export to save the file locally.5. Save the data model.
Save Sample Data from the Report ViewerFor reports that are enabled for online viewing, you can save sample data from the report viewer:
1. Select the report in the BI catalog.2. Click Open to run the report in the report viewer with the default parameters.3. On the Actions menu, click Export, then click Data.4. Save the data file.
Save Sample Data from the SchedulerFor reports that are enabled for scheduling (not necessarily as a scheduled process), you can save sample data from thescheduler:
1. Select the report in the BI catalog.2. Click Schedule.3. On the General tab, enter values for any report parameters.4. On the Output tab, ensure that Save Data for Republishing is selected.5. Click Submit.6. Open the Report Job History page.7. On the global header, click Open, then click Report Job History.
Oracle Applications CloudCreating and Administering Analytics and Reports
Chapter 7Reports Modification
74
8. Select your report job name in the Job Histories table.9. On the details page, in Output and Delivery, click the XML Data Download icon button.
Layout Templates
Create and Edit Report Layout Templates Using the Layout EditorThe layout editor in the application provides an intuitive, drag-and-drop interface for creating pixel-perfect reportswith PDF, RTF, Excel, PowerPoint, and HTML output. The layout template files you create with this tool have an .xptextension. The layout editor tool is the only editing tool that provides dynamic HTML output. Users can interact with thisoutput in a browser, for example by sorting, applying filters, and so on.
PrerequisiteMake sure that sample data is generated from the data model that your report is using.
Using the Layout EditorTo create or edit XPT templates:
1. Select the report in the business intelligence (BI) catalog and click Edit.2. In the report editor, click Edit to update a template.
Or, click Add New Layout and select a template type in the Create Layout section.3. Create or edit the layout.4. Click Save to save the layout to the report definition.
Set Up for RTF and Excel Report Layout TemplatesYou can use Microsoft Word or Microsoft Excel to create or edit RTF and Excel layout templates, in addition to the layouteditor in the application. If you use Word or Excel directly, you must download and install the appropriate add-in so thatthe Microsoft application has the features you need to design report layouts.
Note: If you're designing a new layout for your report, consider using the layout editor instead unless you are anexperienced layout designer.
Installing the Add-In
1. Open the Reports and Analytics work area.2. Click the Browse Catalog button.3. Click Home.4. In the Get Started pane, click Download BI Desktop Tools.5. Select the add-in for the type of template you're working with.
◦ Template Builder for Word: RTF templates
◦ Analyzer for Excel: Excel templates
6. Save and then run the installer.
Protecting Reports by Using PasswordsYou can assign a password to your report and protect it from unwanted access. You can do this by setting the runtimeproperties at the server level using the Runtime Configuration page. The same properties can also be set at the reportlevel, from the report editor's Properties dialog. If different values are set for a property at each level, then report leveltakes precedence.
Oracle Applications CloudCreating and Administering Analytics and Reports
Chapter 7Reports Modification
75
The following table describes the properties you can use to set passwords for reports in different formats.
Report Format Property Name Description Default Configuration Name
DOCX output Open password Use this property tospecify the passwordthat report users mustprovide to open anyDOCX report.
NA docx-open-password
PPTX output Open password Use this property tospecify the passwordthat report users mustprovide to open anyPPTX report.
NA pptx-open-password
XLSX output Open password Use this property tospecify the passwordthat report users mustprovide to open anyXLSX output file.
NA xlsx-open-password
Create and Edit RTF Report Layout TemplatesAn RTF template is a rich text format file that contains the layout instructions to use when generating the report output.Use Microsoft Word with the Template Builder for Word add-in to design RTF templates.
PrerequisitesInstall the Template Builder for Word add-in, and generate sample data.
Using Template Builder for WordTo modify an RTF template:
1. If you are editing an existing layout:
a. Select your report in the business intelligence catalog and click Edit.b. In the report editor, click the Edit link of the layout to download the RTF file.
If you are creating a new layout, skip this step.2. Open the downloaded RTF template file in Microsoft Word. Or, if you're creating a new template, just open
Microsoft Word.3. Load the sample data that you generated.4. Edit or create the layout template.5. Save the file as Rich Text Format (RTF).
eText Report Layout Templates: ExplainedAn eText template is an RTF-based report template that is used for Electronic Funds Transfer (EFT) and Electronic DataInterchange (EDI). The template is applied to an input XML data file to create a flat text file that you transmit to a bank orother organizations. Use Microsoft Word to create or edit eText templates.
Oracle Applications CloudCreating and Administering Analytics and Reports
Chapter 7Reports Modification
76
File FormatBecause the output is for electronic communication, not printing, you must follow specific format instructions for exactplacement of data on the template. You design eText templates using tables.
• Each record is represented by a table.
• Each row in a table corresponds to a field in a record.
• The columns of the table specify the position, length, and value of the field.
Special CommandsYou must set up special handling of the data from the input XML file. This table describes the two levels of handling andwhere you declare the corresponding commands.
Level Example Setup
Global Character replacement
Sequencing
Declare global commands in separatesetup tables.
Record Sorting Declare functions in command rows, in thesame table as the data.
Upload the Layout Template File to the Report DefinitionIf you're creating or editing a report layout using the layout editor, the layout is automatically saved to the reportdefinition, so you can skip this step. For all other layout types, for example RTF, upload the template file to the reportdefinition after you're done making layout changes.
Uploading the Template File
1. Select your report in the business intelligence catalog and click Edit.2. In the report editor, click View a list.3. In the table that lists the layouts, click Create.4. Click Upload in Upload or Generate Layout.5. In the Upload Template File dialog box:
a. Enter a layout name.b. Browse for and select the layout template file that you created or edited.c. Select the template file type.d. Select the locale, which you can't change once the template file is saved to the report definition.e. Click Upload.
6. Save the report definition.
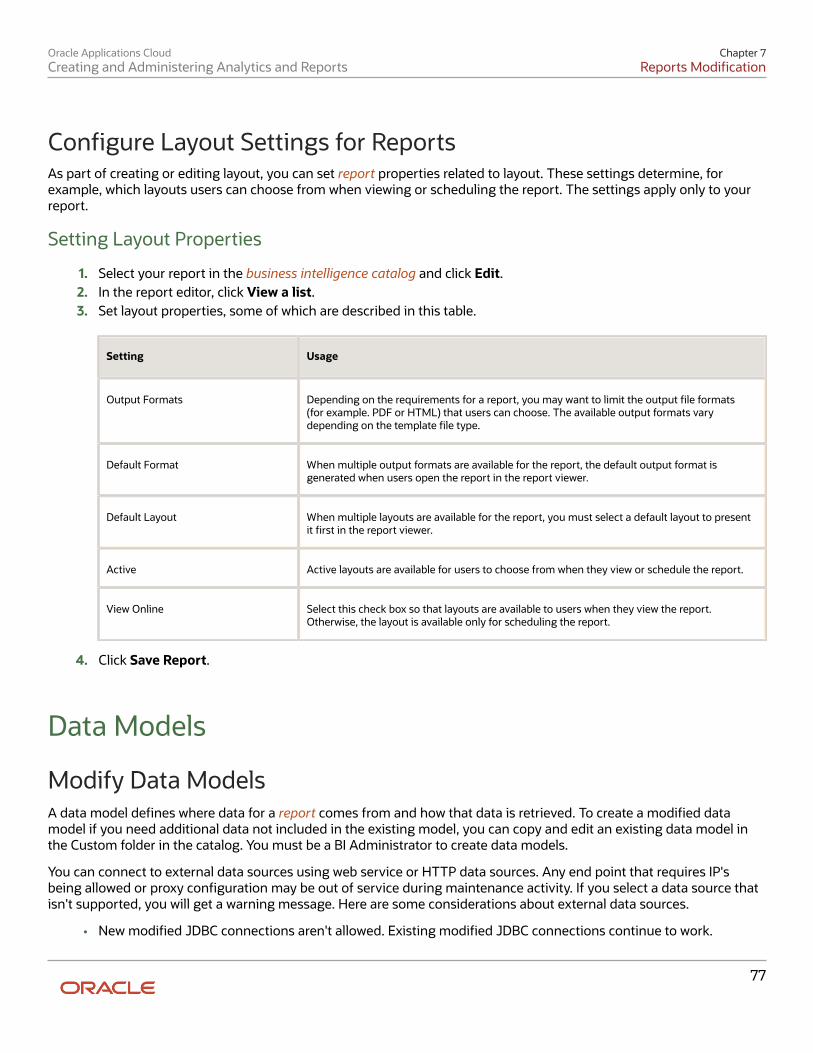
Oracle Applications CloudCreating and Administering Analytics and Reports
Chapter 7Reports Modification
77
Configure Layout Settings for ReportsAs part of creating or editing layout, you can set report properties related to layout. These settings determine, forexample, which layouts users can choose from when viewing or scheduling the report. The settings apply only to yourreport.
Setting Layout Properties
1. Select your report in the business intelligence catalog and click Edit.2. In the report editor, click View a list.3. Set layout properties, some of which are described in this table.
Setting Usage
Output Formats Depending on the requirements for a report, you may want to limit the output file formats(for example. PDF or HTML) that users can choose. The available output formats varydepending on the template file type.
Default Format When multiple output formats are available for the report, the default output format isgenerated when users open the report in the report viewer.
Default Layout When multiple layouts are available for the report, you must select a default layout to presentit first in the report viewer.
Active Active layouts are available for users to choose from when they view or schedule the report.
View Online Select this check box so that layouts are available to users when they view the report.Otherwise, the layout is available only for scheduling the report.
4. Click Save Report.
Data Models
Modify Data ModelsA data model defines where data for a report comes from and how that data is retrieved. To create a modified datamodel if you need additional data not included in the existing model, you can copy and edit an existing data model inthe Custom folder in the catalog. You must be a BI Administrator to create data models.
You can connect to external data sources using web service or HTTP data sources. Any end point that requires IP'sbeing allowed or proxy configuration may be out of service during maintenance activity. If you select a data source thatisn't supported, you will get a warning message. Here are some considerations about external data sources.
• New modified JDBC connections aren't allowed. Existing modified JDBC connections continue to work.
Oracle Applications CloudCreating and Administering Analytics and Reports
Chapter 7Reports Modification
78
• JNDI connections are restricted to audit data only.
• Web service connections are supported.
• HTTP connections are supported.
• File connections are supported in the Data Model Editor.
• Content Server connections are supported.
Create a Data Model
1. In the business intelligence (BI) catalog, click New and select Data Model in Published Reporting.2. Optionally click the Properties node in the Data Model pane to set properties for the data model. For example,
to prevent null values from removing columns from a report, select Include Empty Tags for Null Elementsin the XML Output Options section of the properties. This preserves the order of columns when there are nullvalues in an exported report.
3. Click the Data Sets node in the Data Model pane to create or edit data sets, which determine where and how toretrieve data. Click New Data Set and select a data set type. It's best practice to use the BI repository as a datasource, so you should select either:
◦ SQL Query: To use a Query Builder tool to define what to use from the repository. Select Oracle BI EE asthe data source.
◦ Oracle BI Analysis: To use columns from a selected analysis.
Note: OBIEE data sets are retrieved using logical tables in the BI metadata and joined internally, so thereis no need for explicit joins within a subject area. It's recommended to create a single data set with tablesfrom the same subject area.
4. Optionally, to limit the data included in the report output, click the Parameters node in the Data Model paneto define variables that users can set when they use the report. You can set parameters as mandatory if they'rerequired, for example to filter data by a prompted value to improve query performance. These are indicatedby an asterisk when you run the report. Mandatory report parameters are required before you can run a reportusing the View Data option or online, or schedule it.
Note: The order of parameters is important if there are job definitions defined for reports that use yourdata model. If you change the order in the data model, also update the job definitions.
5. Click Validate to view query and performance warnings.6. Save your data model inShared Folders > Custom.
Data Model Supported SQL StatementsData models support standard SQL SELECT statements and non-standard SQL, including:
• Database procedures
• Cursor statements that return nested result sets
• Reference cursor functions that support explicit static SQL SELECT statements
• SQL query parameters used in a WHERE clause
• Conditional queries that execute multiple SQL queries in a single data set using an if-else expression
Data models don't support SQL statements with these keywords: DELETE, INSERT, UPDATE, DROP, EXECUTE, ALTER, MERGE,DBMS_SQL, CREATE, AUTONOMOUS_TRANSACTION, PRAGMA, WRITETEXT, UPDATETEXT, LOAD, UNLOAD, DATABASE, GRANT, REVOKE, TRUNCATE.
Oracle Applications CloudCreating and Administering Analytics and Reports
Chapter 7Reports Modification
79
Edit a Data Model
1. Copy the predefined data model.
a. Find the data model in the BI catalog and click Copy.b. Paste within Shared Folders > Custom in a subfolder that has a folder path similar to the folder that
stores the original data model.c. For the data model you pasted, click More, and select Edit.
2. Optionally click the Data Model node in the Data Model pane to set properties for the data model.3. Click the Data Set node in the Data Model pane to create or edit data sets.
Most predefined data models are of type SQL Query, and are set up to get application data from the followingtables:
◦ ApplicationDB_FSCM: Financials, Supply Chain Management, Project Management, Procurement, andIncentive Compensation
◦ ApplicationDB_CRM: Sales
◦ ApplicationDB_HCM: Human Capital Management
4. Perform steps 4 through 6 from the preceding Create a Data Model task, as needed.
Related Topics
• How Data Is Structured for Analytics
Validate Data ModelsData model validation errors and warnings help you correct data models, optimize queries, reduce stuck threads, andenhance the reporting performance.
When you create or edit a data model that's created in the current or previous releases, if you click Validate, BI Publisher:
1. Checks the queries used for data sets, LOVs, and bursting definitions.2. Generates the execution plan for SQL queries.3. Displays a list of errors and warnings.
Take the required action based on the data model validation messages. See Data Model Validation Messages.
Note that when you upgrade BI Publisher from a previous release, the existing data models are marked as not validated.
Data Model Validation MessagesThe data model validation messages can be of the following types:
• Error - You must resolve the data model errors if you want to use the data model to run a report.
• Warning - Make the correction suggested in the warning message. Reporting performance might get affected ifyou choose to run the report ignoring the warning.
The data model validation messages and their details are as follows:
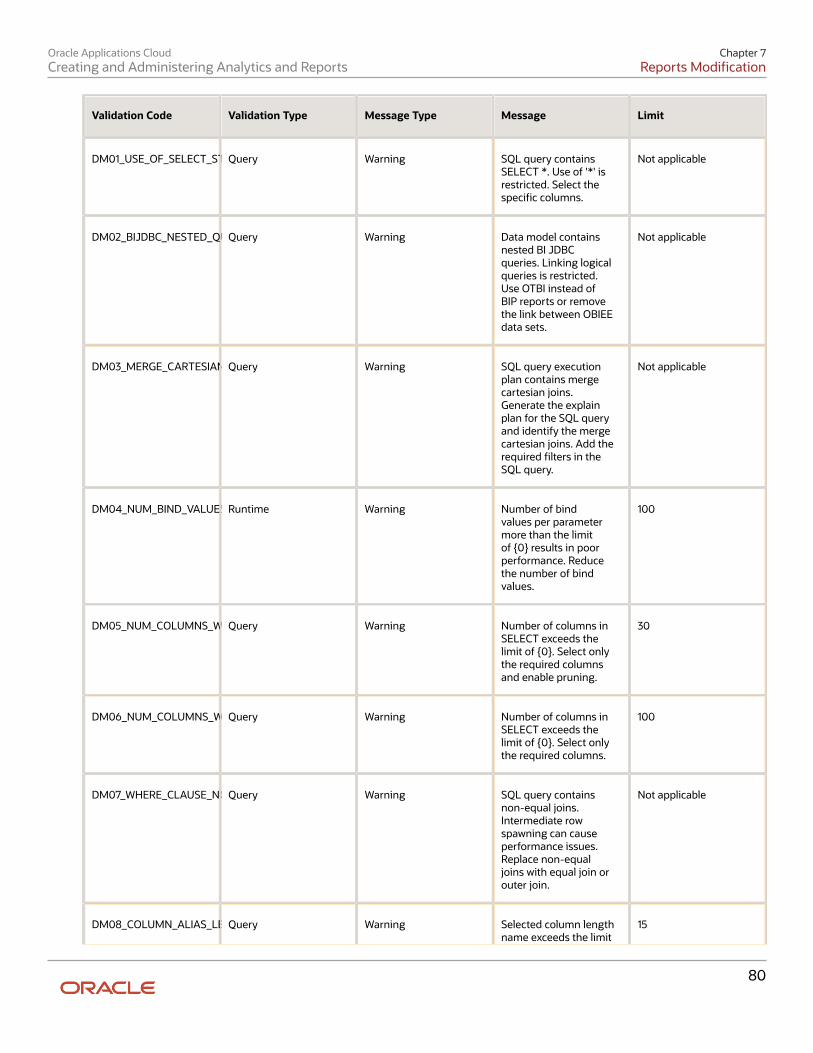
Oracle Applications CloudCreating and Administering Analytics and Reports
Chapter 7Reports Modification
80
Validation Code Validation Type Message Type Message Limit
DM01_USE_OF_SELECT_STARQuery Warning SQL query containsSELECT *. Use of '*' isrestricted. Select thespecific columns.
Not applicable
DM02_BIJDBC_NESTED_QUERYQuery Warning Data model containsnested BI JDBCqueries. Linking logicalqueries is restricted.Use OTBI instead ofBIP reports or removethe link between OBIEEdata sets.
Not applicable
DM03_MERGE_CARTESIAN_JOINSQuery Warning SQL query executionplan contains mergecartesian joins.Generate the explainplan for the SQL queryand identify the mergecartesian joins. Add therequired filters in theSQL query.
Not applicable
DM04_NUM_BIND_VALUES_PER_PARAMRuntime Warning Number of bindvalues per parametermore than the limitof {0} results in poorperformance. Reducethe number of bindvalues.
100
DM05_NUM_COLUMNS_WITHOUT_PRUNINGQuery Warning Number of columns inSELECT exceeds thelimit of {0}. Select onlythe required columnsand enable pruning.
30
DM06_NUM_COLUMNS_WITH_PRUNINGQuery Warning Number of columns inSELECT exceeds thelimit of {0}. Select onlythe required columns.
100
DM07_WHERE_CLAUSE_NOTIN_NOTEQUALQuery Warning SQL query containsnon-equal joins.Intermediate rowspawning can causeperformance issues.Replace non-equaljoins with equal join orouter join.
Not applicable
DM08_COLUMN_ALIAS_LENGTHQuery Warning Selected column lengthname exceeds the limit
15
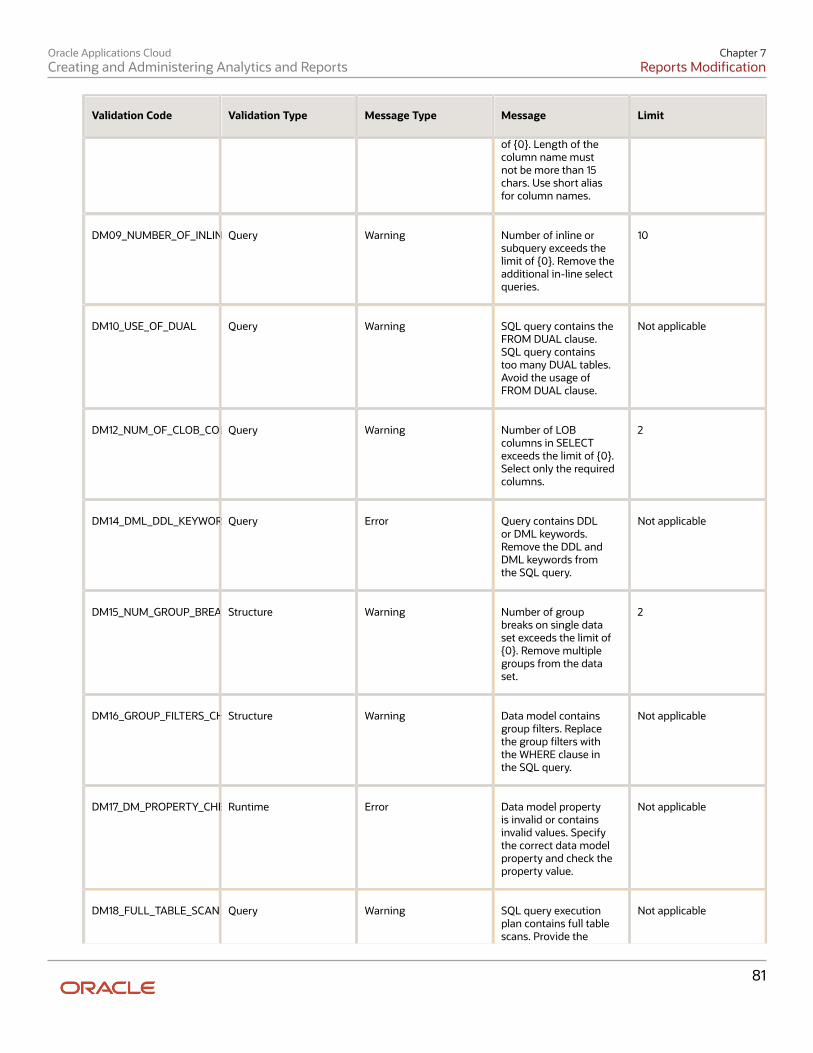
Oracle Applications CloudCreating and Administering Analytics and Reports
Chapter 7Reports Modification
81
Validation Code Validation Type Message Type Message Limit
of {0}. Length of thecolumn name mustnot be more than 15chars. Use short aliasfor column names.
DM09_NUMBER_OF_INLINE_QUERYQuery Warning Number of inline orsubquery exceeds thelimit of {0}. Remove theadditional in-line selectqueries.
10
DM10_USE_OF_DUAL Query Warning SQL query contains theFROM DUAL clause.SQL query containstoo many DUAL tables.Avoid the usage ofFROM DUAL clause.
Not applicable
DM12_NUM_OF_CLOB_COLUMNSQuery Warning Number of LOBcolumns in SELECTexceeds the limit of {0}.Select only the requiredcolumns.
2
DM14_DML_DDL_KEYWORDQuery Error Query contains DDLor DML keywords.Remove the DDL andDML keywords fromthe SQL query.
Not applicable
DM15_NUM_GROUP_BREAKSStructure Warning Number of groupbreaks on single dataset exceeds the limit of{0}. Remove multiplegroups from the dataset.
2
DM16_GROUP_FILTERS_CHECKStructure Warning Data model containsgroup filters. Replacethe group filters withthe WHERE clause inthe SQL query.
Not applicable
DM17_DM_PROPERTY_CHECKRuntime Error Data model propertyis invalid or containsinvalid values. Specifythe correct data modelproperty and check theproperty value.
Not applicable
DM18_FULL_TABLE_SCAN Query Warning SQL query executionplan contains full tablescans. Provide the
Not applicable
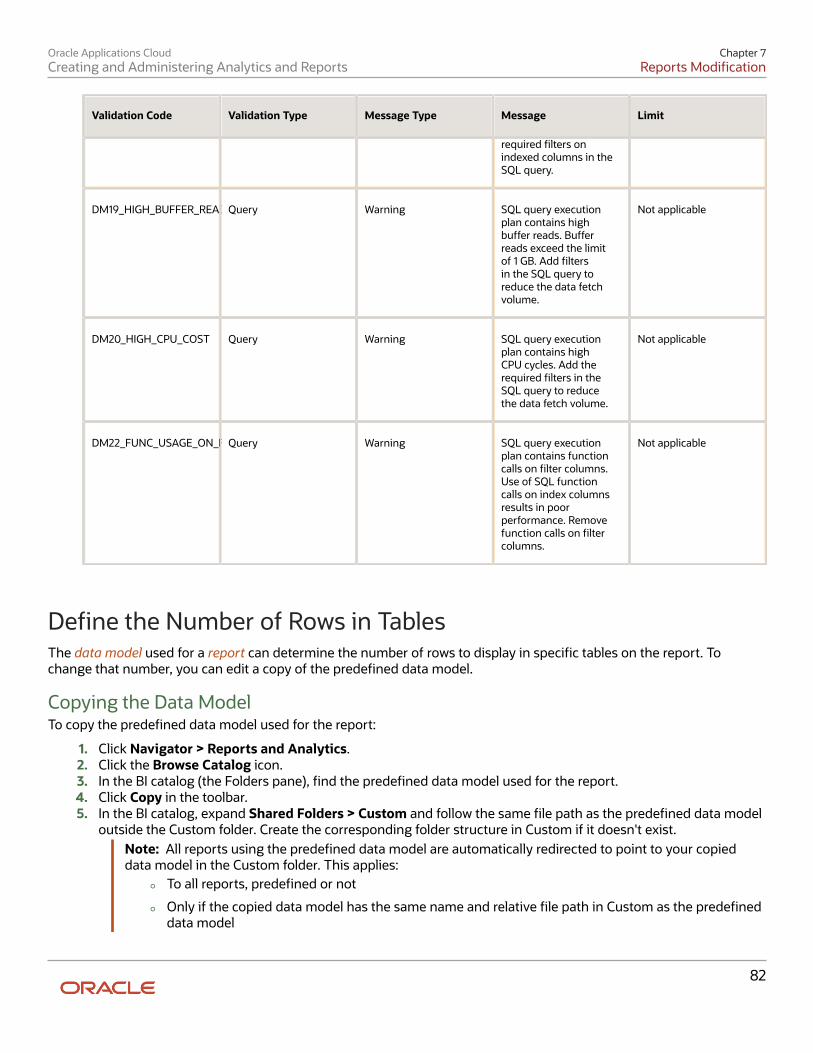
Oracle Applications CloudCreating and Administering Analytics and Reports
Chapter 7Reports Modification
82
Validation Code Validation Type Message Type Message Limit
required filters onindexed columns in theSQL query.
DM19_HIGH_BUFFER_READSQuery Warning SQL query executionplan contains highbuffer reads. Bufferreads exceed the limitof 1 GB. Add filtersin the SQL query toreduce the data fetchvolume.
Not applicable
DM20_HIGH_CPU_COST Query Warning SQL query executionplan contains highCPU cycles. Add therequired filters in theSQL query to reducethe data fetch volume.
Not applicable
DM22_FUNC_USAGE_ON_FILTERSQuery Warning SQL query executionplan contains functioncalls on filter columns.Use of SQL functioncalls on index columnsresults in poorperformance. Removefunction calls on filtercolumns.
Not applicable
Define the Number of Rows in TablesThe data model used for a report can determine the number of rows to display in specific tables on the report. Tochange that number, you can edit a copy of the predefined data model.
Copying the Data ModelTo copy the predefined data model used for the report:
1. Click Navigator > Reports and Analytics.2. Click the Browse Catalog icon.3. In the BI catalog (the Folders pane), find the predefined data model used for the report.4. Click Copy in the toolbar.5. In the BI catalog, expand Shared Folders > Custom and follow the same file path as the predefined data model
outside the Custom folder. Create the corresponding folder structure in Custom if it doesn't exist.Note: All reports using the predefined data model are automatically redirected to point to your copieddata model in the Custom folder. This applies:
◦ To all reports, predefined or not
◦ Only if the copied data model has the same name and relative file path in Custom as the predefineddata model
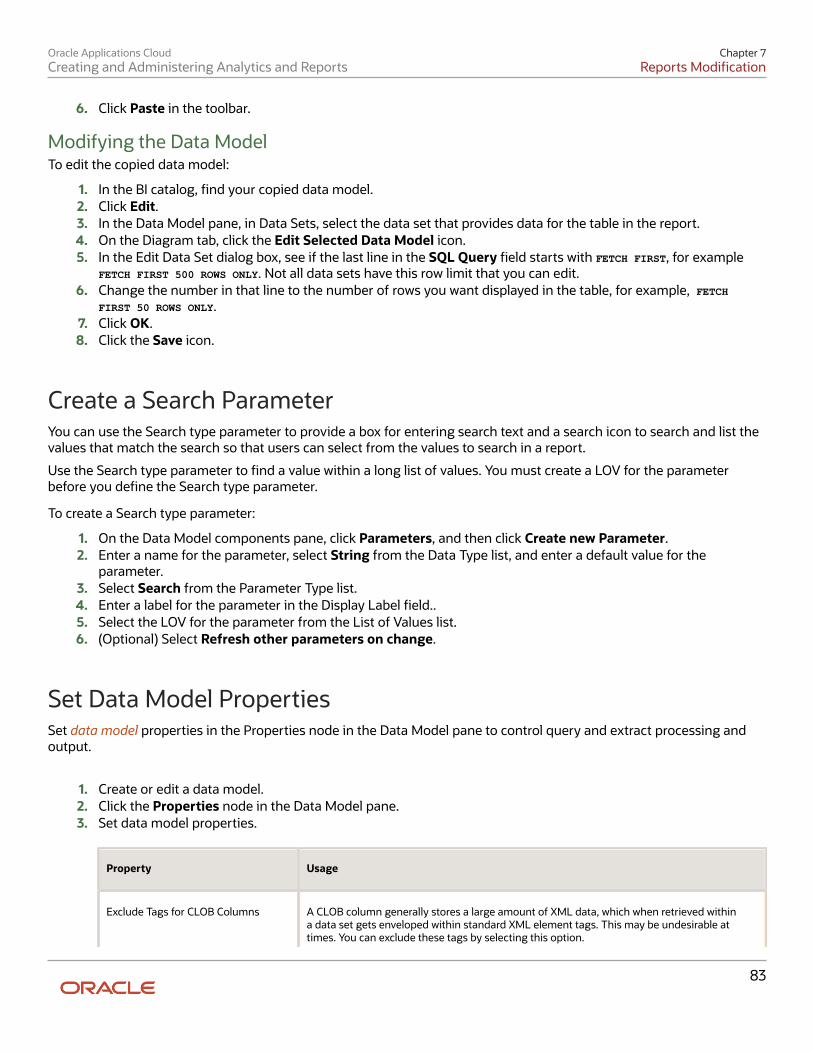
Oracle Applications CloudCreating and Administering Analytics and Reports
Chapter 7Reports Modification
83
6. Click Paste in the toolbar.
Modifying the Data ModelTo edit the copied data model:
1. In the BI catalog, find your copied data model.2. Click Edit.3. In the Data Model pane, in Data Sets, select the data set that provides data for the table in the report.4. On the Diagram tab, click the Edit Selected Data Model icon.5. In the Edit Data Set dialog box, see if the last line in the SQL Query field starts with FETCH FIRST, for example
FETCH FIRST 500 ROWS ONLY. Not all data sets have this row limit that you can edit.6. Change the number in that line to the number of rows you want displayed in the table, for example, FETCH
FIRST 50 ROWS ONLY.7. Click OK.8. Click the Save icon.
Create a Search ParameterYou can use the Search type parameter to provide a box for entering search text and a search icon to search and list thevalues that match the search so that users can select from the values to search in a report.
Use the Search type parameter to find a value within a long list of values. You must create a LOV for the parameterbefore you define the Search type parameter.
To create a Search type parameter:
1. On the Data Model components pane, click Parameters, and then click Create new Parameter.2. Enter a name for the parameter, select String from the Data Type list, and enter a default value for the
parameter.3. Select Search from the Parameter Type list.4. Enter a label for the parameter in the Display Label field..5. Select the LOV for the parameter from the List of Values list.6. (Optional) Select Refresh other parameters on change.
Set Data Model PropertiesSet data model properties in the Properties node in the Data Model pane to control query and extract processing andoutput.
1. Create or edit a data model.2. Click the Properties node in the Data Model pane.3. Set data model properties.
Property Usage
Exclude Tags for CLOB Columns A CLOB column generally stores a large amount of XML data, which when retrieved withina data set gets enveloped within standard XML element tags. This may be undesirable attimes. You can exclude these tags by selecting this option.
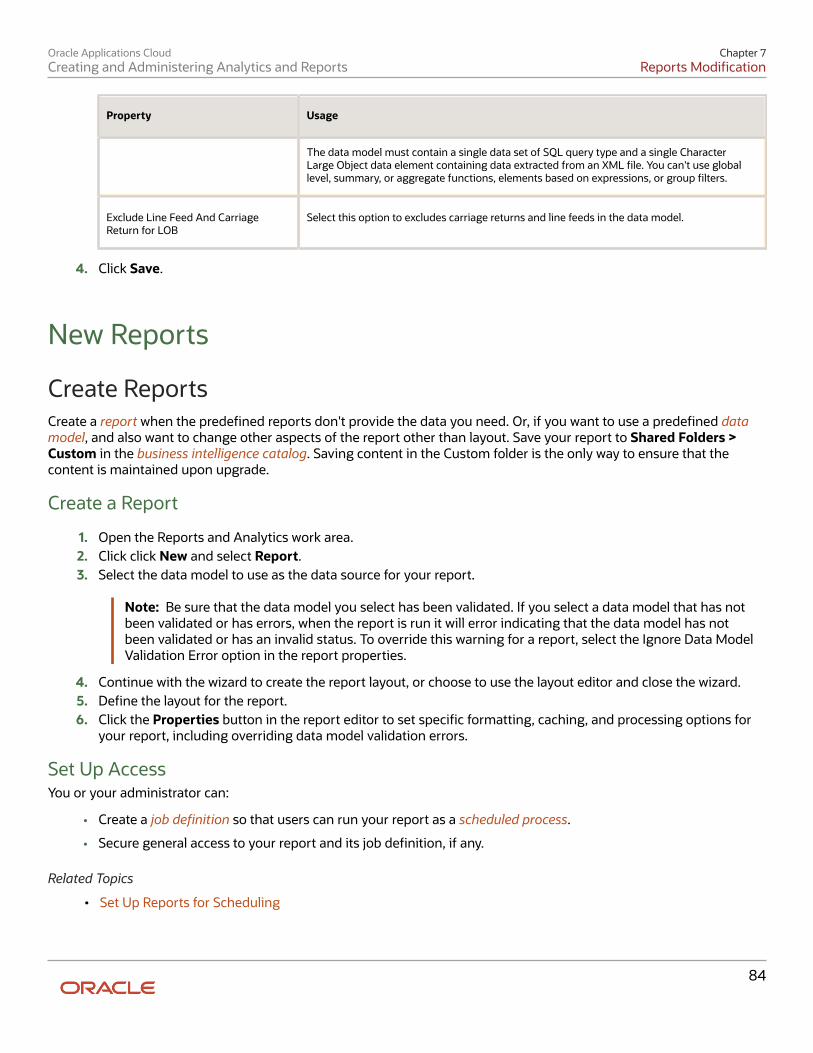
Oracle Applications CloudCreating and Administering Analytics and Reports
Chapter 7Reports Modification
84
Property Usage
The data model must contain a single data set of SQL query type and a single CharacterLarge Object data element containing data extracted from an XML file. You can't use globallevel, summary, or aggregate functions, elements based on expressions, or group filters.
Exclude Line Feed And CarriageReturn for LOB
Select this option to excludes carriage returns and line feeds in the data model.
4. Click Save.
New Reports
Create ReportsCreate a report when the predefined reports don't provide the data you need. Or, if you want to use a predefined datamodel, and also want to change other aspects of the report other than layout. Save your report to Shared Folders >Custom in the business intelligence catalog. Saving content in the Custom folder is the only way to ensure that thecontent is maintained upon upgrade.
Create a Report
1. Open the Reports and Analytics work area.2. Click click New and select Report.3. Select the data model to use as the data source for your report.
Note: Be sure that the data model you select has been validated. If you select a data model that has notbeen validated or has errors, when the report is run it will error indicating that the data model has notbeen validated or has an invalid status. To override this warning for a report, select the Ignore Data ModelValidation Error option in the report properties.
4. Continue with the wizard to create the report layout, or choose to use the layout editor and close the wizard.5. Define the layout for the report.6. Click the Properties button in the report editor to set specific formatting, caching, and processing options for
your report, including overriding data model validation errors.
Set Up AccessYou or your administrator can:
• Create a job definition so that users can run your report as a scheduled process.
• Secure general access to your report and its job definition, if any.
Related Topics
• Set Up Reports for Scheduling
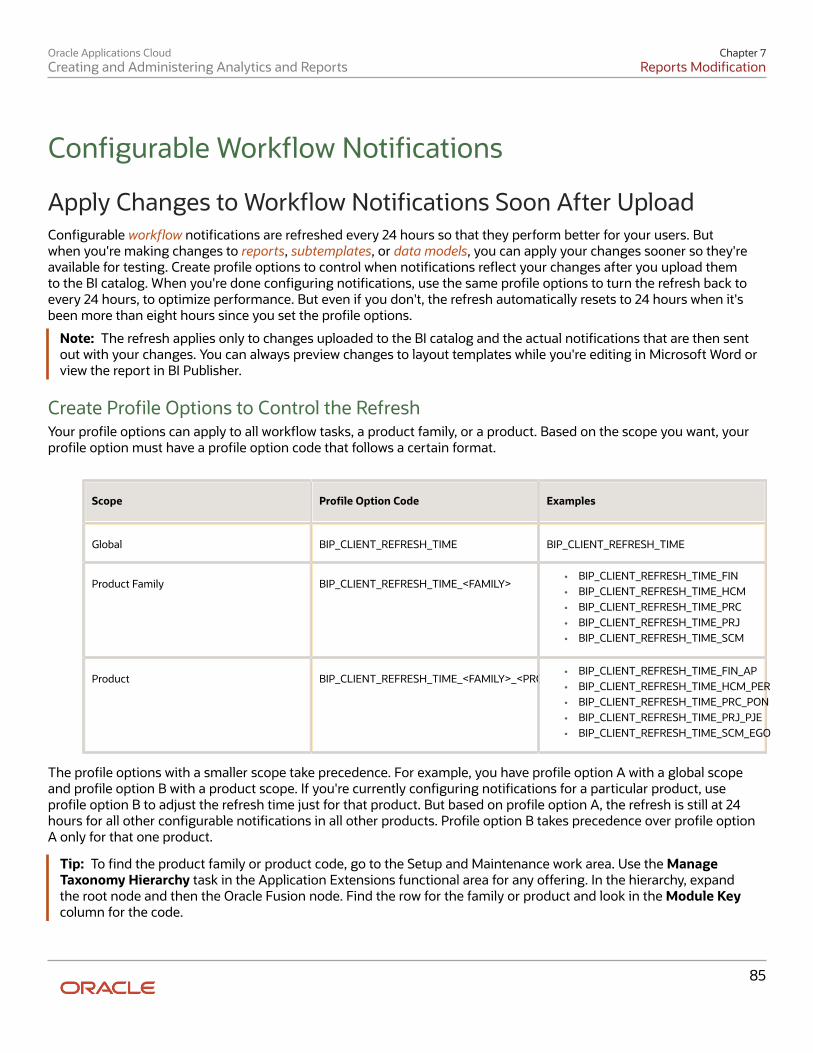
Oracle Applications CloudCreating and Administering Analytics and Reports
Chapter 7Reports Modification
85
Configurable Workflow Notifications
Apply Changes to Workflow Notifications Soon After UploadConfigurable workflow notifications are refreshed every 24 hours so that they perform better for your users. Butwhen you're making changes to reports, subtemplates, or data models, you can apply your changes sooner so they'reavailable for testing. Create profile options to control when notifications reflect your changes after you upload themto the BI catalog. When you're done configuring notifications, use the same profile options to turn the refresh back toevery 24 hours, to optimize performance. But even if you don't, the refresh automatically resets to 24 hours when it'sbeen more than eight hours since you set the profile options.
Note: The refresh applies only to changes uploaded to the BI catalog and the actual notifications that are then sentout with your changes. You can always preview changes to layout templates while you're editing in Microsoft Word orview the report in BI Publisher.
Create Profile Options to Control the RefreshYour profile options can apply to all workflow tasks, a product family, or a product. Based on the scope you want, yourprofile option must have a profile option code that follows a certain format.
Scope Profile Option Code Examples
Global BIP_CLIENT_REFRESH_TIME BIP_CLIENT_REFRESH_TIME
Product Family BIP_CLIENT_REFRESH_TIME_<FAMILY>• BIP_CLIENT_REFRESH_TIME_FIN• BIP_CLIENT_REFRESH_TIME_HCM• BIP_CLIENT_REFRESH_TIME_PRC• BIP_CLIENT_REFRESH_TIME_PRJ• BIP_CLIENT_REFRESH_TIME_SCM
Product BIP_CLIENT_REFRESH_TIME_<FAMILY>_<PRODUCT>• BIP_CLIENT_REFRESH_TIME_FIN_AP• BIP_CLIENT_REFRESH_TIME_HCM_PER• BIP_CLIENT_REFRESH_TIME_PRC_PON• BIP_CLIENT_REFRESH_TIME_PRJ_PJE• BIP_CLIENT_REFRESH_TIME_SCM_EGO
The profile options with a smaller scope take precedence. For example, you have profile option A with a global scopeand profile option B with a product scope. If you're currently configuring notifications for a particular product, useprofile option B to adjust the refresh time just for that product. But based on profile option A, the refresh is still at 24hours for all other configurable notifications in all other products. Profile option B takes precedence over profile optionA only for that one product.
Tip: To find the product family or product code, go to the Setup and Maintenance work area. Use the ManageTaxonomy Hierarchy task in the Application Extensions functional area for any offering. In the hierarchy, expandthe root node and then the Oracle Fusion node. Find the row for the family or product and look in the Module Keycolumn for the code.
Oracle Applications CloudCreating and Administering Analytics and Reports
Chapter 7Reports Modification
86
Now you're ready to create your profile options!
1. In the Setup and Maintenance work area, go to the Manage Applications Core Profile Options task in theApplication Extensions functional area for your offering.
2. On the Manage Applications Core Profile Options page, click the New icon.3. On the Create Profile Option page, enter the profile option code in the format that corresponds to the scope
you want.4. Enter a display name that you can easily remember to help you find the profile option later.5. From the Application list, select Oracle Middleware Extensions for Applications.6. From the Module list, select Application Core.7. Specify a start date.8. Click Save and Close.9. On the Manage Applications Core Profile Options page, make sure your new profile option is selected in the
Search Results: Profile Options subsection.10. In the <Profile Option>: Profile Option Levels subsection, select the Enabled and Updatable check boxes for
the Site level.11. Save your work.
Set the Refresh IntervalIn the Setup and Maintenance work area, go to the Manage Applications Core Administrator Profile Values task inthe Application Extensions functional area. Set your profile option at the Site level and enter 15 or higher for the refreshinterval in minutes. For example, if you enter 15, then your changes are applied to notifications 15 minutes after youupload to the BI catalog.
Caution: Make sure to enter a whole number.
When you're done making and testing your changes, set the profile option back to 1440, which is 24 hours in minutes.If you forget and leave your profile option as is for longer than eight hours, don't worry! At that point, the profile optionresets itself back to 1440 minutes.
Related Topics
• Update Existing Setup Data
• Set Profile Option Values
• Modules in Application Taxonomy
Best Practices for Workflow NotificationsPredefined workflow notifications based on report layout templates all follow a general format. When you edit a copy ofthese layout templates in Microsoft Word, follow the predefined layout as closely as possible for consistency. Also keepin mind shared components and mobile considerations.
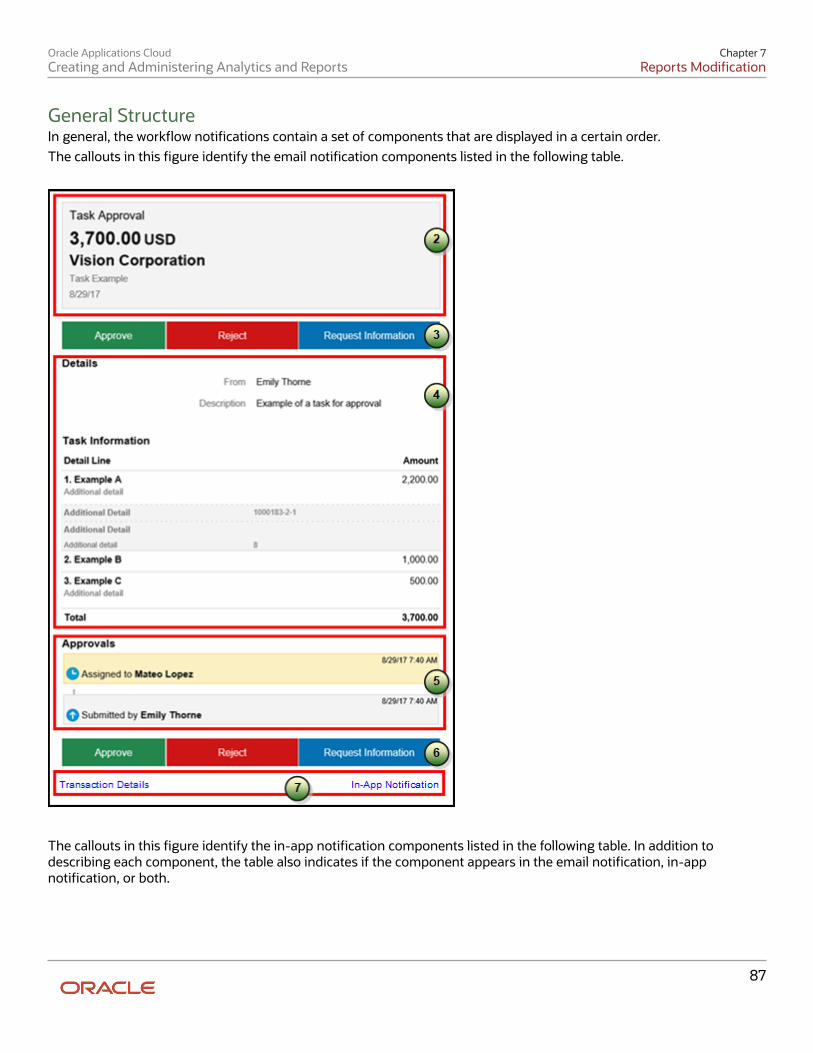
Oracle Applications CloudCreating and Administering Analytics and Reports
Chapter 7Reports Modification
87
General StructureIn general, the workflow notifications contain a set of components that are displayed in a certain order.The callouts in this figure identify the email notification components listed in the following table.
The callouts in this figure identify the in-app notification components listed in the following table. In addition todescribing each component, the table also indicates if the component appears in the email notification, in-appnotification, or both.
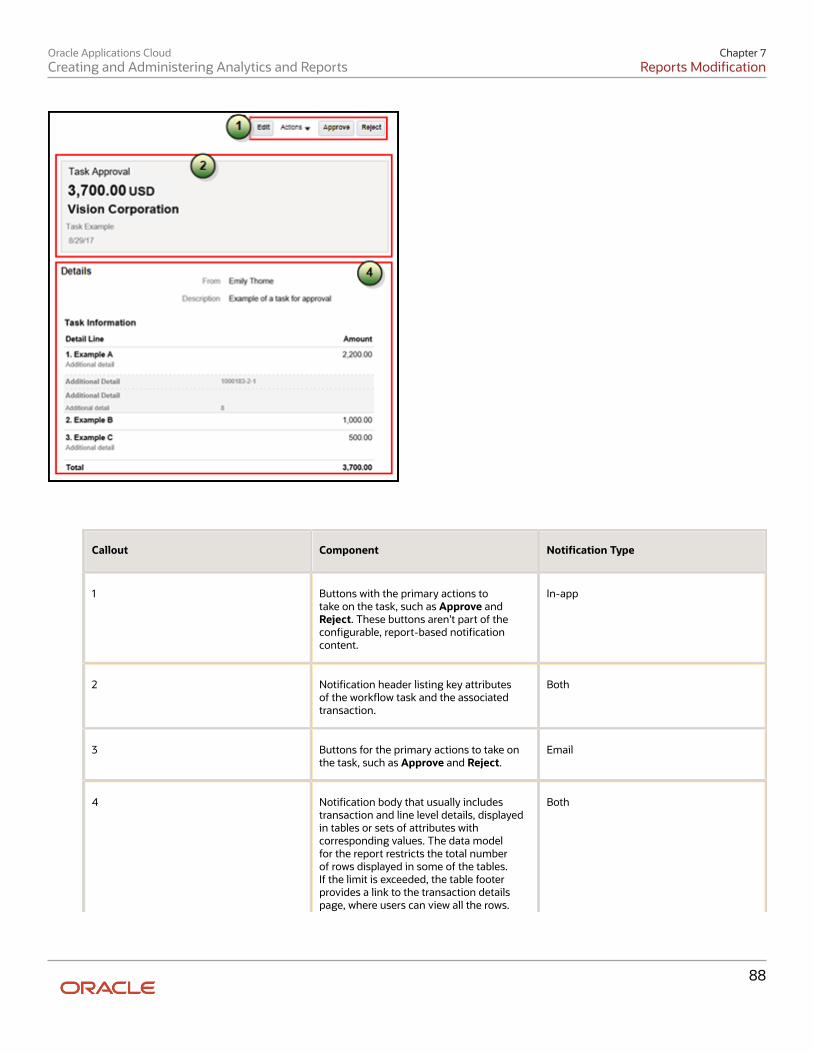
Oracle Applications CloudCreating and Administering Analytics and Reports
Chapter 7Reports Modification
88
Callout Component Notification Type
1 Buttons with the primary actions totake on the task, such as Approve andReject. These buttons aren't part of theconfigurable, report-based notificationcontent.
In-app
2 Notification header listing key attributesof the workflow task and the associatedtransaction.
Both
3 Buttons for the primary actions to take onthe task, such as Approve and Reject.
4 Notification body that usually includestransaction and line level details, displayedin tables or sets of attributes withcorresponding values. The data modelfor the report restricts the total numberof rows displayed in some of the tables.If the limit is exceeded, the table footerprovides a link to the transaction detailspage, where users can view all the rows.
Both
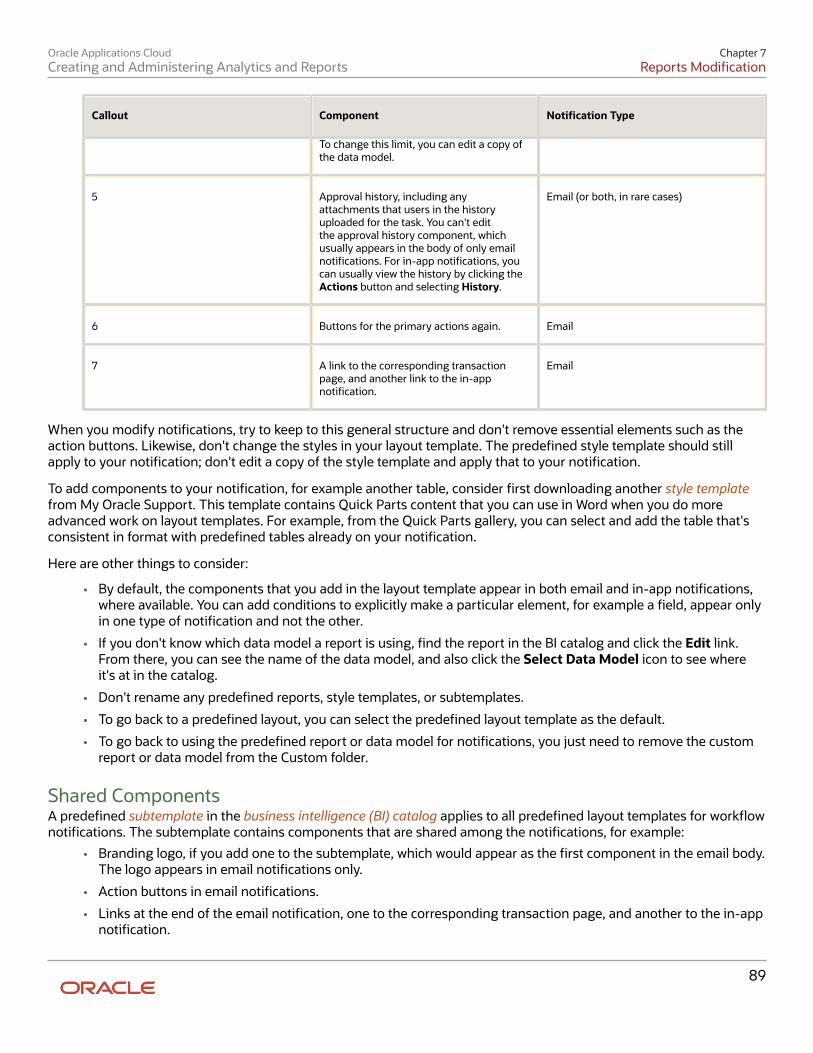
Oracle Applications CloudCreating and Administering Analytics and Reports
Chapter 7Reports Modification
89
Callout Component Notification Type
To change this limit, you can edit a copy ofthe data model.
5 Approval history, including anyattachments that users in the historyuploaded for the task. You can't editthe approval history component, whichusually appears in the body of only emailnotifications. For in-app notifications, youcan usually view the history by clicking theActions button and selecting History.
Email (or both, in rare cases)
6 Buttons for the primary actions again. Email
7 A link to the corresponding transactionpage, and another link to the in-appnotification.
When you modify notifications, try to keep to this general structure and don't remove essential elements such as theaction buttons. Likewise, don't change the styles in your layout template. The predefined style template should stillapply to your notification; don't edit a copy of the style template and apply that to your notification.
To add components to your notification, for example another table, consider first downloading another style templatefrom My Oracle Support. This template contains Quick Parts content that you can use in Word when you do moreadvanced work on layout templates. For example, from the Quick Parts gallery, you can select and add the table that'sconsistent in format with predefined tables already on your notification.
Here are other things to consider:
• By default, the components that you add in the layout template appear in both email and in-app notifications,where available. You can add conditions to explicitly make a particular element, for example a field, appear onlyin one type of notification and not the other.
• If you don't know which data model a report is using, find the report in the BI catalog and click the Edit link.From there, you can see the name of the data model, and also click the Select Data Model icon to see whereit's at in the catalog.
• Don't rename any predefined reports, style templates, or subtemplates.
• To go back to a predefined layout, you can select the predefined layout template as the default.
• To go back to using the predefined report or data model for notifications, you just need to remove the customreport or data model from the Custom folder.
Shared ComponentsA predefined subtemplate in the business intelligence (BI) catalog applies to all predefined layout templates for workflownotifications. The subtemplate contains components that are shared among the notifications, for example:
• Branding logo, if you add one to the subtemplate, which would appear as the first component in the email body.The logo appears in email notifications only.
• Action buttons in email notifications.
• Links at the end of the email notification, one to the corresponding transaction page, and another to the in-appnotification.
Oracle Applications CloudCreating and Administering Analytics and Reports
Chapter 7Reports Modification
90
When you make a copy of a predefined layout template to edit, the copy automatically inherits the same predefinedsubtemplate. To edit these shared components, make a copy of the predefined subtemplate, edit the copied version,and apply it to your own layout templates.
Mobile ConsiderationsBecause users can view the workflow notifications on mobile devices, always consider mobile first and keep thenotifications as simple as possible. For example:
• Don't put too much content horizontally, such as too many columns in tables.
• Keep all text, including attributes and column headings, as short as possible.
• Center align lists of attributes and their values, if they appear outside tables.
Make sure to test your email notifications on mobile devices.
Add a Branding Logo and Change Other Shared Components inWorkflow NotificationsA predefined subtemplate has common components for all workflow notifications based on predefined report layouts.For example, the subtemplate has a place for you to add a branding logo, which would appear at the beginning of emailnotifications. You can change other shared components so that the same changes apply to your notifications. Forexample, for email notifications, you can also change the text on action buttons, or the text of the links that appear atthe end of emails.
Note:• Other than this central subtemplate for all notifications, you might also find predefined subtemplates specific
to a product family. We talk about the central one here, but you would generally follow the same steps for othersubtemplates.
• You must edit a copy of the subtemplate in the Custom folder of the business intelligence (BI) catalog. Don'tdirectly update the predefined subtemplate, including renaming it.
• When you work on your copy of the subtemplate, add your own content or edit what's already there, but don'tremove anything.
• The exact steps can vary depending on your version of Microsoft Word.
Modify Shared Components in the SubtemplateHere's ow you edit a copy of the predefined subtemplate that has the shared components:
1. Click Navigator > Tools > Reports and Analytics.2. Click the Browse Catalog icon.3. In the BI catalog (the Folders pane), expand Shared Folders > Common Content > Templates.4. For Workflow Notification Subtemplate, click More and select Customize.
If you're not using the Customize option, even though it's recommended:a. Click Copy in the toolbar with Workflow Notification Subtemplate selected.b. In the BI catalog, expand Shared Folders > Custom > Common Content > Templates. Create a
Templates folder in this location if it doesn't exist.c. Click Paste in the toolbar.
5. In the BI catalog, with the Templates folder open under the Custom folder, click More for the subtemplate andselect Rename to give it a new name.
Oracle Applications CloudCreating and Administering Analytics and Reports
Chapter 7Reports Modification
91
6. Click the Edit link for the renamed subtemplate.7. In the Templates section, click the link in the Locale column.8. Save the subtemplate .rtf file to your computer.9. Open the .rtf file with Microsoft Word.
◦ To add a logo, insert your own image in the subtemplate.
◦ To change button or link text, edit the text accordingly. Make the same edits wherever that button or linktext appears in the subtemplate.
Caution: To make sure that your layout templates reflect these changes without more rework, don'tedit any other text in the subtemplate .rtf file.
10. Update Word options so that existing links remain intact in the subtemplate.
a. Click File > Options > Advanced.b. In the Word Options dialog box, click Web Options in the General section.c. In the Web Options dialog box, open the Files tab.d. Deselect the Update links on save check box.
11. Save your changes in Word.
Upload the Modified SubtemplateNow you upload your subtemplate to the BI catalog:
1. In the BI catalog, expand Shared Folders > Custom > Common Content > Templates.2. Click Edit for your subtemplate.3. In the Templates section, click the Upload icon.4. Select your modified .rtf subtemplate and a locale, and click OK to replace the original subtemplate.
Point Layout Templates to Your SubtemplateUpdate all the report layout templates that you want to apply your subtemplate to:
1. In Microsoft Word, open the .rtf file for the layout template, as you would to make any other changes to thenotification.
2. At the beginning of the document, change the subtemplate reference. For example, change <?import:xdoxsl:///Common Content/Templates/Workflow Notification Subtemplate.xsb?> to <?import:xdoxsl:///Custom/Common Content/Templates/My Workflow Notification Subtemplate.xsb?>.
3. Save your work.4. Test things out to make sure you see your subtemplate changes in the notification output.
Use Quick Parts for Workflow NotificationsUse the Quick Parts feature in Microsoft Word to easily insert reusable pieces of formatted content. When you editcopies of predefined report layout templates for workflow notifications in Word, you can add predefined Quick Partscontent to your .rtf file. For example, you can insert a table in a format that's consistent with predefined notifications.The predefined Quick Parts content is available in a style template .dotx file on My Oracle Support.
Note: The exact steps can vary depending on your version of Microsoft Word.
Oracle Applications CloudCreating and Administering Analytics and Reports
Chapter 7Reports Modification
92
PrerequisitesTo get the predefined Quick Parts content into your Quick Parts gallery:
1. Open Configurable Workflow Notifications: Implementation Considerations (2215570.1) on My Oracle Support athttps://support.oracle.com.
2. Download the .dotx file and save it to your Microsoft Word template folder, for example C:\Users\<user name>\AppData\Roaming\Microsoft\Templates.
Also, to preview your layout template changes before uploading the .rtf file back to the business intelligence (BI) catalog:
• Generate sample report data from the data model for the report that you're editing.
• Download a local copy of the subtemplate that applies to the layout template.
Adding Quick Parts Content to Workflow NotificationsTo insert content from the Quick Parts gallery into a layout template:
1. In the BI catalog, find the predefined report with the layout template that you want to modify.2. For the report, click More and select Customize.
If you're not using the Customize option:
a. Copy the predefined report and paste it in an appropriate subfolder within the Custom folder.b. Click the Edit link for the copied report.
3. Click Edit for the layout template to insert Quick Parts content into, and save the .rtf file to your computer witha new file name.
4. Open the .rtf file with Microsoft Word.5. Put your cursor where you want to insert new content.6. From the Insert tab on the ribbon, click Quick Parts within the Text group, and select the component to insert.7. Edit the inserted component as needed and add any other components.8. Save your changes in Word.
Previewing the Layout Template ChangesTo preview your edits before uploading your layout template to the BI catalog:
1. On the ribbon, open the BI Publisher tab and click Sample XML within the Load Data group to import sampledata from the data model. Skip this step if you already loaded sample data.
2. At the beginning of the document, replace the path with the location of the downloaded subtemplate file onyour computer. For example, change <?import:xdoxsl:///Common Content/Templates/Workflow NotificationSubtemplate.xsb?> to <?import:file:///C:/Template_Directory/FinFunWorkflowNotificationSub.rtf?>.
3. From the BI Publisher tab on the ribbon, click HTML in the Preview group.4. If the preview reflects your changes as expected, then change the path back to the original location.5. Save your changes in Word.
Uploading the Modified Layout TemplateTo upload your layout template to the BI catalog after previewing the changes:
1. Back in the BI catalog, click Edit for the report within the Custom folder, if that page isn't still open.2. Click the View a list link.3. Click the Create icon on the table toolbar.4. In the Upload or Generate Layout section, click Upload.5. Upload your edited .rtf file with a unique layout name.
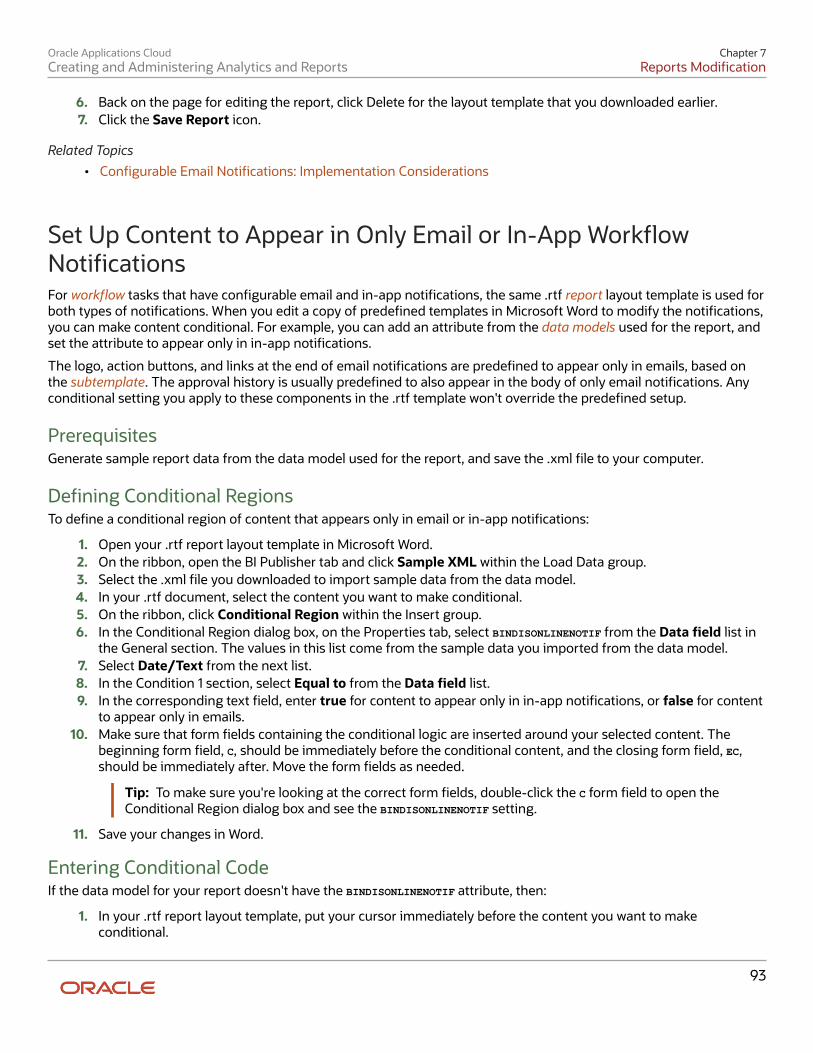
Oracle Applications CloudCreating and Administering Analytics and Reports
Chapter 7Reports Modification
93
6. Back on the page for editing the report, click Delete for the layout template that you downloaded earlier.7. Click the Save Report icon.
Related Topics• Configurable Email Notifications: Implementation Considerations
Set Up Content to Appear in Only Email or In-App WorkflowNotificationsFor workflow tasks that have configurable email and in-app notifications, the same .rtf report layout template is used forboth types of notifications. When you edit a copy of predefined templates in Microsoft Word to modify the notifications,you can make content conditional. For example, you can add an attribute from the data models used for the report, andset the attribute to appear only in in-app notifications.
The logo, action buttons, and links at the end of email notifications are predefined to appear only in emails, based onthe subtemplate. The approval history is usually predefined to also appear in the body of only email notifications. Anyconditional setting you apply to these components in the .rtf template won't override the predefined setup.
PrerequisitesGenerate sample report data from the data model used for the report, and save the .xml file to your computer.
Defining Conditional RegionsTo define a conditional region of content that appears only in email or in-app notifications:
1. Open your .rtf report layout template in Microsoft Word.2. On the ribbon, open the BI Publisher tab and click Sample XML within the Load Data group.3. Select the .xml file you downloaded to import sample data from the data model.4. In your .rtf document, select the content you want to make conditional.5. On the ribbon, click Conditional Region within the Insert group.6. In the Conditional Region dialog box, on the Properties tab, select BINDISONLINENOTIF from the Data field list in
the General section. The values in this list come from the sample data you imported from the data model.7. Select Date/Text from the next list.8. In the Condition 1 section, select Equal to from the Data field list.9. In the corresponding text field, enter true for content to appear only in in-app notifications, or false for content
to appear only in emails.10. Make sure that form fields containing the conditional logic are inserted around your selected content. The
beginning form field, C, should be immediately before the conditional content, and the closing form field, EC,should be immediately after. Move the form fields as needed.
Tip: To make sure you're looking at the correct form fields, double-click the C form field to open theConditional Region dialog box and see the BINDISONLINENOTIF setting.
11. Save your changes in Word.
Entering Conditional CodeIf the data model for your report doesn't have the BINDISONLINENOTIF attribute, then:
1. In your .rtf report layout template, put your cursor immediately before the content you want to makeconditional.
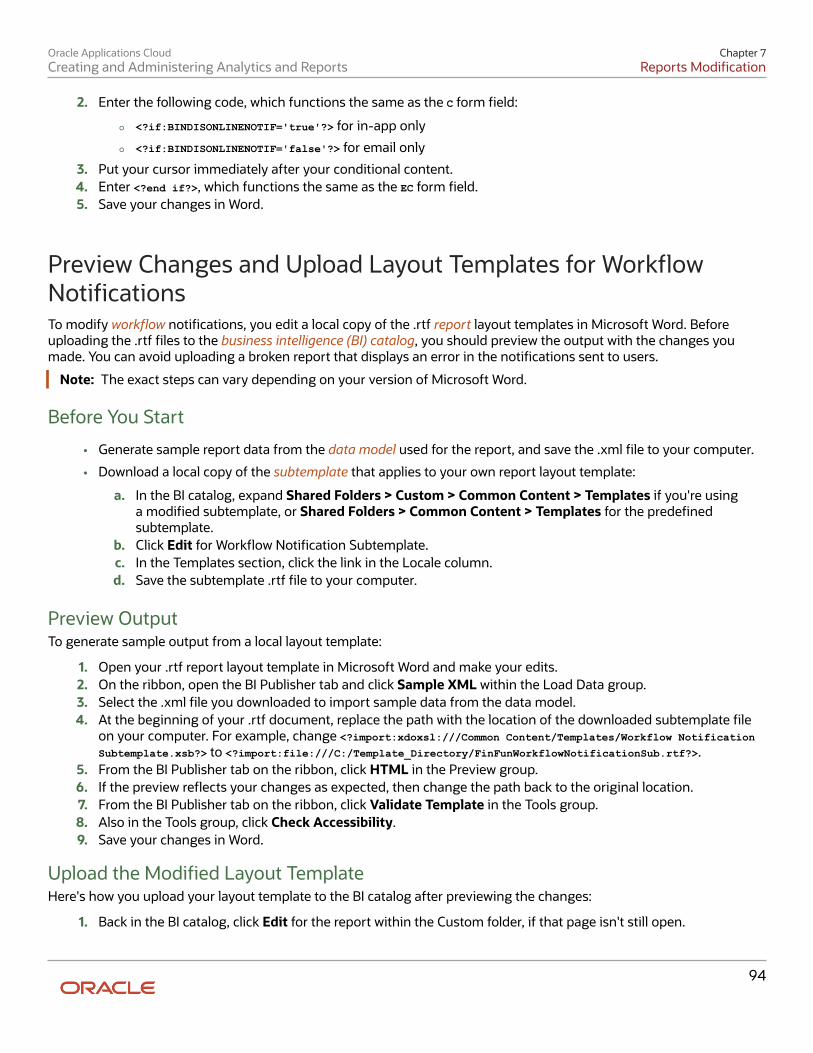
Oracle Applications CloudCreating and Administering Analytics and Reports
Chapter 7Reports Modification
94
2. Enter the following code, which functions the same as the C form field:
◦ <?if:BINDISONLINENOTIF='true'?> for in-app only
◦ <?if:BINDISONLINENOTIF='false'?> for email only
3. Put your cursor immediately after your conditional content.4. Enter <?end if?>, which functions the same as the EC form field.5. Save your changes in Word.
Preview Changes and Upload Layout Templates for WorkflowNotificationsTo modify workflow notifications, you edit a local copy of the .rtf report layout templates in Microsoft Word. Beforeuploading the .rtf files to the business intelligence (BI) catalog, you should preview the output with the changes youmade. You can avoid uploading a broken report that displays an error in the notifications sent to users.
Note: The exact steps can vary depending on your version of Microsoft Word.
Before You Start
• Generate sample report data from the data model used for the report, and save the .xml file to your computer.
• Download a local copy of the subtemplate that applies to your own report layout template:
a. In the BI catalog, expand Shared Folders > Custom > Common Content > Templates if you're usinga modified subtemplate, or Shared Folders > Common Content > Templates for the predefinedsubtemplate.
b. Click Edit for Workflow Notification Subtemplate.c. In the Templates section, click the link in the Locale column.d. Save the subtemplate .rtf file to your computer.
Preview OutputTo generate sample output from a local layout template:
1. Open your .rtf report layout template in Microsoft Word and make your edits.2. On the ribbon, open the BI Publisher tab and click Sample XML within the Load Data group.3. Select the .xml file you downloaded to import sample data from the data model.4. At the beginning of your .rtf document, replace the path with the location of the downloaded subtemplate file
on your computer. For example, change <?import:xdoxsl:///Common Content/Templates/Workflow NotificationSubtemplate.xsb?> to <?import:file:///C:/Template_Directory/FinFunWorkflowNotificationSub.rtf?>.
5. From the BI Publisher tab on the ribbon, click HTML in the Preview group.6. If the preview reflects your changes as expected, then change the path back to the original location.7. From the BI Publisher tab on the ribbon, click Validate Template in the Tools group.8. Also in the Tools group, click Check Accessibility.9. Save your changes in Word.
Upload the Modified Layout TemplateHere's how you upload your layout template to the BI catalog after previewing the changes:
1. Back in the BI catalog, click Edit for the report within the Custom folder, if that page isn't still open.

Oracle Applications CloudCreating and Administering Analytics and Reports
Chapter 7Reports Modification
95
2. Click the View a list link.3. Click the Create icon on the table toolbar.4. In the Upload or Generate Layout section, click Upload.5. Upload your edited .rtf file with a unique layout name.6. Back on the page for editing the report, go back to the list view.7. Select the Default Layout check box for your layout template. If you ever want to go back to the predefined
layout, you can select it as default later.8. Click the Save Report icon.

Oracle Applications CloudCreating and Administering Analytics and Reports
Chapter 7Reports Modification
96
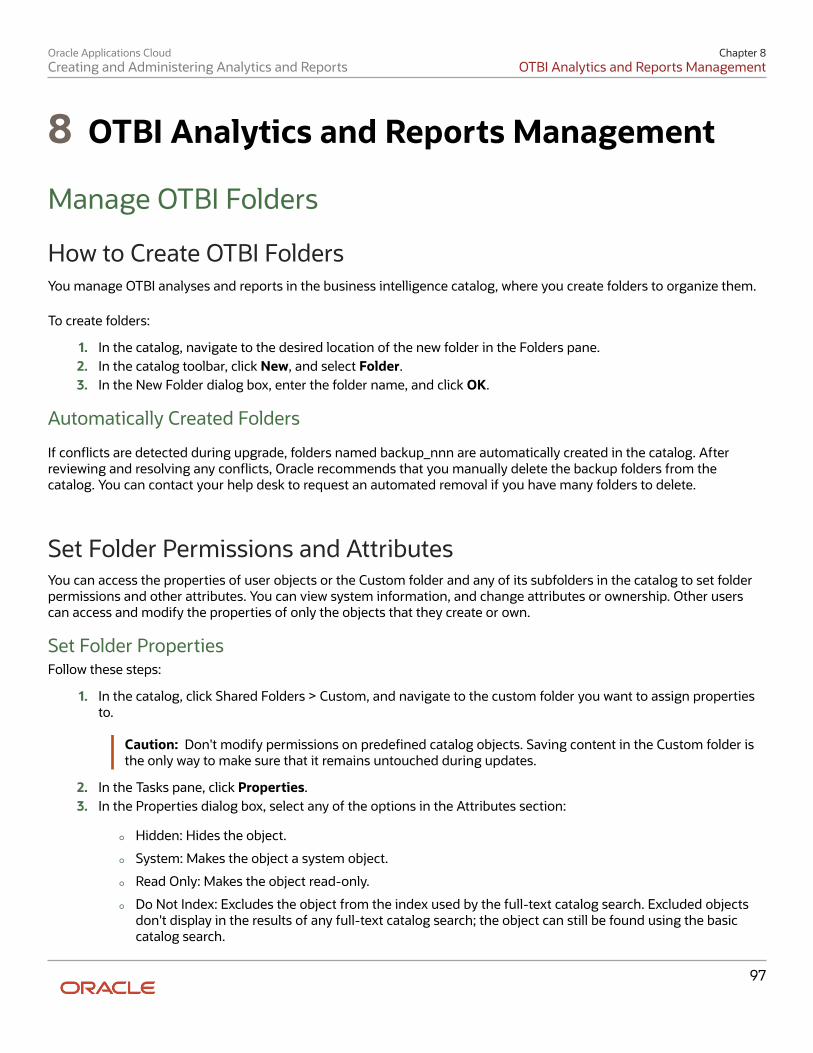
Oracle Applications CloudCreating and Administering Analytics and Reports
Chapter 8OTBI Analytics and Reports Management
97
8 OTBI Analytics and Reports Management
Manage OTBI Folders
How to Create OTBI FoldersYou manage OTBI analyses and reports in the business intelligence catalog, where you create folders to organize them.
To create folders:
1. In the catalog, navigate to the desired location of the new folder in the Folders pane.2. In the catalog toolbar, click New, and select Folder.3. In the New Folder dialog box, enter the folder name, and click OK.
Automatically Created Folders
If conflicts are detected during upgrade, folders named backup_nnn are automatically created in the catalog. Afterreviewing and resolving any conflicts, Oracle recommends that you manually delete the backup folders from thecatalog. You can contact your help desk to request an automated removal if you have many folders to delete.
Set Folder Permissions and AttributesYou can access the properties of user objects or the Custom folder and any of its subfolders in the catalog to set folderpermissions and other attributes. You can view system information, and change attributes or ownership. Other userscan access and modify the properties of only the objects that they create or own.
Set Folder PropertiesFollow these steps:
1. In the catalog, click Shared Folders > Custom, and navigate to the custom folder you want to assign propertiesto.
Caution: Don't modify permissions on predefined catalog objects. Saving content in the Custom folder isthe only way to make sure that it remains untouched during updates.
2. In the Tasks pane, click Properties.3. In the Properties dialog box, select any of the options in the Attributes section:
◦ Hidden: Hides the object.
◦ System: Makes the object a system object.
◦ Read Only: Makes the object read-only.
◦ Do Not Index: Excludes the object from the index used by the full-text catalog search. Excluded objectsdon't display in the results of any full-text catalog search; the object can still be found using the basiccatalog search.
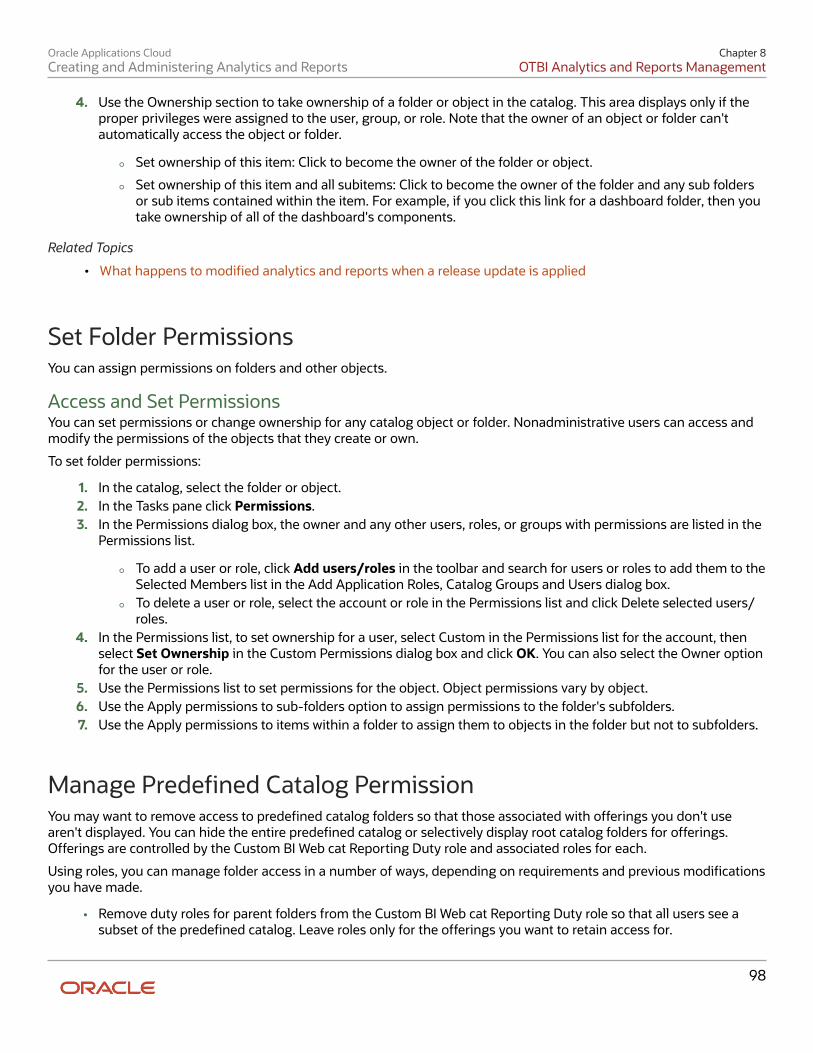
Oracle Applications CloudCreating and Administering Analytics and Reports
Chapter 8OTBI Analytics and Reports Management
98
4. Use the Ownership section to take ownership of a folder or object in the catalog. This area displays only if theproper privileges were assigned to the user, group, or role. Note that the owner of an object or folder can'tautomatically access the object or folder.
◦ Set ownership of this item: Click to become the owner of the folder or object.
◦ Set ownership of this item and all subitems: Click to become the owner of the folder and any sub foldersor sub items contained within the item. For example, if you click this link for a dashboard folder, then youtake ownership of all of the dashboard's components.
Related Topics
• What happens to modified analytics and reports when a release update is applied
Set Folder PermissionsYou can assign permissions on folders and other objects.
Access and Set PermissionsYou can set permissions or change ownership for any catalog object or folder. Nonadministrative users can access andmodify the permissions of the objects that they create or own.
To set folder permissions:
1. In the catalog, select the folder or object.2. In the Tasks pane click Permissions.3. In the Permissions dialog box, the owner and any other users, roles, or groups with permissions are listed in the
Permissions list.
◦ To add a user or role, click Add users/roles in the toolbar and search for users or roles to add them to theSelected Members list in the Add Application Roles, Catalog Groups and Users dialog box.
◦ To delete a user or role, select the account or role in the Permissions list and click Delete selected users/roles.
4. In the Permissions list, to set ownership for a user, select Custom in the Permissions list for the account, thenselect Set Ownership in the Custom Permissions dialog box and click OK. You can also select the Owner optionfor the user or role.
5. Use the Permissions list to set permissions for the object. Object permissions vary by object.6. Use the Apply permissions to sub-folders option to assign permissions to the folder's subfolders.7. Use the Apply permissions to items within a folder to assign them to objects in the folder but not to subfolders.
Manage Predefined Catalog PermissionYou may want to remove access to predefined catalog folders so that those associated with offerings you don't usearen't displayed. You can hide the entire predefined catalog or selectively display root catalog folders for offerings.Offerings are controlled by the Custom BI Web cat Reporting Duty role and associated roles for each.
Using roles, you can manage folder access in a number of ways, depending on requirements and previous modificationsyou have made.
• Remove duty roles for parent folders from the Custom BI Web cat Reporting Duty role so that all users see asubset of the predefined catalog. Leave roles only for the offerings you want to retain access for.
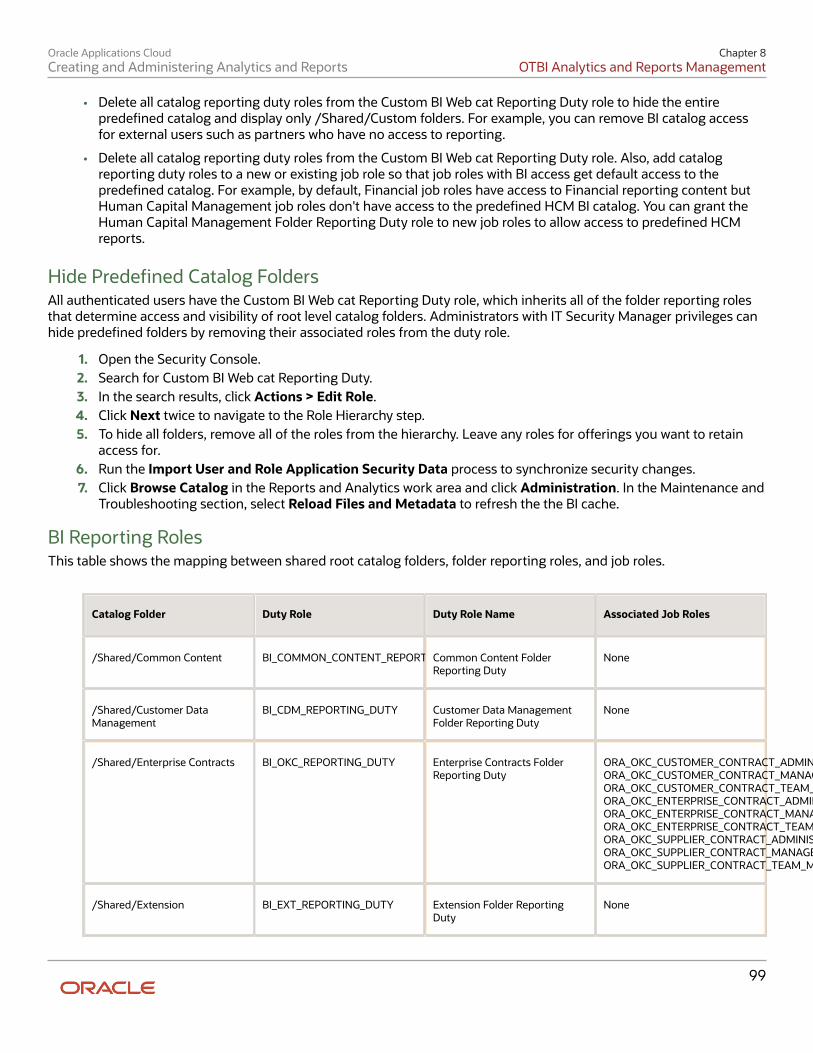
Oracle Applications CloudCreating and Administering Analytics and Reports
Chapter 8OTBI Analytics and Reports Management
99
• Delete all catalog reporting duty roles from the Custom BI Web cat Reporting Duty role to hide the entirepredefined catalog and display only /Shared/Custom folders. For example, you can remove BI catalog accessfor external users such as partners who have no access to reporting.
• Delete all catalog reporting duty roles from the Custom BI Web cat Reporting Duty role. Also, add catalogreporting duty roles to a new or existing job role so that job roles with BI access get default access to thepredefined catalog. For example, by default, Financial job roles have access to Financial reporting content butHuman Capital Management job roles don't have access to the predefined HCM BI catalog. You can grant theHuman Capital Management Folder Reporting Duty role to new job roles to allow access to predefined HCMreports.
Hide Predefined Catalog FoldersAll authenticated users have the Custom BI Web cat Reporting Duty role, which inherits all of the folder reporting rolesthat determine access and visibility of root level catalog folders. Administrators with IT Security Manager privileges canhide predefined folders by removing their associated roles from the duty role.
1. Open the Security Console.2. Search for Custom BI Web cat Reporting Duty.3. In the search results, click Actions > Edit Role.4. Click Next twice to navigate to the Role Hierarchy step.5. To hide all folders, remove all of the roles from the hierarchy. Leave any roles for offerings you want to retain
access for.6. Run the Import User and Role Application Security Data process to synchronize security changes.7. Click Browse Catalog in the Reports and Analytics work area and click Administration. In the Maintenance and
Troubleshooting section, select Reload Files and Metadata to refresh the the BI cache.
BI Reporting RolesThis table shows the mapping between shared root catalog folders, folder reporting roles, and job roles.
Catalog Folder Duty Role Duty Role Name Associated Job Roles
/Shared/Common Content BI_COMMON_CONTENT_REPORTING_DUTYCommon Content FolderReporting Duty
None
/Shared/Customer DataManagement
BI_CDM_REPORTING_DUTY Customer Data ManagementFolder Reporting Duty
None
/Shared/Enterprise Contracts BI_OKC_REPORTING_DUTY Enterprise Contracts FolderReporting Duty
ORA_OKC_CUSTOMER_CONTRACT_ADMINISTRATOR_JOB,ORA_OKC_CUSTOMER_CONTRACT_MANAGER_JOB,ORA_OKC_CUSTOMER_CONTRACT_TEAM_MEMBER_ABSTRACT,ORA_OKC_ENTERPRISE_CONTRACT_ADMINISTRATOR_JOB,ORA_OKC_ENTERPRISE_CONTRACT_MANAGER_JOB,ORA_OKC_ENTERPRISE_CONTRACT_TEAM_MEMBER_ABSTRACT,ORA_OKC_SUPPLIER_CONTRACT_ADMINISTRATOR_JOB,ORA_OKC_SUPPLIER_CONTRACT_MANAGER_JOB,ORA_OKC_SUPPLIER_CONTRACT_TEAM_MEMBER_ABSTRACT
/Shared/Extension BI_EXT_REPORTING_DUTY Extension Folder ReportingDuty
None
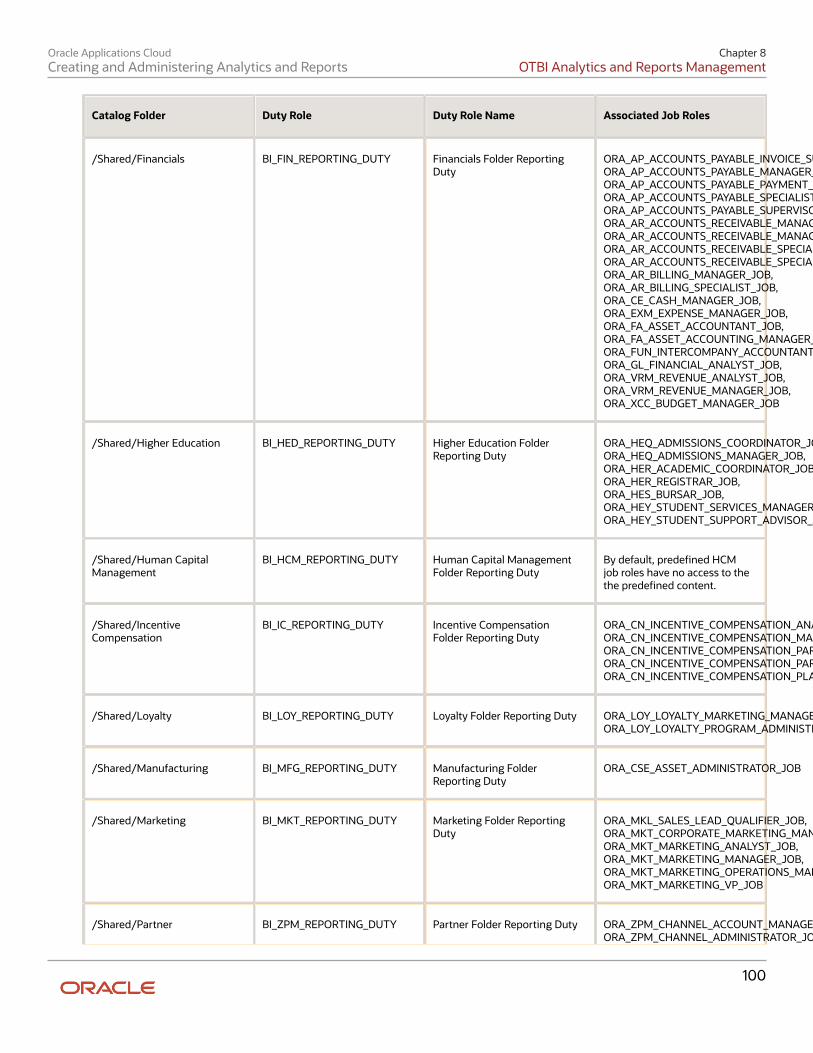
Oracle Applications CloudCreating and Administering Analytics and Reports
Chapter 8OTBI Analytics and Reports Management
100
Catalog Folder Duty Role Duty Role Name Associated Job Roles
/Shared/Financials BI_FIN_REPORTING_DUTY Financials Folder ReportingDuty
ORA_AP_ACCOUNTS_PAYABLE_INVOICE_SUPERVISOR_JOBORA_AP_ACCOUNTS_PAYABLE_MANAGER_JOB,ORA_AP_ACCOUNTS_PAYABLE_PAYMENT_SUPERVISOR_JOB,ORA_AP_ACCOUNTS_PAYABLE_SPECIALIST_JOB,ORA_AP_ACCOUNTS_PAYABLE_SUPERVISOR_JOB,ORA_AR_ACCOUNTS_RECEIVABLE_MANAGER_JOB,ORA_AR_ACCOUNTS_RECEIVABLE_MANAGER_SOD_JOB,ORA_AR_ACCOUNTS_RECEIVABLE_SPECIALIST_JOB,ORA_AR_ACCOUNTS_RECEIVABLE_SPECIALIST_SOD_JOB,ORA_AR_BILLING_MANAGER_JOB,ORA_AR_BILLING_SPECIALIST_JOB,ORA_CE_CASH_MANAGER_JOB,ORA_EXM_EXPENSE_MANAGER_JOB,ORA_FA_ASSET_ACCOUNTANT_JOB,ORA_FA_ASSET_ACCOUNTING_MANAGER_JOB,ORA_FUN_INTERCOMPANY_ACCOUNTANT_JOB,ORA_GL_FINANCIAL_ANALYST_JOB,ORA_VRM_REVENUE_ANALYST_JOB,ORA_VRM_REVENUE_MANAGER_JOB,ORA_XCC_BUDGET_MANAGER_JOB
/Shared/Higher Education BI_HED_REPORTING_DUTY Higher Education FolderReporting Duty
ORA_HEQ_ADMISSIONS_COORDINATOR_JOB,ORA_HEQ_ADMISSIONS_MANAGER_JOB,ORA_HER_ACADEMIC_COORDINATOR_JOB,ORA_HER_REGISTRAR_JOB,ORA_HES_BURSAR_JOB,ORA_HEY_STUDENT_SERVICES_MANAGER_JOB,ORA_HEY_STUDENT_SUPPORT_ADVISOR_JOB
/Shared/Human CapitalManagement
BI_HCM_REPORTING_DUTY Human Capital ManagementFolder Reporting Duty
By default, predefined HCMjob roles have no access to thethe predefined content.
/Shared/IncentiveCompensation
BI_IC_REPORTING_DUTY Incentive CompensationFolder Reporting Duty
ORA_CN_INCENTIVE_COMPENSATION_ANALYST_JOB,ORA_CN_INCENTIVE_COMPENSATION_MANAGER_JOB,ORA_CN_INCENTIVE_COMPENSATION_PARTICIPANT_ABSTRACT,ORA_CN_INCENTIVE_COMPENSATION_PARTICIPANT_MANAGER_ABSTRACT,ORA_CN_INCENTIVE_COMPENSATION_PLAN_ADMINISTRATOR_JOB
/Shared/Loyalty BI_LOY_REPORTING_DUTY Loyalty Folder Reporting Duty ORA_LOY_LOYALTY_MARKETING_MANAGER_JOB,ORA_LOY_LOYALTY_PROGRAM_ADMINISTRATOR_JOB
/Shared/Manufacturing BI_MFG_REPORTING_DUTY Manufacturing FolderReporting Duty
ORA_CSE_ASSET_ADMINISTRATOR_JOB
/Shared/Marketing BI_MKT_REPORTING_DUTY Marketing Folder ReportingDuty
ORA_MKL_SALES_LEAD_QUALIFIER_JOB,ORA_MKT_CORPORATE_MARKETING_MANAGER_JOB,ORA_MKT_MARKETING_ANALYST_JOB,ORA_MKT_MARKETING_MANAGER_JOB,ORA_MKT_MARKETING_OPERATIONS_MANAGER_JOB,ORA_MKT_MARKETING_VP_JOB
/Shared/Partner BI_ZPM_REPORTING_DUTY Partner Folder Reporting Duty ORA_ZPM_CHANNEL_ACCOUNT_MANAGER_JOB,ORA_ZPM_CHANNEL_ADMINISTRATOR_JOB,
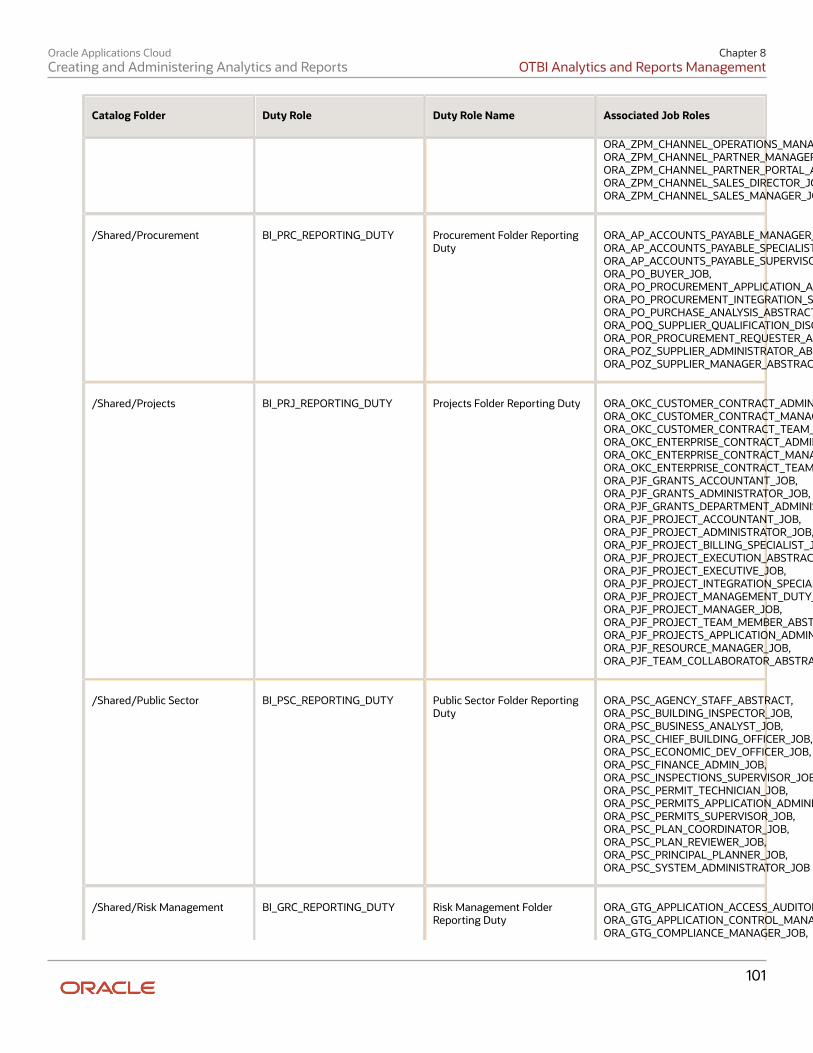
Oracle Applications CloudCreating and Administering Analytics and Reports
Chapter 8OTBI Analytics and Reports Management
101
Catalog Folder Duty Role Duty Role Name Associated Job Roles
ORA_ZPM_CHANNEL_OPERATIONS_MANAGER_JOB,ORA_ZPM_CHANNEL_PARTNER_MANAGER_JOB,ORA_ZPM_CHANNEL_PARTNER_PORTAL_ADMINISTRATOR_JOB,ORA_ZPM_CHANNEL_SALES_DIRECTOR_JOB,ORA_ZPM_CHANNEL_SALES_MANAGER_JOB
/Shared/Procurement BI_PRC_REPORTING_DUTY Procurement Folder ReportingDuty
ORA_AP_ACCOUNTS_PAYABLE_MANAGER_JOB,ORA_AP_ACCOUNTS_PAYABLE_SPECIALIST_JOB,ORA_AP_ACCOUNTS_PAYABLE_SUPERVISOR_JOB,ORA_PO_BUYER_JOB,ORA_PO_PROCUREMENT_APPLICATION_ADMIN_JOB,ORA_PO_PROCUREMENT_INTEGRATION_SPECIALIST_JOB,ORA_PO_PURCHASE_ANALYSIS_ABSTRACT,ORA_POQ_SUPPLIER_QUALIFICATION_DISCRETIONARY,ORA_POR_PROCUREMENT_REQUESTER_ABSTRACT,ORA_POZ_SUPPLIER_ADMINISTRATOR_ABSTRACT,ORA_POZ_SUPPLIER_MANAGER_ABSTRACT
/Shared/Projects BI_PRJ_REPORTING_DUTY Projects Folder Reporting Duty ORA_OKC_CUSTOMER_CONTRACT_ADMINISTRATOR_JOB,ORA_OKC_CUSTOMER_CONTRACT_MANAGER_JOB,ORA_OKC_CUSTOMER_CONTRACT_TEAM_MEMBER_ABSTRACT,ORA_OKC_ENTERPRISE_CONTRACT_ADMINISTRATOR_JOB,ORA_OKC_ENTERPRISE_CONTRACT_MANAGER_JOB,ORA_OKC_ENTERPRISE_CONTRACT_TEAM_MEMBER_ABSTRACT,ORA_PJF_GRANTS_ACCOUNTANT_JOB,ORA_PJF_GRANTS_ADMINISTRATOR_JOB,ORA_PJF_GRANTS_DEPARTMENT_ADMINISTRATOR_JOB,ORA_PJF_PROJECT_ACCOUNTANT_JOB,ORA_PJF_PROJECT_ADMINISTRATOR_JOB,ORA_PJF_PROJECT_BILLING_SPECIALIST_JOB,ORA_PJF_PROJECT_EXECUTION_ABSTRACT,ORA_PJF_PROJECT_EXECUTIVE_JOB,ORA_PJF_PROJECT_INTEGRATION_SPECIALIST_JOB,ORA_PJF_PROJECT_MANAGEMENT_DUTY_ABSTRACT,ORA_PJF_PROJECT_MANAGER_JOB,ORA_PJF_PROJECT_TEAM_MEMBER_ABSTRACT,ORA_PJF_PROJECTS_APPLICATION_ADMINISTRATOR_JOB,ORA_PJF_RESOURCE_MANAGER_JOB,ORA_PJF_TEAM_COLLABORATOR_ABSTRACT
/Shared/Public Sector BI_PSC_REPORTING_DUTY Public Sector Folder ReportingDuty
ORA_PSC_AGENCY_STAFF_ABSTRACT,ORA_PSC_BUILDING_INSPECTOR_JOB,ORA_PSC_BUSINESS_ANALYST_JOB,ORA_PSC_CHIEF_BUILDING_OFFICER_JOB,ORA_PSC_ECONOMIC_DEV_OFFICER_JOB,ORA_PSC_FINANCE_ADMIN_JOB,ORA_PSC_INSPECTIONS_SUPERVISOR_JOB,ORA_PSC_PERMIT_TECHNICIAN_JOB,ORA_PSC_PERMITS_APPLICATION_ADMINISTRATOR_JOB,ORA_PSC_PERMITS_SUPERVISOR_JOB,ORA_PSC_PLAN_COORDINATOR_JOB,ORA_PSC_PLAN_REVIEWER_JOB,ORA_PSC_PRINCIPAL_PLANNER_JOB,ORA_PSC_SYSTEM_ADMINISTRATOR_JOB
/Shared/Risk Management BI_GRC_REPORTING_DUTY Risk Management FolderReporting Duty
ORA_GTG_APPLICATION_ACCESS_AUDITOR_JOB,ORA_GTG_APPLICATION_CONTROL_MANAGER_JOB,ORA_GTG_COMPLIANCE_MANAGER_JOB,
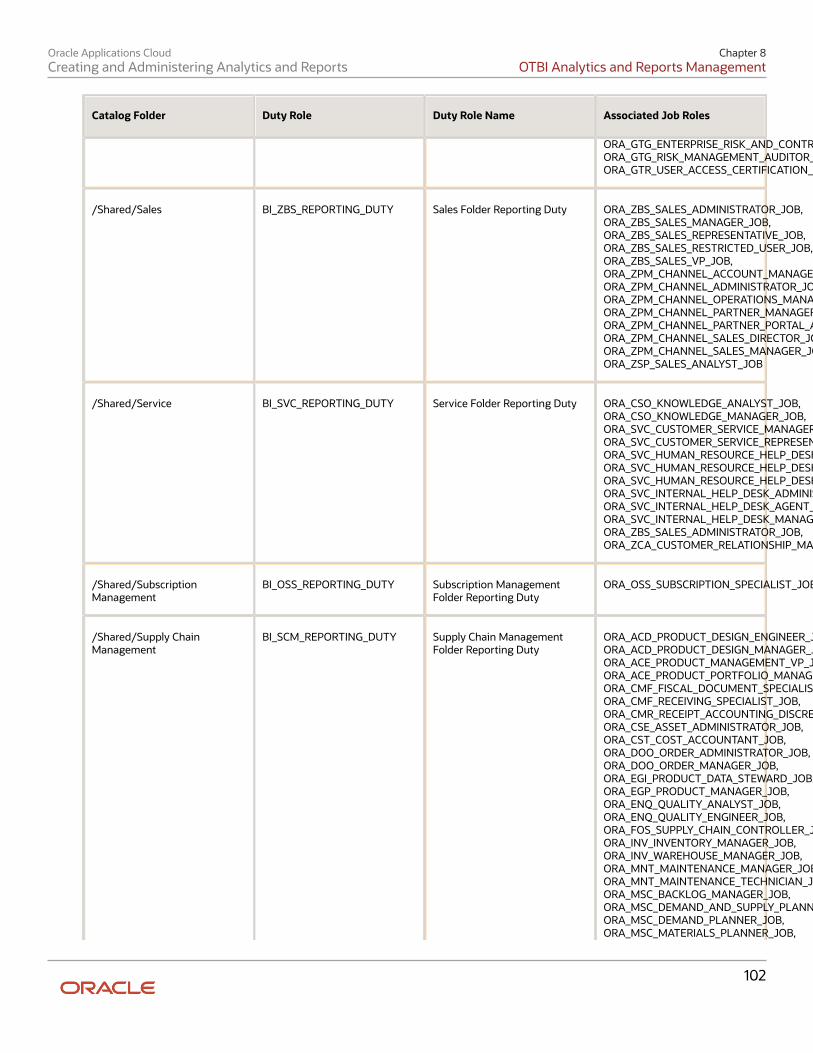
Oracle Applications CloudCreating and Administering Analytics and Reports
Chapter 8OTBI Analytics and Reports Management
102
Catalog Folder Duty Role Duty Role Name Associated Job Roles
ORA_GTG_ENTERPRISE_RISK_AND_CONTROL_MANAGER_JOB,ORA_GTG_RISK_MANAGEMENT_AUDITOR_JOB,ORA_GTR_USER_ACCESS_CERTIFICATION_MANAGER_JOB
/Shared/Sales BI_ZBS_REPORTING_DUTY Sales Folder Reporting Duty ORA_ZBS_SALES_ADMINISTRATOR_JOB,ORA_ZBS_SALES_MANAGER_JOB,ORA_ZBS_SALES_REPRESENTATIVE_JOB,ORA_ZBS_SALES_RESTRICTED_USER_JOB,ORA_ZBS_SALES_VP_JOB,ORA_ZPM_CHANNEL_ACCOUNT_MANAGER_JOB,ORA_ZPM_CHANNEL_ADMINISTRATOR_JOB,ORA_ZPM_CHANNEL_OPERATIONS_MANAGER_JOB,ORA_ZPM_CHANNEL_PARTNER_MANAGER_JOB,ORA_ZPM_CHANNEL_PARTNER_PORTAL_ADMINISTRATOR_JOB,ORA_ZPM_CHANNEL_SALES_DIRECTOR_JOB,ORA_ZPM_CHANNEL_SALES_MANAGER_JOB,ORA_ZSP_SALES_ANALYST_JOB
/Shared/Service BI_SVC_REPORTING_DUTY Service Folder Reporting Duty ORA_CSO_KNOWLEDGE_ANALYST_JOB,ORA_CSO_KNOWLEDGE_MANAGER_JOB,ORA_SVC_CUSTOMER_SERVICE_MANAGER_JOB,ORA_SVC_CUSTOMER_SERVICE_REPRESENTATIVE_JOB,ORA_SVC_HUMAN_RESOURCE_HELP_DESK_ADMINISTRATOR_JOB,ORA_SVC_HUMAN_RESOURCE_HELP_DESK_AGENT_JOB,ORA_SVC_HUMAN_RESOURCE_HELP_DESK_MANAGER_JOB,ORA_SVC_INTERNAL_HELP_DESK_ADMINISTRATOR_JOB,ORA_SVC_INTERNAL_HELP_DESK_AGENT_JOB,ORA_SVC_INTERNAL_HELP_DESK_MANAGER_JOB,ORA_ZBS_SALES_ADMINISTRATOR_JOB,ORA_ZCA_CUSTOMER_RELATIONSHIP_MANAGEMENT_APPLICATION_ADMINISTRATOR_JOB
/Shared/SubscriptionManagement
BI_OSS_REPORTING_DUTY Subscription ManagementFolder Reporting Duty
ORA_OSS_SUBSCRIPTION_SPECIALIST_JOB
/Shared/Supply ChainManagement
BI_SCM_REPORTING_DUTY Supply Chain ManagementFolder Reporting Duty
ORA_ACD_PRODUCT_DESIGN_ENGINEER_JOB,ORA_ACD_PRODUCT_DESIGN_MANAGER_JOB,ORA_ACE_PRODUCT_MANAGEMENT_VP_JOB,ORA_ACE_PRODUCT_PORTFOLIO_MANAGER_JOB,ORA_CMF_FISCAL_DOCUMENT_SPECIALIST_JOB,ORA_CMF_RECEIVING_SPECIALIST_JOB,ORA_CMR_RECEIPT_ACCOUNTING_DISCRETIONARY,ORA_CSE_ASSET_ADMINISTRATOR_JOB,ORA_CST_COST_ACCOUNTANT_JOB,ORA_DOO_ORDER_ADMINISTRATOR_JOB,ORA_DOO_ORDER_MANAGER_JOB,ORA_EGI_PRODUCT_DATA_STEWARD_JOB,ORA_EGP_PRODUCT_MANAGER_JOB,ORA_ENQ_QUALITY_ANALYST_JOB,ORA_ENQ_QUALITY_ENGINEER_JOB,ORA_FOS_SUPPLY_CHAIN_CONTROLLER_JOB,ORA_INV_INVENTORY_MANAGER_JOB,ORA_INV_WAREHOUSE_MANAGER_JOB,ORA_MNT_MAINTENANCE_MANAGER_JOB,ORA_MNT_MAINTENANCE_TECHNICIAN_JOB,ORA_MSC_BACKLOG_MANAGER_JOB,ORA_MSC_DEMAND_AND_SUPPLY_PLANNER_JOB,ORA_MSC_DEMAND_PLANNER_JOB,ORA_MSC_MATERIALS_PLANNER_JOB,
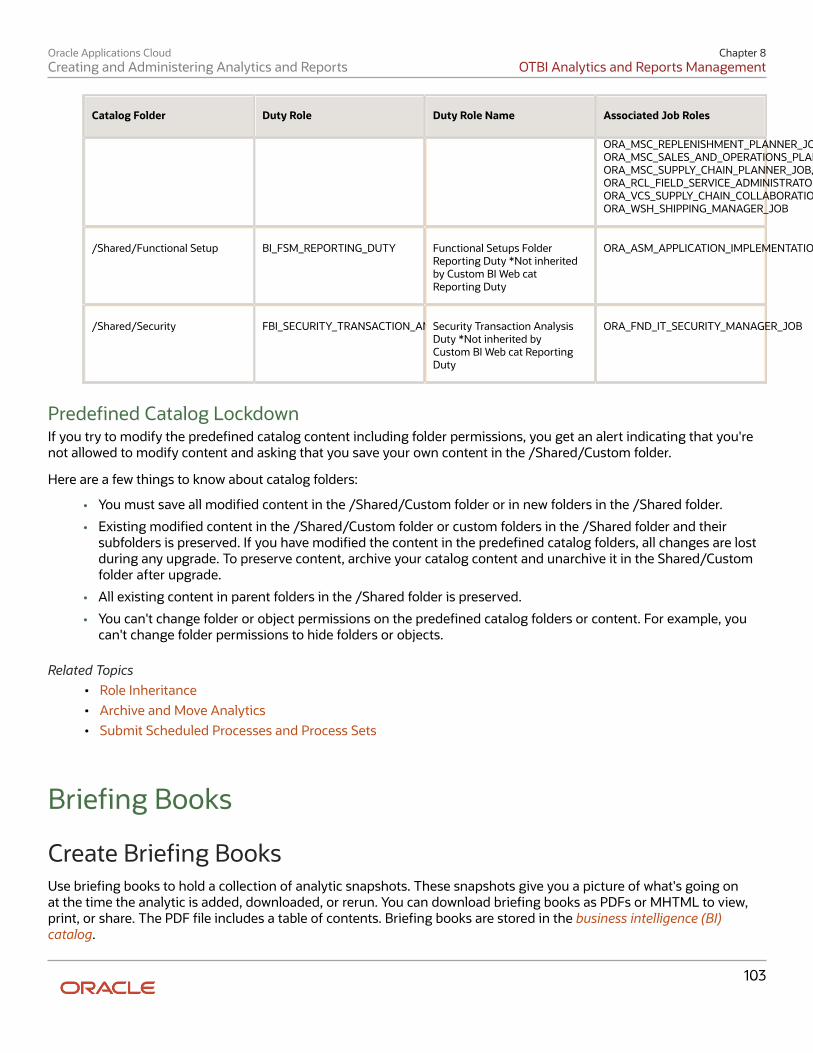
Oracle Applications CloudCreating and Administering Analytics and Reports
Chapter 8OTBI Analytics and Reports Management
103
Catalog Folder Duty Role Duty Role Name Associated Job Roles
ORA_MSC_REPLENISHMENT_PLANNER_JOB,ORA_MSC_SALES_AND_OPERATIONS_PLANNER_JOB,ORA_MSC_SUPPLY_CHAIN_PLANNER_JOB,ORA_RCL_FIELD_SERVICE_ADMINISTRATOR_JOB,ORA_VCS_SUPPLY_CHAIN_COLLABORATION_PLANNER_JOB,ORA_WSH_SHIPPING_MANAGER_JOB
/Shared/Functional Setup BI_FSM_REPORTING_DUTY Functional Setups FolderReporting Duty *Not inheritedby Custom BI Web catReporting Duty
ORA_ASM_APPLICATION_IMPLEMENTATION_CONSULTANT_JOB
/Shared/Security FBI_SECURITY_TRANSACTION_ANALYSIS_DUTYSecurity Transaction AnalysisDuty *Not inherited byCustom BI Web cat ReportingDuty
ORA_FND_IT_SECURITY_MANAGER_JOB
Predefined Catalog LockdownIf you try to modify the predefined catalog content including folder permissions, you get an alert indicating that you'renot allowed to modify content and asking that you save your own content in the /Shared/Custom folder.
Here are a few things to know about catalog folders:
• You must save all modified content in the /Shared/Custom folder or in new folders in the /Shared folder.
• Existing modified content in the /Shared/Custom folder or custom folders in the /Shared folder and theirsubfolders is preserved. If you have modified the content in the predefined catalog folders, all changes are lostduring any upgrade. To preserve content, archive your catalog content and unarchive it in the Shared/Customfolder after upgrade.
• All existing content in parent folders in the /Shared folder is preserved.
• You can't change folder or object permissions on the predefined catalog folders or content. For example, youcan't change folder permissions to hide folders or objects.
Related Topics• Role Inheritance• Archive and Move Analytics• Submit Scheduled Processes and Process Sets
Briefing Books
Create Briefing BooksUse briefing books to hold a collection of analytic snapshots. These snapshots give you a picture of what's going onat the time the analytic is added, downloaded, or rerun. You can download briefing books as PDFs or MHTML to view,print, or share. The PDF file includes a table of contents. Briefing books are stored in the business intelligence (BI)catalog.
Oracle Applications CloudCreating and Administering Analytics and Reports
Chapter 8OTBI Analytics and Reports Management
104
Add Content to New Briefing Books1. Open the Reports and Analytics work area.2. Click Browse Catalog.3. Select your analytic, then click More and select Add to Briefing Book.
Or, find your dashboard and click Open.
a. Go to the dashboard page you want to add.b. Click the Page Options button and select Add to Briefing Book.
4. Select Updatable if you want the analytic results refreshed whenever the briefing book is downloaded or rerun,or Snapshot to store it without updating.
5. Click Browse.6. Name your briefing book and save it in My Folders.
Add Content to Existing Briefing Books
1. Open the Reports and Analytics work area.2. Click Browse Catalog.3. Select your analysis, then click More and select Add to Briefing Book.
Or, find your dashboard and click Open.
a. Go to the dashboard page you want to add.b. Click the Page Options button and select Add to Briefing Book.
4. Select Updatable if you want the analytic results refreshed whenever the briefing book is downloaded or rerun,or Snapshot to store it without updating.
Download and Edit Briefing Books
1. Open the Reports and Analytics work area.2. Click Browse Catalog to locate your briefing book, and click PDF to download it.
Schedule Analytics and Reports
Create Job Definitions to Run Reports as Scheduled ProcessesEvery job definition has a job type, such as Java or Oracle Business Intelligence (BI) Publisher reports. You can onlycreate or duplicate job definitions that are based on BI Publisher reports. When there's a job definition for a BI Publisherreport, users can run the report as a scheduled process in the Scheduled Processes work area. Otherwise, they can openreports (which are set up to be run online) elsewhere, for example in the Reports and Analytics work area.
Create Job DefinitionsHere's how you create a job definition for a BI Publisher report:
1. In the Setup and Maintenance work area, go to the Manage Enterprise Scheduler Job Definitions and JobSets task in the Application Extensions functional area. Or, depending on your offering, you might use adifferent functional area.
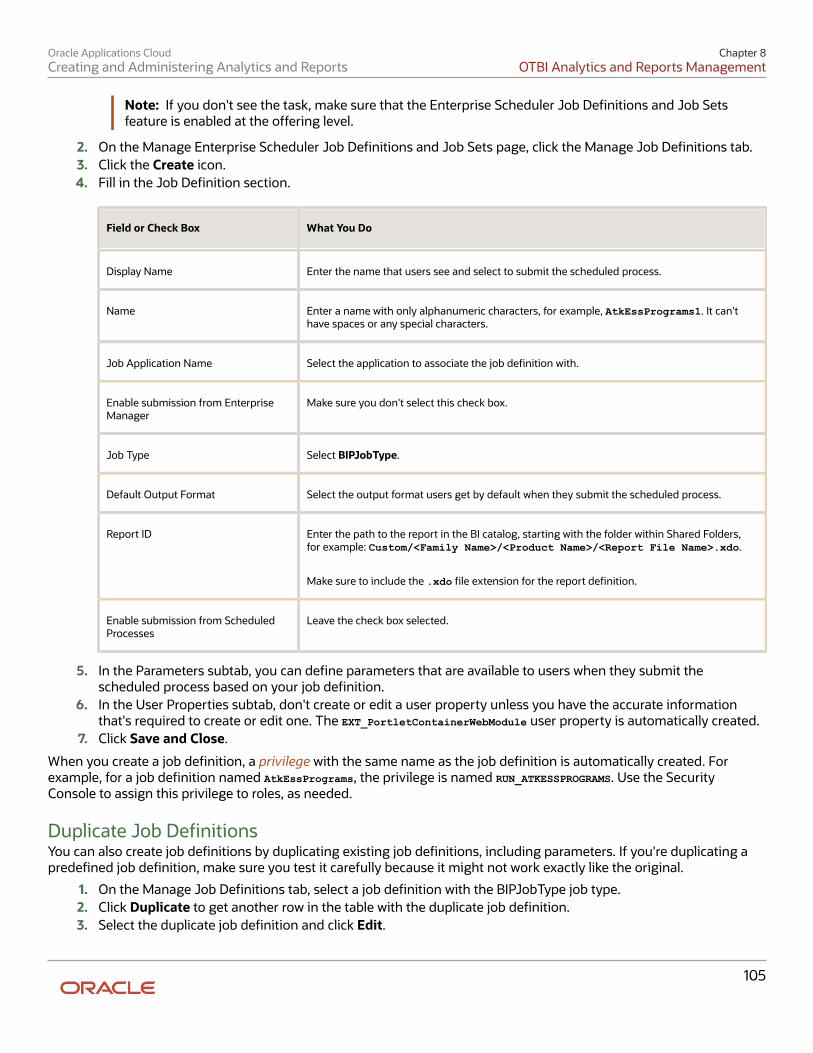
Oracle Applications CloudCreating and Administering Analytics and Reports
Chapter 8OTBI Analytics and Reports Management
105
Note: If you don't see the task, make sure that the Enterprise Scheduler Job Definitions and Job Setsfeature is enabled at the offering level.
2. On the Manage Enterprise Scheduler Job Definitions and Job Sets page, click the Manage Job Definitions tab.3. Click the Create icon.4. Fill in the Job Definition section.
Field or Check Box What You Do
Display Name Enter the name that users see and select to submit the scheduled process.
Name Enter a name with only alphanumeric characters, for example, AtkEssPrograms1. It can'thave spaces or any special characters.
Job Application Name Select the application to associate the job definition with.
Enable submission from EnterpriseManager
Make sure you don't select this check box.
Job Type Select BIPJobType.
Default Output Format Select the output format users get by default when they submit the scheduled process.
Report ID Enter the path to the report in the BI catalog, starting with the folder within Shared Folders,for example: Custom/<Family Name>/<Product Name>/<Report File Name>.xdo.
Make sure to include the .xdo file extension for the report definition.
Enable submission from ScheduledProcesses
Leave the check box selected.
5. In the Parameters subtab, you can define parameters that are available to users when they submit thescheduled process based on your job definition.
6. In the User Properties subtab, don't create or edit a user property unless you have the accurate informationthat's required to create or edit one. The EXT_PortletContainerWebModule user property is automatically created.
7. Click Save and Close.
When you create a job definition, a privilege with the same name as the job definition is automatically created. Forexample, for a job definition named AtkEssPrograms, the privilege is named RUN_ATKESSPROGRAMS. Use the SecurityConsole to assign this privilege to roles, as needed.
Duplicate Job DefinitionsYou can also create job definitions by duplicating existing job definitions, including parameters. If you're duplicating apredefined job definition, make sure you test it carefully because it might not work exactly like the original.
1. On the Manage Job Definitions tab, select a job definition with the BIPJobType job type.2. Click Duplicate to get another row in the table with the duplicate job definition.3. Select the duplicate job definition and click Edit.
Oracle Applications CloudCreating and Administering Analytics and Reports
Chapter 8OTBI Analytics and Reports Management
106
4. Enter the name and path.5. Update the parameters if you need to.6. Click Save and Close.
When you duplicate a job definition, you automatically create a view object with the same name in the list of valuessources. Validations for the attributes in the parameters view object aren't copied over.
Related Topics• Update Existing Setup Data• Configure Offerings• Manage List of Values Sources• Edit Job Definitions
Define Parameters for Job DefinitionsA parameter controls which records are included or how they are affected when a job runs. Job definitions can have oneor more parameters or none at all. You define parameters while creating or editing job definitions using the ManageEnterprise Scheduler Job Definitions and Job Sets page. In the Setup and Maintenance work area, use the following:
• Functional Area: Application Extensions or a product-specific functional area
• Task: Manage Enterprise Scheduler Job Definitions and Job Sets
When users run the scheduled process, the values they enter for the parameters determine the data to be included inthe report. Also, the values are passed to the data model that the report is using.
The parameters that you define must be in the same order as parameters in the data model. For example, the datamodel has parameters in this order:
• P_START_DATE
• P_END_DATE
• P_CURRENCY
You create parameters as follows:
• Start Date
• End Date
• Currency
Defining Parameters: Job DefinitionsTo define parameters while creating or editing job definitions:
1. On the Manage Job Definitions page, open the Parameters sub tab.2. Click Create.3. Enter the parameter prompt that users see when they submit the scheduled process.4. Select a data type and configure how the parameter and the data entered are displayed, as described in this
table.
Data Type Fields
Boolean Select this if you want the parameter to be a check box.
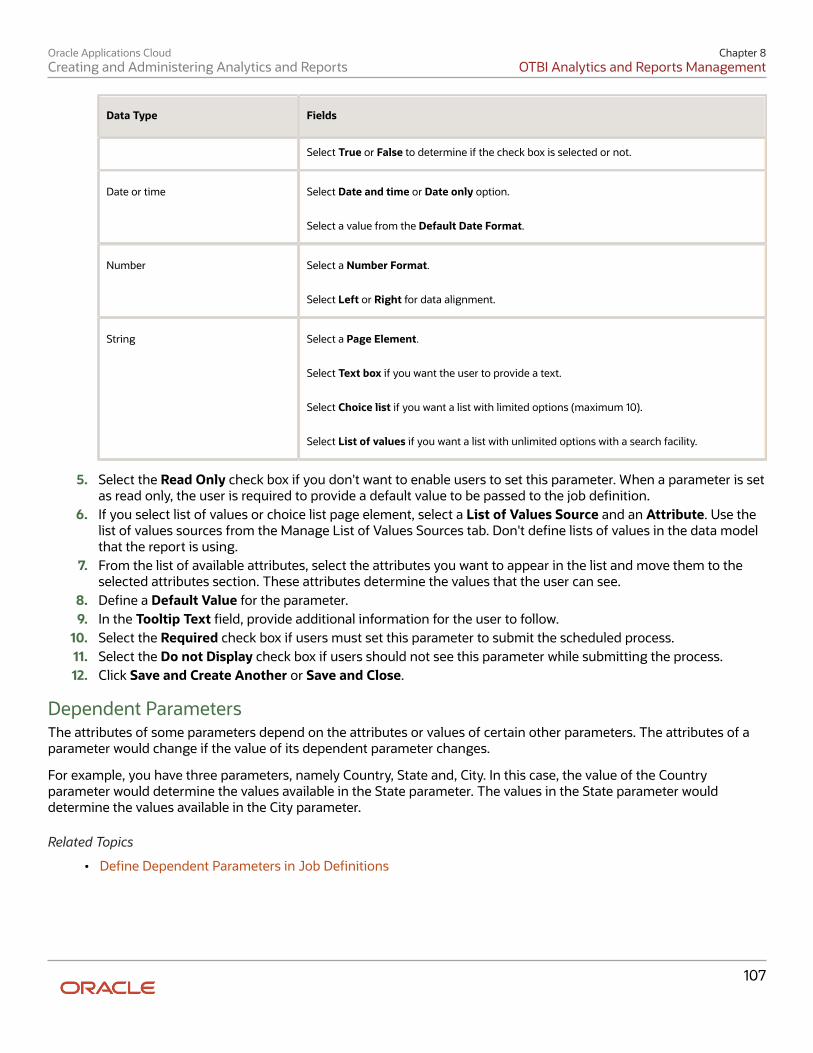
Oracle Applications CloudCreating and Administering Analytics and Reports
Chapter 8OTBI Analytics and Reports Management
107
Data Type Fields
Select True or False to determine if the check box is selected or not.
Date or time Select Date and time or Date only option.
Select a value from the Default Date Format.
Number Select a Number Format.
Select Left or Right for data alignment.
String Select a Page Element.
Select Text box if you want the user to provide a text.
Select Choice list if you want a list with limited options (maximum 10).
Select List of values if you want a list with unlimited options with a search facility.
5. Select the Read Only check box if you don't want to enable users to set this parameter. When a parameter is setas read only, the user is required to provide a default value to be passed to the job definition.
6. If you select list of values or choice list page element, select a List of Values Source and an Attribute. Use thelist of values sources from the Manage List of Values Sources tab. Don't define lists of values in the data modelthat the report is using.
7. From the list of available attributes, select the attributes you want to appear in the list and move them to theselected attributes section. These attributes determine the values that the user can see.
8. Define a Default Value for the parameter.9. In the Tooltip Text field, provide additional information for the user to follow.
10. Select the Required check box if users must set this parameter to submit the scheduled process.11. Select the Do not Display check box if users should not see this parameter while submitting the process.12. Click Save and Create Another or Save and Close.
Dependent ParametersThe attributes of some parameters depend on the attributes or values of certain other parameters. The attributes of aparameter would change if the value of its dependent parameter changes.
For example, you have three parameters, namely Country, State and, City. In this case, the value of the Countryparameter would determine the values available in the State parameter. The values in the State parameter woulddetermine the values available in the City parameter.
Related Topics
• Define Dependent Parameters in Job Definitions
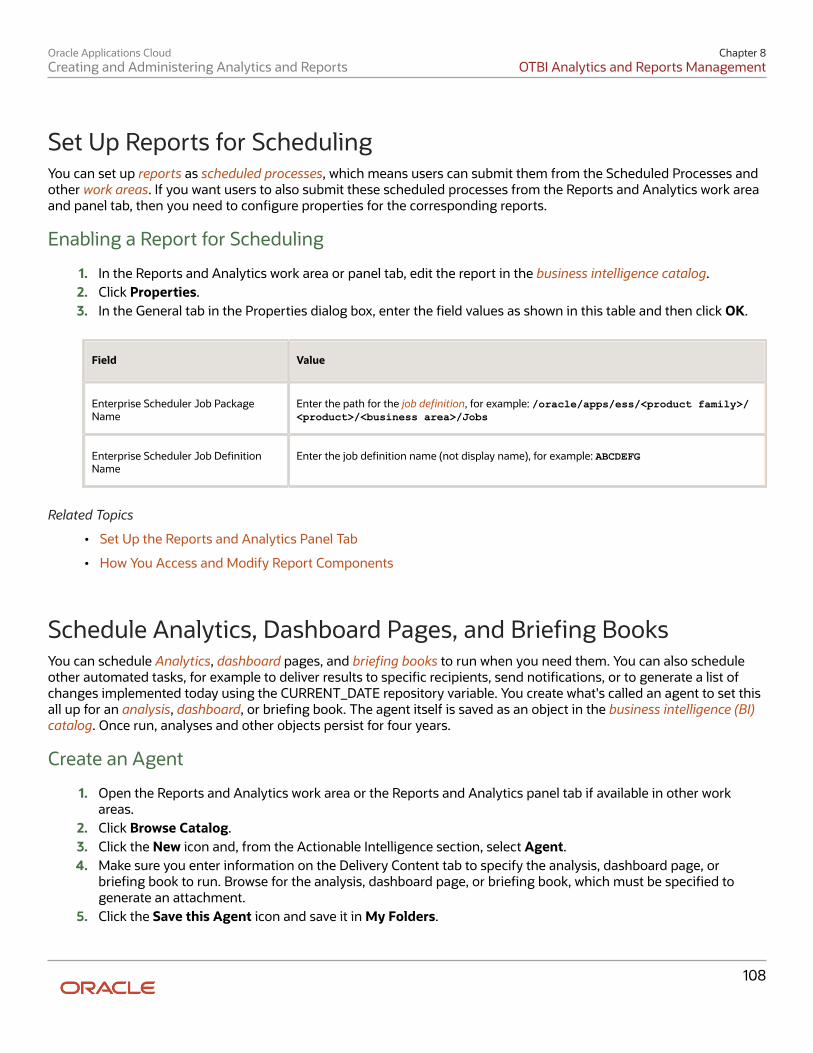
Oracle Applications CloudCreating and Administering Analytics and Reports
Chapter 8OTBI Analytics and Reports Management
108
Set Up Reports for SchedulingYou can set up reports as scheduled processes, which means users can submit them from the Scheduled Processes andother work areas. If you want users to also submit these scheduled processes from the Reports and Analytics work areaand panel tab, then you need to configure properties for the corresponding reports.
Enabling a Report for Scheduling
1. In the Reports and Analytics work area or panel tab, edit the report in the business intelligence catalog.2. Click Properties.3. In the General tab in the Properties dialog box, enter the field values as shown in this table and then click OK.
Field Value
Enterprise Scheduler Job PackageName
Enter the path for the job definition, for example: /oracle/apps/ess/<product family>/<product>/<business area>/Jobs
Enterprise Scheduler Job DefinitionName
Enter the job definition name (not display name), for example: ABCDEFG
Related Topics
• Set Up the Reports and Analytics Panel Tab
• How You Access and Modify Report Components
Schedule Analytics, Dashboard Pages, and Briefing BooksYou can schedule Analytics, dashboard pages, and briefing books to run when you need them. You can also scheduleother automated tasks, for example to deliver results to specific recipients, send notifications, or to generate a list ofchanges implemented today using the CURRENT_DATE repository variable. You create what's called an agent to set thisall up for an analysis, dashboard, or briefing book. The agent itself is saved as an object in the business intelligence (BI)catalog. Once run, analyses and other objects persist for four years.
Create an Agent
1. Open the Reports and Analytics work area or the Reports and Analytics panel tab if available in other workareas.
2. Click Browse Catalog.3. Click the New icon and, from the Actionable Intelligence section, select Agent.4. Make sure you enter information on the Delivery Content tab to specify the analysis, dashboard page, or
briefing book to run. Browse for the analysis, dashboard page, or briefing book, which must be specified togenerate an attachment.
5. Click the Save this Agent icon and save it in My Folders.
Oracle Applications CloudCreating and Administering Analytics and Reports
Chapter 8OTBI Analytics and Reports Management
109
Schedule ReportsReports can run based on a schedule that you define. You can set up other automated tasks, for example to deliverresults to specific recipients or send notifications. You submit a report with the schedule and criteria for otherautomated tasks defined.
If a report is set up as a scheduled process, you submit the process as you would any scheduled process. You canschedule them from:
• Any work area where there is a link to the report.
• The Scheduled Processes work area, where you can submit all processes that you have access to.
• The Reports and Analytics work area or panel tab, if the report is set up for submission from there.
Submitting a Report or Scheduled ProcessFollow these steps:
1. Open the Reports and Analytics work area, or the Reports and Analytics panel tab if available in other workareas where you can find the report.
2. Click the name of your report.3. Click Schedule if the option is there. The report is set up as a scheduled process.
a. Enter any parameters to avoid unnecessarily large results.b. Click Advanced to enter a schedule, deliver results to a specific destination (including e-mail or printer),
or define criteria for sending notifications.4. If you don't see Schedule, then click View.
a. Click the Actions button for the report and select Schedule.b. Enter information similar to step 3.
Related Topics
• Overview of Scheduled Processes
• View Status and Other Details for Scheduled Processes
• Submit Scheduled Processes and Process Sets

Oracle Applications CloudCreating and Administering Analytics and Reports
Chapter 8OTBI Analytics and Reports Management
110
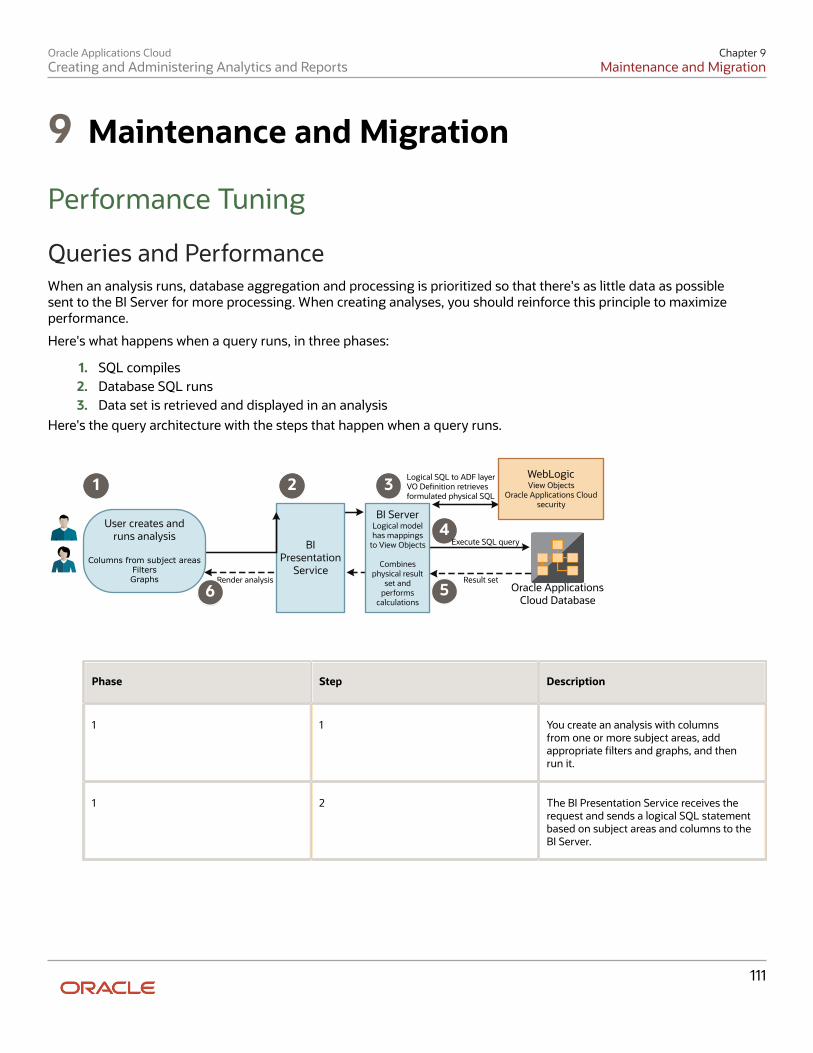
Oracle Applications CloudCreating and Administering Analytics and Reports
Chapter 9Maintenance and Migration
111
9 Maintenance and Migration
Performance Tuning
Queries and PerformanceWhen an analysis runs, database aggregation and processing is prioritized so that there's as little data as possiblesent to the BI Server for more processing. When creating analyses, you should reinforce this principle to maximizeperformance.
Here's what happens when a query runs, in three phases:
1. SQL compiles2. Database SQL runs3. Data set is retrieved and displayed in an analysis
Here's the query architecture with the steps that happen when a query runs.
BI Presentation
Service
User creates andruns analysis
Columns from subject areasFiltersGraphs
WebLogicView Objects
Oracle Applications Cloud security
1 2
4
5 Oracle Applications Cloud Database
Execute SQL query
BI ServerLogical model has mappings
to View Objects
Combines physical result
set and performs
calculations
3
Result set
Logical SQL to ADF layerVO Denition retrievesformulated physical SQL
Render analysis
6
Phase Step Description
1 1 You create an analysis with columnsfrom one or more subject areas, addappropriate filters and graphs, and thenrun it.
1 2 The BI Presentation Service receives therequest and sends a logical SQL statementbased on subject areas and columns to theBI Server.
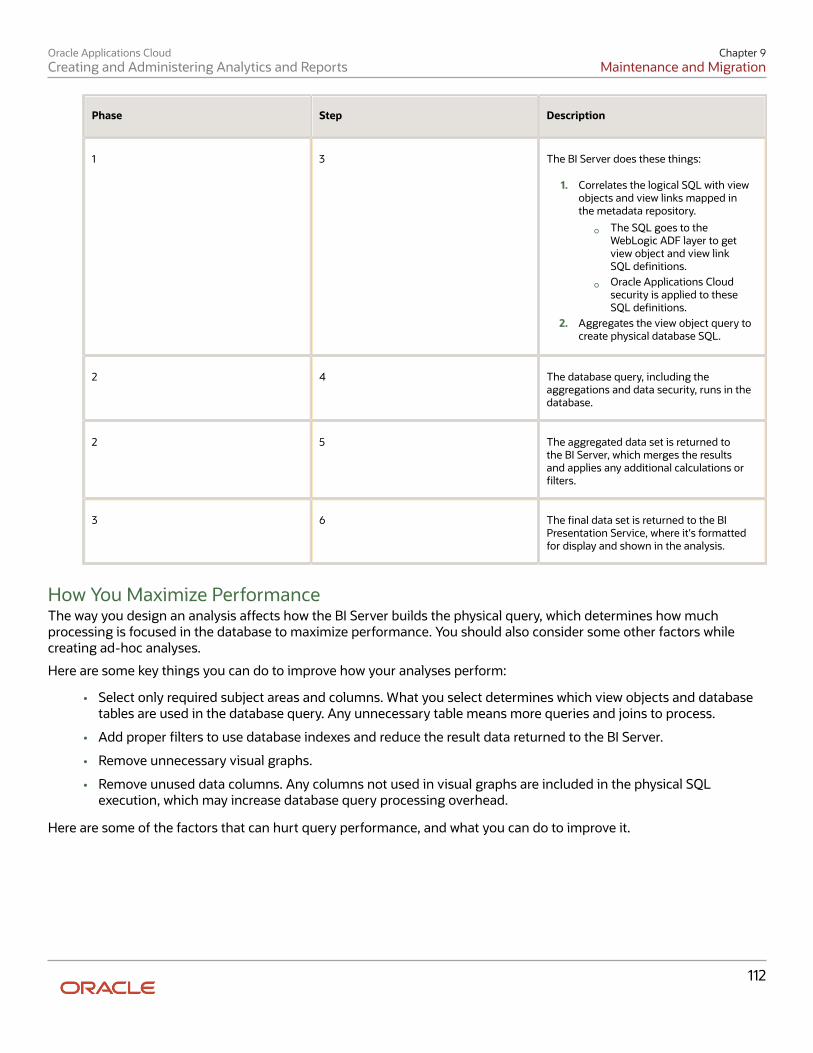
Oracle Applications CloudCreating and Administering Analytics and Reports
Chapter 9Maintenance and Migration
112
Phase Step Description
1 3 The BI Server does these things:
1. Correlates the logical SQL with viewobjects and view links mapped inthe metadata repository.
◦ The SQL goes to theWebLogic ADF layer to getview object and view linkSQL definitions.
◦ Oracle Applications Cloudsecurity is applied to theseSQL definitions.
2. Aggregates the view object query tocreate physical database SQL.
2 4 The database query, including theaggregations and data security, runs in thedatabase.
2 5 The aggregated data set is returned tothe BI Server, which merges the resultsand applies any additional calculations orfilters.
3 6 The final data set is returned to the BIPresentation Service, where it's formattedfor display and shown in the analysis.
How You Maximize PerformanceThe way you design an analysis affects how the BI Server builds the physical query, which determines how muchprocessing is focused in the database to maximize performance. You should also consider some other factors whilecreating ad-hoc analyses.
Here are some key things you can do to improve how your analyses perform:
• Select only required subject areas and columns. What you select determines which view objects and databasetables are used in the database query. Any unnecessary table means more queries and joins to process.
• Add proper filters to use database indexes and reduce the result data returned to the BI Server.
• Remove unnecessary visual graphs.
• Remove unused data columns. Any columns not used in visual graphs are included in the physical SQLexecution, which may increase database query processing overhead.
Here are some of the factors that can hurt query performance, and what you can do to improve it.
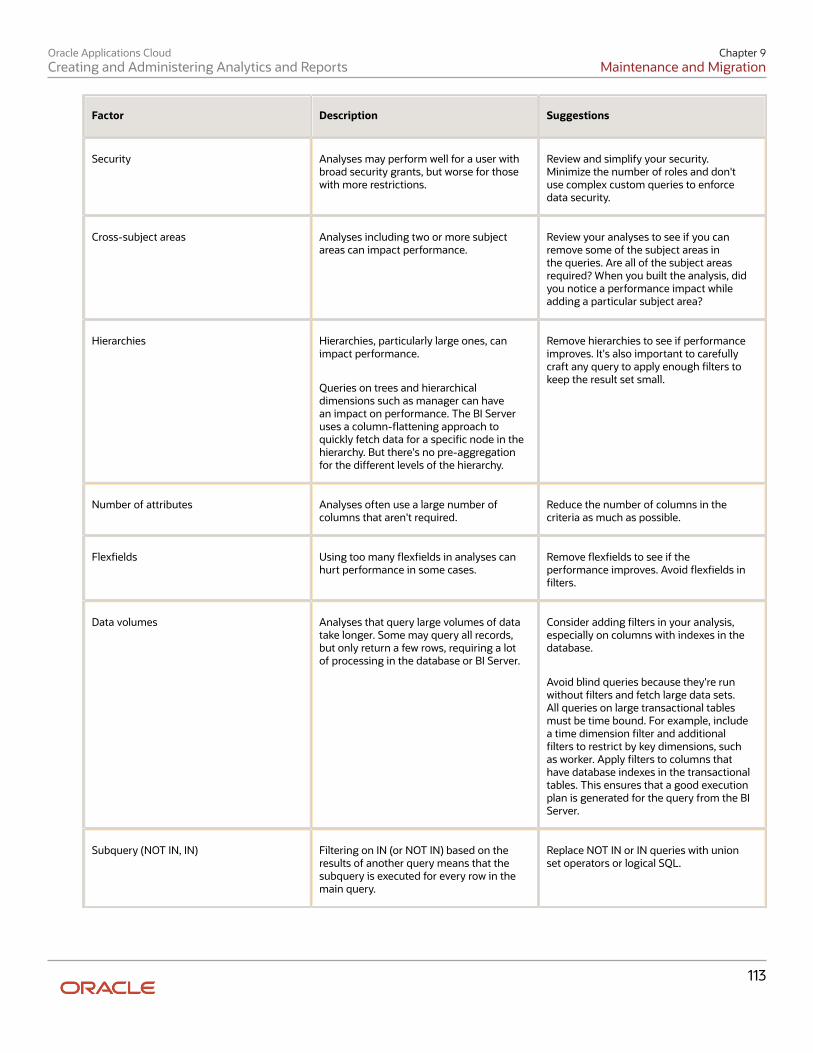
Oracle Applications CloudCreating and Administering Analytics and Reports
Chapter 9Maintenance and Migration
113
Factor Description Suggestions
Security Analyses may perform well for a user withbroad security grants, but worse for thosewith more restrictions.
Review and simplify your security.Minimize the number of roles and don'tuse complex custom queries to enforcedata security.
Cross-subject areas Analyses including two or more subjectareas can impact performance.
Review your analyses to see if you canremove some of the subject areas inthe queries. Are all of the subject areasrequired? When you built the analysis, didyou notice a performance impact whileadding a particular subject area?
Hierarchies Hierarchies, particularly large ones, canimpact performance.
Queries on trees and hierarchicaldimensions such as manager can havean impact on performance. The BI Serveruses a column-flattening approach toquickly fetch data for a specific node in thehierarchy. But there's no pre-aggregationfor the different levels of the hierarchy.
Remove hierarchies to see if performanceimproves. It's also important to carefullycraft any query to apply enough filters tokeep the result set small.
Number of attributes Analyses often use a large number ofcolumns that aren't required.
Reduce the number of columns in thecriteria as much as possible.
Flexfields Using too many flexfields in analyses canhurt performance in some cases.
Remove flexfields to see if theperformance improves. Avoid flexfields infilters.
Data volumes Analyses that query large volumes of datatake longer. Some may query all records,but only return a few rows, requiring a lotof processing in the database or BI Server.
Consider adding filters in your analysis,especially on columns with indexes in thedatabase.
Avoid blind queries because they're runwithout filters and fetch large data sets.All queries on large transactional tablesmust be time bound. For example, includea time dimension filter and additionalfilters to restrict by key dimensions, suchas worker. Apply filters to columns thathave database indexes in the transactionaltables. This ensures that a good executionplan is generated for the query from the BIServer.
Subquery (NOT IN, IN) Filtering on IN (or NOT IN) based on theresults of another query means that thesubquery is executed for every row in themain query.
Replace NOT IN or IN queries with unionset operators or logical SQL.
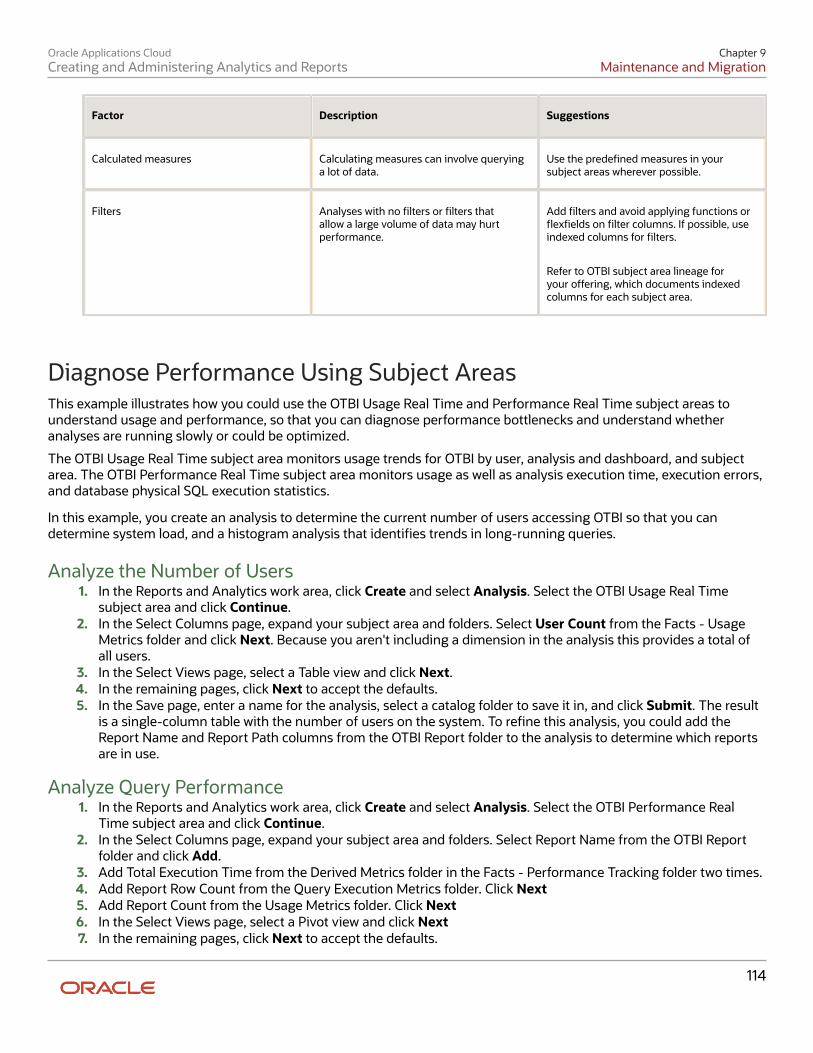
Oracle Applications CloudCreating and Administering Analytics and Reports
Chapter 9Maintenance and Migration
114
Factor Description Suggestions
Calculated measures Calculating measures can involve queryinga lot of data.
Use the predefined measures in yoursubject areas wherever possible.
Filters Analyses with no filters or filters thatallow a large volume of data may hurtperformance.
Add filters and avoid applying functions orflexfields on filter columns. If possible, useindexed columns for filters.
Refer to OTBI subject area lineage foryour offering, which documents indexedcolumns for each subject area.
Diagnose Performance Using Subject AreasThis example illustrates how you could use the OTBI Usage Real Time and Performance Real Time subject areas tounderstand usage and performance, so that you can diagnose performance bottlenecks and understand whetheranalyses are running slowly or could be optimized.
The OTBI Usage Real Time subject area monitors usage trends for OTBI by user, analysis and dashboard, and subjectarea. The OTBI Performance Real Time subject area monitors usage as well as analysis execution time, execution errors,and database physical SQL execution statistics.
In this example, you create an analysis to determine the current number of users accessing OTBI so that you candetermine system load, and a histogram analysis that identifies trends in long-running queries.
Analyze the Number of Users1. In the Reports and Analytics work area, click Create and select Analysis. Select the OTBI Usage Real Time
subject area and click Continue.2. In the Select Columns page, expand your subject area and folders. Select User Count from the Facts - Usage
Metrics folder and click Next. Because you aren't including a dimension in the analysis this provides a total ofall users.
3. In the Select Views page, select a Table view and click Next.4. In the remaining pages, click Next to accept the defaults.5. In the Save page, enter a name for the analysis, select a catalog folder to save it in, and click Submit. The result
is a single-column table with the number of users on the system. To refine this analysis, you could add theReport Name and Report Path columns from the OTBI Report folder to the analysis to determine which reportsare in use.
Analyze Query Performance1. In the Reports and Analytics work area, click Create and select Analysis. Select the OTBI Performance Real
Time subject area and click Continue.2. In the Select Columns page, expand your subject area and folders. Select Report Name from the OTBI Report
folder and click Add.3. Add Total Execution Time from the Derived Metrics folder in the Facts - Performance Tracking folder two times.4. Add Report Row Count from the Query Execution Metrics folder. Click Next5. Add Report Count from the Usage Metrics folder. Click Next6. In the Select Views page, select a Pivot view and click Next7. In the remaining pages, click Next to accept the defaults.
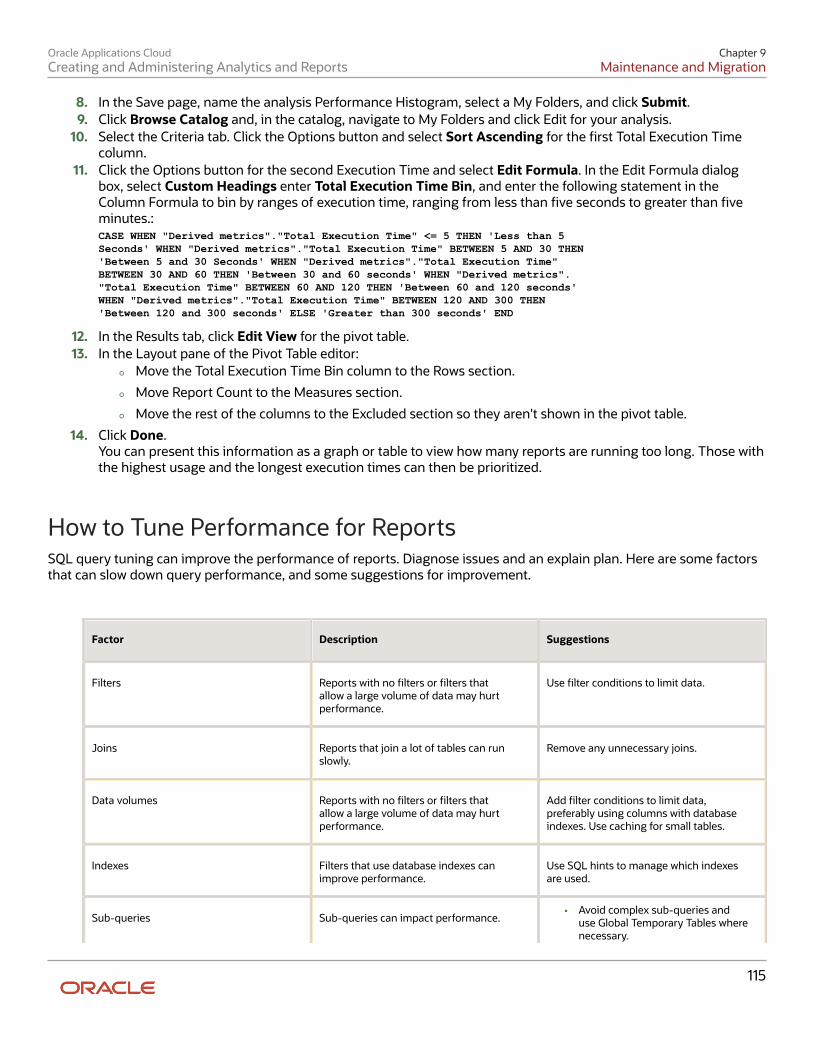
Oracle Applications CloudCreating and Administering Analytics and Reports
Chapter 9Maintenance and Migration
115
8. In the Save page, name the analysis Performance Histogram, select a My Folders, and click Submit.9. Click Browse Catalog and, in the catalog, navigate to My Folders and click Edit for your analysis.
10. Select the Criteria tab. Click the Options button and select Sort Ascending for the first Total Execution Timecolumn.
11. Click the Options button for the second Execution Time and select Edit Formula. In the Edit Formula dialogbox, select Custom Headings enter Total Execution Time Bin, and enter the following statement in theColumn Formula to bin by ranges of execution time, ranging from less than five seconds to greater than fiveminutes.:CASE WHEN "Derived metrics"."Total Execution Time" <= 5 THEN 'Less than 5Seconds' WHEN "Derived metrics"."Total Execution Time" BETWEEN 5 AND 30 THEN'Between 5 and 30 Seconds' WHEN "Derived metrics"."Total Execution Time"BETWEEN 30 AND 60 THEN 'Between 30 and 60 seconds' WHEN "Derived metrics"."Total Execution Time" BETWEEN 60 AND 120 THEN 'Between 60 and 120 seconds' WHEN "Derived metrics"."Total Execution Time" BETWEEN 120 AND 300 THEN 'Between 120 and 300 seconds' ELSE 'Greater than 300 seconds' END
12. In the Results tab, click Edit View for the pivot table.13. In the Layout pane of the Pivot Table editor:
◦ Move the Total Execution Time Bin column to the Rows section.
◦ Move Report Count to the Measures section.
◦ Move the rest of the columns to the Excluded section so they aren't shown in the pivot table.
14. Click Done.You can present this information as a graph or table to view how many reports are running too long. Those withthe highest usage and the longest execution times can then be prioritized.
How to Tune Performance for ReportsSQL query tuning can improve the performance of reports. Diagnose issues and an explain plan. Here are some factorsthat can slow down query performance, and some suggestions for improvement.
Factor Description Suggestions
Filters Reports with no filters or filters thatallow a large volume of data may hurtperformance.
Use filter conditions to limit data.
Joins Reports that join a lot of tables can runslowly.
Remove any unnecessary joins.
Data volumes Reports with no filters or filters thatallow a large volume of data may hurtperformance.
Add filter conditions to limit data,preferably using columns with databaseindexes. Use caching for small tables.
Indexes Filters that use database indexes canimprove performance.
Use SQL hints to manage which indexesare used.
Sub-queries Sub-queries can impact performance.• Avoid complex sub-queries and
use Global Temporary Tables wherenecessary.
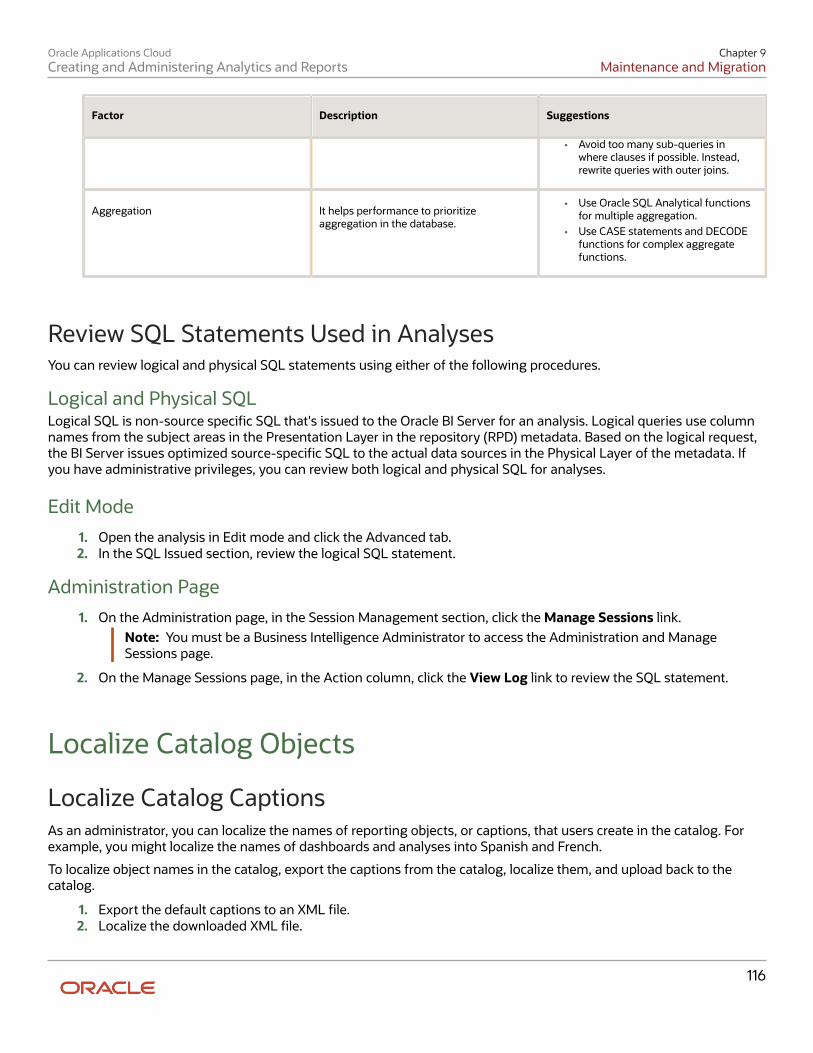
Oracle Applications CloudCreating and Administering Analytics and Reports
Chapter 9Maintenance and Migration
116
Factor Description Suggestions
• Avoid too many sub-queries inwhere clauses if possible. Instead,rewrite queries with outer joins.
Aggregation It helps performance to prioritizeaggregation in the database.
• Use Oracle SQL Analytical functionsfor multiple aggregation.
• Use CASE statements and DECODEfunctions for complex aggregatefunctions.
Review SQL Statements Used in AnalysesYou can review logical and physical SQL statements using either of the following procedures.
Logical and Physical SQLLogical SQL is non-source specific SQL that's issued to the Oracle BI Server for an analysis. Logical queries use columnnames from the subject areas in the Presentation Layer in the repository (RPD) metadata. Based on the logical request,the BI Server issues optimized source-specific SQL to the actual data sources in the Physical Layer of the metadata. Ifyou have administrative privileges, you can review both logical and physical SQL for analyses.
Edit Mode
1. Open the analysis in Edit mode and click the Advanced tab.2. In the SQL Issued section, review the logical SQL statement.
Administration Page
1. On the Administration page, in the Session Management section, click the Manage Sessions link.Note: You must be a Business Intelligence Administrator to access the Administration and ManageSessions page.
2. On the Manage Sessions page, in the Action column, click the View Log link to review the SQL statement.
Localize Catalog Objects
Localize Catalog CaptionsAs an administrator, you can localize the names of reporting objects, or captions, that users create in the catalog. Forexample, you might localize the names of dashboards and analyses into Spanish and French.
To localize object names in the catalog, export the captions from the catalog, localize them, and upload back to thecatalog.
1. Export the default captions to an XML file.2. Localize the downloaded XML file.
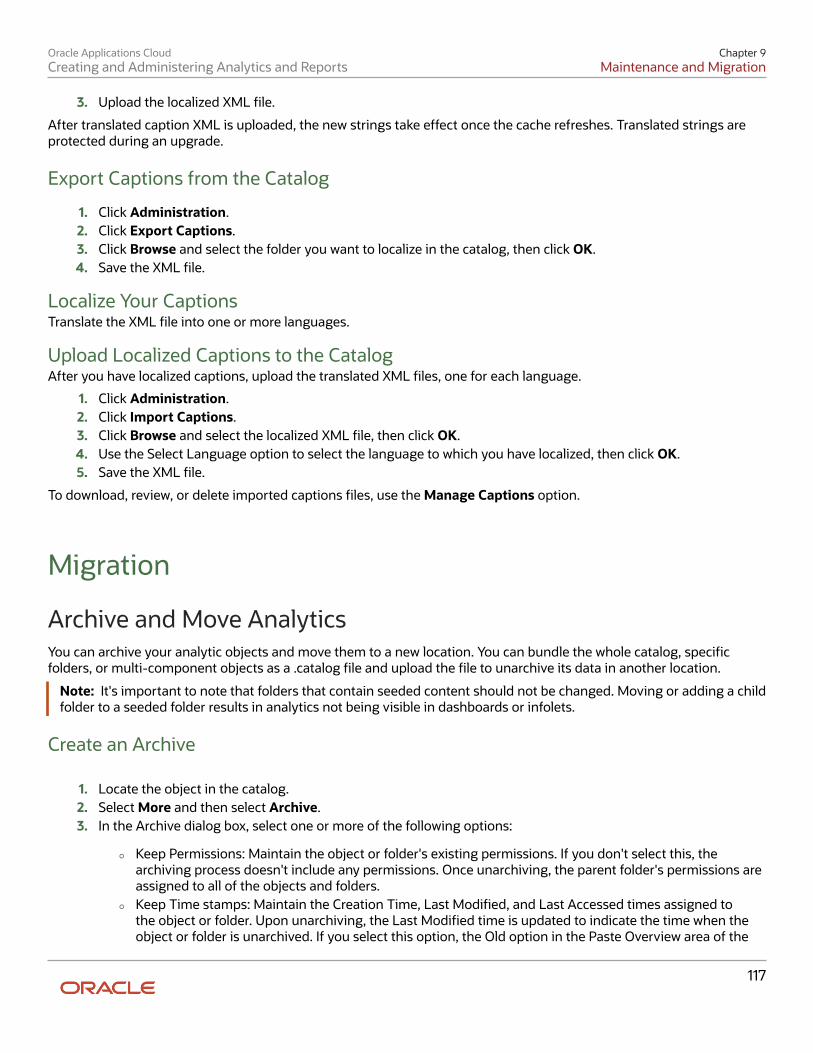
Oracle Applications CloudCreating and Administering Analytics and Reports
Chapter 9Maintenance and Migration
117
3. Upload the localized XML file.
After translated caption XML is uploaded, the new strings take effect once the cache refreshes. Translated strings areprotected during an upgrade.
Export Captions from the Catalog
1. Click Administration.2. Click Export Captions.3. Click Browse and select the folder you want to localize in the catalog, then click OK.4. Save the XML file.
Localize Your CaptionsTranslate the XML file into one or more languages.
Upload Localized Captions to the CatalogAfter you have localized captions, upload the translated XML files, one for each language.
1. Click Administration.2. Click Import Captions.3. Click Browse and select the localized XML file, then click OK.4. Use the Select Language option to select the language to which you have localized, then click OK.5. Save the XML file.
To download, review, or delete imported captions files, use the Manage Captions option.
Migration
Archive and Move AnalyticsYou can archive your analytic objects and move them to a new location. You can bundle the whole catalog, specificfolders, or multi-component objects as a .catalog file and upload the file to unarchive its data in another location.
Note: It's important to note that folders that contain seeded content should not be changed. Moving or adding a childfolder to a seeded folder results in analytics not being visible in dashboards or infolets.
Create an Archive
1. Locate the object in the catalog.2. Select More and then select Archive.3. In the Archive dialog box, select one or more of the following options:
◦ Keep Permissions: Maintain the object or folder's existing permissions. If you don't select this, thearchiving process doesn't include any permissions. Once unarchiving, the parent folder's permissions areassigned to all of the objects and folders.
◦ Keep Time stamps: Maintain the Creation Time, Last Modified, and Last Accessed times assigned tothe object or folder. Upon unarchiving, the Last Modified time is updated to indicate the time when theobject or folder is unarchived. If you select this option, the Old option in the Paste Overview area of the
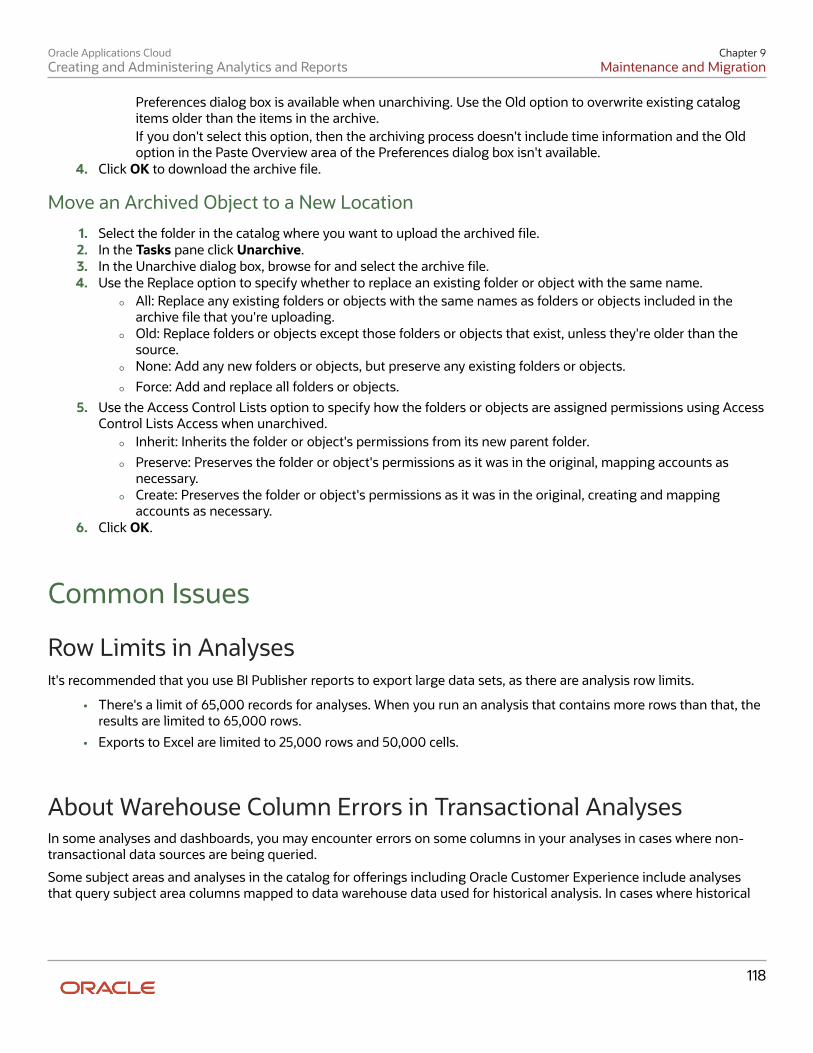
Oracle Applications CloudCreating and Administering Analytics and Reports
Chapter 9Maintenance and Migration
118
Preferences dialog box is available when unarchiving. Use the Old option to overwrite existing catalogitems older than the items in the archive.If you don't select this option, then the archiving process doesn't include time information and the Oldoption in the Paste Overview area of the Preferences dialog box isn't available.
4. Click OK to download the archive file.
Move an Archived Object to a New Location
1. Select the folder in the catalog where you want to upload the archived file.2. In the Tasks pane click Unarchive.3. In the Unarchive dialog box, browse for and select the archive file.4. Use the Replace option to specify whether to replace an existing folder or object with the same name.
◦ All: Replace any existing folders or objects with the same names as folders or objects included in thearchive file that you're uploading.
◦ Old: Replace folders or objects except those folders or objects that exist, unless they're older than thesource.
◦ None: Add any new folders or objects, but preserve any existing folders or objects.
◦ Force: Add and replace all folders or objects.
5. Use the Access Control Lists option to specify how the folders or objects are assigned permissions using AccessControl Lists Access when unarchived.
◦ Inherit: Inherits the folder or object's permissions from its new parent folder.
◦ Preserve: Preserves the folder or object's permissions as it was in the original, mapping accounts asnecessary.
◦ Create: Preserves the folder or object's permissions as it was in the original, creating and mappingaccounts as necessary.
6. Click OK.
Common Issues
Row Limits in AnalysesIt's recommended that you use BI Publisher reports to export large data sets, as there are analysis row limits.
• There's a limit of 65,000 records for analyses. When you run an analysis that contains more rows than that, theresults are limited to 65,000 rows.
• Exports to Excel are limited to 25,000 rows and 50,000 cells.
About Warehouse Column Errors in Transactional AnalysesIn some analyses and dashboards, you may encounter errors on some columns in your analyses in cases where non-transactional data sources are being queried.
Some subject areas and analyses in the catalog for offerings including Oracle Customer Experience include analysesthat query subject area columns mapped to data warehouse data used for historical analysis. In cases where historical
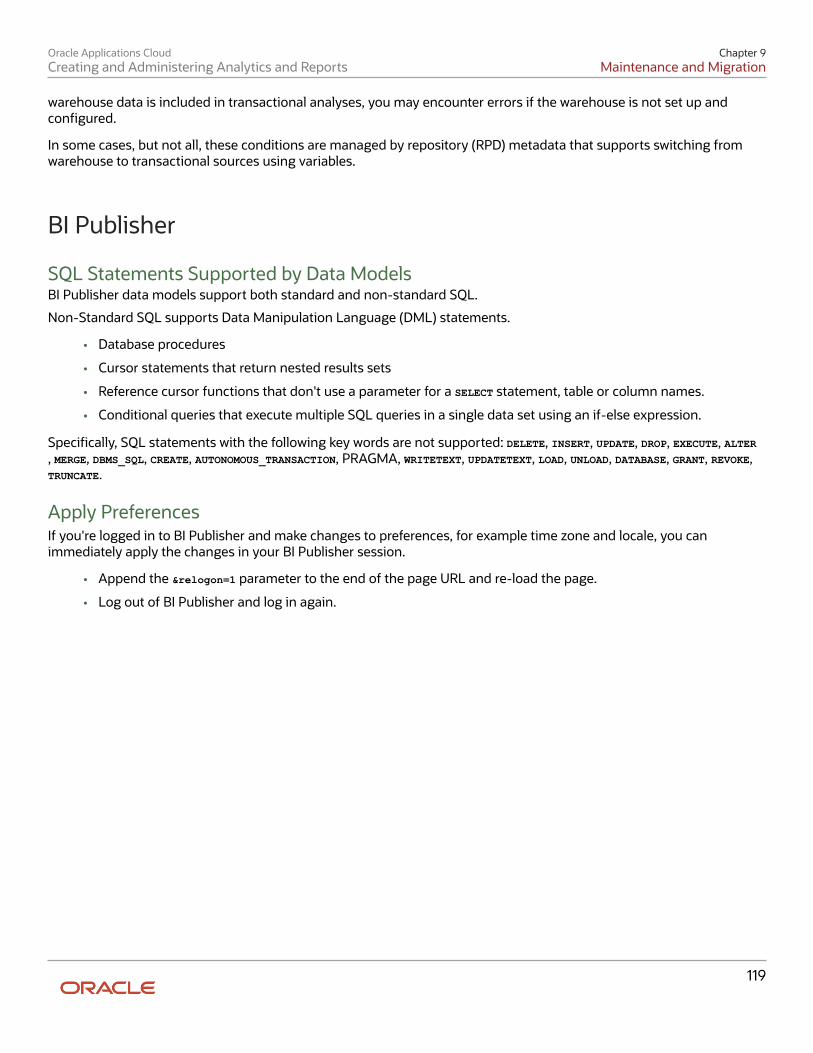
Oracle Applications CloudCreating and Administering Analytics and Reports
Chapter 9Maintenance and Migration
119
warehouse data is included in transactional analyses, you may encounter errors if the warehouse is not set up andconfigured.
In some cases, but not all, these conditions are managed by repository (RPD) metadata that supports switching fromwarehouse to transactional sources using variables.
BI Publisher
SQL Statements Supported by Data ModelsBI Publisher data models support both standard and non-standard SQL.
Non-Standard SQL supports Data Manipulation Language (DML) statements.
• Database procedures
• Cursor statements that return nested results sets
• Reference cursor functions that don't use a parameter for a SELECT statement, table or column names.
• Conditional queries that execute multiple SQL queries in a single data set using an if-else expression.
Specifically, SQL statements with the following key words are not supported: DELETE, INSERT, UPDATE, DROP, EXECUTE, ALTER, MERGE, DBMS_SQL, CREATE, AUTONOMOUS_TRANSACTION, PRAGMA, WRITETEXT, UPDATETEXT, LOAD, UNLOAD, DATABASE, GRANT, REVOKE,TRUNCATE.
Apply PreferencesIf you're logged in to BI Publisher and make changes to preferences, for example time zone and locale, you canimmediately apply the changes in your BI Publisher session.
• Append the &relogon=1 parameter to the end of the page URL and re-load the page.
• Log out of BI Publisher and log in again.

Oracle Applications CloudCreating and Administering Analytics and Reports
Chapter 9Maintenance and Migration
120
Oracle Applications CloudCreating and Administering Analytics and Reports
Glossary
121
Glossary
action
The kind of access, such as view or edit, named in a security policy.
analysis
A selection of data displayed in one or more views, such as a table or chart, to provide answers to business questions.
analytics
Business intelligence objects such as analyses and dashboards that provide meaningful data to help with decisionmaking.
briefing book
A collection of static or updatable analyses or dashboard pages that you can download, print, and share with others.
business intelligence catalog
The repository where all business intelligence objects, including analyses, reports, briefing books, and agents, arestored. The catalog contains separate folders for personal, shared, and modified objects.
business intelligence repository
The metadata that determines all of the columns, or pieces of data, that you can include in analytics. You can also usethe repository as a source of data for reports.
business object
A resource in an enterprise database, such as an invoice or purchase order.
dashboard
A collection of analyses and other content that gives in-depth insight to help with business decisions.
data model
The metadata that determines where data for a report comes from and how that data is retrieved.
detailed report
A comprehensive report that provides detailed information about the subject matter. When you link a detailed report toan infolet, users can click anywhere in the infolet area to drill down to that detailed report.
Oracle Applications CloudCreating and Administering Analytics and Reports
Glossary
122
EDI
Abbreviation for electronic data interchange.
EFT
Acronym for Electronic Funds Transfer. A direct transfer of money from one account to another, such as an electronicpayment of an amount owed a supplier by transferring money from a payer's disbursement bank account into thesupplier's bank account.
flexfield
A flexible data field that you can configure such that it contains one or more segments or stores additional information.Each segment has a value and a meaning.
flexfield segment
An extensible data field that represents an attribute and captures a value corresponding to a predefined, singleextension column in the database. A segment appears globally or based on a context of other captured information.
global header
The uppermost region in the user interface that remains the same no matter which page you're on.
infolet
A small interactive widget on the home page that provides key information and actions for a specific area, for exampleyour personal profile. Each infolet can have multiple views.
job definition
The metadata that determines what a job does and what options are available to users when they submit the scheduledprocess. A job is the executable for a scheduled process.
performance tile
A single, summary measure value displayed prominently with, in some cases, a trend line.
performance tile report
A summary report that shows data in the small infolet format. When you add a performance tile report to an infolet,users can see summary information about the subject matter.
privilege
A grant of access to functions and data; a single, real world action on a single business object.
prompt
A parameter that you set when you use analytics, limiting the data in the analysis or in all analyses on the dashboard ordashboard page (tab).
Oracle Applications CloudCreating and Administering Analytics and Reports
Glossary
123
report
An output of select data in a predefined format that's optimized for printing.
role
Controls access to application functions and data.
scheduled process
A program that you run to process data and, in some cases, generate output as a report.
Style template
An .rtf template containing style information that's applied to report layout templates to achieve a consistent look andfeel across reports.
subject area
A set of columns, or pieces of data, related to a specific business object or area.
Subtemplate
An .rtf or .xsl format that is defined once and used multiple times within a single report layout template or acrossmultiple layout template files.
task flow infolet
An infolet that displays summary information about a task.
view
A specific way to present the results of an analysis, for example as a table or graph. Other types of views, such as thetitle view, show other components of the analysis.
work area
A set of pages containing the tasks, searches, and other content you need to accomplish a business goal.
workflow
An automated process that passes a task from one user (or group of users) to another to view or act on. The task isrouted in a logical sequence to achieve an end result.

Oracle Applications CloudCreating and Administering Analytics and Reports
Glossary
124
Related Documents