ETH Library Optogenetically stimulating intact rat corticospinal tract post-stroke restores motor control through regionalized functional circuit formation Journal Article Author(s): Wahl, Anna-Sophia; Büchler, U.; Brändli, H.; Brattoli, Biagio; Musall, Simon; Kasper, Hansjörg; Ineichen, Benjamin V.; Helmchen, Fritjof; Ommer, Björn; Schwab, Martin E. Publication date: 2017 Permanent link: https://doi.org/10.3929/ethz-b-000205811 Rights / license: Creative Commons Attribution 4.0 International Originally published in: Nature Communications 8(1), https://doi.org/10.1038/s41467-017-01090-6 This page was generated automatically upon download from the ETH Zurich Research Collection . For more information, please consult the Terms of use .

Welcome message from author
This document is posted to help you gain knowledge. Please leave a comment to let me know what you think about it! Share it to your friends and learn new things together.
Transcript

ETH Library
Optogenetically stimulating intactrat corticospinal tract post-strokerestores motor control throughregionalized functional circuitformation
Journal Article
Author(s):Wahl, Anna-Sophia; Büchler, U.; Brändli, H.; Brattoli, Biagio; Musall, Simon; Kasper, Hansjörg; Ineichen, Benjamin V.; Helmchen,Fritjof; Ommer, Björn; Schwab, Martin E.
Publication date:2017
Permanent link:https://doi.org/10.3929/ethz-b-000205811
Rights / license:Creative Commons Attribution 4.0 International
Originally published in:Nature Communications 8(1), https://doi.org/10.1038/s41467-017-01090-6
This page was generated automatically upon download from the ETH Zurich Research Collection.For more information, please consult the Terms of use.

ARTICLE
Optogenetically stimulating intact rat corticospinaltract post-stroke restores motor control throughregionalized functional circuit formationA.S. Wahl1,2,3, U. Büchler4, A. Brändli1,2, B. Brattoli4, S. Musall1, H. Kasper1, B.V. Ineichen1,2, F. Helmchen1,
B. Ommer4 & M.E. Schwab1,2
Current neuromodulatory strategies to enhance motor recovery after stroke often target large
brain areas non-specifically and without sufficient understanding of their interaction with
internal repair mechanisms. Here we developed a novel therapeutic approach by specifically
activating corticospinal circuitry using optogenetics after large strokes in rats. Similar to a
neuronal growth-promoting immunotherapy, optogenetic stimulation together with intense,
scheduled rehabilitation leads to the restoration of lost movement patterns rather than
induced compensatory actions, as revealed by a computer vision-based automatic behavior
analysis. Optogenetically activated corticospinal neurons promote axonal sprouting from the
intact to the denervated cervical hemi-cord. Conversely, optogenetically silencing subsets of
corticospinal neurons in recovered animals, results in mistargeting of the restored grasping
function, thus identifying the reestablishment of specific and anatomically localized cortical
microcircuits. These results provide a conceptual framework to improve established clinical
techniques such as transcranial magnetic or transcranial direct current stimulation in stroke
patients.
DOI: 10.1038/s41467-017-01090-6 OPEN
1 Brain Research Institute, University of Zurich, Winterthurerstr. 190, 8057 Zurich, Switzerland. 2 Department of Health Sciences and Technology, ETH Zurich,Winterthurerstr. 190, 8057 Zurich, Switzerland. 3 Central Institute of Mental Health, University of Heidelberg, J5, 68159 Mannheim, Germany. 4 ComputerVision Group, Interdisciplinary Center for Scientific Computing (IWR), University of Heidelberg, Mathematikon (INF 205), 69120 Heidelberg, Germany.A.S. Wahl and U. Büchler contributed equally to this work. B. Ommer and M.E. Schwab jointly supervised this work. Correspondence and requests formaterials should be addressed to A.S.W. (email: [email protected]) or to M.E.S. (email: [email protected])
NATURE COMMUNICATIONS |8: 1187 |DOI: 10.1038/s41467-017-01090-6 |www.nature.com/naturecommunications 1
Destruction of large cortical areas, as typically causedin cortical strokes, induces plastic remodeling andreorganization of neuronal connections and functions
throughout the central nervous system (CNS)1–3. Where and hownew connections grow, which areas and circuitries are eitheractivated or repressed and what they contribute in terms offunctional recovery is poorly known. While patients or animalswith small strokes often show high levels of spontaneous recoveryassociated with rewiring of perilesional areas, large stroke lesionswith > 60% of unilateral cortex destruction have a poor prognosiswith very limited capacity for regaining lost functions4, 5.Remodeling processes are often associated with sprouting ofspared axons, which innervate denervated target areas and formnew circuits for the recovery of lost functions5–7. For largestrokes, specific experimental manipulations were shown topromote internal repair mechanisms such as pharmacologicaltreatments, rehabilitative training strategies, stem cell transplan-tation, or brain stimulation8–11. However, the success and feasi-bility of these approaches were often variable due to unspecificactivation or inhibition processes of undefined cell types produ-cing undesired side effects12, 13.
In order to design optimized therapeutic strategies, it is crucialto understand the interaction between external, therapeuticmanipulation with the internal repair and reorganization pro-cesses on the level of distinct CNS circuits. Furthermore, unbiaseddetailed, quantitative behavioral readouts for comparing thehealthy with the stroke-impaired and the rehabilitation-inducedcondition are necessary to assess the level of recovery (restorationof function vs. forms of compensation) and to identify the mostsuccessful treatment. This analysis should be automatic and non-invasive to avoid interference with the recovery process.
In clinical trials and experimental studies of large ischemicstrokes, the contralesional pre- and sensorimotor cortex as well asthe intact contralesional corticospinal tract (CST) have beenidentified as the brain structures involved most closely in reor-ganizational processes underlying potential recovery of impairedmotor functions14, 15. While the interpretation of enhancedactivity levels in the contralesional motor cortex (M1) remainscontroversial1, 16–19, sprouting of the intact contralesional CSTterminating in the stroke denervated hemi-spinal cord (eitheripsilaterally projecting fibers or midline crossing fibers), has beendescribed after various therapeutic and rehabilitativeinterventions5, 9, 20–23. Positive correlations between the amountsof newly sprouting CST fibers and the level of motor recovery aswell as the direct demonstration that pharmacogenetic silencingof these sprouted fibers abolished the recovered skilled reachingperformance22, 24 suggests a beneficial role of corticospinalrewiring.
Here we tested a new optogenetic activation protocol as a novelpotential therapeutic approach after stroke. As we used a largesensorimotor stroke, our study focused on the manipulation andcircuit investigation of the intact, contralesional hemisphere, asthe main region where plastic remodeling and reorganizationalprocesses are likely to be found which mediate recovery ofmovements in the paretic side. We selectively stimulated intactCST neurons using optogenetics in the contralesional motorcortex after a large sensorimotor stroke. A novel, unsupervisedcomputer vision-based analysis helped to evaluate fine-scalemodulation of rat forepaw grasping behavior before the strokeand during the rehabilitation and recovery process under thedifferent rehabilitative interventions. We find that optogeneticCST activation, combined with subsequent motor training, leadsto full recovery of forelimb function through CST axon remo-deling in the spinal cord, similar to a previously established anti-Nogo-A immunotherapy with subsequent training22. We fur-thermore investigated whether axonal rewiring re-establishes
specific reorganization patterns to fully compensate for lostfunctions. In animals with full motor recovery after the combinedimmunotherapeutic/training protocol, we selectively inactivateddistinct subsets of newly sprouted fibers of intact CST neuronsusing inhibitory optogenetics during the forelimb grasping task.Indeed, using automatic visual analysis of paw posture andkinematics, we found specific functional deficits induced byoptogenetic silencing of premotor and M1 subregions of thecontralesional cortex. Our findings highlight the great potential ofspecific neural activation protocols in combination with motortraining for the recovery of skilled motor functions after stroke.
ResultsOptogenetically stimulating the intact corticospinal tract. Weaimed at testing the therapeutic effect of optogenetically activat-ing the intact corticospinal tract of the contralesional hemisphereafter a large stroke in adult rats. After training the intact, prele-sioned animals in the single pellet grasping task for skilled fore-limb function25 and selectively expressing Channelrhodopsin-2(ChR2) in motor cortex neurons projecting to the spinal cord viaa dual viral approach (Fig. 1b, Methods), rats received a photo-thrombotic stroke destroying the premotor and the sensorimotorcortex, corresponding to the preferred paw (Methods, Supple-mentary Fig. 1). Rats were then randomized into four differentrehabilitation groups (Fig. 1a): In two of the groups, the intactcorticospinal tract on the contralesional side was optogeneticallystimulated 3 times/day for 2 weeks starting at day 3 after thestroke. Light delivery occurred through three optic fibersimplanted to cover the pre- and primary contralesional motorcortex (Supplementary Fig. 2). The stimulation paradigm con-sisted of 3 × 1 min stimulation at 10 Hz of 473 nm wavelengthLED light with 3-min intervals in between8. We observed visiblemovements, partially with rhythmic jerking, of the correspondinglimbs and freezing behavior, especially during the first 7 days afterstroke (Supplementary Movie 1)—an effect that vanished duringthe second week after stroke. Whereas in the “OptoStim group”stimulation of the corticospinal path was the only treatment,animals in the “OptoStim/Training group” were additionallytrained on the impaired paw in the single pellet grasping task with100 reaches per day starting after the 2 weeks of light stimulationup to 4 weeks after stroke (Fig. 1a). We here used the sequentialapproach of first optogentic stimulation of the intact corticospinaltract followed by intensive training based on our previousexperience that early combination of two plasticity stimulatingapproaches could be detrimental22. In the “Delayed Training”group, animals just received the single pellet grasping trainingbetween 2 and 4 weeks after stroke. The fourth “Spontaneousrecovery” group of rats did not receive any special treatment butwas tested at the same time points as the other groups for skilledgrasping function.
Optogenetically stimulating the intact corticospinal tractresulted in greatly improved forelimb function in both opticalstimulation groups (Fig. 1c, “OptoStim group” 52.9± 7.3%,“OptoStim/Training group” 53.0± 8.9%, p< 0.05, two-wayrepeated measures ANOVA with post hoc Bonferroni, Supple-mentary Fig. 5) already 7 days after insult compared to the“Delayed Training” or the untrained, unstimulated “Spontaneousrecovery” group. Importantly, animals with sequential opticalstimulation and training (OptoStim/Training) reached successrates 5 weeks after stroke comparable to healthy baselineconditions, while animals with intensive, delayed training showedsignificantly lower levels of regained forelimb function up to theend of the rehabilitative paradigm (Fig. 1c “OptoStim/Training”group 93.3± 15.8%, “Delayed Training” group 34.0± 13.7%,p< 0.001, two-way repeated measures ANOVA with post hocBonferroni).
ARTICLE NATURE COMMUNICATIONS | DOI: 10.1038/s41467-017-01090-6
2 NATURE COMMUNICATIONS | 8: 1187 |DOI: 10.1038/s41467-017-01090-6 |www.nature.com/naturecommunications
We exposed all animals at the end of the rehabilitative schedule(5–6 weeks post stroke) to novel tasks of skilled forelimb usage toassess non-task-specific recovery of motor function. Animals inboth stimulation groups—with or without additional training—performed significantly better than the other two groups innarrow beam crossing (Fig. 1d, “OptoStim” group 54.7± 4.0%,“OptoStim/Training” group 58.8± 4.7% vs. 37.3± 2.6% in the“Spontaneous recovery” and 35.2± 2.7% in the “DelayedTraining” group, p< 0.05, two-way repeated measures ANOVAwith post hoc Bonferroni) and in horizontal ladder crossing(Fig. 1e, “OptoStim” group 54.7± 2.8%, “OptoStim/Training”group 57.0± 2.4% vs. 38.6± 2.8% in the “Spontaneous recovery”and 35.4± 3.4% in the “Delayed Training” group, p< 0.05, two-way repeated measures ANOVA with post hoc Bonferroni).
These results indicate that optogenetic activation promoted non-task-specific recovery of forelimb function. Histological analysisof mCherry-positive cells (Fig. 1f) showed about 39% of layer 5neurons in M1 to be labeled, indicating that a large proportion ofthe CST neurons expressed ChR2 and were presumably activatedby the light stimulation.
Full recovery vs. compensation of lost functions. Recently, weshowed that combining 2 weeks of the growth-promoting anti-Nogo-A immunotherapy followed by 2 weeks of intensive train-ing after a large sensorimotor cortex stroke resulted in fullrecovery of lost forelimb function22. We repeated this protocoland directly compared the efficiency of this combinational
–33 d –30 d –23/21 d –14 d –7 d 0 14 d 28 d 42 d 63 d
Handling Training Fiber implant Baseline Week 1+2 Week 3+4 Novel tasks Analysis
Virus injection Stroke Tracing PerfusionRehabilitation paradigms
No intervention
Optical stimulation
Training
Groups Spontaneous recovery (SR) n=6
OptoStim (OS) n=7
OptoStim/ training (OS/T) n=6
Delayed training (DT) n=7
Spontaneous recovery (SR)
Delayed training (DT)
OptoStim (OS)
OptoStim/ training (OS/T)
Single pellet grasping
Narrow beam crossing Horizontal ladder test
Stroke CST
AAV2.1_Ef1a-DIO-hChR2-mCherry
AAV2.9-CamKII-Cre
Stroke
Suc
cess
rat
e (%
)
****
**
**
****
*
*****
****
******
**
**** **
********* ****
0
20
40
60
% m
Che
rry+
cel
ls o
fN
issl
+ c
ells
in la
yer
5se
nsor
imot
or c
orte
x
0
20
40
60
80
100
0
20
40
60
80
100
Scale bar = 50 µm
Post stroke
OS/T OS SR DT M2 M1 S1
0
50
100
150
200
OS/T OS SR DT
Baseli
ne 2 d
7 d
14 d
21 d
28 d
35 d
C5–
C6
Suc
cess
rat
e (%
)
Suc
cess
rat
e (%
)a
b c
d efa
b
Fig. 1 Specific optogenetic stimulation of the intact corticospinal tract originating from the contralesional hemisphere results in robust recovery of lostforelimb function after stroke. a Timeline for the four different treatment groups. b Schematic diagram of viral vector injections into the contralesionalmotor cortex (AAV2.1-Ef1a-DIO-hChR2(t159C)-mCherry) and the corresponding cervical hemi-spinal cord (AAV2.9-CamKII0.4.Cre.SV40) to specificallyexpress Channelrhodopsin-2 (ChR2) in the intact corticospinal neurons. c Success rates in the single pellet grasping task relative to baseline (100%; intact,trained) 2 days to 5 weeks after a large, unilateral photothrombotic stroke to the sensorimotor cortex of the preferred paw. The “OptoStim/Training” and“OptoStim” groups showed significant improvement of skilled forelimb function compared to the other groups. Both stimulation groups (“OptoStim” and“OptoStim/Training” group) also performed significantly better in novel tasks to assess recovery of forelimb function such as the narrow beam task (d) andthe horizontal ladder crossing task (e) tested at 5 weeks after stroke. Shown are average success rates of three consecutive trials. f Representative imagesof mCherry-positive cells (a) in the sensorimotor cortex in comparison to Nissl-positive cells (b) (a, b: scale bars= 50 μm) as well as quantification ofmCherry-positive cells in percentage of Nissl-positive cells in layer 5 of pre- (M2), primary motor cortex (M1), and primary sensory cortex (S1) forboth “stimulation” groups. Data are presented as means± s.e.m.; statistical evaluation was carried out with two-way (for c) and one-way (for d, e) ANOVArepeated measure followed by Bonferroni post hoc, and with paired t-test, two-tailed for F; asterisks indicate significances: *p< 0.05, **p< 0.01, and***p< 0.001
NATURE COMMUNICATIONS | DOI: 10.1038/s41467-017-01090-6 ARTICLE
NATURE COMMUNICATIONS |8: 1187 |DOI: 10.1038/s41467-017-01090-6 |www.nature.com/naturecommunications 3

therapy to that of optogenetic stimulation of the intact CST withsubsequent training (OptoStim/Training group). A cohort of ratsreceiving the immunotherapy during weeks 1 and 2 after thestroke followed by grasping training (weeks 3 and 4 after stroke,
Fig. 2a, “Anti-Nogo/Training” group) was tested during thecourse of recovery in comparison to animals of the “OptoStim/Training” group and “Spontaneous recovery group” (from Fig. 1).“Anti-Nogo/Training” and “OptoStim/Training” animals revealed
** *** ***
**
0
40
20
60
0
20
40
60
80
0
50
100
Color legend forB and E
****-
0.0081025
7 d14 d21 d
28–35 d
0Baseline
2 d
7 d
14 d
21 d28–35 d
7 d
14 d
28–35 d
7 d
14 d
21 d
28–35 d
7 d
14 d21 d
28–35 d
7 d
14 d21 d
28–35 d
21 d
Gra
spin
g fr
eque
ncy/
time
in th
e gr
aspi
ng b
ox (
%)
Stroke
Post stroke 28–3
5 d
21 d7
d14
d2
d
Baseli
ne
Baseli
ne 2 d
7 d
14 d
28–3
5 d
StrokeSingle pellet grasping
Post strokeAnti-Nogo/ training n=9
Spontaneous recovery n=6
OptoStim/ training n=6
OptoStim/ training OptoStimSpontaneous recovery Delayed trainingAnti-Nogo/ training
Scale bar= 1/10 distance BL-2 d
OptoS
tim/ t
raini
ng
OptoS
tim
Spont
aneo
us re
cove
ry
Delaye
d tra
ining
Anti-N
ogo/
train
ing
Suc
cess
rat
e (%
)m
m3
Stroke sizen.s.
OptoStim/ training n=5OptoStim n=6Spontaneous recovery n=9Delayed training n=5Anti-Nogo/ training n=6
Stroke
0
0.00004
0.046355
0.533508
0.003051
0.000006
0.000002
0.004599
0.019014
0.012482
0.009789
0.0467
0.0663
0.1688
0.2901855
0.000003
0.00076
0.006606
0.2901855
ba
c d
e f
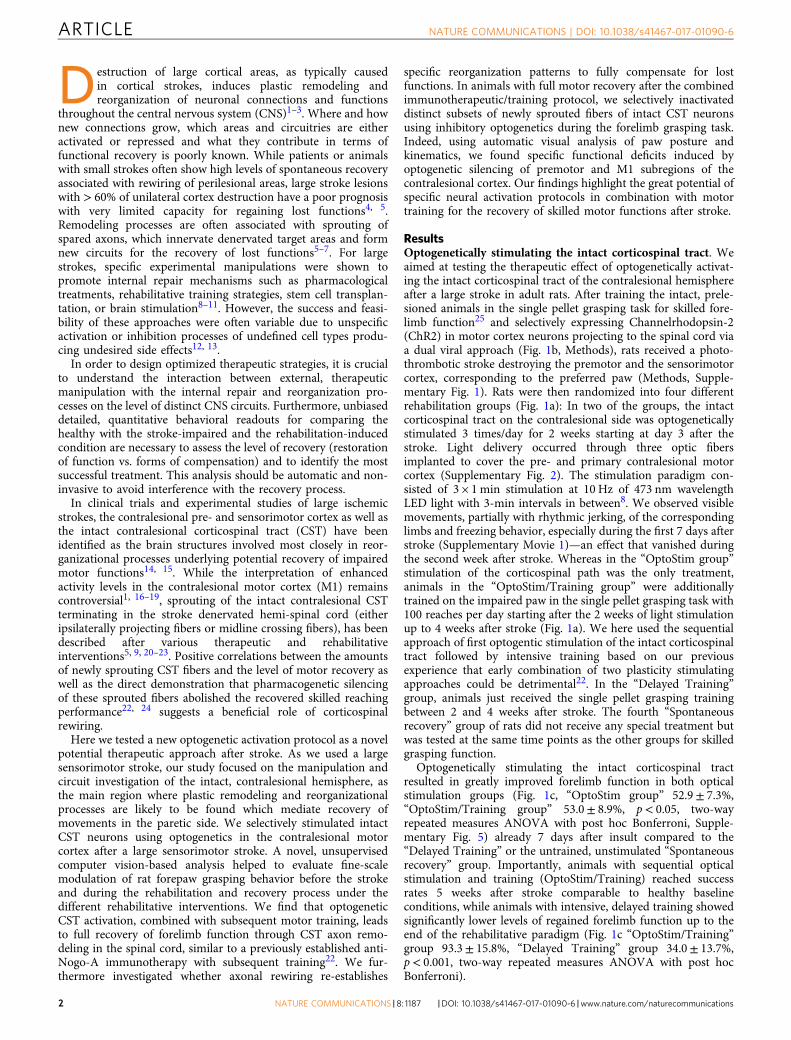
Fig. 2 Brief daily optogenetic stimulation of the intact corticospinal tract leads to full recovery of forelimb function similar to a growth-promoting therapycombined with training. a Stroke animals that received anti-Nogo-A immunotherapy (Anti-Nogo/Training) or optogenetic CST stimulation (OptoStim/Training group) followed by rehabilitative training performed significantly better in the single pellet grasping task than stroke animals without treatment(Spontaneous recovery group, same group as in Fig. 1) even 1 week after stroke. b Computer vision-based automatic analysis of overall grasping activity ofanimals from all five treatment groups (from Figs. 1 and 2a) during their time in the grasping box showed that all animals were less likely to perform singlepellet grasping within the first week after stroke, but the frequency of grasping activity was back close to baseline levels in all groups 4–6 weeks afterstroke. c Automatic video-based grasping analysis. Paws were tracked and represented by comparing them against a codebook of prototypical postures.Thereafter, the similarity of grasping sequences to baseline and 2d grasps was computed using a sequence matching approach and averaged for eachrecording session of each cohort. The resulting two distances (capturing the relative degradation compared to baseline and the improvement compared to2d) yield a relative location that is then visualized by triangulation. During the recovery phase, the grasping behavior of the “Stimulation/Training” and“Anti-Nogo/Training” groups becomes progressively more similar to the baseline configuration. In contrast, the delayed training and spontaneous cohortsshow no substantial improvement. d Statistical significance analysis of c. Grasps at 7d, 14d, 21d and 28–35 are compared to the baseline. A K–S test thenreveals that the “Spontaneous recovery” and “Delayed Training” cohorts show indeed no significant recovery (p> 0.05) at the rehabilitative end point(28–35d post stroke), as opposed to the three other treatment cohorts, whose behavior shows no significant difference compared to baseline anymore.e No significant difference was found for the stroke lesion size among all five treatment groups examined. f Representative coronal section showing thelesioned motor cortex in Nissl staining (8 weeks after stroke, scale bar= 1 mm). Data are presented as means± s.e.m.; statistical evaluation was carriedout with two-way ANOVA (a, b) and one-way ANOVA (e) repeated measure followed by Bonferroni post hoc; asterisks indicate significances: *p< 0.05,**p< 0.01, and ***p< 0.001
ARTICLE NATURE COMMUNICATIONS | DOI: 10.1038/s41467-017-01090-6
4 NATURE COMMUNICATIONS | 8: 1187 |DOI: 10.1038/s41467-017-01090-6 |www.nature.com/naturecommunications

a significant regain of forelimb function already at 1 week afterstroke (Fig. 2a). However, full recovery of prelesion levels wasreached in the fourth week after stroke for the “OptoStim/Training” group, while animals in the “Anti-NogoTraining”cohort achieved success scores similar to baseline levels already3 weeks after stroke. Very much in contrast, animals withouttreatment (Spontaneous recovery group) plateaued at a successrate below 30% throughout the post-stroke phase (Fig. 2asuccess rate at 4 weeks: 97.4± 6.0% “Anti-Nogo/Training” group,
93.3± 15.8% “OptoStim/Training” group, 25.5± 6.2% “Sponta-neous recovery” group; p< 0.001, two-way repeated measuresANOVA with post hoc Bonferroni). Stroke volume analysis ofall rehabilitative groups revealed no difference in lesionsize between the treatment groups (Fig. 2e, one-way ANOVArepeated measure followed by Bonferroni post hoc).
We next investigated which of the five treatment paradigmspromoted true restoration or only a mere compensation offorelimb function. In case of restoration, complete recovery of the
Sec
ond
mos
t cha
ract
eris
ticdi
rect
ion
of v
aria
tion
Gra
spin
g po
stur
es 3
5 d
p.o.
vers
us b
asel
ine
in s
td. d
ev.
4
2
0
–2
–4
–6
Sec
ond
mos
t cha
ract
eris
ticdi
rect
ion
of v
aria
tion
4
2
0
–2
–4
–6
Sec
ond
mos
t cha
ract
eris
ticdi
rect
ion
of v
aria
tion
4
2
0
–2
–4
–6
Sec
ond
mos
t cha
ract
eris
ticdi
rect
ion
of v
aria
tion
4
2
0
–2
–4
–6
Sec
ond
mos
t cha
ract
eris
ticdi
rect
ion
of v
aria
tion
4
2
0
–2
–4
–6
4 620–2–4–6
Most characteristic direction of variation
4 620–2–4–6
Most characteristic direction of variation
4 620–2–4–6
Most characteristic direction of variation
4 620–2–4–6
Most characteristic direction of variation
4 620–2–4–6
Most characteristic direction of variation
35 d BL
t t
Spontaneousrecovery
Delayedtraining
OptoStim/training
Nogo/training
OptoStim
1.5
1.0
0.5
0
Gra
spin
g po
stur
es 3
5 d
p.o.
vers
us b
asel
ine
in s
td. d
ev.
1.5
1.0
0.5
0G
rasp
ing
post
ures
35
d p.
o.ve
rsus
bas
elin
e in
std
. dev
.
1.5
1.0
0.5
0
Gra
spin
g po
stur
es 3
5 d
p.o.
vers
us b
asel
ine
in s
td. d
ev.
1.5
1.0
0.5
0
Gra
spin
g po
stur
es 3
5 d
p.o.
vers
us b
asel
ine
in s
td. d
ev.
1.5
1.0
0.5
0
Norm. grasp time0.15 0.35 0.55 0.75 0.95
Norm. grasp time0.15 0.35 0.55 0.75 0.95
Norm. grasp time0.15 0.35 0.55 0.75 0.95
Norm. grasp time0.15 0.35 0.55 0.75 0.95
Norm. grasp time0.15 0.35 0.55 0.75 0.95
1. 2. 3. 5.4.
1. 2. 3. 4.
1. 2. 3. 4.
1. 2. 3. 4.
1. 2. 3. 5.4.
BL
35 d
BL
35 d
BL
35 d
BL
35 d
BL
35 d
a
b
c
d
e
NATURE COMMUNICATIONS | DOI: 10.1038/s41467-017-01090-6 ARTICLE
NATURE COMMUNICATIONS |8: 1187 |DOI: 10.1038/s41467-017-01090-6 |www.nature.com/naturecommunications 5
pre-stroke grasping kinematics and the sequence of posturalmotifs was achieved, whereas compensation lead to the substitu-tion of the original movement sequence by other movements. Weutilized high-resolution video recordings of single pellet graspingbefore stroke and during 4–5 weeks of rehabilitation. Graspactions were automatically evaluated with a novel computervision algorithm for unsupervised behavior analysis (see“Methods” section for details). Not only does this algorithmextract the spatial trajectories of a grasp but also analyses itskinematics, i.e., it compares the sequences of individual posturesthat comprise each grasp. After an initial paw detection andtracking, the paw posture at each time point was represented bycomparing it with a dictionary of prototypical poses extractedfrom successful grasping moves. Afterwards, grasping sequenceswere compared using a sequence matching approach, yielding adistance between grasps based on the similarity of their respectivesequences of postures. To determine the sensitivity of ourapproach, we first aimed at detecting differences of graspingquality during the course of learning the single pellet graspingtask (over 24 days before “baseline” recordings prior to stroke).Our algorithm was able to classify even small differences in thehealthy condition during the course of skilled motor learning (seeSupplementary Fig. 3). Using this method, we then assessed howfrequently animals showed grasping activity as opposed to beingidle (Fig. 2b): Grasping frequency of all animals was reducedwithin the first week after stroke. Reduced grasping frequency canbe due to decreased motivation or reduced grasping velocitybecause of proximal shoulder and elbow impairments. Whilegrasping frequency quickly recovered to baseline levels within2 weeks for all cohorts, the skilled behavior did not as investigatedin Fig. 2c. In this figure, we precisely compared grasps at differentstages after stroke against two references, the skilled baselinebehavior as well as impaired activity 2 days after stroke (oneexample from either set is presented below the figure). For eachcohort and time point, we thus obtained an average distance of allgrasps of that session to the baseline and 2 days grasping. Usingthese two distances, grasping in each recording session waslocalized by triangulation in a two-dimensional plot: Sessionsappearing toward the left are more similar to baseline, those at theright are closer to the state right after stroke. Those at the top arefurther away from both baseline and stroke, meaning that therewas compensation, which altered the behavior from what it wasright after stroke, but also increased the difference to baseline. Wesee that the “OptoStim/Training,” “Anti-Nogo/Training,” and“OptoStim” groups exhibit reorganization of the behavior. Until3 weeks after stroke, their grasping is significantly altered withrespect to 2 days and baseline. Thereafter, at 28–35 days graspingof these three treatment groups again becomes significantly more
similar to what it was at baseline. In Fig. 2d, a K–S test wasconducted to confirm if the discrepancy of posture sequencesbetween grasping at a particular time after stroke and those atbaseline was significant (p< 0.05). Four weeks after stroke, the“OptoStim/Training,” “Anti-Nogo/Training,” and “OptoStim”groups showed no significant dissimilarity to baseline anymore,implying a full restoration of forelimb function for these groups.In contrast, the other two cohorts (Spontaneous recovery andDelayed Training) exhibited forms of compensation, since theirbehavior changed significantly after stroke without becomingsimilar to baseline.
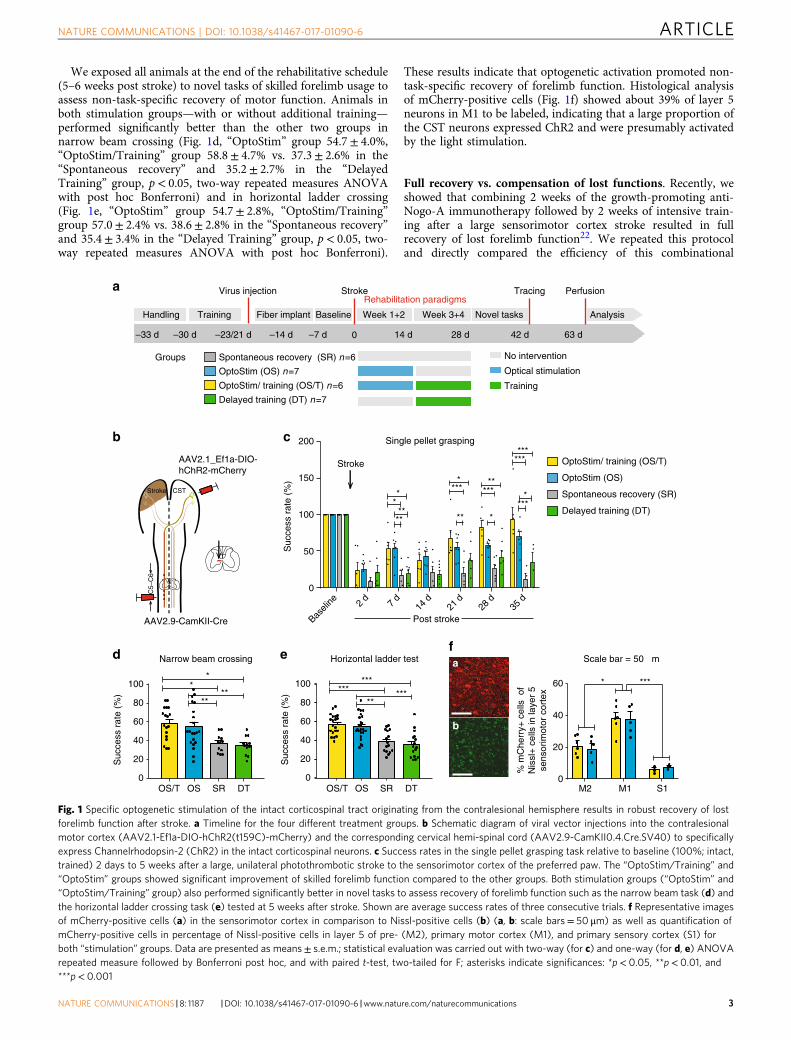
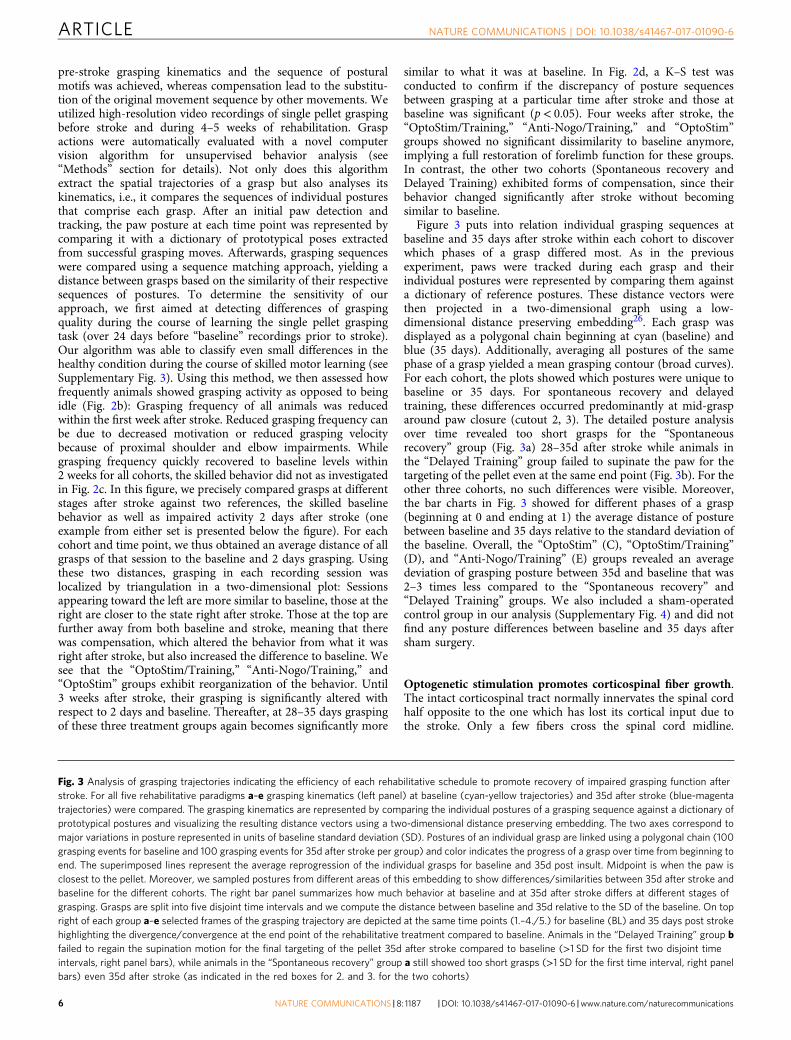
Figure 3 puts into relation individual grasping sequences atbaseline and 35 days after stroke within each cohort to discoverwhich phases of a grasp differed most. As in the previousexperiment, paws were tracked during each grasp and theirindividual postures were represented by comparing them againsta dictionary of reference postures. These distance vectors werethen projected in a two-dimensional graph using a low-dimensional distance preserving embedding26. Each grasp wasdisplayed as a polygonal chain beginning at cyan (baseline) andblue (35 days). Additionally, averaging all postures of the samephase of a grasp yielded a mean grasping contour (broad curves).For each cohort, the plots showed which postures were unique tobaseline or 35 days. For spontaneous recovery and delayedtraining, these differences occurred predominantly at mid-grasparound paw closure (cutout 2, 3). The detailed posture analysisover time revealed too short grasps for the “Spontaneousrecovery” group (Fig. 3a) 28–35d after stroke while animals inthe “Delayed Training” group failed to supinate the paw for thetargeting of the pellet even at the same end point (Fig. 3b). For theother three cohorts, no such differences were visible. Moreover,the bar charts in Fig. 3 showed for different phases of a grasp(beginning at 0 and ending at 1) the average distance of posturebetween baseline and 35 days relative to the standard deviation ofthe baseline. Overall, the “OptoStim” (C), “OptoStim/Training”(D), and “Anti-Nogo/Training” (E) groups revealed an averagedeviation of grasping posture between 35d and baseline that was2–3 times less compared to the “Spontaneous recovery” and“Delayed Training” groups. We also included a sham-operatedcontrol group in our analysis (Supplementary Fig. 4) and did notfind any posture differences between baseline and 35 days aftersham surgery.
Optogenetic stimulation promotes corticospinal fiber growth.The intact corticospinal tract normally innervates the spinal cordhalf opposite to the one which has lost its cortical input due tothe stroke. Only a few fibers cross the spinal cord midline.
Fig. 3 Analysis of grasping trajectories indicating the efficiency of each rehabilitative schedule to promote recovery of impaired grasping function afterstroke. For all five rehabilitative paradigms a–e grasping kinematics (left panel) at baseline (cyan-yellow trajectories) and 35d after stroke (blue-magentatrajectories) were compared. The grasping kinematics are represented by comparing the individual postures of a grasping sequence against a dictionary ofprototypical postures and visualizing the resulting distance vectors using a two-dimensional distance preserving embedding. The two axes correspond tomajor variations in posture represented in units of baseline standard deviation (SD). Postures of an individual grasp are linked using a polygonal chain (100grasping events for baseline and 100 grasping events for 35d after stroke per group) and color indicates the progress of a grasp over time from beginning toend. The superimposed lines represent the average reprogression of the individual grasps for baseline and 35d post insult. Midpoint is when the paw isclosest to the pellet. Moreover, we sampled postures from different areas of this embedding to show differences/similarities between 35d after stroke andbaseline for the different cohorts. The right bar panel summarizes how much behavior at baseline and at 35d after stroke differs at different stages ofgrasping. Grasps are split into five disjoint time intervals and we compute the distance between baseline and 35d relative to the SD of the baseline. On topright of each group a–e selected frames of the grasping trajectory are depicted at the same time points (1.–4./5.) for baseline (BL) and 35 days post strokehighlighting the divergence/convergence at the end point of the rehabilitative treatment compared to baseline. Animals in the “Delayed Training” group bfailed to regain the supination motion for the final targeting of the pellet 35d after stroke compared to baseline (>1 SD for the first two disjoint timeintervals, right panel bars), while animals in the “Spontaneous recovery” group a still showed too short grasps (>1 SD for the first time interval, right panelbars) even 35d after stroke (as indicated in the red boxes for 2. and 3. for the two cohorts)
ARTICLE NATURE COMMUNICATIONS | DOI: 10.1038/s41467-017-01090-6
6 NATURE COMMUNICATIONS | 8: 1187 |DOI: 10.1038/s41467-017-01090-6 |www.nature.com/naturecommunications

We investigated if our paradigm of brief, repeated daily optoge-netic stimulation of the contralesional, intact corticospinal tractwas sufficient to induce corticospinal fiber sprouting across themidline to innervate the denervated spinal cord, a phenomenonwhich has been described in rats treated with growth-promotinganti-Nogo antibodies9, 22. Corticofugal fibers from the contrale-sional motor cortex were labeled by anterograde transport ofBDA 5–6 weeks after stroke (Fig. 4a). We found the greatestnumber of midline crossing fibers in the “OptoStim/Training”and “OptoStim,” as well as the “Anti-Nogo/Training” group(Fig. 4b and Supplementary Fig. 5). The number of fibers growninto the stroke denervated spinal hemi-cord in these three groupswas significantly higher than in other groups when counted at themidline of the cervical spinal cord (Fig. 4b, “M”), but also withinthe gray matter of the motor laminae 6 and 7 (Fig. 4b, D1–4). Asegment-specific analysis along the cervical spinal cord of midlinecrossing fibers at (M) revealed enhanced corticospinal rewiringthroughout the denervated spinal cord for the “OptoStim/Training” and “Anti-Nogo/Training” groups at C3–C8 vs. theother groups (Fig. 4c; p< 0.01, two-way repeated measures
ANOVA with post hoc Bonferroni). Midline crossing was slightlyless pronounced in the “Stimulation” alone group (Fig. 4c). Apartfrom midline crossing corticospinal fibers, CST fibers can alsoreach the denervated spinal cord uncrossed, as sprouting, pre-existing ipsilaterally projecting axons. We counted the number ofintersections of collaterals of these ipsilaterally projecting fibers atthe gray/white matter boundary of the ventral funiculus as ameasure of gray matter innervation by the ventral CST. Weagain found that both stimulation groups and the “Anti-Nogo/Training” group revealed the highest amount of fiber growth inthe ventral CST (Fig. 4d). There was also a positive correlationbetween the amount of midline crossing CST fibers and the levelof skilled motor recovery of the impaired paw 4–5 weeks afterstroke (Fig. 4e).
These data show that three short daily periods of briefoptogenetic stimulation of the intact corticospinal tract appliedover 2 weeks (plus training) are sufficient to induce robust axonalgrowth into the denervated hemi-cord. Density of sproutingBDA-labeled CST fibers in the denervated spinal cord was up to16–18 times higher, in particular in lamina 6/7 of the ventral
b
M D1 D2 D3 D40.000
0.005
0.010
0.015
M D1 D2 D3 D4
a
0.015
0.010
0.005
0.000
***
*
***
***
***
**
****
***
M. ext. carpi. rad. brev./long. M. ext. dig. quart./ M. ext. carp. ulnar.
M. biceps brachii M. triceps brachii
M. fl. c. ulnar./palm. long./dig.prof.M. fl. c. radialis
M. acromiotrapezius M. spinodeltoideus
c
Spontaneous recovery n=5
Delayed training n=4
OptoStim n=3
OptoStim/ training n=4
Anti-Nogo/ training n=6 Naive n=5
*** **
****
***
***
*
*
Relative position in the denervated spinal hemi cord
******
****
***
**** **
**
* ****
*
Cervical spinal cord level
2468
12141618
10
OptoStim/training OptoStim
2468
12141618
10
2468
12141618
10
x10–3
Delayed training Spontaneous Naive
Anti-Nogo/training
2468
12141618
10
2468
12141618
10
2468
12141618
10
x10–3
x10–3
x10–3
x10–3
x10–3
0.000 0.005 0.010 0.0150
50
100
150
Suc
cess
rat
eS
ingl
e pe
llet g
rasp
ing
(%)
Ipsi
late
ral s
prou
ting
CS
Tfib
ers
in d
ener
vate
d sp
inal
cord
/BD
A+
CS
T fi
bers
0.000
0.005
0.010
0.015 ****-***
*
d e
f
r =0.79
CST fibers crossing in denervatedspinal cord/BDA+ CST fibers
Nor
mal
ized
CS
T fi
ber
spro
utin
g in
the
dene
rvat
ed c
ervi
cal s
pina
l cor
d
CS
T fi
bers
cro
ssin
g in
den
erva
ted
spin
al c
ord/
BD
A+
CS
T fi
bers
CS
T fi
bers
cro
ssin
g at
M in
den
erva
ted
spin
al c
ord/
BD
A+
CS
T fi
bers
C3 C4 C5 C6 C7 C8 Th1
Fig. 4 Corticospinal fiber sprouting from intact to denervated spinal hemi-cord is enhanced by early cortical stimulation. a Corticospinal tract fibers fromthe intact, contralesional motor cortex cross the spinal cord midline (M) and grow into the corticospinally denervated gray matter for various distances(D1–4, scale bar= 200 µm). b Values were significantly higher in the stimulation groups and the anti-Nogo-A group. c Segment-specific analysis of midlinecrossing fibers showed that the two stimulation groups and the “Anti-Nogo/Training” group had significantly more midline crossing fibers in the morerostral cervical spinal cord where motoneuron pools controlling proximal forelimb muscles are located, whereas fiber sprouting in the more caudal cervicalspinal cord where motoneuron pools for the distal muscles are located was less pronounced compared to the “Spontaneous recovery” and “Delayedtraining” groups as well as in naive animals. d Sprouting of pre-existing ipsilateral CST fibers in the gray matter of the cervical enlargement after stroke wasalso most pronounced in the “Anti-Nogo/Training” group as well as in the “OptoStim/Training” group. e There was a positive correlation between theamount of newly sprouting CST fibers and the level of recovered grasping function of the impaired forelimb 4–5 weeks after stroke (r= 0.79, Spearmancorrelation, p< 0.0001). f Average false color-coded heat maps of CST fiber sprouting densities in the denervated spinal cord at C4 level. In bothstimulation groups and the “Anti-Nogo/Training” group, CST fibers in particular sprouted in lamina 6/7 of the ventral horn. Asterisks represent statisticalsignificance. Data are presented as means± s.e.m.; statistical evaluation was carried out with two-way ANOVA repeated measure followed by Bonferronipost hoc, asterisks indicate significances: *p< 0.05, **p< 0.01, and ***p< 0.001
NATURE COMMUNICATIONS | DOI: 10.1038/s41467-017-01090-6 ARTICLE
NATURE COMMUNICATIONS |8: 1187 |DOI: 10.1038/s41467-017-01090-6 |www.nature.com/naturecommunications 7
horn, in the “OptoStim/Training” and “Anti-Nogo/Training”group compared to BDA-positive fibers in intact (Naive) animals(Fig. 4f). In addition, animals in the “OptoStim” group revealed a9–13× higher BDA-positive CST fibers density, e.g., in lamina 4/5compared to intact animals.
Loss of regained grasping features by cortical silencing. Theimportance of the intact CST and in particular of its midlinecrossing fibers at spinal cord level for the recovery of lost motorfunctions after a large cortical stroke has been demonstrated inseveral recent studies21–23, 27. Growth pattern and targeting ofthese midline crossing fibers mainly to lamina 6/7 of the dener-vated spinal hemi-cord seems crucial for motor recovery22.However, the precise origin of these fibers in the premotor, rostralmotor field (M2), the main motor forelimb area (M1) or the
sensory forelimb area (S1) remained unclear. In order to addressthis question, we selectively inactivated subsets of midlinecrossing corticospinal fibers originating from these three corticalregions during the single pellet grasping task to test their functionfor specific kinematic aspects of the regained grasping action. Weused animals with excellent functional recovery that had received2 weeks of anti-Nogo immunotherapy followed by 2 weeks ofintensive training (Anti-Nogo/Training group) and comparedthem to animals with a low level of recovery without treatment(Spontaneous recovery group) (Fig. 5a). Animals of the“OptoStim/Training” group were not used here due to technicalreasons (vector injection protocols) and possible interference ofco-activating and silencing optogenetic vectors. Four weeks afterstroke, we injected a Cre-expressing adeno-associated virus(AAV2.9) into segments C5 and C6 of the stroke denervated
a
–3 weeks 0 1 d 28 d 42 d 49 d
Training Rehabilitation/ Re-testing Re-testing Optogenetic experiment Analysis
StrokeVirus injectionand fiber implantation
Perfusion
7 d 14 d
Anti-Nogo TrainingSpontaneous recovery
70 d
C5–
C6
Stroke CST
AAV2.9-CamKII-Cre
AAV2.1 flex-CAG-ArchT-GFP
b
Suc
cess
rat
e %
Suc
cess
rat
e %
20
40
60
80
100
0
50
150
100
0
*
** ***
Sham-operated n=3 Spontaneous recovery n=4
0
+4.0
+1.0
Bregma
Stroke
FrA
M1M2
S1
c
1
23
100 s100 s
d
-** ***-
Light onLight off Light onLight off
***
***** *** *** ***
Anti-Nogo/ training n=6
Pos. 1
Pos. 2
Pos. 3
All pos
.
Pos. 1
Pos. 2
Pos. 3
All pos
.
Pos. 1
Pos. 2
Pos. 3
All pos
.
Pos. 1
Pos. 2
Pos. 3
All pos
.
Pos. 1
Pos. 2
Pos. 3
All pos
.
Pos. 1
Pos. 2
Pos. 3
All pos
.
Light offLight offLight off Light onLight on
e f
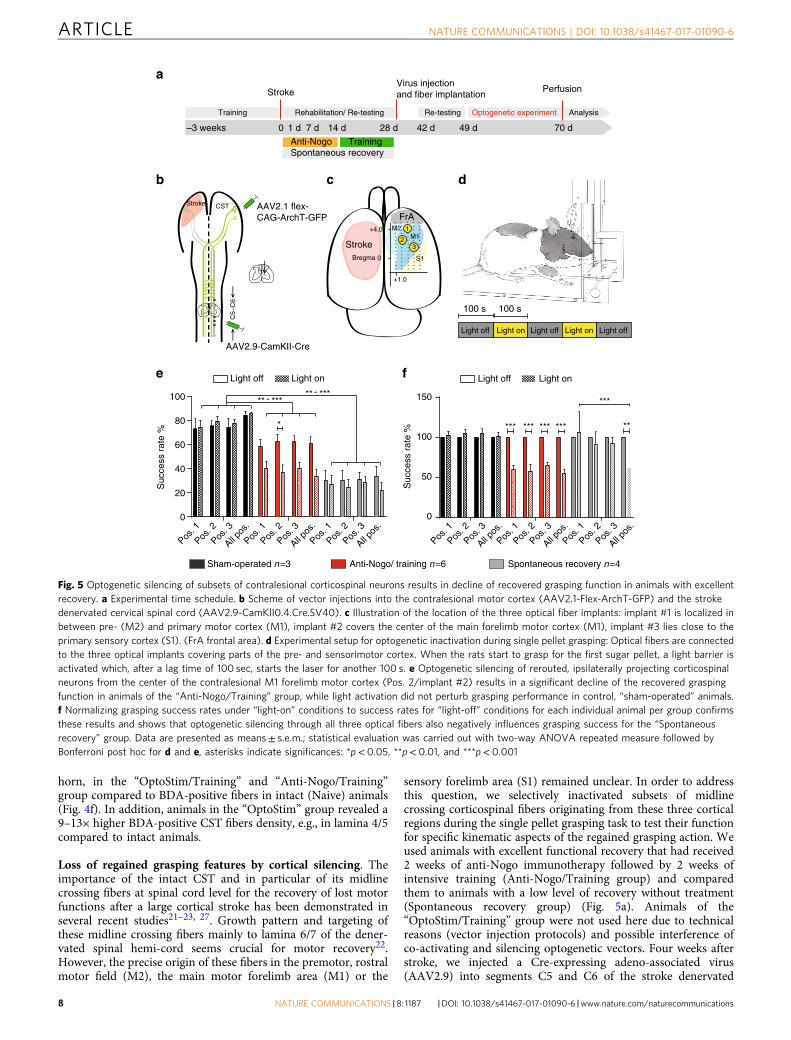
Fig. 5 Optogenetic silencing of subsets of contralesional corticospinal neurons results in decline of recovered grasping function in animals with excellentrecovery. a Experimental time schedule. b Scheme of vector injections into the contralesional motor cortex (AAV2.1-Flex-ArchT-GFP) and the strokedenervated cervical spinal cord (AAV2.9-CamKII0.4.Cre.SV40). c Illustration of the location of the three optical fiber implants: implant #1 is localized inbetween pre- (M2) and primary motor cortex (M1), implant #2 covers the center of the main forelimb motor cortex (M1), implant #3 lies close to theprimary sensory cortex (S1). (FrA frontal area). d Experimental setup for optogenetic inactivation during single pellet grasping: Optical fibers are connectedto the three optical implants covering parts of the pre- and sensorimotor cortex. When the rats start to grasp for the first sugar pellet, a light barrier isactivated which, after a lag time of 100 sec, starts the laser for another 100 s. e Optogenetic silencing of rerouted, ipsilaterally projecting corticospinalneurons from the center of the contralesional M1 forelimb motor cortex (Pos. 2/implant #2) results in a significant decline of the recovered graspingfunction in animals of the “Anti-Nogo/Training” group, while light activation did not perturb grasping performance in control, “sham-operated” animals.f Normalizing grasping success rates under “light-on” conditions to success rates for “light-off” conditions for each individual animal per group confirmsthese results and shows that optogenetic silencing through all three optical fibers also negatively influences grasping success for the “Spontaneousrecovery” group. Data are presented as means± s.e.m.; statistical evaluation was carried out with two-way ANOVA repeated measure followed byBonferroni post hoc for d and e, asterisks indicate significances: *p< 0.05, **p< 0.01, and ***p< 0.001
ARTICLE NATURE COMMUNICATIONS | DOI: 10.1038/s41467-017-01090-6
8 NATURE COMMUNICATIONS | 8: 1187 |DOI: 10.1038/s41467-017-01090-6 |www.nature.com/naturecommunications

cervical hemi-spinal cord28, followed by injections of the Cre-dependent AAV2.1 vector carrying the inhibitory light-drivenoutward proton pump Arch T into the contralesional pre- andsensorimotor cortex (Fig. 5b). We then chronically implantedthree optical fibers over the cortical surface in such a way thatoptical fiber #1 targeted parts of the pre- and rostral motor cortexM2, implant #2 was stereotactically positioned above the princi-pal forelimb motor cortex (M1), and implant #3 covered alsoparts of the primary sensory cortex (Fig. 5c). We also implantedoptical fibers into “Sham-operated” naive animals without virusinjections to confirm that light stimulation alone did not influ-ence the grasping behavior. For the optogenetic silencing of dis-tinct subsets of corticospinal fibers during the grasping taskanimals were put in the grasping box and connected via longoptical fibers to three lasers (532 nm weavelength), enablingoptical silencing at each implant location independently (Fig. 5d).The first grasp for a sugar pellet activated a light barrier, whichinitiated the three lasers after a time lock of 100 s and kept themon with continuous laser light for 100 s. After a lag time of 100 swith laser lights off, the next grasp initiated another phase of laserlight activation. We either stimulated only one position (position1 vs. position 2 vs. position 3, Fig. 5c) or all three positions at thesame time during a grasping session. We found that opticalsilencing midline crossing CST fibers originating from thecontralesional forelimb motor cortex resulted in a drop ofperformance for all cortical areas silenced in animals of the“Anti-Nogo/Training” group. However, this decrease reached
significance only for M1 (Fig. 5e, “Anti-Nogo/Training” groupsuccess rate at position #2 62.5± 6.2% during “light-off” vs.37.2± 6.9% success rate during “light-on,” p< 0.05, two-wayrepeated measures ANOVA with post hoc Bonferroni). The lowlevel of grasping performance in the “Spontaneous recovery”group did not change significantly by the regional cortical inac-tivation (Fig. 5e). The grasping success of the “Sham-operated”animals remained unaltered upon light stimulation and animalsdid not show signs of distress during light stimulation or by thepresence of the optic fibers (Fig. 5e). Normalizing grasping suc-cess rates of the “light-on” relative to the “light-off” conditionindividually per animal and per cortical position of stimulationrevealed for the animals with excellent recovery (“Anti-Nogo/Training” group) a significant decline of grasping function uponstimulation at each individual position as well as for all positionstogether (Fig. 5f, relative loss of function in premotor area(position #1) 40.7%; in M1 (position #2) 42.3%; in lateral M1-S1(position #3) 35.6%; all positions together: 45.0%, p< 0.001, two-way repeated measures ANOVA with post hoc Bonferroni). Incontrast, only inhibition at all three implant positions at the sametime caused a decrease of grasping success rates in animals withalready poor recovery of forelimb function (“Spontaneousrecovery” group, relative loss of function upon stimulation at allpositions at the same time 38.0%, p< 0.001, two-way repeatedmeasures ANOVA with post hoc Bonferroni).
We then asked whether the three targeted cortical regions wereresponsible for particular aspects of the reaching movement or to
* = sugar location
Loca
tion
prob
abili
ty
0
0.0015–0.01
00.01
Rel
. dis
tanc
e
Pix
el
–100
–50
0
–100
–50
0
–100
–50
0
–100
–50
0
–0.010
0.01
Rel
. dis
tanc
e
Pix
el
–0.010
0.01
Rel
. dis
tanc
e
Pix
el
–40 0 40–4
0 0 40–40 0 40
–0.010
0.01
–0.010
0.01
–0.010
0.01
–0.010
0.01
–0.010
0.01
–0.010
0.01
–0.010
0.01
–0.010
0.01
–0.010
0.01
Rel
. dis
tanc
e
Rel
. dis
tanc
eR
el. d
ista
nce
Rel
. dis
tanc
eR
el. d
ista
nce
Rel
. dis
tanc
eR
el. d
ista
nce
Rel
. dis
tanc
eR
el. d
ista
nce
PixelPixel
Pix
el
Pix
el
–100
–50
0
–100
–50
0
–100
–50
0
–100
–50
0
Pix
elP
ixel
Pix
el
Pix
el
–100
–50
0
–100
–50
0
–100
–50
0
–100
–50
0
Pix
elP
ixel
Pix
el
Pos
ition
1P
ositi
on 2
Pos
ition
3A
ll po
sitio
ns
Spontaneous recoverySham-operatedb c d
Light on (II)Light off (I)
p = 0.05072
p = 0.96433
p = 0.96411
p = 0.86653
p = 0.0008
p = 0.00536
p = 0.18846
p = 0.00371
p = 0.04751
p = 0.30904
p = 0.09202
p = 0.00022
a
(III)
–40 0 40–4
0 0 40–40 0 40
PixelPixel
Light on (II)Light off (I)
–40 0 40–8
0–4
0 0 40–80
–40 0 40
PixelPixel
Light on (II)Light off (I)(III) (III)
Anti-Nogo/ training
Fig. 6 Animals with excellent motor recovery show specific regional organization of distinct microcircuitry in the contralesional cortex for the targetingkinematics of skilled grasping. a Side view (cutout) of a rat performing single pellet grasping. The paw trajectory of a successful grasp is superimposed.The furthest extension of the paw, location x, was automatically detected to capture the grasping trajectory in relation to the position of the sugar pellet.b–d Spatial distribution of the furthest extension calculated using every grasping trial under “light-off” (I) and “light-on” (II) conditions; (III) relativedistance between “light-off” and “light-on” (*= position of the sugar pellet). Therefore, the spatial distribution (I) and (II) are marginalized onto thex-location, before subtracting the resulting one-dimensional distributions to obtain (III). b Targeting of the paw to its final position over the sugar pellet in“sham-operated” animals was unaffected by light stimulation at positions 1–3 of the sensorimotor cortex independently or by concurrent light exposure ofall cortical positions (“all positions”: positions 1–3 together). c Animals of the “Anti-Nogo/Training” group with excellent recovery of grasping reached toofar when the recrossed corticospinal neurons were inhibited in the contralesional premotor cortex position 1 or too short when the neurons in M1 (pos. 2)were silenced, whereas silencing close to S1 (Fig. 5d, pos. 3) did not affect the grasping behavior under “light-on” conditions. d Paw targeting of the“Spontaneous recovery” animals was poor overall and only significantly altered when all three cortical positions were optogenetically silenced at the sametime (all position)
NATURE COMMUNICATIONS | DOI: 10.1038/s41467-017-01090-6 ARTICLE
NATURE COMMUNICATIONS |8: 1187 |DOI: 10.1038/s41467-017-01090-6 |www.nature.com/naturecommunications 9

specific movement components. We used machine learningalgorithms to dissect different aspects of the grasping kinematicsand to analyze how they were affected by the “light-on” and“light-off” situation. Upon silencing of the rewired CST fibers inthe three cortical areas, we detected distinct differences of theforepaw targeting, especially with regard to the final paw positionrelative to the pellet (Fig. 6a): While optical silencing in neither ofthe three cortical areas in sham-operated animals altered thegrasping performance (Fig. 6b), inhibiting corticospinal-projecting neurons by green light stimulation in contralesionalforelimb motor cortex (position #2) in animals with excellentmotor recovery (“Anti-Nogo/Training” group) resulted in tooshort grasping actions thus missing the pellet (Fig. 6c, p= 0.0053,light-off vs. light-on condition, K–S test, Supplementary Table 1).Silencing the premotor cortex (position #1) (Fig. 6c, p= 0.0008,K–S test) induced too far grasping behavior (SupplementaryTable 1). The same effect also occurred slightly weaker wheninhibiting all positions (Fig. 6c, p= 0.003, K–S test, Supplemen-tary Table 1). In the “Spontaneous recovery” group, significantdifferences were found upon light stimulation at position #1 andall three positions (Fig. 6d), but targeting was already stronglyimpaired during the “light-off” situation, so that additional lightinhibition caused only mild, further perturbations.
We then counted and localized all ArchT-GFP-expressingcorticospinal-projecting neurons in the contralesional hemisphere(Fig. 7a–d). Corresponding to the higher number of midlinecrossing corticospinal fibers in the denervated cervical spinal cord
in the “Anti-Nogo/Training” animals (Fig. 4a, b), we identified asignificantly higher number of GFP-positive neurons in thecontralesional motor cortex for the “Anti-Nogo/Training” groupcompared to the “Spontaneous recovery” animals group(Fig. 7a–c, for C p< 0.05, paired t-test, with post hoc Bonferroni).
Finally, we used intracortical microstimulation (ICMS) toconfirm the localization of corticospinal neurons projecting fromthe contralesional hemisphere to the ipsilateral stroke denervatedforelimb hemi-cord. We used a 5 × 12 point stimulationgrid (positioned at +4 to −1.5 mm anterio-posterior and1.25–3.75 mm medio-lateral coordinates relative to bregma) andelectromyogram (EMG) recordings of wrist, elbow, and shouldermuscles of the impaired paw as readouts (Fig. 7e). We found adiffuse response pattern upon cortical electrical stimulation allover the contralesional pre- and primary motor cortex in animalswithout rehabilitative treatment (Fig. 7e, “Spontaneous recovery”group). In contrast, clear cortical “hot spots” in M1 and therostral forelimb field that elicited motor responses in the formerlyimpaired forelimb, in particular for wrist and elbow, weredetectable in the animals of the “Anti-Nogo/Training” group(Fig. 7e and Supplementary Fig. 6), indicating a highly localizedrepresentation of the reorganized corticospinal neurons project-ing to the ipsilateral forelimb. The M1 ipsilateral forelimb“hotspot” identified by ICMS corresponded well to the position 2(M1) of the optical implants for the silencing experimentsdescribed above. The EMG responses evoked around position 2were significantly higher in “Anti-Nogo/Training” animals than
Spontaneous recovery2.5
3.0
3.5
4.0
4.5
5.0
0
+4.0
–1.5
+3.25+1.25
Bregma Bregma 0
+4.0
–1.5
+3.25+1.25
2.5
3.0
3.5
4.0
4.5
5.0
20
40
60
0
% G
FP
+ c
ells
of N
issl
+ c
ells
in la
yer
5 se
nsor
imot
or c
orte
x *
Spontaneous recovery Anti-Nogo/ training
*
Pos. 1
Pos. 2
Pos. 3
StrokeCST
Nor
mal
ized
EM
G r
espo
nse
(mV
)
Nor
mal
ized
EM
G r
espo
nse
(mV
)Anti-Nogo/ training
a b c f
d e
Fig. 7 In animals with excellent recovery more contralesional corticospinal neurons project to the stroke denervated cervical hemi-cord and are clustered inM1 and premotor cortex. a, b Representative neurolucida reconstructions of localization and amount of corticospinal neurons in layer 5 expressing GFP,induced by the retrograde transport of AAV2.9-CamKII-Cre from the stroke denervated hemi-cord (s. Fig. 5b) in an animal of the “Spontaneous recovery”group (a) and one of the “Anti-Nogo/Training” group (b), scale bars= 2mm. c GFP-positive neurons as percent of Nissl-positive cells in layer 5 of thepremotor and motor cortex (4.2 mm± 500 µm anterior and 0.67mm± 300 µm posterior to bregma): Significant more GFP-positive cells were found inanti-Nogo animals (red) compared to animals with spontaneous recovery (gray column, p> 0.05, paired t-test, with post hoc Bonferroni). d Examples ofGFP-positive corticospinal-projecting pyramidal cells in layer 5 in the sensorimotor cortex (scale bar= 40 μm). e Intracortical microstimulation reveals “hotspots” in M1 and premotor cortex (M2) for circuits that evoke ipsilateral EMG responses from the contralesional M1 and M2 in “Anti-Nogo/Training”animals (n= 4). In contrast, in the “Spontaneous recovery” group (n= 3), only a diffuse cortical pattern for the evocation of EMG responses in the stroke-impaired forelimb was found. Heat maps of the cortical stimulation grid (60 stimulation points, 80 μA, + 4 to −1.5 mm AP and 1.25 to 3.25mm ML relativeto bregma) are shown whereby each stimulation point is color coded with the mean value of EMG response in mV (mean of EMG amplitudes in wrist,elbow, and shoulder) for the stroke-impaired forelimb. The red circles indicate the previous positions of the three optical implants. EMG responses aresignificantly pronounced in “Anti-Nogo/Training” animals at Pos. 2 compared to the “Spontaneous recovery” group (Pos. 1 p= 0.149; Pos. 2 p= 0.0013;Pos. 3 p= > 0.99, Mann–Whitney test). f Scheme: Our results suggest not only localized functional reorganization in the contralesional sensorimotorcortex, but also sprouting of midline crossing and ipsilaterally projecting CST fibers in lamina 6/7 of the stroke denervated cervical hemi-cord. Asterisksindicate significances: *p< 0.05
ARTICLE NATURE COMMUNICATIONS | DOI: 10.1038/s41467-017-01090-6
10 NATURE COMMUNICATIONS | 8: 1187 |DOI: 10.1038/s41467-017-01090-6 |www.nature.com/naturecommunications
in animals with spontaneous recovery (p< 0.05, Mann–Whitneytest). Our results suggest not only a distinct sprouting pattern ofCST fibers from the contralesional hemisphere into the ventralhorn of the denervated cervical hemi-cord, but also provide hintsfor a regionalized functional reorganization in the contralesionalM1 and M2 (Fig. 7f).
DiscussionWe showed that short periods of direct and selective optogeneticstimulation of the intact corticospinal tract result in robustrecovery of skilled forelimb functions after a large stroke, whichcompletely destroyed the ipsilesional motor cortex, in particular ifcombined with subsequent intensive rehabilitative training. Thestimulation induced corticospinal sprouting and axonal growthinto the denervated cervical hemi-cord. Surprisingly, the stimu-lated stroke animals regained close to 100% of their originalskilled forelimb movement abilities, and the kinematic analysissuggested a true recovery of the grasping behavior rather thancompensatory movements. Selective optogenetic silencing of therewired ipsilaterally projecting corticospinal fibers showed thecrucial functional role of these fibers as well as differential effectsof their cells of origin (related to reaching distance) in premotorand M1 cortices on the restored grasping function.
The role of activity as an important factor for fiber growth andneuronal rewiring after lesions is well recognized. But it hasremained unclear whether growth, growth arrest and targetinteraction, synaptogenesis, or stabilization/pruning are the mainways by which activity drives the recovery processes29–33. Instroke, existing and newly formed connections of the contralateralcortex to the denervated targets could be strengthened by long-term potentiation such as the application of tetanic stimulationtrains at 100 Hz34, 35. Here we selectively stimulated the motorcortex output neurons to the spinal cord on the intact, con-tralesional side of the brain at an early stage after the injury (d3–14) with three daily short periods of 3 × 1 min stimuli. Earlierexperimental studies stimulated the cortex electrically up to sev-eral hours daily at threshold levels18, 21. In a recent study in micewith 3 min daily stimulation of the ipsilesional motor cortex,upregulation of several neuronal growth and plasticity-promotingfactors were seen in the contralesional M18. These and the pre-sent data suggest that early brief periods of specific cortical and inparticular corticospinal stimulation after stroke increase thecapacity for reparative fiber growth and plasticity of the adultcortex. We found that optogenetic stimulation in combinationwith training robustly induces CST sprouting of pre-existingipsilaterally projecting axons as well as midline crossing CSTfibers in the denervated cervical hemi-cord. Furthermore,increased activity caused by repetitive optogenetic stimulationmay have also enhanced corticospinal neurons to sprout intoother brain regions such as the red nucleus and other brain stemareas (reticular formation, raphe nucleus) as previouslydescribed36–38. The here presented concept has direct clinicalrelevance; transcranial magnetic stimulation (TMS) and tran-scranial direct current stimulation (tDCS) are performed in strokepatients and were reported to enhance functional recovery. Insome studies, mostly short-term effects were analyzed39, butothers suggested longer or even permanent beneficial effects ofthe stimulations40–43. More detailed animal and human studiesare needed, in particular also with regard to the specific timewindows and stimulation parameters, but the fact that repetitive,brief stimulations of corticospinal neurons can greatly enhancetheir sprouting, rewiring and functional recovery is encouragingfor future stroke therapies.
We compared the effect of 2 weeks of optogenetic stimulationof the intact corticospinal tract followed by 2 weeks of intensive
grasping training to an already established rehabilitative schedulewith the same time intervals: Two weeks of Anti-Nogo immu-notherapy, promoting axonal fiber growth, followed by 2 weeks ofintensive grasping training22. The results of both these procedureswere very similar: enhanced sprouting of corticospinal fibers fromthe intact contralesional cortex, reinnervation of the denervatedcervical hemi-cord, and full restoration of impaired graspingfunction analogous to baseline levels. This equivalence supportsthe hypothesis of a growth-promoting effect induced by the sti-mulation paradigm used.
A key question in rehabilitation is whether a therapeuticintervention yields accurate restoration of lost movement patternsor only a compensatory movement strategy44. We developed anautomated, unsupervised computer vision algorithm for detailedanalysis of paw posture and kinematics during single pelletgrasping. The algorithm uses routine high-resolution videosequences; no tattoos or manual tracing of joint positions arerequired. Conventional methods include manual analysis such asthe 10-point evaluation suggested by Whishaw45, which is timeconsuming and often subjective, or kinematic analysis of graspingtrajectories46. However, pure grasping trajectories are not sensi-tive enough to detect delicate disparity of distinct aspects of thegrasping act such as supination, targeting, or paw closure22. Incontrast, our method combines a single frame analysis with asequence matching approach, meaning that each recorded imageof a grasping sequence is ranked for its temporal evolution of pawshape. Our algorithm thus enables to classify each grasp as closeror further away from previously identified typical healthygrasping sequences. Using this objective evaluation technique, wefound that precision in targeting and the typical sequence ofpostures for successful grasping movements have recovered at theend of the experimental therapies (4–5 weeks after stroke) forthose animals, which had either received direct optogenetic sti-mulation of the intact CST or Anti-Nogo immunotherapy fol-lowed by intensive grasping. This result shows a full and truerestoration of forelimb function in rats after a > 95% destructionof one sensory-motor cortex and treated with growth-promotingtherapies followed by intense rehabilitative training.
We implanted optical fibers for optogenetic stimulation locallyover the premotor cortex, the main M1 cortex and the lateralmotor and S1 cortex, and combined it with retrogradely trans-ported virus that allowed selective expression of the optogeneticsilencing construct ArchT in the rewired, ipsilaterally projectingcorticospinal neurons. We were thus able to analyze the specificfunctional role of these three cortical subregions during thegrasping. In the “Spontaneous recovery” group, pellet reachingremained severely impaired; optogenetic silencing concurrently atall positions caused a mild further impairment. Very much incontrast, the “Anti-Nogo/Training” group, which showed a fullrecovery of skilled reaching, reacted to silencing of the premotorcortex by overshooting reach movements, and by too shortreaches after silencing of M1. When silencing at all three posi-tions at the same time, animals still showed too long grasps butless significant compared to the silencing of the central M1, whichmay even suggest a more dominant role of the premotor cortexfor the targeting aspect of the grasping than for M1. Anotheraspect may be the uneven distribution of rewired corticospinal-projecting fibers with a higher cell density expressing ArchT inthe premotor and motor cortex vs. S1 (Fig. 7b), which may alsohave influenced the magnitude of the optogenetic silencing effectin the different positions (Fig. 5c) in the “Anti-Nogo/Training”group. In these functionally well recovered rats, we found “hotspots” for forelimb movements using ICMS cortical mapping insimilar positions where silencing had decreased the graspingfunction. In contrast, the positions from which ipsilateral fore-limb movements could be elicited were more diffusely distributed
NATURE COMMUNICATIONS | DOI: 10.1038/s41467-017-01090-6 ARTICLE
NATURE COMMUNICATIONS |8: 1187 |DOI: 10.1038/s41467-017-01090-6 |www.nature.com/naturecommunications 11

over M1 and M2 in animals with a lower level of recovery. Also, asignificant reduced cell density expressing ArchT had beendetected in the “Spontaneous recovery” group, which may fur-thermore contribute to the reduced effect of optogenetic silencingin those animals. Cortical motor maps as the basis of voluntarymovements have been described extensively: In particular, elec-trophysiological studies in monkeys, cats, and rodents havedetected reproducible, complex movements of the forelimbs andhindlimbs triggered from distinct positions of the motorcortex47–49: Harrison et al., e.g., demonstrated that the forelimbmotor cortex is subdivided in functional subregions for abductionand adduction movements, while others report that motor cortexsilencing in the intact rodent interferes with the initiation orperformance of trained fine motor tasks50, 51. In mice withforelimb motor cortex strokes, secondary-induced strokes in thepremotor cortex destroyed regained skilled grasping functionsuggesting an important role of M2 for the regain of lost forelimbfunction52. However, the ability of the contralesional pre- andmotor cortex to induce local circuitry of distinct aspects for finemotor function after stroke has been not revealed before. Weshow here for the first time that after an injury such as stroke anda successful rehabilitative intervention, plastic, rewired neurons,—and presumably entire microcircuits,—are found in the corre-sponding anatomical positions and are involved in specificaspects of the grasping sequence. Furthermore, this suggests thatneurons retain much of their anatomical and functional identitywhile switching their axonal projection from one side of thespinal cord to the other. Such mechanisms could explain thecommon clinical and experimental observation that task-specifictraining often achieves much higher levels of success and func-tional restitution than generalized, multitask trainingparadigms53–56.
What could be the neurobiological basis of the successfulcombination of direct, early cortical stimulation or a growth-promoting pharmacological treatment followed by intensiverehabilitative training? Both rehabilitation groups, the “Anti-Nogo/Training” and the “OptoStim/Training” combined an early,plasticity-promoting treatment approach followed by intensiverehabilitative training of the impaired paw. This sequentialcombination resulted in almost full recovery of impaired motorfunction. In addition, for both treatment groups a similarsprouting pattern of CST fibers targeting motor neuronal pools inlamina 6/7 of the ventral horn was found, suggesting at least anadditive effect of the two therapies: First the stimulation of circuitformation and reorganization followed by use-dependent selec-tion, stabilization, and strengthening of meaningful circuitry byrehabilitative training. In stroke patients, new circuit formationcan be enhanced beyond the intrinsic plastic potential of the brainby growth stimulatory therapies applied early after stroke, fol-lowed by a step of circuit selection and stabilization by intensiverehabilitative training to enable specific functional shaping of newcircuits to restore the lost motor functions. That brief bouts oftargeted cortical motoneuronal stimulation early after stroke canenhance neuronal growth and repair is a new finding which canbe translated into clinical trials using established clinical techni-ques such as TMS or tDCS.
MethodsAnimals. Subjects of this study were a total of n= 46 adult female Long-Evans rats(200–250 g, 3–4 months of age, Janvier, France), housed in groups of two to fourunder a constant 12 h dark/light cycle with food and water ad libitum. Allexperimental procedures were approved by the veterinary office of the canton ofZurich, Switzerland. They are in accordance with the Stroke Therapy AcademicIndustry Roundtable (STAIR) criteria57 for preclinical stroke investigations.
Experimental outline. The objective of this study was to induce sprouting ofcorticospinal fibers from the intact hemisphere to the denervated cervical spinal
cord and thus promote recovery of skilled motor function by distinct optogeneticstimulation of the intact corticospinal tract after a large photothrombotic stroke.Rats were first handled and training in the single pellet grasping task to determinetheir paw preference. Depending on their left or right handedness, a retrogradeAAV9-CamKII0.4.Cre.SV40 vector (Penn Vector Core, Philadelphia) was injectedin the contralateral cervical hemi-spinal cord of the preferred paw (contralateral tothe “future” denervated cervical hemi-spinal cord) followed by the injection of aCre-recombinase-dependent ChR2 vector (AAV2.1_Ef1a-DIO-hChR2(t159C)-mCherry, UNC, Chapel Hill, USA) in the ipsilateral pre- and sensorimotor cortex(in the “future” contralesional hemisphere) thus achieving the specific expressionof ChR in corticospinal-projecting neurons. Two weeks after virus injection, threeoptic fiber implants were positioned over the pre- and sensorimotor cortex, wherethe viruses had been injected. After recovery from the surgeries, the training in thesingle pellet grasping task was continued till a baseline level of at least 60% successrate in the fine motor task was achieved. All rats then received a photothromboticstroke targeting the sensorimotor cortex corresponding to their paw preference inthe grasping task (contralateral to the hemisphere of the fiber implantation). Twodays after stroke, animals were retested in the single pellet grasping task andaccording to their lesion deficit randomized in four different rehabilitation groups(Fig. 1a): In the “Spontaneous recovery” group, animals received no rehabilitativetreatment and were only assessed for regain of grasping function weekly up to4–5 weeks after stroke. The intact pre- and sensorimotor cortex of animals in the“OptoStim” group was stimulated with blue light 3×/day within the first 2 weeksafter stroke to activate the ChR-expressing corticospinal-projecting neurons.Additionally to the optical stimulation, animals in the “OptoStim/Training” groupunderwent intensive grasping training of the impaired paw during the 3rd and 4thweek after stroke. Animals in the “Delayed Training” group were also intensivelytrained in the single pellet grasping task during the 3rd and 4th week after strokebut without optical stimulation in advance. After the completion of the rehabili-tative schedules, animals performed novel tasks to assess their overall recovery ofmotor function, followed by the removal of the optical fibers and anterogradetracing of the intact pre- and sensorimotor cortex with BDA. This experimentalsetup was repeated in N= 2 independent studies with n = 8–12 rats per cohort forbehavioral and morphological analysis. As there was no statistically significantdifference in the outcome of lesions, behavior and anatomy, the data shown herewere pooled from both studies. The final behavioral and anatomical analysis wasperformed by an independent investigator who was not involved in the rehabili-tative training and testing. During the experiments for Fig. 1, rehabilitative trainingwas twice perturbed on days 15 and 16: Once by construction works and then by achange of the operational procedure of the animal facility so that the data gainedfrom days 15 and 16 after stroke were inconsistent (Fig. 2a) and thus not includedin the final analysis. This study confirms with the AARIVE guidelines (https://www.nc3rs.org.uk/arrive-guidelines).
In order to compare the efficacy of a rehabilitative scheme with directoptogenetic stimulation of the intact corticospinal tract, we applied a rehabilitativeschedule including a growth-promoting immunotherapy and rehabilitative trainingto a second cohort of animals, which has been shown to induce robust sprouting ofcorticospinal-projecting fibers from the intact motor cortex after stroke22: Allanimals were trained in single pellet grasping and were then divided in two groups:While a part of animals was sham-operated, the other animals received aphotothrombotic stroke destroying the sensorimotor cortex of the preferred paw.Two days after stroke, animals were randomly distributed in two groups: Eitheranimals received no rehabilitative intervention (“Spontaneous recovery” group) oranti-Nogo-A antibodies were applied for 2 weeks immediately after stroke followedby grasping training for another 2 weeks (Fig. 2a).
Photothrombotic stroke. A photothrombotic stroke was introduced as previouslydescribed9, 22: Animals were anesthetized with 3% isoflurane followed by anintramuscular injection of Medetomidin (30 µg/kg body weight), Midazolam(0.4 mg/kg body weight), and Fentanyl (1 µg/kg body weight). The rats wereshaved, fixed in a stereotactic frame, eye cream (Vitamin A, Braun) was appliedand the scalp was opened after disinfection (Betadine, Braun). Two minutes afteran i.v. injection of Rose Bengal into the femoral vein (Sigma, 10 mg/ml solved in0.9% NaCl solution) according to the body weight (13 mg/kg) a 10 × 5mm area(localized 5 mm to −5 mm anterior and 0.5 mm to 5.5 mm lateral to Bregma) wasexposed to a strong light source (Olympus KL 1500LCS, 150W, 3000 K) for 12 minillumination through the intact scalp. To antagonize the anesthesia Antisedan(0.15 mg/kg body weight) and Flumazenil (40 µg/kg body weight) were s.c. injected.For postoperative care, all animals received analgesics (Dafalgan Sirup, Braun, peros in the drinking water) and antibiotics (Baytril, 5 mg/kg body weight, Bayer, s.c.)for at least 3 days after surgery.
Optogenetics. We used a Cre-dependent approach to specifically express ChR2 inthe corticospinal tract requiring two surgeries: For the first surgery, animals wereanesthetized as mentioned previously for the stroke lesion and a minimal invasivelaminectomy at spinal level C5–C6 was performed. A total of 11 × 120 nl of theretrograde AAV9-CamKII0.4.Cre.SV40 vector (Penn Vector Core, Philadelphia)was injected in the cervical hemi-spinal cord (Fig. 1b), contralaterally to the futuredenervated hemi-spinal cord due to the stroke. The 11 injections took place 0.7 mmlateral to the midline using a 35-gage, 10 µl syringe (Hamilton, BGB Analytik)
ARTICLE NATURE COMMUNICATIONS | DOI: 10.1038/s41467-017-01090-6
12 NATURE COMMUNICATIONS | 8: 1187 |DOI: 10.1038/s41467-017-01090-6 |www.nature.com/naturecommunications

driven by an electric pump (World Precision Instruments) with a flow rate of6 nl/s. Each injection was made in 2 steps of 60 nl and 2 different depths (0.9 and1.2 mm below the spinal cord surface to target the corticospinal tract and lamina 7motor neuron pools) keeping the syringe in place for 3 min between steps.One–two days after laminectomy, a craniotomy was performed exposing the futurecontralesional pre- and sensorimotor cortex: 12 injections (200 nl each) of a Cre-recombinase-dependent ChR2 vector (AAV2.1-Ef1a-DIO-hChR2(t159C)-mCherry, UNC, Chapel Hill, USA) were made through the intact dura using a 33-gage, 10 µl syringe (World Precision instruments) with a flow rate of 6 nl/s con-trolled by an electrical pump (World Precision instruments). The followinginjection coordinates were used: 2 mm anterior to bregma (AP), 3 mm lateral tobregma (ML); 2.5 AP, 3.5 ML; 1.5 AP, 3.5 ML; 1.5 AP, 2.5 ML; 2.5 AP, 2.5 ML; 3.5AP, 2.0 ML; 3.5 AP, 2.5 ML; 4.5 AP, 2.5 ML; 4.5 AP, 1.5 ML; 2.0 AP, 1.5 ML; 2.0AP, 1.5 ML; 4.0 AP, 0.15 ML. At each position, the needle was lowered to 1.5 mmdepth and retracted to 1.2 mm again to leave a pocket for the volume injected. Theneedle was left in place for 1 min before 300 nl were administered. On injectioncompletion, the cannula was left to rest for another 2 min before full retraction toensure proper diffusion of the dispatched virus. The craniotomy was covered withKwik-Cast (World precision instruments) and the scalp was sutured till reopeningfor the implantation of the optical fibers.
Custom-made optic glass fibers (multimode fibers, 0.48 NA, High OH, Ø1000 µm Core, Thorlabs) glued into stainless steel sleeves with two-componentepoxy resin glue and sanded (Silicon Carbid Lapping Sheet, 1, 3, and 5 um grit,Thorlabs) were used as the medium for light conductance. Only implants with aconductance above 70% were included (mean conductance of the used implantswas 73± 4%) as measured by a power meter (473 nm, Thorlabs). For implantationof these optical fibers, animals were anesthetized as previously described for thephotothrombotic stroke and a single subcutaneous injection of mannitol (20%,17 mg/ml, B. Braun) was applied to reduce swelling of the cortex. Soft tissue wasremoved from the skull, iBond (Heraeus) was deposited and four screws wereinserted around the craniotomy for the fixation of the optical implants. The threeoptical implants were positioned on the surface of the pre- and sensorimotor cortexaccording to the following coordinates: Optical implant #1 + 4.0 mm anterior tobregma (AP), +2.0 mm lateral to bregma (ML); optical implant #2 + 2.5 AP,+1.5 ML; optical implant #3 + 1.5 AP, +2.5 ML, external angle 0.9° (Fig. 5d andSupplementary Fig. 2). A thin layer of transparent silicon (Kwik-Sil, WorldPrecision Instruments) covered the surface around the implants. All implants werefixed to the skull via the screws using light hardened dental cement (TetricEvoFlow, Ivoclar vivadent). The scalp was then sutured and glued to the cementedbasis with 3M VetbondTM (3M Animal Care Products, USA). Baytril (5 mg/kgbody weight, Bayer) was subcutaneously applied for the first 3 days after strokefollowed by per os administration up to 1–2 weeks after surgery (190 µl/250 mldrinking water).
For optical stimulation of the intact corticospinal tract, three blue LEDs(473 nm, Thorlabs) were adjusted to provide the same output on full input strength(output difference of less than 2% (64± 1 mW/mm2) as measured by a powermeter (473 nm, Thorlabs)). For the illumination during the stimulation therapy,the output at the tip of each individual optical implant was adjusted to 16.6 mW/mm2. Animals in the “OptoStim” group and “OptoStim/Training” group receivedoptical stimulation of the intact corticospinal tract 3×/day from day 3 to day 14after stroke. Each stimulation session consisted of 3 × 1-min stimulation with10 Hz, 20 ms pulses. Between the 1-min stimulation phases were 3-min restingphases as previously described8. The pulses were synchronized over all LEDs andthus could irradiate the cortex through all three implants simultaneously. For thestimulation, animals were put in a Plexiglas box where the optic fibers (Ø 1mm),connected with ceramic sleeves (Thorlabs) to the optical implants were supportedby a freely moving arm above the box designed to reduce the weight of the fiberswhile allowing the animals to move relatively unhindered.
Rehabilitative training and testing. All animals included were trained in thesingle pellet grasping task5, 22 to assess fine motor control of the forelimb. Animalswere placed in a Plexiglas box (34 × 14 cm) with two openings on opposite endsand were trained to grasp pellets (45-mg dustless precision pellets, TSE SystemsIntl. Group). Grasping performance was scored as follows22: a grasp was classifiedof being successful (scored as “1”) if the animal correctly targeted a newly presentedpellet with its preferred paw, retrieved it and brought it directly to its mouth. Ascore of 1 was also given if the animal required several attempts to grasp the pellet,without retracting the paw through the window and into the box, which wasdefined as the end of an attempt. A score of 0.5 was given if—after a successfulgrasp—the pellet was dropped inside the box. If the animal knocked the pellet offthe shelf, the trial was scored as 0. The success rate was calculated as the percentageof retrieved pellets of the number of all trials. Animals were trained 3–4 weeks forbaseline recordings before stroke. Only animals with a 60% or higher success rate atbaseline were included in the study presented here. During testing sessions, animalswere given 20 pellets within a maximum time of 10 min. During rehabilitativetraining sessions, animals grasped at least 100 pellets/day. All animals were assessedat baseline as well as 2 days, 7 days, and until 4–5 weeks after stroke for skilledforelimb function in the single pellet grasping task. All sessions were filmed(Panasonic HDC-SD800 High Definition Camcorder, 50 frames/s) for furtheranalysis of grasping kinematics. The researchers responsible of the development of
the computer code for the behavior analysis were blinded to all behavior experi-ments presented in this study.
Computer vision algorithms for posture analysis and analysis of graspingkinematics. We aimed at developing a non-invasive approach for analyzing motorfunction that does not interfere with the recovery process of the animal in order tomonitor the progress of therapeutic treatment and to identify the optimal treat-ment protocol. Therefore, we here present an automatic, purely visual analysisbased on video recordings of the grasping animals. A detailed investigation of notonly the spatial trajectory of a grasp, but also of paw posture and its change duringgrasping then revealed even subtle differences between impaired and healthy motorfunction. Therefore, we needed to first detect and track fast moving paws underadverse lighting conditions (considering the speed of the paw, light is very dim soas not to irritate the rats) and reflections of the surrounding cage. Second, pawposture had to be represented in a robust manner. Third, a sequence matchingapproach was employed to model the characteristic changes of posture duringgrasping.
To focus our analysis on paw motor function, we first extracted a large set ofcandidate foreground regions. Following Wright et al., we decomposed videoframes into a low-rank background model and a sparse vector corresponding toforeground pixels. Candidate regions xi 2 X are then randomly sampled from theestimated foreground of a set of sample videos to initialize the subsequent learningof classifiers and compute their HOG features (size 10 × 10)58. We also investigatedfeatures learned using a convolutional neural network approach59. However, due tothe limited amount of training samples, standard HOG features yielded betterperformance and interpretable results. K-nearest neighbors density estimation thenreveals rare outliers, which are removed from X .
Max-projection of randomized exemplar classifiers: For paw detection andposture comparison, a set of exemplar classifiers were required, which detected pawconfigurations, that were similar to a set of prototypical ones60. To measure thesimilarity to a sampled region xi, we trained a discriminative exemplar classifier wi,with xi as positive example. Since X is likely to contain other samples similar to xi,this set could not be used as negatives since too much overlap with the singlepositive exemplar would have corrupted learning. Instead of training a singleclassifier, we thus trained an ensemble of K randomized exemplar classifiers wk
with offsets bki ; k 2 1; ¼ ;Kf g, using randomly selected negative sets X ki � Xnxi;
minwki ;b
ki
wki
��
��2 þ C max 0; 1 wk
i ; xi� �� bki
� �þ C
Xki
��
��
XXkij j
j¼1
max 0; 1þ wki ; xj
� �þ bki� �
:
Cross-validation yielded a soft margin C= 0.01. To compensate for theunreliability of individual classifiers, they were aggregated using a max-projectionwhich chose for each feature dimension the most confident classifierwi :¼ maxk wk
i . The scores of these max-projected wi were then calibrated by alogistic regression60.
Codebook of prototypical paw classifiers: Based on the large initial candidate setX (size 1000), we then created a dictionary D � X as a canonically representationof paw postures of previously unseen rats. The randomized exemplar classifiersprovided a robust measure of pair-wise similaritys xi; xj� �
:¼ 12 wi; xj� �þ wj; xi
� �� �
. Duplicate candidates were merged usingnormalized cuts (Shi and Malik 1997) to obtain a dictionary D (size 100), whichwas sufficiently diverse and rich for a non-parametric representation of all pawpostures. In a new video, all classifiers wi from dictionary D were applied densely.We averaged the scores of the top scoring k classifiers and took the location withthe highest score to obtain the final paw detection and its trajectories over time.
Non-parametric description of paw posture: On new paw detections x,the activation pattern of all wif gi2D gave rise to an embeddinge :¼ ½hw1; xi; ¼ ; hwjDj; xi�. Moreover, novel paw configurations could now becompared using their embedding vectors, since similar samples yielded similarclassifier activations. In Fig. 3, left column, we visualized paw postures by mappingthe high-dimensional embedding to a low-dimensional projection using the t-SNEmethod26.
Spatiotemporal parsing: While paw posture was informative, its deformationduring a grasp was even more characteristic. Modeling not only the graspingbehavior of healthy specimen, but also the diverse abnormal patterns afterimpairment rendered prior models on posture and kinematics infeasible, as theywould impose a bias toward healthy configurations. We represented a M framelong grasp j as a sequence in the embedding space Sj :¼ ½ej1; ¼ ; ejM �. Measuring thesimilarity of grasps based on their embeddings depended on a sequence matchingsince they were not temporally aligned. We thus searched for a mapping π :f1; ¼ ;Mg7!f0; 1; ¼ ;M′g; which aligned Sj of length M with Sj′ of length M′ (0were outliers). We then defined their distance in the embedding space as dðSj; Sj0 Þ :¼ PM
i¼1 jeji � ej0
π ið Þj: A matching π(•) should avoid outliers and changes of thetemporal order,
minπ
XM
i¼1
eji � ej′π ið Þ���
���þ λ
XM�1
i¼1
1 π ið Þ>π iþ 1ð Þð Þ; s:t: π ið Þ � ij j � B; 8i;
where 1ð�Þ was the identity function. The constraint in this equation preventedmatched frames to from being more than B frames apart from another. The second
NATURE COMMUNICATIONS | DOI: 10.1038/s41467-017-01090-6 ARTICLE
NATURE COMMUNICATIONS |8: 1187 |DOI: 10.1038/s41467-017-01090-6 |www.nature.com/naturecommunications 13

sum allowed for more flexible matching than in standard string matching ordynamic time warping. The sequence matching problem was then solved usinginteger linear programming and IBM ILOG CPLEX. As it would becomputationally prohibitive to match all sequences against another, we eliminatedredundancies by constructing a dictionary Dseq :¼ S1; ¼ ; SQf g of canonicalgrasping sequences, which then explained novel grasps yielding a spatiotemporalparsing. Measuring the distances of a new sequence S′ to all prototypical ones inDseq produced the sequence-level embedding F′ :¼ d S′; S1ð Þ; ¼ ; d S′; SQð Þ½ �; afteraligning grasps with our sequence matching. Grasps are then compared using theEuclidean distance in this sequence embedding space. In Fig. 2c, we illustrate thesimilarity of grasping trials to baseline and 2d sequences per cohort using thepreviously described approach. We furthermore utilize the sequence-levelembedding for evaluating the initial learning of the skilled reaching task.Supplementary Fig. 3 illustrates the learning behavior of rodents and demonstratesthe high sensitivity of our algorithm, which even detects small improvements/changes in grasping during the first days of training.
Novel tasks. After the completion of the rehabilitative schedules (4 weeks afterstroke), animals were exposed to novel tasks of forelimb sensorimotor function andoverall locomotion such as the horizontal ladder test61 and the narrow beam task62
in order to determine their non-task-specific recovery levels of forelimb function.The irregular horizontal ladder crossing was performed as described recently22:
On three consecutive days, three runs per animal were recorded (Panasonic HDC-SD800 High Definition Camcorder) and analyzed frame by frame (VideoReDo TVSuite, H 264, Drd Systems Inc.). The success rate was calculated by dividing theamount of correct steps by the number of total steps taken with the respective paw×100 in the three test runs.
For the narrow beam task, rats were placed at one end of a wooden 145 cm long,elevated beam with a basis of 5 cm width narrowing down at the end tip to a widthof 1 cm with 28 equal segments of 5 cm. While the animals were crossing the beam,two investigators on both sides of the beam detected at which segment a slip of oneof the extremities down from the plane surface of the beam would first occur. Thesuccess rate was calculated by dividing the segments noted for the first slip by thetotal amount of segments (×/28) × 100. For each day of assessment four differenttrials were scored and averaged per day. For both, the horizontal ladder and thenarrow beam task animals were tested on 3 consecutive days and the success ratesare given as mean of the three testing days.
Anterograde tracing of the intact corticospinal tract (CST). Six weeks afterstroke, after the completion of the behavioral training and testing, the intactcontralesional motor cortex of animals in all five rehabilitation groups (“OptoStim/Training” n= 4, “OptoStim” n = 3, “Spontaneous recovery” n= 4, “DelayedTraining” n= 4, “Anti-Nogo/Training” n= 6) was traced anterogradely with Bio-tinylated Dextran Amine (BDA, 10,000 molecular weight, 10% solution in 0.01 MPBS, Invitrogen) as previously described22. Before the tracing, the optical fiberimplants had to be removed to expose the contralesional motor cortex again. Atthis step, we excluded animals from further analysis if we found signs of inflam-mation or the removal of the cemented optical implants caused bleeding. Twelveinjections (200 nl each) of BDA were made as described above for the expression ofthe ChR2 vector (AAV2.1_Ef1a-DIO-hChR2(t159C)-mCherry) using the samecoordinates. Three weeks after BDA injections animals were anesthetized (pento-barbital, 450 mg/kg body weight i.p., Abbott Laboratories) and perfused transcar-dially with 100 ml Ringer solution (containing 100,000 IU/l heparin (Roche) and0.25% NaNO2) followed by 300 ml of a 4% phosphate-buffered paraformaldehydesolution, pH 7.4. Brains and spinal cords were dissolved and cryoprotected in aphosphate-buffered 30% sucrose solution for cryostat sectioning in 40 µm thicksections before being stained by on-slide processing using the nickel-enhancedDAB (3,3′-diaminobenzidine) protocol (Vectastain ABC Elite Kit, VectorLaboratories; 1:100 in Tris-buffered saline plus TritonTM X-100).
CST fiber growth in response to stroke was evaluated at spinal cord levelsC3–Th1 as previously described22: Fibers crossing the spinal cord midline werecounted at ×20 magnification and branching of these fibers was evaluated at fourdefined distances from the midline in the gray matter using a virtual grid (D1–D4),with each line 125 μm apart22. Ventral CST fibers were counted at the transition ofthe white matter forming the anterior median fissure and the gray matter of theventral horn. A virtual line was aligned with the center of the central canal. Aroundthis point, the line was rotated and aligned with the boundary between gray andwhite matter. Fibers crossing this line were counted as ventral CST fibersinnervating the gray matter9.
To correct for variations in BDA labeling, data were normalized to the numberof BDA-labeled axons in the intact CST for each animal (CST axons: counted infive rectangular areas (4000 μm2) and extrapolated to the total area of the CST(0.1144 mm2± 0.01)/slice in two sections at spinal cord level C3 and C6). Resultsare expressed as newly outsprouting fibers divided by the number of labeled fibersin the intact CST/slice for each animal.
Histological analysis of stroke volume. For analysis of stroke volume, animalswere transcardially perfused and rat brains were fixed and cryoprotected asdescribed in the section above. Brains were cut coronally on a cryostat in 40 μmsections and collected on slides (SuperFrost®) as described previously22. Frozen
sections were dried at room temperature, rehydrated and immersed in 0.5% cresylviolet (2 min) for Nissl staining. After washing in water, we dehydrated the sectionsin graded alcohols, cleared in xylene, and cover-slipped with Eukit® mountingmedium. The lesion volume of all four rehabilitation groups was evaluated by 3Dreconstruction of every 20th brain section, using Neurolucida 8.0 (MicroBright-Field). The lesion volume of each section was determined by contouring thedestroyed tissue and taking also into account the symmetry of stroke-dependenttissue loss in relation to the volume of the intact contralesional hemisphere. Thestroke lesion location was determined using the coordinates of the Rat Brain Atlasby Paxinos and Watson (Ref. 63 and Supplementary Fig. 1).
Histological verification of ChR2-expressing neurons. Coronal cortex sections(40 µm slice thickness) were examined for the distribution of mCherry-positiveneurons with anti-mCherry amplification immunohistochemistry: Immediatelyafter cryo-sectioning, slices were blocked in Tris-NaCl-blocking buffer and 0.1%Triton (TNB, TBST) for 30 min at room temperature and incubated over night at4 °C in TNB, TBST, and the primary antibody mCherry (1:1000; Abcam, Lucer-nachem). After washing with 0.1 M phosphate buffer, the biotinylated goat anti-ratimmunoglobulin-G (Ig G) (1:300; Jackson IR) secondary antibody in PBS wasapplied for 1 h at room temperature. The sections were washed in PBS andincubated in Streptavidin C3 (1:1000; Jackson IR) and fluorescent Nissl 500/525(Neurotrace Green Fluorescent Nissl Stain, Invitrogen) in TNB for 1 h. Slices werewashed and rinsed with 0.05 M Tris-buffer for the final step. Images were acquiredwith a confocal microscope (TCS SP2 AOBS, Leica) with respective red (Cy3) andgreen (488) excitation or emission filters at ×20 magnification. Images were takenin a sequential mode either for acquisition of mCherry- or Nissl-positive cells. Thepercentage of mCherry-positive cells of Nissl-positive cells in layer 5 of the primarymotor cortex (4.2 mm± 300 µm anterior and 0.67 mm ± 300 µm posterior tobregma, Fig. 1), premotor cortex (4.68 mm µm anterior to bregma) and primarysensory cortex (0.12 mm± 300 µm anterior to bregma) was counted in five sectionsper animal and averaged per animal and group.
Anti-Nogo immunotherapy. To compare the effect of specific optical stimulationof the intact corticospinal tract to induce fiber sprouting in the cervical spinal cord,a group of animals (n= 9) received the growth-promoting anti-Nogoimmunotherapy9, 22. For constant delivery of the function blocking Ig G1 mousemonoclonal anti-Nogo-A antibody 11C7 (3 or 4.2 mg/ml, Novartis) against an 18amino acid Nogo-A peptide corresponding to the rat sequence amino acids623–64064 a fine intrathecal catheter (32 gage) was placed after stroke surgery inthe subarachnoid space at lumbar level L2 after laminectomy and connected to anosmotic minipump (Alzet 2ML2; 5 µl/h, 3.1 µg/µl). For postoperative care, allanimals received analgesics (Rimadyl, 2.5 mg/kg body weight, Pfeizer) and anti-biotics (Baytril, 5 mg/kg body weight, Bayer) for 3 days as well as a single sub-cutaneous injection of mannitol (20%, 17 mg/ml, B. Braun) to reduce swelling ofthe cortex. Two weeks after stroke, pumps and catheters were removed.
Optogenetic inhibition of newly outsprouting fibers of the intact corticospinaltract. For optogenetic inhibition of newly outsprouting corticospinal-projectingfibers from the intact hemisphere, we applied a Cre-dependent approach: Aftercompletion of either 2 weeks of anti-Nogo immunotherapy followed by training(“Anti-Nogo/Training” group) or spontaneous recovery (“Spontaneous recovery”group) we injected 11 × 120 nl of the retrograde AAV9-CamKII0.4.Cre.SV40 vector(Penn Vector Core, Philadelphia) in the denervated cervical hemi-spinal cord(Fig. 5b) at spinal cord level C5–C6 as described above (“Expression of ChR2 in theintact corticospinal tract”). One–two days later, the Cre-dependent AAV2.1-Flex-ArchT-GFP (UNC GTC Vector Core, the University of North Carolina at ChapelHill) was injected in the contralesional pre- and sensorimotor cortex according tothe coordinates (“Expression of ChR2 in the intact corticospinal tract”, Fig. 1b). Upto 7 days after virus injection, animals were implanted with three custom-madeoptic glass fibers at the same positions as described above (“Expression of ChR2 inthe intact corticospinal tract”) enabling inhibition at three distinct positions(position 1: pre- and rostral motor cortex; position 2: motor cortex; position 3:motor cortex with small parts of the primary sensory cortex). Sham-operatedanimals (n = 3) just received optical fiber implantation without virus injections toconfirm that light stimulation and the fibers connecting the optical implants to thelasers did not influence grasping behavior.
Optogenetic inhibition during a single pellet grasping task. Animals were given2 weeks of recovery from virus injection and fiber implantation surgeries and werethen retrained and retested in the single pellet grasping task (Fig. 5a). For opticalinhibition of distinct subsets of newly sprouting corticospinal fibers during thegrasping task, animals were put in a Plexiglas box (section “Rehabilitative trainingand testing”) with their optical implants connected via ceramtic mating sleeves to1 m long optical fibers (Ø400 µm Core, 0.39 NA, Thorlabs) and three lasers(532 nm) above the grasping box, enabling optical inhibition at each opticalimplant location independently. The three laser output strengths were adjusted toprovide an output difference less than 2% (42.6± 1.7 mW/mm2). For the opticalinhibition, the output strength was adapted to 20 mW/mm2 for each individuallaser using optical density filters. The initiation of the three lasers was regulated by
ARTICLE NATURE COMMUNICATIONS | DOI: 10.1038/s41467-017-01090-6
14 NATURE COMMUNICATIONS | 8: 1187 |DOI: 10.1038/s41467-017-01090-6 |www.nature.com/naturecommunications

a light barrier positioned at the center of the provided food pellet so that by the firstgrasp through the light barrier a program (LabVIEW, National Instruments) wasstarted which kept the lasers off for 100 s and turned them on afterwards for 100 swhile the animal continuously grasped for pellets. After another lag time of 100 swith laser lights off the next grasp would initiate the second phase of laser lightactivation. We used continuous laser light stimulation for the ArchT activation,which has been shown to cause no apoptosis when lasers (532 nm) were turned onfor even 3–5 min65. We only stimulated at either one position (position 1 vs.position 2 vs. position 3, Fig. 5c) or at all three positions at the same time duringone grasping session. The light barrier controlled the light-off and -on phases atthis position for several times as long as the animal continued with grasping forpellets. For the next session, we then randomly changed to stimulating at anotherposition in order to avoid inhibiting the same area over several days of graspingbehavior and thus inducing structural and plastic changes. The effect of opticallyinhibiting at a distinct position (1–3) or at all three positions on grasping successwas measured for each animal and each position during at least three independentgrasping sessions. Results are presented as mean success rates of all grasping ses-sions without light (“light-off phase”) and for the optogenetic inhibition of a dis-tinct position (“light-on phase”) in absolute levels as well as relative success rates ofthe “light-on phases” in dependence of the success rates in the “light-off phases”.
For the detailed kinematic and posture analysis of the grasping behavior under“light-off” and “light-on” conditions, we utilized the previously described detectionand tracking of paws for a grasping trajectory analysis as well as the spatiotemporalparsing of grasping sequences for a detailed posture analysis that discovers evenfine-grained differences between healthy and impaired motor function (please referto “Computer vision algorithms for posture analysis and analysis of graspingkinematics”).
Histological verification of ArchT-expressing neurons. Coronal cortical sections(40 µm slice thickness) were examined for the distribution of EGFP-positiveneurons with anti-GFP immunohistochemistry similar to the one described above(section “Histological verification of ChR2-expressing neurons”) except that for theprimary antibody the primary antibody green fluorescent protein (GFP) (ratmonoclonal antibody, 1:1000; Nacalai) was used as well as the fluorescent Nissl640/660 (1:500; Neurotrace Invitrogen) in TNB for the Nissl staining. Analysis ofGFP-positive cells in relation to Nissl-positive cells was undertaken as above (seesection “Histological verification of ChR2 expressing neurons”). To localize thelocation of clusters of neurons expressing GFP 3D reconstructions of every 20thbrain section was performed for a representative brain of each group (“Anti-Nogo/Training” and “Spontaneous recovery”) using Neurolucida 8.0 (MicroBrightField).
Intracortical microstimulation. For intracortical microstimulation, “Anti-Nogo/Training” (n = 4) and “Spontaneous recovery” animals (n= 3) were anesthetizedwith a subcutaneous mixture of ketamine (50 mg/ml, 7 mg/kg body weight, StreuliPharma) and xylazine (20 mg/ml, 5 mg/kg body weight, Streuli Pharma) plus asingle injection of mannitol (20%, 17 ml/kg, B. Braun). The forelimbs were shavedfor better visibility of muscles and the rat was mounted in a stereotactic frame66.The optical implants were removed exposing the entire pre- and sensorimotorcortex (5 mm to −2 mm AP, 4 mm lateral relative to bregma). Using bregma as alandmark, electrode penetrations were made perpendicular to the pial surface(depth 1.3 mm) tracing an rectangular exploration grid of 5 × 12 stimulation pointslocalized from 4mm to −1.5 mm AP and 1.25 to 3.25 mm ML relative to bregmawith a distance of 500 µm for each stimulation point. Forty-five-millisecond trainsof 0.2 ms biphasic pulses at 333 Hz9, 22 with a current of 80 µA (insuring a stableresponse, ref. 20) were delivered through a glass isolated platinum/tungsten sti-mulation electrode with an impedance of 0.5–1MΩ (Thomas Recording). We usedEMG recordings from the (ipsilateral) impaired forelimb (M. extensor digitorumfor wrist, M. biceps and triceps for elbow, M. trapezius for shoulder) as readouts.The EMG signal was amplified, filtered, digitized, and visualized via PowerLab(AD instruments). The EMG data were subsequently transferred to Matlab and themaximum of the EMG-amplitude was detected at each stimulation point and for alljoints. For each animal, we calculated the sum of the maximal amplitudes of allthree joints for each stimulation point (SumAmpl=maxAmplwirst + maxAmplelbow+ maxAmplshoulder). Heat maps were generated by calculating the median ofSumAmpl for the animals of a group (“Anti-Nogo/Training” and “Spontaneousrecovery” group) for each stimulation point representing median EMG responsesof a group at a distinct location of cortical stimulation relative to bregma.
Statistical analysis. For statistical analysis, GraphPad Prism (GraphPadSoftware Inc.: Version 6.1) was used. All data are expressed as mean ± s.e.m. Forcomparing the behavioral and anatomical reorganization of the rehabilitationgroups, a two-way ANOVA followed by Bonferroni’s post hoc test was used. In allthese experiments, differences between the rehabilitation groups or conditions(“light-off” vs. “light-on”) were significant for the chosen size of the cohort, thusjustifying samples size. Whenever two treatments were compared at one timepoint, Students t-test (paired, two-tailed) was used after checking both distributionsof being Gaussian. To test for statistical significance in our kinematic analysis, aK–S test was used. The level of significance was set at *p < 0.05, **p< 0.01, and***p < 0.001.
Code availability. The computer code describing the computational method of ourbehavior analysis is available at https://github.com/CompVis/AutomaticBehaviorAnalysis_NatureComm.
Data availability. The authors declare that the data supporting the findings of thisstudy are available within the paper and its Supplementary Information files.The computer code and data together with a documentation describing thecomputational method of our behavior analysis as Supplementary Material areuploaded to github and are available at https://github.com/CompVis/AutomaticBehaviorAnalysis_NatureComm.
Received: 28 September 2016 Accepted: 17 August 2017
References1. Ward, N. S., Brown, M. M., Thompson, A. J. & Frackowiak, R. S. Neural
correlates of outcome after stroke: a cross-sectional fMRI study. Brain 126,1430–1448 (2003).
2. Carmichael, S. T. Plasticity of cortical projections after stroke. Neuroscientist 9,64–75 (2003).
3. Winship, I. R. & Murphy, T. H. In vivo calcium imaging reveals functionalrewiring of single somatosensory neurons after stroke. J. Neurosci. 28,6592–6606 (2008).
4. Murphy, T. H. & Corbett, D. Plasticity during stroke recovery: from synapse tobehaviour. Nat. Rev. Neurosci. 10, 861–872 (2009).
5. Starkey, M. L. et al. Back seat driving: hindlimb corticospinal neurons assumeforelimb control following ischaemic stroke. Brain 135, 3265–3281 (2012).
6. Weidner, N., Ner, A., Salimi, N. & Tuszynski, M. H. Spontaneous corticospinalaxonal plasticity and functional recovery after adult central nervous systeminjury. Proc. Natl Acad. Sci. USA 98, 3513–3518 (2001).
7. Hilton, B. J. et al. Re-establishment of cortical motor output maps andspontaneous functional recovery via spared dorsolaterally projectingcorticospinal neurons after dorsal column spinal cord injury in adult mice.J. Neurosci. 36, 4080–4092 (2016).
8. Cheng, M. Y. et al. Optogenetic neuronal stimulation promotes functionalrecovery after stroke. Proc. Natl Acad. Sci. USA 111, 12913–12918 (2014).
9. Lindau, N. T. et al. Rewiring of the corticospinal tract in the adult rat afterunilateral stroke and anti-Nogo-A therapy. Brain 137, 739–756 (2014).
10. Floel, A. & Cohen, L. G. Recovery of function in humans: cortical stimulationand pharmacological treatments after stroke. Neurobiol. Dis. 37, 243–251(2010).
11. Taub, E., Uswatte, G. & Elbert, T. New treatments in neurorehabilitationfounded on basic research. Nat. Rev. Neurosci. 3, 228–236 (2002).
12. Quandt, F. & Hummel, F. C. The influence of functional electrical stimulationon hand motor recovery in stroke patients: a review. Exp. Transl. Stroke Med. 6,9 (2014).
13. Lotze, M. et al. The role of multiple contralesional motor areas for complexhand movements after internal capsular lesion. J. Neurosci. 26, 6096–6102(2006).
14. Kim, S. Y. & Jones, T. A. Lesion size-dependent synaptic and astrocyticresponses in cortex contralateral to infarcts in middle-aged rats. Synapse 64,659–671 (2010).
15. Rehme, A. K., Eickhoff, S. B., Rottschy, C., Fink, G. R. & Grefkes, C. Activationlikelihood estimation meta-analysis of motor-related neural activity after stroke.Neuroimage 59, 2771–2782 (2012).
16. Nowak, D. A. et al. Effects of low-frequency repetitive transcranial magneticstimulation of the contralesional primary motor cortex on movementkinematics and neural activity in subcortical stroke. Arch. Neurol. 65, 741–747(2008).
17. Rehme, A. K., Fink, G. R., von Cramon, D. Y. & Grefkes, C. The role of thecontralesional motor cortex for motor recovery in the early days after strokeassessed with longitudinal FMRI. Cereb. Cortex 21, 756–768 (2011).
18. Carmel, J. B., Kimura, H. & Martin, J. H. Electrical stimulation of motor cortexin the uninjured hemisphere after chronic unilateral injury promotes recoveryof skilled locomotion through ipsilateral control. J. Neurosci. 34, 462–466(2014).
19. Carmel, J. B., Kimura, H., Berrol, L. J. & Martin, J. H. Motor cortex electricalstimulation promotes axon outgrowth to brain stem and spinal targets thatcontrol the forelimb impaired by unilateral corticospinal injury. Eur. J.Neurosci. 37, 1090–1102 (2013).
20. Brus-Ramer, M., Carmel, J. B., Chakrabarty, S. & Martin, J. H. Electricalstimulation of spared corticospinal axons augments connections with ipsilateralspinal motor circuits after injury. J. Neurosci. 27, 13793–13801 (2007).
21. Carmel, J. B., Berrol, L. J., Brus-Ramer, M. & Martin, J. H. Chronic electricalstimulation of the intact corticospinal system after unilateral injury restores
NATURE COMMUNICATIONS | DOI: 10.1038/s41467-017-01090-6 ARTICLE
NATURE COMMUNICATIONS |8: 1187 |DOI: 10.1038/s41467-017-01090-6 |www.nature.com/naturecommunications 15

skilled locomotor control and promotes spinal axon outgrowth. J. Neurosci. 30,10918–10926 (2010).
22. Wahl, A. S. et al. Neuronal repair. Asynchronous therapy restores motorcontrol by rewiring of the rat corticospinal tract after stroke. Science 344,1250–1255 (2014).
23. Jin, D. et al. Restoration of skilled locomotion by sprouting corticospinal axonsinduced by co-deletion of PTEN and SOCS3. Nat. Commun. 6, 8074 (2015).
24. Ishida, A. et al. Causal link between the cortico-rubral pathway and functionalrecovery through forced impaired limb use in rats with stroke. J. Neurosci. 36,455–467 (2016).
25. Metz, G. A. & Whishaw, I. Q. Skilled reaching an action pattern: stability in rat(Rattus norvegicus) grasping movements as a function of changing food pelletsize. Behav. Brain Res. 116, 111–122 (2000).
26. Van der Maaten, L. & Hinton, G. Visualizing data using t-sne. J. Mach. Learn.Res. 9, 2579–2605 (2008).
27. Carmel, J. B. & Martin, J. H. Motor cortex electrical stimulation augmentssprouting of the corticospinal tract and promotes recovery of motor function.Front. Integr. Neurosci. 8, 51 (2014).
28. Chow, B. Y. et al. High-performance genetically targetable optical neuralsilencing by light-driven proton pumps. Nature 463, 98–102 (2010).
29. Ming, G., Henley, J., Tessier-Lavigne, M., Song, H. & Poo, M. Electrical activitymodulates growth cone guidance by diffusible factors. Neuron 29, 441–452(2001).
30. Brown, C. E., Li, P., Boyd, J. D., Delaney, K. R. & Murphy, T. H. Extensiveturnover of dendritic spines and vascular remodeling in cortical tissuesrecovering from stroke. J. Neurosci. 27, 4101–4109 (2007).
31. Carmichael, S. T. & Chesselet, M. F. Synchronous neuronal activity is a signalfor axonal sprouting after cortical lesions in the adult. J. Neurosci. 22,6062–6070 (2002).
32. Napieralski, J. A., Butler, A. K. & Chesselet, M. F. Anatomical and functionalevidence for lesion-specific sprouting of corticostriatal input in the adult rat.J. Comp. Neurol. 373, 484–497 (1996).
33. Wong, R. O. & Ghosh, A. Activity-dependent regulation of dendritic growthand patterning. Nat. Rev. Neurosci. 3, 803–812 (2002).
34. Hess, G. & Donoghue, J. P. Long-term potentiation of horizontal connectionsprovides a mechanism to reorganize cortical motor maps. J. Neurophysiol. 71,2543–2547 (1994).
35. Yang, S. N., Tang, Y. G. & Zucker, R. S. Selective induction of LTP and LTD bypostsynaptic [Ca2+]i elevation. J. Neurophysiol. 81, 781–787 (1999).
36. Mosberger, A. C. et al. Axotomized corticospinal neurons increase supra-lesional innervation and remain crucial for skilled reaching after bilateralpyramidotomy. Cereb. Cortex doi:10.1093/cercor/bhw405 (2017).
37. Bachmann, L. C., Lindau, N. T., Felder, P. & Schwab, M. E. Sprouting ofbrainstem-spinal tracts in response to unilateral motor cortex stroke in mice.J. Neurosci. 34, 3378–3389 (2014).
38. Zorner, B. et al. Chasing central nervous system plasticity: the brainstem”scontribution to locomotor recovery in rats with spinal cord injury. Brain 137,1716–1732 (2014).
39. Reis, J. et al. Consensus: can transcranial direct current stimulation andtranscranial magnetic stimulation enhance motor learning and memoryformation? Brain Stimul. 1, 363–369 (2008).
40. Nitsche, M. A. & Paulus, W. Sustained excitability elevations induced by transcranialDC motor cortex stimulation in humans. Neurology 57, 1899–1901 (2001).
41. Peinemann, A. et al. Long-lasting increase in corticospinal excitability after1800 pulses of subthreshold 5 Hz repetitive TMS to the primary motor cortex.Clin. Neurophysiol. 115, 1519–1526 (2004).
42. Quartarone, A. et al. Distinct changes in cortical and spinal excitabilityfollowing high-frequency repetitive TMS to the human motor cortex. Exp.Brain Res. 161, 114–124 (2005).
43. Grefkes, C. et al. Modulating cortical connectivity in stroke patients by rTMSassessed with fMRI and dynamic causal modeling. Neuroimage 50, 233–242(2010).
44. Krakauer, J. W., Carmichael, S. T., Corbett, D. & Wittenberg, G. F. Gettingneurorehabilitation right: what can be learned from animal models?Neurorehabil. Neural. Repair. 26, 923–931 (2012).
45. Whishaw, I. Q., Whishaw, P. & Gorny, B. The structure of skilled forelimbreaching in the rat: a movement rating scale. J. Vis. Exp. doi:10.3791/816 (2008).
46. Azim, E., Jiang, J., Alstermark, B. & Jessell, T. M. Skilled reaching relies on aV2a propriospinal internal copy circuit. Nature 508, 357–363 (2014).
47. Dombeck, D. A., Graziano, M. S. & Tank, D. W. Functional clustering ofneurons in motor cortex determined by cellular resolution imaging in awakebehaving mice. J. Neurosci. 29, 13751–13760 (2009).
48. Graziano, M. S. New insights into motor cortex. Neuron 71, 387–388 (2011).49. Harrison, T. C., Ayling, O. G. & Murphy, T. H. Distinct cortical circuit
mechanisms for complex forelimb movement and motor map topography.Neuron 74, 397–409 (2012).
50. Guo, J. Z. et al. Cortex commands the performance of skilled movement. Elife 4,e10774 (2015).
51. Otchy, T. M. et al. Acute off-target effects of neural circuit manipulations.Nature 528, 358–363 (2015).
52. Zeiler, S. R. et al. Medial premotor cortex shows a reduction in inhibitorymarkers and mediates recovery in a mouse model of focal stroke. Stroke 44,483–489 (2013).
53. Krakauer, J. W. Motor learning: its relevance to stroke recovery andneurorehabilitation. Curr. Opin. Neurol. 19, 84–90 (2006).
54. Dobkin, B. H. Training and exercise to drive poststroke recovery. Nat. Clin.Pract. Neurol. 4, 76–85 (2008).
55. Garcia-Alias, G., Barkhuysen, S., Buckle, M. & Fawcett, J. W. ChondroitinaseABC treatment opens a window of opportunity for task-specific rehabilitation.Nat. Neurosci. 12, 1145–1151 (2009).
56. group, A. T. C. et al. Efficacy and safety of very early mobilisation within 24 hof stroke onset (AVERT): a randomised controlled trial. Lancet 386, 46–55(2015).
57. (STAIR), S. T. A. I. R. Recommendations for standards regarding preclinicalneuroprotective and restorative drug development. Stroke 30, 2752–2758 (1999).
58. Dalal, N., Triggs, B. in International Conference on Computer Vision andPattern Recognition (CVPR). (IEEE, 2005).
59. Krizhevsky, A., Sutskever, I., & Hinton, G. E. in International Conference onNeural information processing systems (NIPS). (Curran Associates, Inc., 2012).
60. Eigenstetter, A., Takami, M., Ommer, B. in International Conference onComputer Vision and Pattern Recognition (CVPR). 3590–3597. (IEEE, 2014).
61. Maier, I. C. et al. Constraint-induced movement therapy in the adult rat afterunilateral corticospinal tract injury. J. Neurosci. 28, 9386–9403 (2008).
62. Allbutt, H. N. & Henderson, J. M. Use of the narrow beam test in the rat,6-hydroxydopamine model of Parkinson”s disease. J. Neurosci. Methods 159,195–202 (2007).
63. Paxinos, G. W. C. The Rat Brain In Stereotactic Coordinates, 5th edn (ElsevierAcademic Press, 2005).
64. Oertle, T. et al. Nogo-A inhibits neurite outgrowth and cell spreading withthree discrete regions. J. Neurosci. 23, 5393–5406 (2003).
65. Miao, C. et al. Hippocampal remapping after partial inactivation of the medialentorhinal cortex. Neuron 88, 590–603 (2015).
66. Emerick, A. J., Neafsey, E. J., Schwab, M. E. & Kartje, G. L. Functionalreorganization of the motor cortex in adult rats after cortical lesion andtreatment with monoclonal antibody IN-1. J. Neurosci. 23, 4826–4830 (2003).
AcknowledgementsWe thank Dr Yaroslav Sych and Martin Wieckhorst for technical advice and fruitfuldiscussions as well as Anni Nagy for support with illustrations.
Author contributionsA.S.W. and M.E.S. designed the study. A.S.W. and A.B. carried out the experiments.A.S.W., U.B., B.B., and B.O. performed data analysis and developed computer andmachine learning algorithm tools for data evaluation. S.M., H.K., and F.H. developed andprovided technical tools. B.V.I. performed pump implantations. A.S.W, B.O., and M.E.S.prepared figures and wrote the manuscript.
Additional informationSupplementary Information accompanies this paper at doi:10.1038/s41467-017-01090-6.
Competing interests: The University of Zurich holds joint patents with Novartis Pharmafor antibodies against Nogo-A and their use in neurological diseases. M.E.S. is a boardmember of the spin-off company NovaGo Therapeutics Inc. The remaining authorsdeclare no competing financial interests.
Reprints and permission information is available online at http://npg.nature.com/reprintsandpermissions/
Publisher's note: Springer Nature remains neutral with regard to jurisdictional claims inpublished maps and institutional affiliations.
Open Access This article is licensed under a Creative CommonsAttribution 4.0 International License, which permits use, sharing,
adaptation, distribution and reproduction in any medium or format, as long as you giveappropriate credit to the original author(s) and the source, provide a link to the CreativeCommons license, and indicate if changes were made. The images or other third partymaterial in this article are included in the article’s Creative Commons license, unlessindicated otherwise in a credit line to the material. If material is not included in thearticle’s Creative Commons license and your intended use is not permitted by statutoryregulation or exceeds the permitted use, you will need to obtain permission directly fromthe copyright holder. To view a copy of this license, visit http://creativecommons.org/licenses/by/4.0/.
© The Author(s) 2017
ARTICLE NATURE COMMUNICATIONS | DOI: 10.1038/s41467-017-01090-6
16 NATURE COMMUNICATIONS | 8: 1187 |DOI: 10.1038/s41467-017-01090-6 |www.nature.com/naturecommunications
Related Documents