Options for Supply Management in Canada with Trade Liberalization CATPRN Commissioned Paper CP 2007-04 June 2007 Richard Barichello Associate Professor Faculty of Land and Food Systems University of British Columbia, Vancouver, BC John Cranfield Associate Professor Dept. of Food, Agricultural and Resource Economics University of Guelph, Guelph, ON Karl Meilke Professor Dept. of Food, Agricultural and Resource Economics University of Guelph, Guelph, ON http://www.catrade.org Financial support for this paper was provided by the Canadian Agricultural Trade Policy Research Network, the North American Agrifood Market Integration Consortium and the Ontario Ministry of Food, Agriculture and Rural Affairs. The views expressed in this chapter are those of the authors and should not be attributed to the funding agencies.

Welcome message from author
This document is posted to help you gain knowledge. Please leave a comment to let me know what you think about it! Share it to your friends and learn new things together.
Transcript
Options for Supply Management in Canada with Trade Liberalization
CATPRN Commissioned Paper CP 2007-04
June 2007
Richard Barichello Associate Professor
Faculty of Land and Food Systems University of British Columbia, Vancouver, BC
John Cranfield
Associate Professor Dept. of Food, Agricultural and Resource Economics
University of Guelph, Guelph, ON
Karl Meilke
Professor Dept. of Food, Agricultural and Resource Economics
University of Guelph, Guelph, ON
http://www.catrade.org
Financial support for this paper was provided by the Canadian Agricultural Trade Policy Research Network, the North American Agrifood Market Integration Consortium and the Ontario Ministry of Food, Agriculture and Rural Affairs. The views expressed in this chapter are those of the authors and should not be attributed to the funding agencies.
Abstract Following the Uruguay Round of trade negotiations Canada replaced its import quotas on sensitive products with tariff rate quotas. The over-quota tariffs on those products operating under domestic supply management schemes (dairy and poultry products) ranged from a low of 155 percent on turkey to a high of 299 percent on butter. These tariffs have effectively blocked over quota imports and are likely to continue to prevent imports, under most market conditions, given the likely range of tariff cuts proposed for sensitive products following a successful completion of the Doha Round. However, it’s argued that tariff cuts in the post-Doha Round will severely limit Canada’s ability to restrict imports and it is important to use the next 15 years to better position the supply managed industries to compete at that time. The paper reviews a number of reform options that could be pursued ranging from a full buy-out of current marketing quotas, the introduction of two types of marketing quota, to providing partial compensation of short-term income losses. The advantages and disadvantages of each option are discussed with respect to their costs and impacts on income and asset values.
Keywords: Canada, trade liberalization, supply management
1
INTRODUCTION
Supply management has been an important feature of Canadian agriculture for nearly four decades. National supply management was introduced for milk in 1972, eggs in 1973, turkey in 1974, chicken in 1978, and hatching eggs in the 1980s. Provincial marketing boards for dairy products predated the national plans by more than a decade. The birth of the marketing boards was a response to declining prices, disarray in marketing arrangements, and, in the case of the poultry boards, the threat of vertical integration. The production and marketing arrangements for each of the supply managed commodities differ and can be quite complex (Barichello 2003). However, they have three key features in common: 1) prices are determined by a cost of production formula that includes imputed costs for farmer supplied labor and a return to equity and management; 2) production is limited to what the domestic market will consume at the cost-determined price; and 3) border measures are used to keep out less expensive foreign products.
Until the formation of the WTO in 1995, Canada used GATT-legal import quotas to sharply limit the quantity of foreign dairy, poultry, and egg products entering the Canadian market, including some further processed products. During the Uruguay Round, Canada “tariffied” its import quotas by converting them to tariff rate quotas (TRQs). Some additional market access was provided to exporters through the TRQs, but the over-quota tariffs, ranging from 155 to 299 percent, were high enough to prohibit imports above the minimum access amounts.
In 2004, the supply managed commodities accounted for 20.4 percent (C$7.4 billion) of farm cash receipts (C$36.5 billion), about the same fraction of gross returns as in the early 1970s, even as the number of farms declined by about 80 percent. However, the production of supply managed commodities is unevenly distributed across Canada. Most importantly, the supply managed commodities account for 35.7 percent of Quebec’s farm cash receipts, largely as a result of the concentration of milk production in this province. As a result of this, reform of the supply managed industries has significant regional implications.
During the Uruguay Round of trade negotiations, Canada was one of the strongest supporters of allowing countries that used supply management to retain the right to control imports using import quotas. However, the industry’s fear of tariffication was unfounded as the TRQs that replaced the import quota regime have been effective in keeping out imports. As a result, it has been business as usual for the supply managed industries since 1995.1 Although the Uruguay Round Agreement had little immediate impact, it did lay the groundwork for future trade liberalization efforts being pursued under the Doha Development Agenda (DDA) that began in 2001. Although the status of the DDA is currently unclear the broad outline of a potential agreement is starting to 1 In fact, the conversion to tariff rate quotas has allowed Canada to become a significant exporter of poultry products. A short-lived attempt to export dairy products under innovative pricing schemes was judged to provide export subsides above Canada’s commitment levels by a WTO panel.
2
take shape and it is clear that it will have some implications for Canada’s supply managed commodities (Gifford; Rude and Meilke; WTO 2004, 2005, 2006b, 2007).2
The Issues
The DDA represents the ninth round of multilateral trade negotiations since 1947. Over time, the negotiations have become broader (e.g., including trade in services and intellectual property), more complex, more inclusive (the WTO now has 150 members), and have taken longer to conclude. Canada has been at the table for each round and has generally argued for a more open, rules-based trading system. The DDA is no exception, and Canada’s negotiating positions are those befitting one of the world’s most trade dependent nations. However, in agriculture, Canada’s negotiating position has to tread the fine line between the 80 percent of Canadian agriculture that is export-oriented and the 20 percent of agriculture that is supply managed.
Since the beginning of the DDA, the position of the supply managed industries has been that over-quota tariffs should be maintained at current levels and that any increase in minimum access commitments should be minimal. The government carried this view to the Hong Kong Ministerial meeting in December 2005 and along with the G-10 ensured that no decisions were made with respect to the treatment of sensitive products. The WTO Draft Ministerial Declaration coming out of Hong Kong stated, “We recognize the need to agree on treatment of sensitive products, taking into account all of the elements involved” (WTO 2005, p.2). In Chairman Falconer’s April 2007 “communication” it is obvious that the treatment of sensitive products remains a sticking point in the negotiations (WTO, 2007). However, there is general consensus that in return for lower tariff cuts countries will have to provide additional market access through TRQ expansion for sensitive products. The current impasse is largely on the number of tariff lines eligible for sensitive product treatment and the trade-off between tariff cuts and TRQ expansion.
Although the exact magnitudes of the trade policy changes that will be required by the DDA are unknown, we believe that the adjustments that will be required of Canada’s supply managed industries will be small enough that they can be accommodated with limited changes in their current operations, as discussed in a subsequent section. Before discussing these adjustments, it is important to note that the DDA will set the rules for international trade in agrifood products for at least the next 15 years.3 In our view, the most important question facing the industry and the government following the conclusion of the DDA is whether the current supply managed system should be realigned only to be consistent with the new trade rules or if more fundamental changes should be undertaken to better position the industry in 2022 and beyond. There are strong arguments for doing something more than just tweaking the current system.
2 This chapter describes the state of the negotiations as of May 2007. 3 The 15-year time horizon is calculated by assuming a DDA Agreement will be implemented in 2009, that the implementation period will last six years, and that the next Round of negotiations will begin in 2016 with its results being implemented in 2022.
3
While the DDA reductions in over-quota tariffs will likely protect the domestic market from low cost imports under most market conditions, they almost certainly will constrain future consumer-financed domestic price increases, especially in the dairy sector. If no action is taken to reform the supply managed industries, significant over-quota tariff cuts beginning in 2022 could result in sharp decreases in domestic prices – declines that would be difficult to accommodate in a short time frame. However, if realignment of the industry began now, with a 15-year window for adjustment, the fear of falling off a cliff in 2022 can be greatly reduced. Hence, in the remainder of the paper, we will attempt to illustrate the kind of changes the DDA may require while focusing primarily on a number of options for adjustment that we believe would leave the industry better positioned to compete in 2022 and into the future. While we fully understand that the mere suggestion that supply managed industries will have to change the way they do business is politically dangerous, we believe that analysis provided now can contribute to the policy debate suggested by Gifford.
If the industry agrees that fundamental changes to the supply managed system are desirable following the DDA, then it is reasonable for governments to consider providing adjustment assistance. In the third section of this chapter, we discuss a number of different ways the supply managed sectors could be reformed and the types of assistance that could be provided. In each case, we highlight the strengths and weaknesses of the various approaches. We are not proponents for any one of the suggested approaches, but feel the identification of options is an important activity to undertake in advance.
In evaluating each of the policy options, it is important to keep in mind two distinct but closely related issues: 1) the effect on incomes earned in the supply managed sectors; and 2) the effect on the wealth (net worth) of current producers in the supply managed sectors.
Current Situation
One pillar of supply management is a “made in Canada” price that is judged to provide a fair return to producers. This goal is accomplished by restricting the quantity of product that can be marketed to the quantity consumed at the predetermined price. However, because production is restricted to less than the quantity producers want to supply at the administered price, the “right-to-produce” takes on a value. In the early days of supply management, attempts were made to hide the value of marketing quota by only allowing “ownership” to transfer with the sale of the physical facilities where the production was occurring; or to employ quota transfer police to try and enforce the rule that marketing quota had no value. Of course, all these rules did was turn law abiding farmers into white collar criminals. Fortunately, these rules no longer exist and marketing quota is freely bought and sold as a capital good, although restrictions still exist on the rental of production quota and on its ownership by non-farmers.
Statistics Canada estimates that the aggregate value of production quota in 1981 was C$4.4 billion or 3.5 percent of th e total non-quota assets (C$125.9 billion) owned by
4
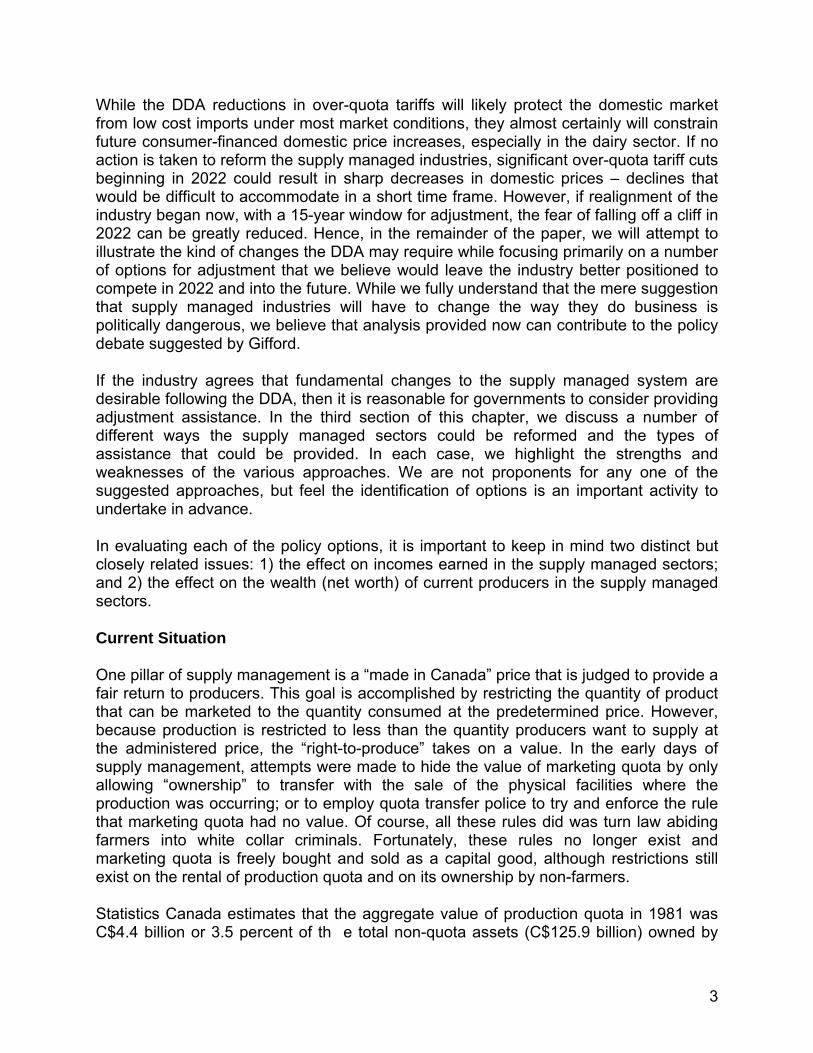
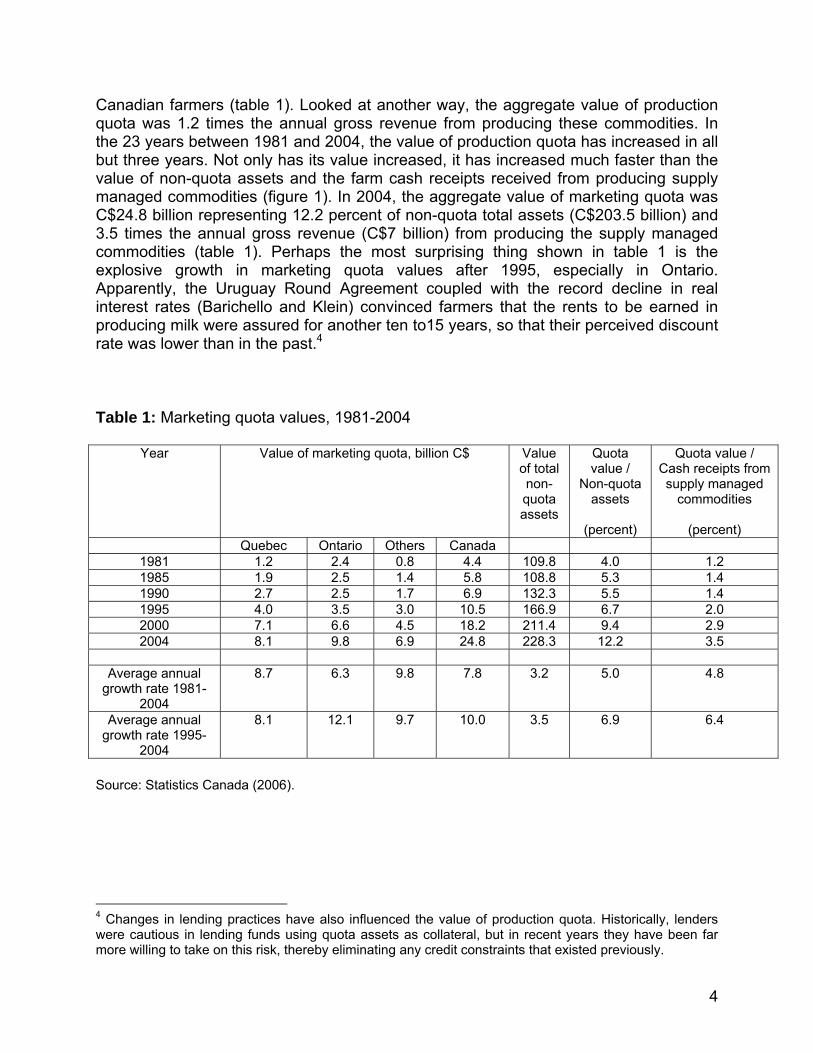
Canadian farmers (table 1). Looked at another way, the aggregate value of production quota was 1.2 times the annual gross revenue from producing these commodities. In the 23 years between 1981 and 2004, the value of production quota has increased in all but three years. Not only has its value increased, it has increased much faster than the value of non-quota assets and the farm cash receipts received from producing supply managed commodities (figure 1). In 2004, the aggregate value of marketing quota was C$24.8 billion representing 12.2 percent of non-quota total assets (C$203.5 billion) and 3.5 times the annual gross revenue (C$7 billion) from producing the supply managed commodities (table 1). Perhaps the most surprising thing shown in table 1 is the explosive growth in marketing quota values after 1995, especially in Ontario. Apparently, the Uruguay Round Agreement coupled with the record decline in real interest rates (Barichello and Klein) convinced farmers that the rents to be earned in producing milk were assured for another ten to15 years, so that their perceived discount rate was lower than in the past.4
Table 1: Marketing quota values, 1981-2004
Year Value of marketing quota, billion C$ Value of total non-quota assets
Quota value /
Non-quota assets
(percent)
Quota value / Cash receipts from supply managed
commodities
(percent) Quebec Ontario Others Canada
1981 1.2 2.4 0.8 4.4 109.8 4.0 1.2 1985 1.9 2.5 1.4 5.8 108.8 5.3 1.4 1990 2.7 2.5 1.7 6.9 132.3 5.5 1.4 1995 4.0 3.5 3.0 10.5 166.9 6.7 2.0 2000 7.1 6.6 4.5 18.2 211.4 9.4 2.9 2004 8.1 9.8 6.9 24.8 228.3 12.2 3.5
Average annual
growth rate 1981-2004
8.7 6.3 9.8 7.8 3.2 5.0 4.8
Average annual growth rate 1995-
2004
8.1 12.1 9.7 10.0 3.5 6.9 6.4
Source: Statistics Canada (2006).
4 Changes in lending practices have also influenced the value of production quota. Historically, lenders were cautious in lending funds using quota assets as collateral, but in recent years they have been far more willing to take on this risk, thereby eliminating any credit constraints that existed previously.
5
This can be seen more explicitly in an equation describing the valuation of marketing quota (Barichello 1996):
PQ = R (1- d)/(r + d - g).
Where PQ = the capital value of the marketing quota,
R = the annual net return of the quota, or its rental value,
r = the interest rate,
g = the growth rate in annual net returns, or in the capital value of the marketing quota, and
d = the default risk, or the probability of a default in the government program that would cause the value of R to go to zero.
This model can explain how a bank’s increased willingness to lend at some point in time can raise the price of quota because this is equivalent to supplying credit at a lower interest rate than would otherwise be offered,. Likewise, a province offering an interest rate subsidy would lead to increased quota prices within that province. A farmer or group of farmers who were more optimistic about the path of future returns would be expecting a higher value of the growth rate, g, also raising the price they would be willing to pay for quota. Similarly, farmers who feel confident that the government will defend and maintain the current policy against trade policy threats, perceive a lower value of the risk factor, d, and would be willing to pay more for quota.
In using this model to explain the unusually rapid growth in quota values, it is important to note that there has also been some growth in the rental value (R) resulting from steady increases in milk prices, a generalized decline in unit costs, and the shift to larger farms in an environment where economies of scale often exist. However, the three terms in the denominator are likely where the more substantial changes can be found over this time period through declines in both the real interest rate and the level of default risk, and an increase in expected capital gains. These three changes have worked in concert to significantly reduce the size of the denominator, thereby increasing the value of quota, PQ. In more recent years, it is also likely that the growth in the quota price has been sustained by expectations of government compensation in the event of policy-induced quota value losses.
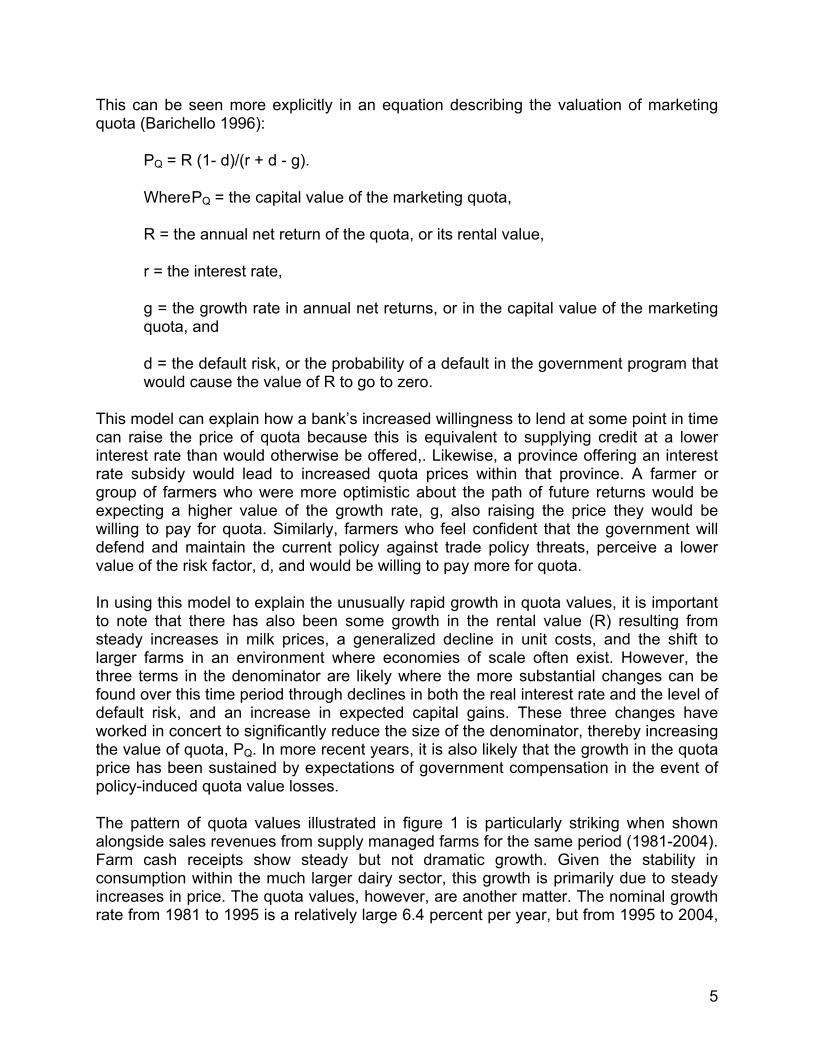
The pattern of quota values illustrated in figure 1 is particularly striking when shown alongside sales revenues from supply managed farms for the same period (1981-2004). Farm cash receipts show steady but not dramatic growth. Given the stability in consumption within the much larger dairy sector, this growth is primarily due to steady increases in price. The quota values, however, are another matter. The nominal growth rate from 1981 to 1995 is a relatively large 6.4 percent per year, but from 1995 to 2004,
6
the nominal growth rate jumps to ten percent per year or annual growth of 8.1 percent in real terms.
Figure 1. Marketing Quota Values and Cash Receipts from Supply Managed Commodities, 1981-2004
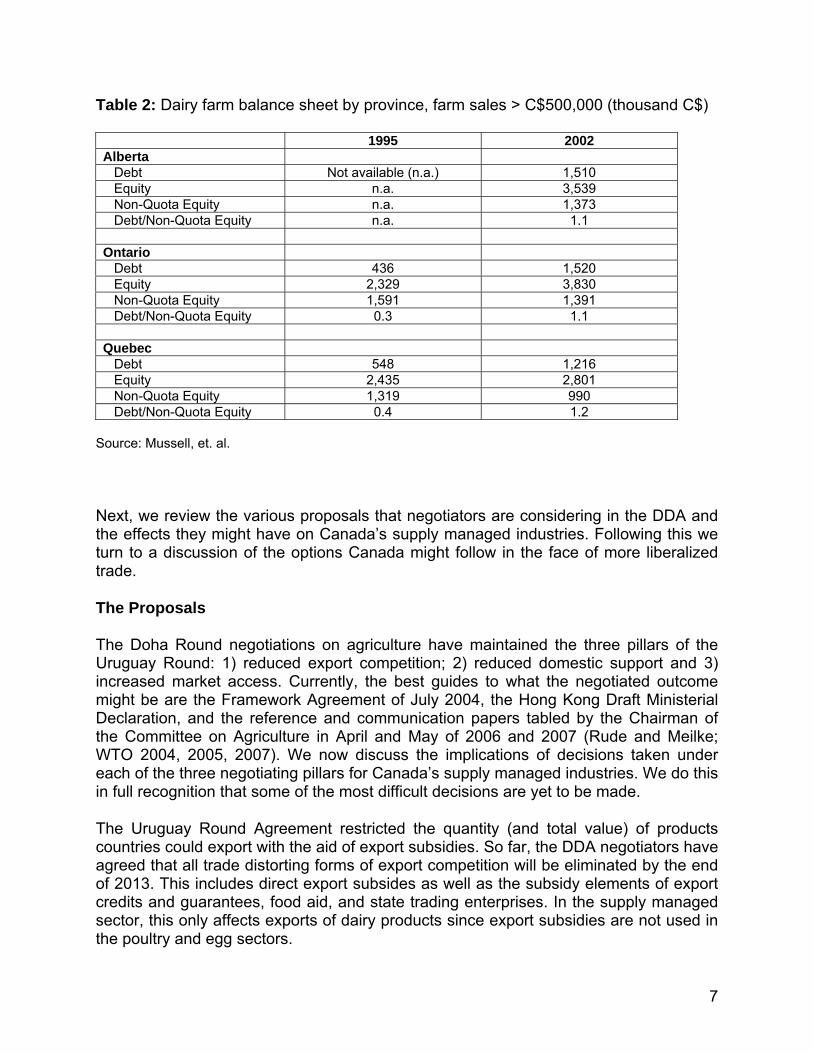
Source: Statistics Canada (2004, 2006). The nearly C$25 billion in quota value represents a significant fraction of the wealth of producers of supply managed commodities, but also a significant cost of being in a position to produce these commodities, such as would be faced by a new entrant. For example, an Ontario milk producer with enough marketing quota to cover 100 cows has C$2.5 million invested in that quota. Any policy change that reduces the per unit price of quota, or reduces the quantity of marketing quota available is going to be opposed by producers of supply managed commodities. In addition, any change in border measures is almost certain to result in calls for compensation for any loss in marketing quota value. A related aspect is the division of this increased capital value into equity and debt. With such large increases in quota value, it is not surprising that equity levels have also grown, particularly since 1995 and for larger farms (sales greater than C$500,000). However, debt levels have grown even faster, more than doubling over the period for which data are available, from 1995-2002 (table 2). In 2002, for these larger farms, the ratio of farm debt to non-quota equity exceeds one for Alberta, Ontario, and Quebec (1.1, 1.1, and 1.2, respectively).
0
5
10
15
20
25
30
1981 1982 1983 1984 1985 1986 1987 1988 1989 1990 1991 1992 1993 1994 1995 1996 1997 1998 1999 2000 2001 2002 2003 2004 year
billion C$
value of quota
farm cash receipts of quota commodities
7
Table 2: Dairy farm balance sheet by province, farm sales > C$500,000 (thousand C$) 1995 2002 Alberta Debt Not available (n.a.) 1,510 Equity n.a. 3,539 Non-Quota Equity n.a. 1,373 Debt/Non-Quota Equity n.a. 1.1 Ontario Debt 436 1,520 Equity 2,329 3,830 Non-Quota Equity 1,591 1,391 Debt/Non-Quota Equity 0.3 1.1 Quebec Debt 548 1,216 Equity 2,435 2,801 Non-Quota Equity 1,319 990 Debt/Non-Quota Equity 0.4 1.2
Source: Mussell, et. al.
Next, we review the various proposals that negotiators are considering in the DDA and the effects they might have on Canada’s supply managed industries. Following this we turn to a discussion of the options Canada might follow in the face of more liberalized trade.
The Proposals
The Doha Round negotiations on agriculture have maintained the three pillars of the Uruguay Round: 1) reduced export competition; 2) reduced domestic support and 3) increased market access. Currently, the best guides to what the negotiated outcome might be are the Framework Agreement of July 2004, the Hong Kong Draft Ministerial Declaration, and the reference and communication papers tabled by the Chairman of the Committee on Agriculture in April and May of 2006 and 2007 (Rude and Meilke; WTO 2004, 2005, 2007). We now discuss the implications of decisions taken under each of the three negotiating pillars for Canada’s supply managed industries. We do this in full recognition that some of the most difficult decisions are yet to be made.
The Uruguay Round Agreement restricted the quantity (and total value) of products countries could export with the aid of export subsidies. So far, the DDA negotiators have agreed that all trade distorting forms of export competition will be eliminated by the end of 2013. This includes direct export subsides as well as the subsidy elements of export credits and guarantees, food aid, and state trading enterprises. In the supply managed sector, this only affects exports of dairy products since export subsidies are not used in the poultry and egg sectors.
8
In recent years Canada’s subsidized butter exports have involved trivial quantities (less than 1,000 mt). SMP subsidized exports were averaging near the commitment level until 2003/04 and 2004/05 when they fell to about one-quarter of the commitment level (44,953 mt). Even at the recently lower levels subsidized SMP exports represent a huge fraction of domestic consumption but the actual quantities involved are not massive – although to get rid of this much SMP domestically would require that it be sold as animal feed or new nontraditional uses would have to be found. Subsidized cheese exports have declined markedly, from 20,422 mt in 1999/2000 to 6,631 mt in 2004/05 compared to a commitment level of 9,076 mt. Eliminating subsidized exports of butter will not be a problem for Canada and current levels of cheese exports are only about 0.5 percent of domestic consumption. Subsidized exports of other milk products reached 90,076 mt in 2002/03 but declined to 16,021 mt in 2004/05. The exact magnitude of this trade, relative to domestic consumption is difficult to judge, given the available data.
The DDA negotiations will significantly tighten the disciplines on domestic support. Brink provides a detailed analysis of the proposed domestic support measures and we will only review the elements most crucial to the supply managed commodities. Canada’s Uruguay Round final bound aggregate measurement of support (AMS) is C$4.3 billion and its most recent notification, for 2002, was C$3.45 billion. In addition, Canada notified C$380.0 million in product specific support that falls under the de minimis provisions of the Uruguay Round Agreement on Agriculture.5 We believe that the DDA will sharply reduce Canada’s bound AMS (a 50-60 percent cut would seem in the ballpark), and will reduce the de minimis exemptions by around 50 percent. In addition, we feel that the DDA will require a cut in Overall Trade Distorting Support defined as the sum of: 1) the total AMS; 2) product specific de minimis; 3) nonproduct specific de minimis; and 4) blue box support. Brink predicts that Canada’s 2014 ceiling on Overall Trade Distorting Support, assuming a 70 percent cut under the DDA, will equal C$2.8 billion.
However, from the viewpoint of the supply managed dairy sector, the introduction of caps on commodity specific AMS would have the most immediate impact. There is no AMS calculated for poultry or egg products because they do not have government determined prices. Administered prices are offered for butter and skim milk powder and these two commodities accounted for 11.2 percent (C$387.7 million) of Canada’s total AMS in 2002. A cap on product specific support will change the cost of production-based, open-ended pricing system currently used in the milk market and is likely to result in the elimination of formal administered prices; instead dairy farmers, through their representatives, will negotiate prices with milk processors, as has often been the case in the poultry sector. This alone will likely keep milk prices from rising as rapidly as in the past.
5 Under the de minimis provisions of the Agreement on Agriculture, members are not required to make reductions to trade-distorting domestic support in any year in which the aggregate value of the product specific support does not exceed five percent of the total value of production of the agricultural product in question. In addition, nonproduct specific support which is less than five percent of the value of total agricultural production is also exempt from reduction commitments (WTO, 2006a)
9
A major goal of any trade negotiation is to create new market access for low cost suppliers. In the DDA, the market access negotiations are where progress has been the most difficult. Still, the broad outline of a potential agreement can be discerned (WTO, 2007). Currently, access to the Canadian market for the supply managed commodities is controlled through the use of TRQs. Assuming that Canada’s supply managed commodities are notified as “sensitive” its TRQs will be expanded. In evaluating the impact of TRQ expansion on the domestic market there are two key questions: what is the fill rate for current TRQs and by how much will they be expanded. Fill rates (the proportion of in-quota access that is actually used) in the dairy sector are essentially 100 percent and for chicken and chicken products significantly larger than the WTO minimum access commitment. This is a result of the larger global import quotas Canada negotiated as a part of the Canada-United States Free Trade Agreement (CUSTA). Fill rates for turkey and eggs are well above 90 percent, hence any new market access created through enlarged TRQs is likely to be used. Minimum access commitments in the DDA may be expressed as a percentage of some recent level of domestic consumption, although there is considerable disagreement on the exact form these commitments should take. Data on domestic consumption is not available in as much detail as are imports but current minimum commitment levels for butter and cheese represent 3.7 and 5.5 percent of 2002-2004 average consumption, respectively, while access for other dairy products range from 0.2 percent for ice cream and yogurt to over 20 percent for buttermilk powder and dry whey. The WTO minimum access commitment for chicken is 4.2 percent but actual imports under the CUSTA are nearly twice as large.
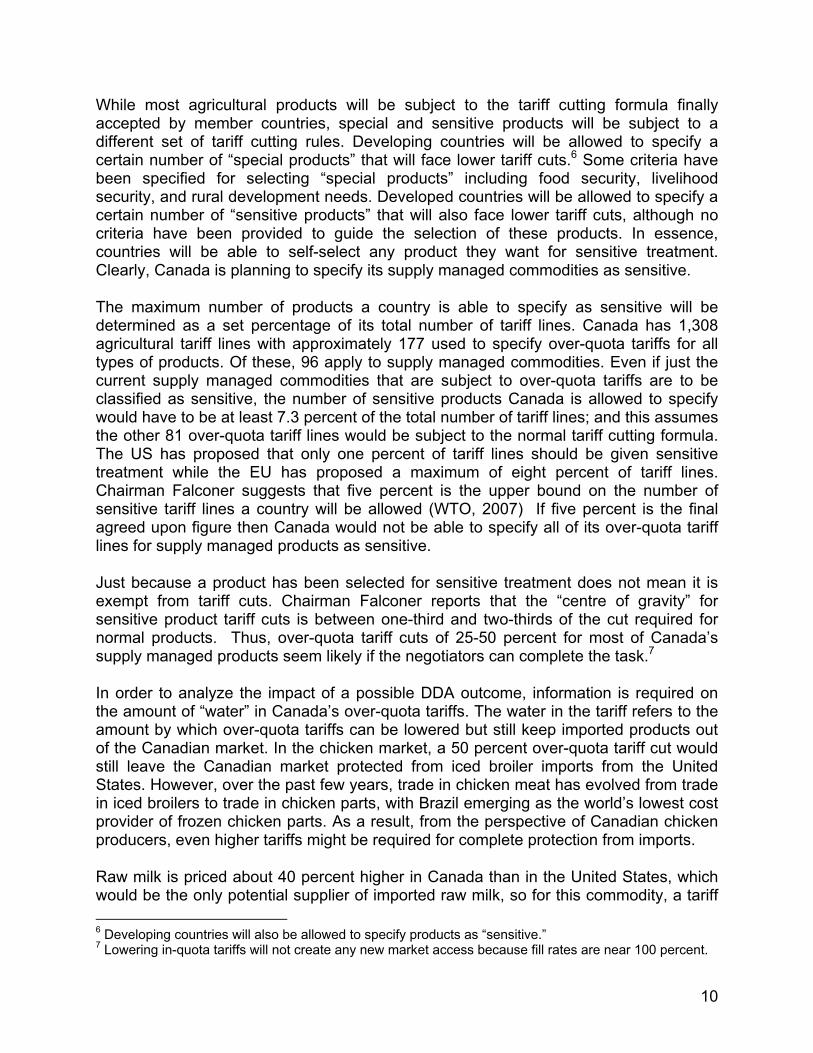
Tariff reduction commitments in the DDA will involve three different types of products: 1) normal products; 2) special products; and 3) sensitive products. Normal products will be subject to tariff cuts according to a tiered formula with four bands for developed countries and the thresholds for those bands will be the ones proposed by the G-20 (WTO, 2007). The G-20 proposal suggests developed countries achieve a formula cut averaging at least 54 percent and a cut of 75 percent in the top band (table 3). Chairman Falconer suggests that the tariff cut in the top band, for normal products, will range between 60-85 percent.
Table 3: Suggested G-20 tariff cut criteria
Developed Countries Developing Countries Initial tariff level
(percent) Tariff cut Initial tariff level
(percent) Tariff cut
0 ≤ 20 45% 0 ≤ 30 25% 20 ≤ 50 55% 30 ≤ 80 30% 50 ≤ 75 65% 80 ≤ 130 35% 75 ≤ 400 75% 130 ≤ 375 40%
> 400 cap of 100%
> 375 cap of 150%
Source: G20.
10
While most agricultural products will be subject to the tariff cutting formula finally accepted by member countries, special and sensitive products will be subject to a different set of tariff cutting rules. Developing countries will be allowed to specify a certain number of “special products” that will face lower tariff cuts.6 Some criteria have been specified for selecting “special products” including food security, livelihood security, and rural development needs. Developed countries will be allowed to specify a certain number of “sensitive products” that will also face lower tariff cuts, although no criteria have been provided to guide the selection of these products. In essence, countries will be able to self-select any product they want for sensitive treatment. Clearly, Canada is planning to specify its supply managed commodities as sensitive.
The maximum number of products a country is able to specify as sensitive will be determined as a set percentage of its total number of tariff lines. Canada has 1,308 agricultural tariff lines with approximately 177 used to specify over-quota tariffs for all types of products. Of these, 96 apply to supply managed commodities. Even if just the current supply managed commodities that are subject to over-quota tariffs are to be classified as sensitive, the number of sensitive products Canada is allowed to specify would have to be at least 7.3 percent of the total number of tariff lines; and this assumes the other 81 over-quota tariff lines would be subject to the normal tariff cutting formula. The US has proposed that only one percent of tariff lines should be given sensitive treatment while the EU has proposed a maximum of eight percent of tariff lines. Chairman Falconer suggests that five percent is the upper bound on the number of sensitive tariff lines a country will be allowed (WTO, 2007) If five percent is the final agreed upon figure then Canada would not be able to specify all of its over-quota tariff lines for supply managed products as sensitive.
Just because a product has been selected for sensitive treatment does not mean it is exempt from tariff cuts. Chairman Falconer reports that the “centre of gravity” for sensitive product tariff cuts is between one-third and two-thirds of the cut required for normal products. Thus, over-quota tariff cuts of 25-50 percent for most of Canada’s supply managed products seem likely if the negotiators can complete the task.7
In order to analyze the impact of a possible DDA outcome, information is required on the amount of “water” in Canada’s over-quota tariffs. The water in the tariff refers to the amount by which over-quota tariffs can be lowered but still keep imported products out of the Canadian market. In the chicken market, a 50 percent over-quota tariff cut would still leave the Canadian market protected from iced broiler imports from the United States. However, over the past few years, trade in chicken meat has evolved from trade in iced broilers to trade in chicken parts, with Brazil emerging as the world’s lowest cost provider of frozen chicken parts. As a result, from the perspective of Canadian chicken producers, even higher tariffs might be required for complete protection from imports.
Raw milk is priced about 40 percent higher in Canada than in the United States, which would be the only potential supplier of imported raw milk, so for this commodity, a tariff 6 Developing countries will also be allowed to specify products as “sensitive.” 7 Lowering in-quota tariffs will not create any new market access because fill rates are near 100 percent.
11
higher than 40 percent should keep raw milk out of the Canadian market.8 Gifford suggests that a butter tariff near 200 percent would be required to totally protect the Canadian butter market from imports under most market conditions. However, it should be noted that dairy trade is taking place increasingly in milk components rather than final products like butter. Unfortunately, the data required for careful analysis of Canada’s potential exposure to low cost imports is very difficult to obtain and additional analysis would be required to forecast the size of over-quota tariff cuts the supply managed commodities could withstand while maintaining nearly complete protection from imports. However, if we assume that tariff cuts of 25-50 percent to the over-quota tariffs will still maintain protection from foreign imports under most conditions and for most products, the major challenge the supply managed industries will face under the DDA will be increases in minimum access.
THE ECONOMICS OF TRQ LIBERALIZATION UNDER SUPPLY MANAGEMENT
The three main features of a tariff rate quota are: 1) the minimum access commitment (MAC); 2) the in-quota tariff; and 3) the over-quota tariff. A country must allow imports up to the amount specified by its minimum access commitment at the in-quota tariff, while any imports over and above the MAC are charged the over-quota tariff. By setting the over-quota tariff rate at a high level, countries can effectively maintain a strict quota on imports. When liberalizing TRQs under the WTO, each of these three features can be changed, although the access imported commodities have to the domestic market protected by the TRQ will generally only be affected by changes to the MAC and the over-quota tariff. Depending upon the size of the over-quota tariff cuts, real gains in access are not necessarily realized by importers.
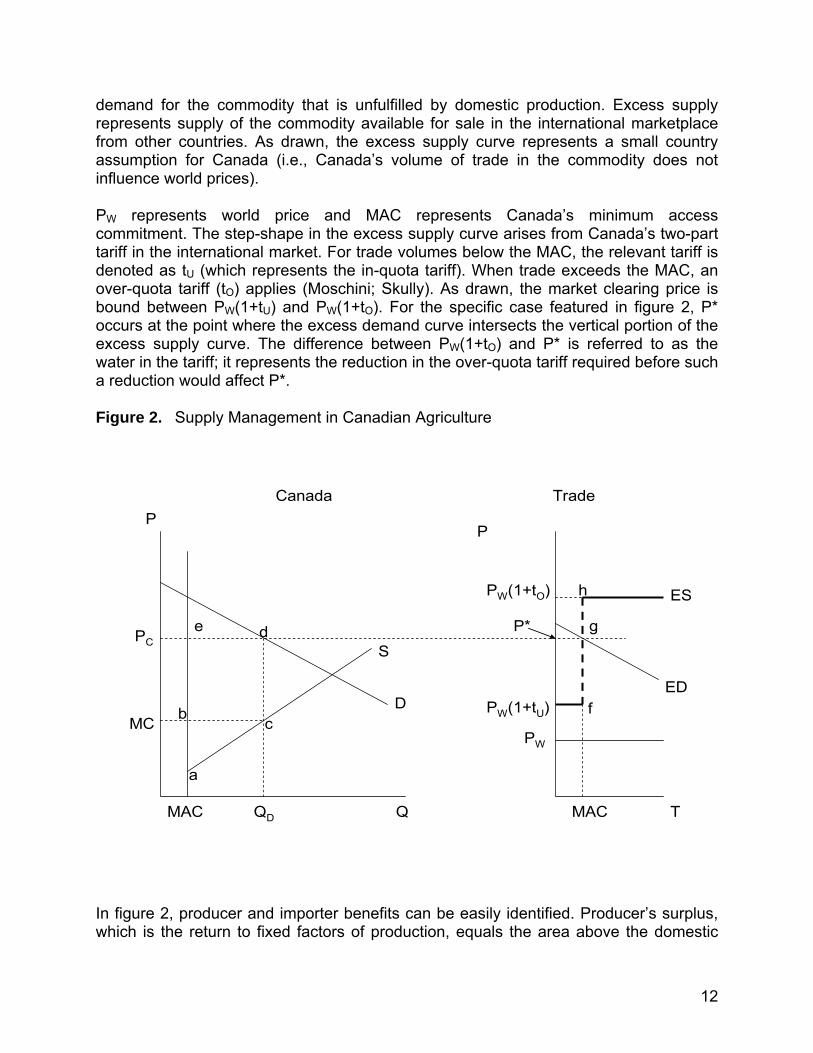
Figure 2 shows a stylized representation of supply management in Canadian agricultural markets. The left hand side of the figure represents Canada, while the right hand side represents Canada’s interaction with other nations in the international trade arena. Supply and demand curves in the Canadian market are labeled S and D, respectively. PC and MC represent price and marginal cost in Canada, while QD and MAC represent domestic demand and imports at the minimum access commitment, respectively. The difference between QD and MAC represents the volume of marketing quota available to domestic producers. Also note that the supply curve has been shifted to the right such that it now intersects the vertical line representing the volume of imports. Shifting Canada’s supply curve to the right in this manner assumes that Canadian producers take the MAC as fixed when making profit maximizing price and output decisions (i.e. imports are infra-marginal with respect to Canadian producers’ profit maximizing decisions). . The price in the Canadian market (PC) is such that the domestic market clears (i.e., domestic supply plus imports equals domestic demand). In turn, the Canadian price equals the market clearing price in the trade panel. This market clearing price (P*) is determined by the intersection of Canada’s excess demand (ED) curve and the excess supply (ES) curve Canada faces. Excess demand represents 8 Canada’s exchange rate plays an important role in determining the amount tariffs can be cut before facing import competition.
12
demand for the commodity that is unfulfilled by domestic production. Excess supply represents supply of the commodity available for sale in the international marketplace from other countries. As drawn, the excess supply curve represents a small country assumption for Canada (i.e., Canada’s volume of trade in the commodity does not influence world prices).
PW represents world price and MAC represents Canada’s minimum access commitment. The step-shape in the excess supply curve arises from Canada’s two-part tariff in the international market. For trade volumes below the MAC, the relevant tariff is denoted as tU (which represents the in-quota tariff). When trade exceeds the MAC, an over-quota tariff (tO) applies (Moschini; Skully). As drawn, the market clearing price is bound between PW(1+tU) and PW(1+tO). For the specific case featured in figure 2, P* occurs at the point where the excess demand curve intersects the vertical portion of the excess supply curve. The difference between PW(1+tO) and P* is referred to as the water in the tariff; it represents the reduction in the over-quota tariff required before such a reduction would affect P*.
Figure 2. Supply Management in Canadian Agriculture
P
T
TradeP
Q
Canada
D
S
ESPW(1+tO)
QD
PC
PW(1+tU)
PW
MACMAC
MC
P*
ED
cb
e
f
a
d
h
g
In figure 2, producer and importer benefits can be easily identified. Producer’s surplus, which is the return to fixed factors of production, equals the area above the domestic
13
supply curve, to the right of the vertical line representing imports, and below marginal cost (i.e., area abc). Since supply management uses domestic marketing quotas to ration output, quota rents accrue to domestic quota holders. The monetary value of marketing quota rents equals the area between domestic demand (QD) less imports (MAC), times domestic price (PC) minus marginal cost (i.e., the area bcde).
Use of a TRQ scheme means that importers can earn import rents. However, the nature of the rents varies with the position of the excess demand curve relative to the excess supply curve (figure 2, trade panel). If the excess demand curve intersects the lower horizontal part of the stepped excess supply curve, then importers do not earn any import rents. When the excess demand curve intersects the vertical part of the stepped excess supply curve, as illustrated, importers earn import quota rents equal to the area P*gfPW(1+tU) and the government collects in-quota tariff revenue equal to P*gfPw(1+tU). If the excess demand curve intersects the excess supply curve on the upper vertical portion of the stepped excess supply function, import rents equal the area PW(1+tO)hfPW(1+tU), while tariff revenues equal the difference between PW(1+tO) and PW(1+tU) times the volume of over-MAC imports plus the in-quota tariff revenue . How the importer rents are rationed is governed by a number of institutional-specific factors. However, it is worth noting that the rents will accrue primarily to stakeholders in Canada (specifically recipients of the Canadian import quotas).
Now let’s consider the impact of the three liberalization options available for TRQs on producers of supply managed commodities in Canada. First, if the DDA requires reductions to the in-quota tariff, this action would not affect the volume of imports or producer prices and incomes; it would increase the import quota rents while reducing the tariff revenues collected by the government.
Second, if under the DDA the over-quota tariffs are reduced by no more than the amount of the water in the tariff, then producer prices, quota levels, quota values, and net incomes of producers of supply managed commodities will be unaffected by such reforms. However, if the proposed reduction in tariffs were to exceed the water in the tariff, then it follows that there will be reductions in the output prices of the supply managed commodities which would result in the erosion of both producer net incomes and quota rents. These effects would be partially offset by the resulting increases in domestic consumption of these products in response to the lower prices, which would result in equivalent increases in domestic quota levels. Despite these mitigating effects, the profit levels of producers of supply managed products appear certain to fall given that the industry would have chosen to lower prices previously if such a move would have increased profits. So it would appear that small over-quota tariff cuts will not be damaging to producers of supply managed commodities due to the existing water in these tariffs, but larger tariff decreases (those beyond the water in the tariff) could cause financial losses for these producers.
Third, if the DDA requires increases in the MACs, then domestic marketing quota levels will need to be reduced if domestic prices are to remain unchanged. The amount the quota levels would have to fall could be somewhat reduced if the industry were to lower
14
prices under the monopoly pricing regime. In either case, producers will be made worse off through some combination of falling prices and quota levels.
THE DEBATE OVER ASSISTANCE
One explanation for the sharp increase in the value of marketing quota since 1995 is that quota buyers expect governments will compensate them for any loss in quota value resulting from policy changes. This outcome is not a foregone conclusion. It is unusual for governments to compensate producers for trade policy changes. There are a number of good reasons for this. First, multilateral trade policy changes are typically modest and made over an extended period of time. Second, trade policy changes are complex affecting both the price of outputs and inputs, and heightened competition in the domestic industry often results in firms finding ways to improve their productivity to become better competitors in the international market. Third, it is often difficult to know if a firm’s woes are caused by trade policy changes, general economic conditions, or circumstances unique to the firm. Fourth, in a competitive economy, firms go out of business and workers are displaced for a wide variety of reasons. These firms and workers have recourse to a number of government programs to provide retraining and to soften the blow. Why should workers perceived to have been harmed by trade policy changes receive better treatment than workers who become unemployed for other reasons?
Consider the implications of the DDA and its likely time path. Even if the DDA results in over-quota tariff cuts of 50 percent, the over-quota tariff for all of Canada’s supply managed commodities would remain above 100 percent, except for turkey where it would fall to 61.9 percent. It is unlikely that the DDA will come into effect prior to 2009 and it will likely involve a five to ten year implementation period. Hence, the economic implications of the DDA will play out over the next seven to12 years. In addition to cuts in over-quota tariffs, it would appear that some additional minimum access will have to be provided to foreign suppliers, with the possible exception of the chicken industry. Still, changes under the DDA of this nature will not require the elimination of supply management and Canadian domestic prices for these commodities will still be high relative to world market prices. So should this type of trade policy change require the provision of financial assistance to producers?
Perhaps the strongest argument against providing assistance, even with significant cuts in future protection, is that producers should have been aware of such risks when they purchased their marketing quota and up to this point, they have enjoyed considerable benefits from owning it. The risks inherent in purchasing quota – that the policy regime may change – are well understood by buyers, and there is evidence this risk is built into the quota price. Even the Ontario milk producer who bought his entire marketing quota as recently as 1995 could sell it today for nearly three times what he paid for it. If the value of this individual’s quota should drop by as much 25 percent as a result of the DDA, should Canadian taxpayers provide him with financial assistance for his partial loss in capital gains? Canadians who purchased Nortel stock for $100/share and watched its value drop to $3/share would have a quick answer to this question.
15
But, there is also the argument that government has a role to play in facilitating adjustment in order to lower farm prices. In fact, there are three such examples of payments to Canadian farmers following policy changes during the past three decades. The first is the $1.6 billion payment made to Canadian farmers when the Western Grain Transportation Act was eliminated. It is important to note that: 1) this was a domestic program; 2) the subsidy was judged by some to represent less than one-third of the benefits of the program; and 3) the subsidy was eliminated overnight, with no gradual phase-out. The second example is the transition assistance provided to grape growers in Ontario and British Columbia at the time the CUSTA was signed. Payments from this program were not intended to provide “compensation” but rather to assist grape growers over a short period of time, to replace Concord and other low-quality wine grapes with vinifera grape varieties. The third example is the adjustment assistance provided to about 1000 Canadian tobacco producers so they would retire their basic production quota permanently. Although this was a domestic and not a trade policy reform, it is still of sufficient interest to describe it in more detail.
Tobacco is a supply managed commodity in Canada, but its production base is restricted to a few counties in Ontario that currently produce all of Canada’s tobacco. In the early 1970s and 1980s, about 200 million pounds of tobacco was produced annually in Ontario. However, nonsmoking campaigns at all levels of government combined with increases in cigarette taxes have had a significant effect on the Ontario industry that was geared primarily to serve the domestic market. By the early 1990s, production had dropped to less than 140 million pounds per year and a decade later to just over 100 million pounds per year. In 2005, joint federal and provincial programs were announced to permanently reduce the amount of basic production quota (BPQ) held in Ontario.9 A reverse auction was used to permanently retire 51 million pounds of BPQ. Producers were paid C$1.72/pound for their BPQ and in return they agreed to exit the industry and not to own BPQ in the future. The total cost of removing the BPQ was C$87.8 million dollars, or an average payment of about C$88,000 per producer.10 The program reduced the number of active tobacco producers in Ontario to 622 in 2005/06 who produced 85.3 million pounds of tobacco worth about C$136.5 million.
Clearly the buyout program for Ontario tobacco producers had nothing to do with a change in border policy and everything to do with domestic health concerns related to smoking. The buyout price of C$1.72/lb. is close to what it cost to buy a pound of BPQ in 2000/01, but the value of BPQ in 2004 had fallen to below C$1/lb.11
9 The federal program was the Tobacco Adjustment Assistance Program and the provincial program was the Tobacco Community Transition Fund. These programs were the latest is a series of government initiatives to encourage tobacco producers to diversify into other crops and/or exit the tobacco industry. 10 The cost of the programs was higher than this figure because they contained elements unrelated to the buyout of BPQ. 11 A pound of BPQ does not give a producer the right to market a pound of tobacco. In 2004, the percent “growable” of BPQ allotted was 27 percent.
16
There are precedents for adjustment assistance or buyouts having been provided in countries other than Canada for domestic policy changes. These include sugar in the European Union, milk in Australia and Switzerland, and peanuts and tobacco in the United States. These programs vary considerably in their characteristics. The EU sugar program is discussed only briefly here, while the Australian milk and the US peanut and tobacco programs are reviewed in more detail later in the paper.
In the case of EU sugar reform, agreement was reached in late 2005, with reforms to be phased in from 2007, and will feature a shift away from sugar production quotas and to lower domestic sugar prices. Domestic prices will decline by 36 percent over four years bringing them close to the current world price for sugar. Direct decoupled payments (a “cash-out”) will be made to farmers to replace 64 percent of the income lost. In addition, factory sugar quotas will be sold back to the EU at a given schedule of prices, with the buyback price declining after two years. In addition to the cash-out payments, the EU will provide farmers with aid to adapt or exit the industry (The International Centre for Trade and Sustainable Development – ICTSD).
In summarizing these various programs, there are few, if any, examples of payments made to compensate producers for trade policy changes, although the dividing line between purely domestic and purely trade policy is often blurred. Most of the adjustment schemes also have the objective of facilitating adjustment in the industries affected to build a more competitive industry in the future.
However, if it is judged politically necessary to provide adjustment assistance, the focus should turn to the key characteristics of successful adjustment programs. Perhaps the biggest question is how much assistance should be provided? A full buyout of all producers of supply managed commodities would cost C$25 billion using 2004 quota values, and from the past 25 years of experience this cost is likely to grow over time. How should this figure be compared to the C$1.6 billion paid to Prairie grain farmers to cover about one-third of the benefits of the freight subsidy being removed? In comparison, Australian dairy reforms involved adjustment assistance that covered only three years of annual benefits of the old scheme.
OPTIONS FOR ADJUSTMENT ASSISTANCE
Assistance Based on the Book Value of Quota
One option, in the family of options that use quota (capital) values as the basis for calculating assistance, is to tie payments not to the current market value of marketing quota, but rather to its book value. Financially, book value is typically treated as an asset’s original purchase value less depreciation. Here, because marketing quota does not depreciate in the conventional sense and rarely loses value, book value is taken as the original value of the purchased production quota. This approach to providing adjustment assistance explicitly focuses on losses in capital value as measured by original cost. It follows the argument that a producer who recently purchased quota at a high value, possibly still backed by debt, is deserving of greater assistance than a
17
producer who bought the quota at a much lower value. This argument also reflects the view that the producer who bought the quota at a low value has already received many years of benefits from his purchase.
This option can incorporate different rules. First, assistance can follow simply on the basis of the book value and each producer would be paid the purchase value of his quota. A key feature of this scheme is that capital gains would count for nothing in terms of adjustment assistance. An alternative rule, with a lower level of assistance, would be to take the proportional loss in current market value of quota and then apply this loss percentage to each individual’s book value of his quota. One issue that could arise in administering this scheme at the individual level, is that each producer may have a portfolio of quota vintages, with a different book value for each vintage. One could then pay assistance based on the full book value of each vintage for each producer, or on the percent change (decline) in the market value times the book value of each vintage, in order to reduce the government’s financial obligation. Data on book values are likely available at an individual producer level from income tax records due to the deductibility of allowed depreciation on quota purchases.12 Clearly, some administrative burden is involved with such a scheme. But if these data are not available at reasonable cost, one could calculate the average book value for a region or a commodity subgroup and pay individuals on the basis of this average. Then all producers in each subgroup would receive the same per unit payment level (based on the average book value), but the total amount of assistance would differ according to the amount of quota held.13
At least two issues arise when dealing with assistance based on book value. First, quota that was initially given to producers by the marketing board will not qualify for any assistance, as the book value is zero. Of course, producers who received their quota gratis had the benefit of higher prices without payment for all the years since that allocation, so they would not have been without an advantage. Second, as previously noted, this scheme does not provide any assistance for accumulated capital gains on the quota. Implicitly, this scheme assumes the goal of the supply management regime was to pay producers better prices with no obligation to provide for higher investment returns via capital gains on the right to produce (marketing quota).
Australian Dairy Reform Model
In 2000, the Australian dairy industry took an interesting approach to deregulation that provided real world evidence on another option for government policy and assistance. These reforms featured a change in fluid milk pricing, where regulatory constraints on pricing were removed, combined with the elimination of most government subsidies. The reforms removed the regulated fluid milk price premium, price discrimination and 12 Canadian farmers are allowed to depreciate 50 percent of the value of quota purchases, although this is subject to recapture on the future sale of this quota. 13 An even simpler scheme is to choose an arbitrary date and to provide payments to producers who bought their quota since that date using the book value and the assistance rules already described, and no payments to those who purchased their quota prior to that date. Although this would reduce the financial exposure of the government, it would invite criticism for being unfair to the earlier purchasers.
18
pooling across all dairy products, most interstate restrictions on milk shipments, and the government price support payments for manufacturing milk. Although there were several earlier programs to foster industry adjustment to more efficient, less restricted marketing arrangements, these measures were often implicit and their effects were diluted by production growth. In addition, the support payments encouraged imports, and they did little to reduce the balkanization of the Australian milk market (Edwards; Harris; Harris and O’Connor).
The Australian State of Victoria phased out fluid milk quotas in the 1970s, but the countrywide deregulation in 2000 was more substantial in many ways (Alston). First, the reforms were full and immediate, with the policy announcement made nine months before implementation. This “full impact approach” was in contrast to the more usual phased-in approach to reform. However, debate surrounding the reform has mostly ignored this issue and instead focused on issues of horizontal equity; how different farmers were treated by the reform and the adjustment assistance program (details below) and on processor-farmer milk pricing questions (Kingston; Parliament of South Australia). Second, the immediate reforms led to rapid declines (35-40 percent initially) in the price of fluid or non-seasonal milk (Harris). Third, an assistance scheme was devised to help replace the income that was lost due to this deregulation. The focus of these reforms was on encouraging adjustment and not on providing equity-based income support, even though farmers were allowed to spend the payments in any way they chose. However, the payments were targeted to where the larger losses occurred, namely in those regions and to those farms with heavy reliance on fluid milk production, as opposed to manufacturing milk production. The size of the payments were known in advance and scheduled to be paid quarterly over eight years, but financial market (bank) programs were offered to give farm recipients the present value of this income stream in a lump sum payment. The level of the total assistance payment was about US$150,000 per farm, which was judged to represent about three years of income losses due to the reforms. This was not a full “buyout” for the permanent losses incurred (in present value terms), but was considered to be an appropriate sum to finance the necessary adjustments.
Fourth, these assistance payments were financed by a tax on consumers. There was no contribution from the National Treasury. Fluid milk consumers were judged to be a legitimate source of this funding because they would be the primary beneficiaries of the reforms, due to the subsequent fall in consumer fluid milk prices. The financing arrangement was a ten-year tax that meant consumer prices would actually fall by only one-half of the expected amount during those ten years, after which the full decline would be enjoyed. In other words, consumers benefited from the reform immediately but the decline in consumer prices was phased in over two periods, one-half to be experienced immediately and the other one-half after ten years.
If this approach was applied to the Canadian dairy industry, it would be administratively feasible. Due to the pooling procedures currently used, it is possible for producers to be paid a lower price for their product and for the pool to pay out a certain sum to cover the costs of the assistance scheme, with the total pool costs being recovered through
19
appropriate pricing to consumers. One difference in Canada would be that this scheme would cover all milk products, not just fluid milk. The costs could be pro-rated across all product pools as an extra charge on the milk in that pool and the extent of the charge could be chosen, just as it was in the Australian case. However, unlike the Australian case, because all milk products enjoy an income boost due to current trade policies, the need for regional differentiation in Canada would be less of an issue.
Compared to adjustment assistance schemes based on quota values, this scheme allows payments at less than the full value of the quota, or less than the full amount of the prospective income loss to be implemented more easily. This is important in the Canadian situation where the cost of making payments at full quota values would be C$25 billion. It may also be important if the current quota values contain an expectation that there will be payments to producers following trade reforms of the sort we have discussed. The government may not wish to finance these expectations, and so for this reason may wish to provide a lower level of payment. This approach also allows the assistance to be determined flexibly, independent of quota values. With this flexibility, payments may be tailored to each region and type of farmer as desired.
Due to this added flexibility, this kind of scheme would be cheaper than simply buying out quota. It also shifts the financial burden of this assistance to consumers and away from the government. However, the scheme could be adapted to allow for joint financing of these costs. Some of the costs could be covered by the government if they contributed some amount to the milk price pool.
In sum, the Australian scheme adds a number of different options to adjustment assistance policy, and in particular, it provides a scheme that is even more flexible than the options chosen in Australia might suggest. This type of reform can be designed to allow for virtually any level of payments, in any form and to any group; the timing of the payments can be readily chosen; the program can be paid for through any mix of consumer and government financing depending upon what is deemed as fair; and the reforms can involve variable timing of both the costs and the benefits.
The Two-Quota Option
If Canada anticipated that future international trade obligations would require the reduction of over-quota tariffs to relatively low levels, such as well below 100 percent, the Canadian government might wish to create a period of adjustment to assist producers in dealing with the approaching lower tariffs. This period of adjustment could assist farmers in making the necessary changes in their farm operations to respond to prices that might be considerably lower. As well, the government would be able to spread out over time any adjustment assistance it judges to be appropriate. Under such circumstances, a two-quota policy may be a useful option. This would be a voluntary scheme that would involve a gradual decline in domestic product prices to a level that would largely protect the domestic industry from imports and maintain the domestic market for Canadian producers. Alternatively, such a scheme might be useful once a trade agreement has been signed, in order to facilitate adjustment. In this latter
20
situation, however, the length of the adjustment period would be dictated by the trade agreement and not by the choice of the Canadian government.
Such a program could work with the following details, using the dairy sector as an example. Producers would be given the choice of buying into such a scheme by selling (i.e., trading-in) their existing or “old” quota to a government agency while at the same time bidding for a new class of quota. Milk shipped under this new quota would receive a lower price than that received with the old quota. The scheme could be designed so that buying new quota would be similar to buying the right to sell on the old commercial export program that existed in some Canadian provinces prior to 2002. The two transactions – selling the old quota and buying the new quota – would be linked, as suggested by the word, trade-in. Producers wishing only to sell their existing quota could do so on existing quota exchanges as usual.
Given that this option would feature two different prices for the same product being sold only on the domestic market, it would involve pooling of the different returns. Consumers would face only the pooled price. The institutional framework of classified pricing that exists in the Canadian dairy sector would be consistent with such a pricing mechanism. The pricing would involve a schedule under which the price would gradually decline over time by whatever path the government chose.
The choice of the final price could be tied to an anticipated (or agreed-upon) tariff level. If the expected tariff was 25-40 percent, the final domestic price would have to be below the world price plus the 25-40 percent tariff in order to keep out imports. Of course, tariffs would have to be set on an individual product basis and could differ across products.
The new quota would have a lower value than the existing quota due to the fact that milk shipped under it would receive a lower price. The determination of this price could be handled privately under an offer-to-buy mechanism whereby producers would make an offer for the new quota when selling their old quota to the government at some predetermined price (such as the prevailing market price on already established quota exchanges). Alternatively, farmers could provide both an offer-to-sell price for their old quota and a bid-to-buy price for the new quota. Given the ready alternative all producers face of selling old quota on the existing quota exchange, we would expect the offer price to be very close to the existing market price for old quota. Whether the transaction involves a predetermined old quota price set by the government, or an offer price made by producers, the key variable would be the difference between the bid and offer prices. This would represent the net return to the producer from engaging in the transaction.
To make this option voluntary and commercially feasible, there would have to be a government subsidy involved. An agency that bought old quota at high prices and exchanged this for new quota at lower prices would need a subsidy to be viable. The amount of quota that could be purchased by this agency and replaced with new quota each year would depend on the level of subsidy or financing determined by the
21
government. The size of the financial commitment would depend on the combination of the transition period desired or imposed by the trade agreement.
As the pooled milk price declines over time, consumption of dairy products would be higher than if no price changes took place. A net increase in consumption would prompt new quota to be added to the system. This could be distributed to new quota holders in the same way that new quota is handled presently – by a pro-rata increase to all (new) quota holders. This feature of the new quota (i.e., the possibility of increased allocations) would lead to a higher price than would otherwise prevail and it would increase the attractiveness of this scheme to would be participants.14
What are the attractions of such a scheme to the Canadian government? First, it does commit the government to an adjustment assistance package. In terms of advantages, it would allow for a graduated payment and the degree of graduation or phase-in would be decided by the government each period through its choice of how much old quota to buy. Second, by selling the new quota, there would be some revenue offset to reduce the net cost of the assistance payments. This may be a small offset, depending on the level of world prices and the tariff that is set, but its existence is good for the government nevertheless. On the negative side, subject to this offset, such a scheme does peg the assistance payments to the full value of the old quota. If the government wanted to pay only one-third or one-half of the current quota value, this would be difficult. A major disadvantage of this scheme is its cost to governments unless it is combined with a tax on the stock of old quota.
What would be the attractions of this scheme for producers? First, it would allow farmers who are willing to accept the proposed path of lower prices to continue in milk production while extracting a considerable proportion of their equity in old quota with the certainty of current quota prices. Second, the program is voluntary, so a farmer who did not want to consider operating under the lower priced market could continue with the current system. However, such a decision would be subject to many risks as future trade negotiations unfold, such as the loss of quota if minimum access levels were to rise or milk prices decline as a result of over-quota tariffs falling. Farmers who hold such a view might find this two-quota scheme to be quite attractive. Third, farmers would be able to trade in their old quota for new quota to whatever degree they wish. Finally, if the new quota were to be made available to new entrants, this would be seen as an additional attraction of such a scheme.15 Lower quota values, even if tied to lower milk prices, might make the industry accessible to some individuals who otherwise would not have the access to the capital needed to purchase old quota under the current system with its high quota prices.
14 If it was necessary to remove quota from the system this could be taken from old quota holders in order to further improve the attractiveness of new quota. 15 Currently, many provinces levy a tax on sales of quota. It would be administratively easy to convert the old quota taxed away to new quota sold by the government, thereby creating a revenue offset.
22
As noted above, the scheme proposed here would not provide a retirement option for exiting farmers. That option would be available by selling old quota on the existing quota exchanges, as many farmers currently do.
United States Tobacco and Peanut Buyouts
Two US farm programs involving supply management elements – tobacco and peanuts – were ended or substantially changed in recent years and buyout options were made available. Given the similarities between these programs and supply management in Canada, they are quite relevant. These programs are similar to a full quota buyout, discussed below, so we provide only a brief overview of their elements.
Tobacco The US tobacco program buyout was clean and complete – all government support programs and restrictions were permanently terminated. Following this reform, tobacco prices were expected to fall by 25-30 percent. Payments were made both to quota holders (not necessarily farmers) and tobacco growers (including quota renters who did not own quota). Payments were spread out evenly over ten years for both groups, although lump sum payments intermediated through financial institutions were available. The total cost of the buyout to these two groups was $9.6 billion, compared with $2 billion in tobacco sales in recent years. Although Orden estimates the cost of the buyout to be equivalent to 15-20 years of quota rental payments, one can argue that the buyout sum was actually greater than the foregone future benefit stream, due to the widely expected future decline in tobacco prices and quota allocations. Finally, unlike most buyouts, the tobacco buyout was not financed by taxpayers but rather by assessments on tobacco manufacturers and importers. This is similar to the Australian dairy program where the government did not finance the buyout.
Peanuts Unlike tobacco, the peanut buyout was not clean and complete. Although quotas and locational growing restrictions were removed, “net” returns were expected to be similar for many farms due to the introduction of direct and countercyclical payments. Payments were made only to peanut quota holders. Peanut growers renting quota from quota owners still received government program payments and no longer needed to lease quota, hence they were not considered to require compensation payments. Buyout payments were spread out over five years at levels Orden calculated to be equivalent to about twenty-four years of quota rental payments. But it is more likely that the present value of buyout payments exceeded the foregone expected future payments due to ongoing declines in both quota allocations and peanut prices.
A Full Quota Buyout
Another possible option for Canada, drawing upon the US examples, would be to provide adjustment assistance at a level equal to the full market value of the domestic quota. Such a scheme would be easy to administer and politically attractive – some farm leaders are already arguing for this option. However, the downside of this option is the extreme cost of such an undertaking – estimated to be C$25 billion using 2004 data. Furthermore, if this option was to be taken only after the next trade agreement forces
23
Canada to do so, the total cost could be much larger, using the past 20 years as a guide to annual quota value increases.16 This cost will greatly exceed the WGTA buyout of all wheat farmers in Western Canada of less than C$2 billion.
One response to such a large expenditure would be to explore the possibility of spreading these costs out over time. If such a measure was adopted only in response to a final trade agreement, the typical phase-in period would only be five years. However, if planned far enough in advance, this option could be spread over a much longer time period such as 20 to 25 years. This could be accomplished using the two-quota option discussed previously.
Final Issues: How to Determine Assistance Levels
Many arguments for providing assistance when reforming quota-based policies are based in some way on quota capital values, but is this the correct line of reasoning? Some have suggested that Canada’s quota values are inflated and may illustrate an asset bubble. If so, what kind of future profitability do these values actually reflect?
There are alternatives to basing assistance levels on quota capital values as the previous discussion indicates. Some assistance programs focus instead on foregone annual profitability with payments based on a certain number of years of foregone quota profits or rent. This is explicitly mentioned, for example, in the Australian dairy case. To address this issue, we look more closely at quota price patterns.
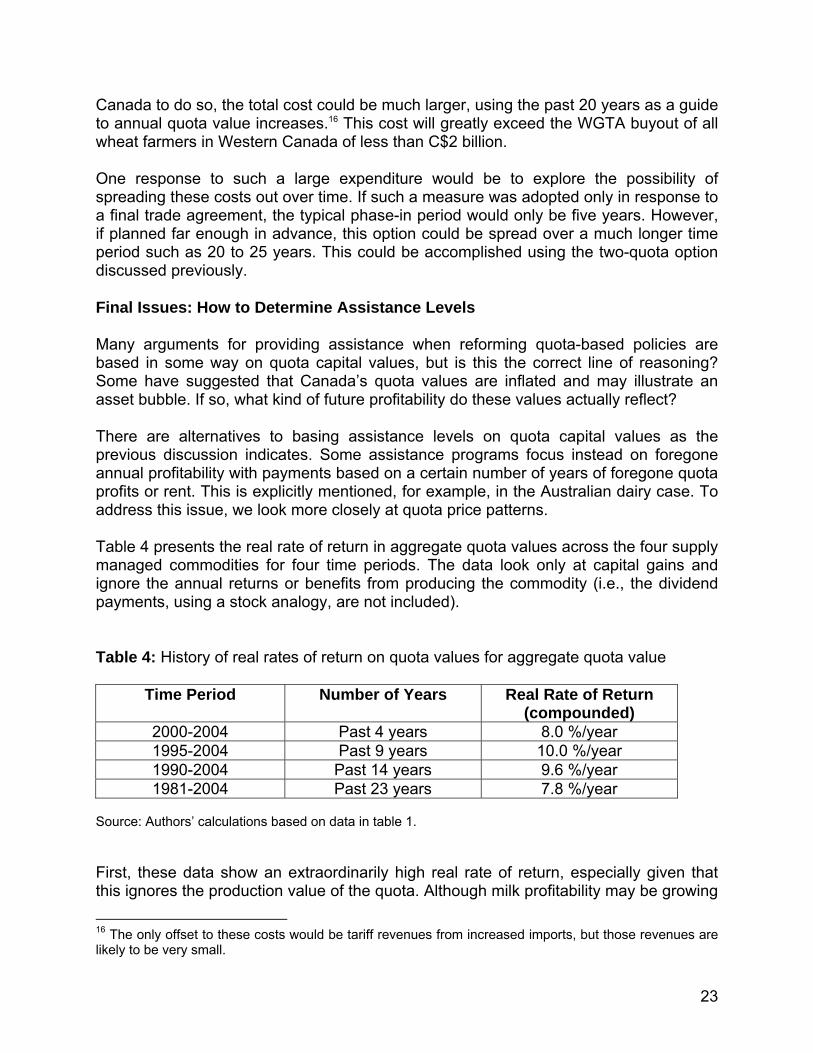
Table 4 presents the real rate of return in aggregate quota values across the four supply managed commodities for four time periods. The data look only at capital gains and ignore the annual returns or benefits from producing the commodity (i.e., the dividend payments, using a stock analogy, are not included).
Table 4: History of real rates of return on quota values for aggregate quota value
Time Period Number of Years Real Rate of Return (compounded)
2000-2004 Past 4 years 8.0 %/year 1995-2004 Past 9 years 10.0 %/year 1990-2004 Past 14 years 9.6 %/year 1981-2004 Past 23 years 7.8 %/year
Source: Authors’ calculations based on data in table 1.
First, these data show an extraordinarily high real rate of return, especially given that this ignores the production value of the quota. Although milk profitability may be growing
16 The only offset to these costs would be tariff revenues from increased imports, but those revenues are likely to be very small.
24
over time, there is no question that the growth capital values is faster than the rental return on quota or annual profits of producing milk. It would be surprising if the difference between milk prices and marginal costs are growing much faster than two percent per year. Second, as the table shows, these high rates of return are not an artifact of the last few years and are remarkably sustained, covering at least 23 years. The main conclusion from this analysis is that current quota values do not appear to be an asset bubble.
To make sense of such asset value growth, two plausible factors can be involved in increasing the capital value faster than the rental rate. First, it could be in response to a reduction in the default risk since there is the perception that the quota regime is less subject to change in the post-Uruguay Round Agreement period. A second possibility is the expectation that if there is a change in the quota regime, governments will make available some kind of compensation to quota holders. In both cases, quota values would grow independently of actual annual profitability of production. As a result, this “expectation of payments” will increase the actual cost of assistance if these quota values are to be used as the basis for making payments. Furthermore, if the expectation that government assistance will be forthcoming becomes more widespread, this could raise quota prices still further, raising the question of whether these values are the most appropriate benchmark for determining adjustment assistance.
CONCLUSIONS
It is reasonably clear that the current DDA Round of trade negotiations, if successfully concluded, is unlikely to provoke major changes in Canada’s supply management policy. Following a negotiated conclusion and implementation of this round, one response from the Canadian government would be to make the necessary minor adjustments required by the DDA and continue the policy regime largely as it has operated in the past. However, the post-DDA round of multilateral trade negotiations will likely result in the need for substantial changes to domestic supply management policy including significant price declines. Canada now has a window of roughly fifteen years to prepare for these possible changes. It is in this context that we have examined a variety of options for adjustment of the industry so that it can successfully compete in 2022 and beyond.
Many precedents exist across countries and over time for some form of longer term adjustment assistance. Drawing on these examples and the options presented in this chapter, we draw attention to many characteristics to consider in designing an adjustment assistance scheme including:
• the size of assistance payments; • the basis of payments, whether it be capital values or annual returns; • the pattern of payments over time; • the incidence of financing costs between taxpayers and consumers; • whether a scheme is voluntary or features across the board payments to
all;
25
• whether the same payments are made to all producers or whether there should be differential assistance based on some criteria such as historical quota prices;
• the possibility of introducing new types of quota; and • the administrative ease of the proposed reforms.
We suggest that special consideration be given to three of these issues. First, payments could be based on a fixed number of annual rental values, instead of on capital values. This would be preferable, given the seemingly “inflated” level of current quota market values. Second, options exist to choose the distribution or incidence of financing costs to either taxpayers, consumers, or both, and this issue should be given special attention. Third, assistance to this sector should be focused on facilitating adjustment of the industry to the competitive pressures it will likely face in the future, including lower product prices. We are confident the supply managed industries can compete in a less distorted world if given time to prepare and an encouraging policy environment.
REFERENCES
Alston, J. 1999. “Quota Reforms in Australian Agriculture.” Canadian Journal of Agricultural Economics 47(5):145-47.
Barichello, R. 2003. “Managing Domestic Emissions Permit Trading: The Relevance of
Canada’s Supply Management Quotas.” Paper submitted to Agriculture and Agri-Food Canada.
Barichello, R. 1996. “Capitalizing Government Program Benefits: Evidence of the Risk
Associated with Holding Farm Quotas.” In J. Antle and D. Sumner, eds. Essays in Honor of D. Gale Johnson, Vol. II, University of Chicago Press.
Brink, L. 2005. “WTO 2004 Agriculture Framework: Disciplines on Distorting Domestic
Support.” Working paper 05-01, International Agricultural Trade Research Consortium, May. Available at: <http://agecon.lib.umn.edu/cgi-bin/pdf_view.pl?paperid=16672&ftype=.pdf>. Accessed 16 October 2006.
Edwards, G. 2003. “The Story of Deregulation in the Dairy Industry.” Australian Journal
of Agricultural and Resource Economics 47(1):75-98. G-20. 2005. G-20 Proposal on Market Access. 12 October. Available at:
<http://www.g-20.mre.gov.br/conteudo/proposals_marketaccess.pdf>. Accessed 16 October 2006.
Gifford, M. 2005. “Canada’s Dairy Industry: Can Supply Management Survive in a More
Open International Trade Environment?” Policy Options. Centre for Trade Policy and Law, November. Available at: <http://www.irpp.org/po/index.htm>. Accessed 16 October 2006.
26
Harris, D. 2005. Industry Adjustment to Policy Reform: A Case Study of the Australian
Dairy Industry. RIRDC Publication No 05/, Rural Industries Research and Development Corporation, Australian Government.
Harris, D. and J. O’Connor. 2004. “Deregulation and Adjustment in the Australian Dairy
Industry.” Paper prepared for Silverado Symposium on Agricultural Policy, University of California Agricultural Issues Center, Davis, CA.
ICTSD. 2006. “Falconer Urges Members to Narrow Differences on Sensitive Products.”
Bridges Weekly Trade News Digest. 17 May. Available at: <http://www.ictsd.org/weekly/06-05-17/story2.htm>. Accessed 17 October 2006. Kingston, M. 2001. “Pull the Udder One.” Sydney Morning Herald, 30 March. Available
at: http://www.smh.com.au/articles/2003/11/21/1069027322192.html>. Accessed 11 December 2006.
Mussell, A., T. Moore, K. McEwan, and R. Duffy. 2005. “Testing the Structure of
Canadian Farm Incomes.” Unpublished data, George Morris Centre, Guelph, 13 May.
Moschini, G. 1991. “Economic Issues in Tariffication: An Overview.” J. Agric. Econ.
5(1):101-20. Orden, D. 2007. “Feasibility of Farm Program Buyouts: Is it a Possibility for US Sugar?”
In K. Huff, K. Meilke, R. Knutson, R. Ochoa, and J. Rude, eds. Achieving NAFTA Plus. Texas A&M University, University of Guelph, and Inter-American Institute for Cooperation on Agriculture-Mexico.
Parliament of South Australia. 2003. Final Report: Joint Committee on the Impact of
Dairy Deregulation in South Australia. Adelaide, SA: Second Session, Fiftieth Parliament, May. Available at: <www.parliament.sa.gov.au/NR/rdonlyres/6C26E836-0D94-45B1-98DC-6F80CB190C01/347/finalreportdairyderegulation2003.pdf>. Accessed 11 December 2006.
Rude, J. and K. Meilke. 2005. “Canadian Agriculture and the Doha Development
Agenda: The Challenges.” The Estey Centre Journal of International Law and Trade Policy 7(1):32-47.
Skully, D.W. 2001. Economics of Tariff-Rate Quota Administration. Washington, DC:
USDA, ERS Technical Bulletin 1893, April. Statistics Canada. 2004. Farm Cash Receipts. Ottawa: Catalogue 21-011-XIE, May. ____. 2005. Canada Food Stats. Ottawa: 23F0001XCB, November.
27
____. 2006. Balance Sheet of the Agricultural Sector. Available at:
<http://www.statcan.ca/english/freepub/21-016-XIE/21-016-XIE2006001.pdf>. Accessed 16 October 2006.
WTO. 2004. Doha Work Programme. Geneva: WT/L/579, 2 August. ____. 2005. Doha Work Programme: Draft Ministerial Declaration. Geneva:
T/MIN(05)/W/3/Rev.2, 18 December. ____. 2006a. “Domestic Support: Other Exempt Measures.” Agriculture: Explanation.
Available at: <http://www.wto.org/english/tratop_e/ag_intro03_domestic_e.htm>. Accessed 26 September 2006.
____. 2006b. Sensitive Products. Geneva, Chair’s Reference Paper, Committee on
Agriculture, Special Session Market Access, 11 May. Available at: <http://www.wto.org/english/tratop_e/agric_e/ref_paper_sensprods_e.pdf>. Accessed 16 October 2006.
____. 2007. Communication from the Chairman of the Committee on Agriculture, Special
Session. 30 April. ____. 2007b. Communication from the Chairman of the Committee on Agriculture,
Special Session, Second Installment. 25 May.
Related Documents