INEEL/EXT-99-01023 December 1999 OPTIONS FOR GAS-TO-LIQUIDS TECHNOLOGY IN ALASKA E. P. Robertson Idaho National Engineering and Environmental Laboratory BECHTEL BWXT IDAHO, LLC brought to you by CORE View metadata, citation and similar papers at core.ac.uk provided by UNT Digital Library

Welcome message from author
This document is posted to help you gain knowledge. Please leave a comment to let me know what you think about it! Share it to your friends and learn new things together.
Transcript

INEEL/EXT-99-01023
December 1999
OPTIONS FORGAS-TO-LIQUIDSTECHNOLOGY INALASKA
E. P. Robertson
Idaho National Engineering and Environmental Laboratory
BECHTEL BWXT IDAHO, LLC
brought to you by COREView metadata, citation and similar papers at core.ac.uk
provided by UNT Digital Library

INEEL/EXT-99-01023
Options for Gas-to-Liquids Technology in Alaska
E. P. Robertson
Published December 1999
Idaho National Engineering and Environmental LaboratoryBechtel BWXT Idaho, LLCIdaho Falls, Idaho 83415
Prepared for theU.S. Department of Energy
Office of Fossil EnergyUnder DOE Idaho Operations Office
Contract DE-AC07-99ID13727

iii
ABSTRACT
The Alaska North Slope (ANS) holds a vast resource of natural gas but has no current method oftransportation from the North Slope to world markets. The Prudhoe Bay field contains the largest portionof the discovered natural gas on the North Slope or about 21.8 Tcf of natural gas available for sale afterCO2 removal and satisfying power requirements and other North Slope use. The natural gas at PrudhoeBay that is produced during oil production operations is reinjected and used to increase oil recovery. Cur-rently, there are two broad gas-marketing schemes proposed for commercializing the natural gas on theNorth Slope. One is a gas-pipeline/liquefied natural gas (LNG) plant scenario; the other is a gas-to-liquids (GTL) option that chemically converts the natural gas to a stable, liquid syn-crude in a NorthSlope plant, eliminating the need for an additional pipeline from the North Slope to a southern Alaskaport.
The purposes of this report were to assess the effect of applying new technology to the economicsof a proposed GTL plant, to evaluate the potential of a slower-paced, staged deployment of GTL technol-ogy, and to evaluate the effect of GTL plant placement on economics.
Five scenarios were economically evaluated and compared: a no-major-gas-sales scenario, a gas-pipeline/LNG scenario, a fast-paced GTL development scenario, a slow-paced GTL development sce-nario, and a scenario which places the GTL plant in lower Alaska, instead of on the North Slope. Evalua-tions were completed using an after-tax discounted cash flow analysis. Results indicate that the slow-paced GTL scenario is the only one with a rate of return greater than 10 percent. The other scenarios didnot show positive net present values under the economic conditions selected for the simulations. Theirrank, in order of net present value, is as follows: slow-paced GTL development, no-major-gas-sales, fast-paced GTL development, a fast-paced GTL development in southern Alaska, and finally a gas-pipeline/LNG project.
The slow-paced GTL development would allow cost saving on subsequent expansions. These as-sumed savings along with the lowering of the transportation tariff combine to distinguish this option formarketing the North Slope gas from the other scenarios. Critical variables that need further considerationinclude the GTL plant cost, the GTL product premium, and operating and maintenance costs. Reducingthese costs, or increasing the premium, would increase the profitability of the GTL process. In addition,understanding these variables better and reducing their uncertainty would allow a more accurate predic-tion of economic profitability.

v
EXECUTIVE SUMMARY
The Alaska North Slope (ANS) holds a vast resource of natural gas but has no current method oftransportation from the North Slope to world markets. The Prudhoe Bay field contains the largest portionof the discovered natural gas on the North Slope or about 21.8 Tcf of natural gas available for sale afterCO2 removal and satisfying power requirements and other North Slope use. The natural gas at PrudhoeBay that is produced during oil production operations is reinjected and used to increase oil recovery. Cur-rently, there are two broad gas-marketing schemes proposed for commercializing the natural gas on theNorth Slope. One is a gas-pipeline/liquefied natural gas (LNG) plant scenario; the other is a gas-to-liquids (GTL) option that chemically converts the natural gas to a stable, liquid syn-crude in a NorthSlope plant, eliminating the need for an additional pipeline from the North Slope to a southern Alaskaport.
The objective of this report is to incorporate new information regarding GTL technology into aneconomic evaluation of a GTL plant in Alaska, and to look at the development-pace and placement of aGTL project. In some ways, this current report follows up on an Idaho National Engineering & Environ-mental Laboratory report in 1996 by Thomas et al. for the Department of Energy entitled Economics ofAlaska North Slope Gas Utilization Options. That 1996 DOE report analyzed a GTL scenario for mar-keting the ANS gas, a gas-pipeline/LNG scenario, and a no-gas-sales scenario. Since that report waspublished, new information regarding GTL technology was released to the public that appears to enhancethe economic viability of the GTL project option for marketing ANS gas. This current report incorporatesthe new GTL-technology information and looks in more detail at the impact of the timing of GTL plantconstruction and location on the economic viability of a GTL project in Alaska.
Study Purposes
1) To apply technical advances to the GTL scenario evaluated in the 1996 DOE report to deter-mine the effects new technology and knowledge have on the economics of the GTL project.
2) To evaluate the potential economic impact of a slower-paced, staged deployment of GTLtechnology on the North Slope; thus taking advantage of experience and technological improve-ments in later plant expansions.
3) To evaluate the concurrent development of both the LNG and GTL projects; with the GTLplant located in southern Alaska at the gas pipeline terminus.
To accomplish this, five scenarios were economically evaluated and compared: a no-major-gas-sales scenario, a gas-pipeline/LNG scenario, a fast-paced GTL development scenario, a staged, slow-paced GTL development scenario, and a scenario which places the GTL plant in southern Alaska, insteadof on the North Slope.

vi
Prudhoe Bay Field
The Prudhoe Bay field is the largest field in North America and lies on the Arctic coastline about200 miles east of Point Barrow. There were about 23 billion barrels of oil originally in place (OOIP) and46 Tcf of gas originally in place (OGIP). Ultimate oil-recovery estimates have been increasing over theyears as more is learned about the field and enhanced oil recovery techniques and cost reduction effortscontinue to improve.
Currently, Prudhoe Bay’s natural gas is used to enhance oil recovery from the field. Major gassales would take gas away from enhanced oil recovery projects and decrease ultimate oil recovery fromthe field. Some of the highly effective enhanced oil recovery programs that use the recycled gas are:pressure maintenance by gas re-injection, miscible injectant flooding, and water-alternating-gas programs.If major gas sales begin in 2005, a 400 million-barrel reduction in ultimate oil recovery is assumed. Ma-jor gas sales occurring later in the life of the Prudhoe Bay field would have a less significant impact on oilrecovery simply because there would be less oil available to recover. Major gas sales beginning in 2010are assumed to reduce ultimate recovery by 100 million barrels; and gas sales beginning in 2015 wouldhave a negligible effect on oil recovery.
Of the 46 Tcf of natural gas originally in place in the Prudhoe Bay field, 30 Tcf resides in the gascap and 16 Tcf lies within the oil rim. Natural gas (containing 12% CO2) is currently being produced at arate of about 8 Bcf/D from PBU as part of oil production operations. The heavier components of the pro-duced gas are removed and shipped to market as natural gas liquids (NGL) or used as miscible injectant torecover crude oil. Some of the lean gas is used as fuel and the remainder (about 7 Bcf/D) is reinjectedinto the gas cap. Of the original 46 Tcf in place, over 2.8 Tcf have been used as fuel for heating or sold asNGL to date.
Current Status of Gas Commercialization Efforts
Commercializing or marketing the natural gas residing on the North Slope has been a major goalof the field operators since the Prudhoe Bay field was first unitized. Recently, efforts to arrive at an eco-nomic marketing plan have intensified. The two schemes receiving the most consideration are an LNGoption and a GTL option. The LNG scheme involves constructing an 800-mile gas pipeline, an LNG fa-cility in Valdez, AK, and shipping LNG to Asia via LNG tankers. The GTL scheme involves construct-ing a GTL plant on the North Slope and transporting the GTL product through TAPS and to market viaregular oil tankers. However, neither scenario has been selected exclusively as the preferred method tomarket the large gas resource on the North Slope.
In January 1998, the Alaska Department of Natural Resources released a report entitled AlaskaNorth Slope Gas Commercialization Team – Report to the Governor. This report discussed ways theState of Alaska and the federal government could improve the economic feasibility and competitivenessof a North Slope gas project and focused almost exclusively on the LNG option. It addressed ways thestate could lower taxes or change the tax structure to increase the economic viability of a North Slope gasproject.
In letters attached to the Report to the Governor, ARCO, BP, and Exxon commented on the con-tents of the report and general gas-commercialization efforts. ARCO expressed concern that despite theState’s efforts, an LNG project may still be undercut by higher rate-of-return projects from around theworld to provide anticipated Far East markets. BP encouraged the state to address the fiscal and regula-tory system with respect to the emerging GTL technology as well. Exxon urged the State to maintainadequate flexibility to address the special needs of any stranded gas project, whether it be LNG or GTL.

vii
Review of LNG with Respect to Alaska
In 1997, total world LNG imports were 81.759 million tons, of which, 61.728 million tons wentto East Asia, or 75% of world LNG imports. Japan imported 47.106 million tons, Korea imported 11.457million tons, and Taiwan imported 3.165 million tons in 1997. Japan imports LNG from the U.S.A.(Alaska), Brunei, Abu Dhabi, Indonesia, Malaysia, Australia, and Qatar.
LNG demand in East Asia is expected to rise to 80 million tons in 2000, 100 million tons in 2005,and 130 million tons in 2010. There are many new potential LNG supply sources competing to fill thisgrowing market. These include Qatar, Oman, and Yemen in the Middle East; Malaysia and Indonesia inAsia; the north and northwest areas of Australia; and Sakhalin and Alaska in the north Pacific. Whetheran ANS gas project can compete with these or other new sources of LNG remains to be seen.
To help the commercialize the ANS gas, the state of Alaska passed the Alaska Stranded Gas De-velopment Act in 1998 that authorized the state to negotiate payments from sponsors of the proposed gaspipeline in lieu of taxes that otherwise would be imposed. Changes in the federal tax structure and reduc-tions in capital costs are more important to the economics of a project than changes in state tax structure.Nevertheless, the state tax restructuring enabled by the State’s Stranded Gas Act would help the econom-ics of the project, especially if combined with federal tax changes and reductions in capital costs.
Review of GTL Technologies
The GTL process evaluated in the 1996 DOE report was taken from information regarding theShell middle-distillate synthesis technology. Since that time, several competing technologies have beenpublicly discussed that could significantly improve the economics of GTL technology.
Most of the new GTL information has come from Exxon and Syntroleum, two companies withcompeting GTL processes. Both processes are based on the Fischer-Tropsch (FT) technology, but eachuses a different method to produce the syn-gas used as a feed into the FT process and different catalysts inthe FT reactor. Syntroleum has perhaps been an open promoter of GTL technology and has presentedmuch of their progress and technology details. ARCO, a major ANS gas owner, has a license agreementwith Syntroleum and began operations of a 70-bbl/D pilot plant of the GTL technology in WashingtonState in 1999. Exxon operated a pilot-scale GTL plant in Baton Rouge, LA from 1990 to 1993 and isstudying application of GTL on the North Slope and elsewhere with data from that plant.
Capital Costs
A feasibility study of applying Exxon’s Advanced Gas Conversion for the 21st Century (AGC-21)technology to produce 50,000 B/D of middle distillates and other oil based products from 500 millioncubic feet of gas was completed jointly by Exxon and Qatar General Petroleum Corp. Capital costs forthe project were estimated to be $1.2 billion – or $24,000 per daily barrel (DBL) of capacity. Other re-cent reports estimate capital costs for a generic GTL plant to range from $35,000 per daily barrel (DBL)down to $12,000/DBL. Based on these reports, capital costs for a generic GTL plant located on the GulfCoast are assigned a value of $24,000/DBL for this report, equal to the capital costs calculated in theExxon/Qatar feasibility study.
When considering an installation on the North Slope, a capital cost factor between 1.3 and 2.0 isapplied to account for factors intrinsic to the ANS for installations originally cost-estimated for the U.S.Gulf Coast area. A North Slope capital cost factor of 1.5 is used to calculate capital costs in this report.

viii
Applying the 1.5 North Slope capital cost factor to the base value of $24,000/DBL for the generic GTLplant yields capital costs for a North Slope location of $36,000/DBL.
Costs for first-of-a-kind plants do not often represent the costs of a mature technology. As moreplants are built, costs for succeeding plants have historically been reduced. This is called taking advan-tage of the “learning curve”. The cost improvement slope for a large GTL plant is estimated to be -0.74,which means that for each doubling of cumulative industry production, costs decline to about 74 percentof what they were prior to that doubling. If the GTL plant were constructed in stages, costs of succeedingdeployments of the technology would presumably be less than previous versions.
Economic Evaluations
Evaluating both the Prudhoe Bay field model and the gas project model is necessary to effectivelyevaluate the scenarios being considered and are tied together by the natural gas transfer price. The trans-fer price is calculated with the use of the “net back” term. The “net back” refers to the ‘net’ fraction ofthe gas price sold by the gas project (GTL plant or LNG project) that is returned ‘back’ to the PrudhoeBay unit operators as payment for the gas.
Scenarios Evaluated
Three GTL scenarios, one LNG scenario, and one no-gas-sales scenario were evaluated:
• The No Major Gas Sales scenario consists of continuing with current operations utilizing thenatural gas to maximize oil production. Under this scenario, oil production continues until2025, when the economic limit of the Prudhoe Bay field is reached.
• The Natural Gas Pipeline/LNG Project scenario takes natural gas from Prudhoe Bay begin-ning in 2005 and reaches a maximum rate of 2.0 Bcf/D in 2009. Gas, at a rate of 0.5 Bcf/D,from the Point Thomson unit, which lies 50 miles east of Prudhoe Bay, is also fed into thisscenario.
• A Fast-Paced GTL Development scenario consists of constructing a 300,000-B/D GTL plant(2.5 Bcf/D feed rate) on the North Slope to match the timing and volumes proposed in theLNG scenario.
• A Slower-Paced GTL Development scenario consists of a GTL plant construction scheduledesigned to take advantage of the learning curve associated with implementation of newertechnologies. Located on the North Slope, the plant takes gas from Prudhoe Bay at a rate of0.5 Bcf/D beginning in 2005. In 2010, a new GTL module of the same capacity is in place;with a new 0.5 Bcf/D module being constructed every 5 years until a total capacity of 2.5Bcf/D (300,000 bbl/D) is reached.
• A 300,000-B/D GTL plant (fast-paced) is located in Valdez, AK. This scenario assumes thatthe natural gas pipeline is built and a tariff is charged to the gas passing through the line. Theassumed gas purchase rate is equal to the LNG scenario. A lower capital-cost factor of 1.2 isapplied at the Valdez location as opposed to the 1.5 capital cost factor associated with a NorthSlope location.

ix
TAPS Tariff Discussion
The tariff that is charged for transporting liquid through the Trans-Alaska Pipeline System(TAPS) is an important economic parameter. The tariff calculation is based on costs to operate the pipe-line, future investments, pipeline profit, and liquid flowrate through the pipeline. TAPS tariffs are a veryimportant part of an analysis of projects that produce liquids from the North Slope of Alaska. The sametariff is applied to all liquids passing through the pipeline; whether it be crude oil, natural gas liquids, orproduct from a GTL plant. A higher transportation tariff reduces the value of the wellhead product.
GTL liquids increase the flow rate through TAPS, thus lowering the tariff. The LNG option re-duces the flow rate through TAPS by decreasing the oil recovery, which increases the TAPS tariff. TAPStariffs can positively or negatively impact the economic potential of all oil-producing fields on the NorthSlope, not only the Prudhoe Bay and the Point Thomson units. The benefit of lowering TAPS tariffs be-cause of the addition of GTL products to these other fields is not quantified in this report, but is expectedto be significant as a whole.
Economic Results
A deterministic evaluation of the economic viability of the scenarios outlined above was accom-plished by discounted cash flow analysis. (Refer to section 6.2 of the full report for an explanation anddiscussion of discounted cash flow analysis.) Results of the economic evaluations are best represented bythe net present value of the project. The term NPV10 represents the net present value evaluated at a dis-count rate of 10%. Summary Table 1 lists the results of the evaluation for four of the scenarios.
Summary Table 1. Economic evaluations of major gas sales scenarios for the North Slope of Alaska.
Of the scenarios analyzed in Summary Table 1, only the slow-paced GTL development scenariohas a positive, incremental combined net present value using a discount rate of 10%. However, a negativeNPV10 means that its rate of return is less than the discount rate of 10% and does not necessarily meanthat a project loses money.
The gas sales revenues of slow-paced North Slope GTL plant are realized later in the life of thisscenario than in the fast-paced GTL scenarios and the LNG scenario, which tends to decrease the net pre-sent value of the project. However, the savings in capital costs associated with the “learning curve” thatare incorporated into this option outweigh the added discount in revenue caused by delaying the gas sales.
Scenario Entity NPV10 ($, millions)
Incremental Prudhoe Bay unitGas-pipeline/LNG-plant
589-2,991
Major gas sales to gas-pipeline/LNG-plant
Total -2,402
Incremental Prudhoe Bay unitGTL plant
914-1,297
Major gas sales to GTLplant on North Slope (fast-paced) Total -383
Incremental Prudhoe Bay unitGTL plant
542-1,908
Major gas sales to a GTLplant in southern Alaska(fast-paced) Total -1,366
Incremental Prudhoe Bay unitGTL plant
-113945
Major gas sales to GTLplant on North Slope (slow-paced) Total 832

x
A fast-paced GTL plant in southern Alaska (Valdez) was compared to the fast-paced GTL planton the North Slope. Locating the plant at an ice-free port could potentially be economically attractivecompared to a North Slope location. Capital costs would be less than the North Slope because of reducedshipping, labor, and materials costs. In the economic evaluation, the capital cost factor was lowered from1.5 (for the North Slope location) to 1.2. The other major change in evaluations is the additional price ofthe natural gas at Valdez. The $6 billion gas pipeline transporting natural gas from the North Slope toValdez would still be constructed; adding about $0.80/Mcf to the gas feed cost.
Sensitivity Analysis
There are many sensitivity analyses that could be run on these evaluations. Learning the ramifi-cations of varying input parameters is important to understanding project economics. As this report wasprimarily concerned with economics of gas-to-liquids technology Alaska, sensitivities were performedonly on the GTL plant portion of the total scenarios. The field portion of the scenarios was not furtherincluded in the sensitivity analyses.
The object of the analyses was to determine which input parameters cause the greatest effect onproject economics. This information is vital in determining those parameters that offer the greatest po-tential for increasing or decreasing economic viability. These parameters require the most attention andare natural targets for further study by increasing research efforts.
Summary Figure 1 shows results from a sensitivity analysis of the input data for the slow-pacedGTL plant development. The numbers on each end of the respective horizontal bars indicate the possiblerange of the variable in question; while the length of the bar represents that variable’s effect economicoutput. The vertical “most likely” line on the figure indicates the default value for each variable.
The four most critical variables, as seen in Summary Figure 1, are the Gulf Coast GTL plant cost,the world oil price, the North Slope cost factor, and the GTL liquids per barrel premium. The ROR usingthe most likely values for each of the variables is 10.9 percent as shown in Summary Figure 1.
9.0% 10.0% 11.0% 12.0% 13.0%
GTL liquids BTU (BTU/bbl)
State income tax rate
Natural gas BTU (BTU/SCF)
GTL plant efficiency
Federal income tax rate
Cost improvement rate
O & M cost factor ($/bbl)
GTL liquids premium ($/bbl)
North Slope cost factor
Flat oil price ($/bbl)
Gulf coast plant cost ($/DBL)
Rate of return
15,00030,000
15 20
1.32.0
1.5 5.0
7.0 4.5
0.55 0.62
1050 1200
5.75.8
-0.85 -0.70
0.35 0.28
0.047 0.030
most likely
Summary Figure 1 - Sensitivity of input parameters with respect to
project economics for the slow-paced GTL plant deployment.

xi
Monte Carlo analysis
The Monte Carlo simulation technique permits a “probabilistic analysis” of project economics byapplying probability distributions to the input parameters as opposed to the deterministic results tabulatedin Summary Table 1. Probabilistic sensitivity analyses do not compute a single result; instead, the out-come is a range of possible results.
Summary Figure 2 is a plot of the probability-of-occurrence versus rate-of-return for a slow-paced GTL plant development on the North Slope. Possible rates of return for a slow-paced GTL devel-opment on the North Slope can range from 8.7 percent to 13.1 percent. Applying a 90 percent confidenceinterval sets the rate or return between 9.8 percent and 11.9 percent. The median value of 10.8 percentindicates that half of the time, a rate of return calculation would return a value of 10.8 percent or greater.The standard deviation is 0.7 percent, which demonstrates that the results are tightly centered on the aver-age of 10.8 percent.
Conclusions
The purposes of this report were to identify and explore the effect of applying new technology tothe economics of a proposed GTL plant, to evaluate the potential of a slower-paced deployment of GTLtechnology, and to evaluate the effect of GTL plant placement on economics.
Of the gas marketing scenarios evaluated, results indicate that the slow-paced GTL scenario is theonly one with a rate of return greater than 10 percent. The other scenarios did not show positive net pres-ent values under the economic conditions selected for the simulations. Their rank, in order of net presentvalue, is as follows: slow-paced GTL development, no-major-gas-sales, fast-paced GTL development,fast-paced GTL development in southern Alaska, and finally a gas-pipeline/LNG project.
The slow-paced GTL development would allow cost savings on subsequent expansions. Theseassumed savings along with the lowering of the transportation tariff combine to distinguish this option for
0.00
0.02
0.04
0.06
0.08
0.10
0.12
0.14
0.16
8.5
%
8.9
%
9.4
%
9.9
%
10
.3%
10
.8%
11
.3%
11
.7%
12
.2%
12
.7%
13
.1%
Rate of return
Pro
ba
bil
ity
Slow-paced GTL development
Summary Figure 2 – Frequency of the rate of return for a
slow-paced GTL plant development after 10000 iterations.

xii
marketing the North Slope gas from the other scenarios. Critical variables that need further considerationinclude the GTL plant cost, the GTL product premium, and operating and maintenance costs. Reducingthese costs or increasing the premium could dramatically increase the profitability of the GTL process.Understanding these variables better and reducing their uncertainty would allow a more accurate predic-tion of economic profitability. Further study of these variables (GTL plant cost, GTL product premium,and O & M costs) is recommended. In addition, a study to quantify the benefit of a tariff reduction causedby a North Slope GTL plant to the economics of other fields (besides Prudhoe Bay) is also recommended.

xiii
ACKNOWLEDGMENTS
This work was funded by the U.S. Department of Energy's National En-ergy Technology Laboratory (U.S. DOE-NETL) from the Natural GasProcessing and Utilization division of Emerging Processing TechnologyApplications managed by Venkat Venkataraman.
The author acknowledges the significant role played by Ralph Avellanetof the U.S. DOE – Fossil Energy and Daniel Driscoll of the U.S. DOE-NETL in providing programmatic guidance and review of this report.Richard Rice of the Idaho National Engineering & Environmental Labo-ratory (INEEL) and manager of Fossil Energy Technologies, providedoverall guidance on the scope of the report. Charles Thomas, also of theINEEL and program manager, provided critical review of the report andmade contributions to the contents.
xv
CONTENTS
ABSTRACT............................................................................................................................................. iii
EXECUTIVE SUMMARY...................................................................................................................... v
ACKNOWLEDGMENTS........................................................................................................................ xiii
1. INTRODUCTION................................................................................................................................ 1
1.1 Purpose.................................................................................................................................. 2
2. OVERVIEW OF NORTH SLOPE FIELDS AND PRODUCTION.................................................... 2
2.1 ANWR Update ...................................................................................................................... 2
2.2 Future Leasing Rounds.......................................................................................................... 2
2.3 Prudhoe Bay Field................................................................................................................. 2
2.3.1 Development Plans................................................................................................ 3
2.3.2 Production Forecasts and Recoverable Oil ........................................................... 3
2.3.3 Prudhoe Bay Investments...................................................................................... 4
2.3.4 Operating Costs..................................................................................................... 4
2.3.5 Transportation Costs ............................................................................................. 5
2.3.6 Lost Oil Recovery Due to Major Gas Sales .......................................................... 5
2.3.7 Gas Production from Prudhoe Bay........................................................................ 6
3. CURRENT STATUS OF GAS COMMERCIALIZATION EFFORTS.............................................. 6
4. BRIEF REVIEW OF LNG STATUS................................................................................................... 7
5. STATUS OF GTL TECHNOLOGIES................................................................................................. 8
5.1 Advances in GTL Technology .............................................................................................. 8
5.2 Pipeline Transport of the GTL Product................................................................................. 9
5.3 Value of the GTL Product..................................................................................................... 9
5.4 Capital Costs ......................................................................................................................... 10
5.4.1 Capital Costs – Alaska North Slope...................................................................... 10
6. ECONOMIC EVALUATIONS ........................................................................................................... 12

xvi
6.1 Economic Input Variables..................................................................................................... 12
6.1.1 Oil Prices............................................................................................................... 13
6.1.2 Inflation ................................................................................................................. 13
6.1.3 Discount Rate ........................................................................................................ 14
6.1.4 Taxes ..................................................................................................................... 14
6.2 Method of Economic Evaluation........................................................................................... 14
6.2.1 Relationship between Prudhoe Bay and Gas Project ............................................ 16
6.3 Results of Economic Evaluations.......................................................................................... 17
6.3.1 Scenarios Evaluated .............................................................................................. 17
6.3.2 TAPS Tariff Discussion ........................................................................................ 18
6.3.3 Results ................................................................................................................... 19
6.3.4 Discussion of Results ............................................................................................ 20
6.3.5 Sensitivity Analyses .............................................................................................. 23
6.3.6 Monte Carlo Analysis ........................................................................................... 24
7. SUMMARY ......................................................................................................................................... 27
8. APPENDIX .......................................................................................................................................... 29
9. REFERENCES..................................................................................................................................... 35
FIGURES
Figure 1. Well penetrations in the Prudhoe Bay field............................................................................ 3
Figure 2. Oil production forecast for the Prudhoe Bay unit and the entire North Slope ....................... 4
Figure 3. Water-cut curve used to calculate operating costs for the Prudhoe Bay unit ......................... 4
Figure 4. TAPS tariff forecast for scenario with no major gas sales ..................................................... 5
Figure 5. Marine tariff forecast.............................................................................................................. 6
Figure 6. Historical and forecast world oil prices. Data from Energy Information Admini-stration.................................................................................................................................... 13
Figure 7. Historical and projected annual inflation rate ........................................................................ 14

xvii
Figure 8. Flow chart describing economic evaluations and relationships between data filesand models.............................................................................................................................. 16
Figure 9. TAPS tariff forecasts in 1998$ for four scenarios.................................................................. 19
Figure 10. NPV calculations for gas sales to LNG scenario.................................................................... 21
Figure 11. NPV calculations for gas sales to GTL plant (fast-paced) scenario ....................................... 21
Figure 12. NPV calculations for gas sales to GTL plant (slow-paced) scenario ..................................... 22
Figure 13. NPV calculations for gas sales to a GTL plant (fast-paced) in southern Alaska.................... 22
Figure 14. Sensitivity of input parameters with respect to project economics for the slow-paced, staged GTL development scenario.............................................................................. 23
Figure 15. Example of a triangular distribution of an input variable for Monte Carlo analy-sis............................................................................................................................................ 24
Figure 16. Frequency plot of the rate of return for a slow-paced GTL plant developmentafter 10000 iterations.............................................................................................................. 26
Figure 17. Cumulative probability of occurrence for the rate of return of a slow-paced GTLplant development .................................................................................................................. 26
TABLES
Table 1. Economic evaluations of major gas sales scenarios for the North Slope ofAlaska..................................................................................................................................... 19
Table 2. Minimum, maximum, and most likely values for triangular distributions used inMonte Carlo analysis.............................................................................................................. 25

1
Options for Gas-to-Liquids Technology in Alaska
1. INTRODUCTION
The Alaska North Slope (ANS) holds a vast resource of natural gas that could be of great benefitnot only to Alaska, but to the whole United States and other countries provided an economical schemecould be developed to transport the gas from the North Slope. Currently, the produced gas is being rein-jected to effectively increase oil recovery, but will have greater economic benefit if able to be transportedfrom the North Slope to world markets as oil production wanes in the future. The Prudhoe Bay fieldcontains the largest portion of the discovered natural gas on the North Slope or about 21.8 Tcf of naturalgas available for sale after CO2 removal and satisfying power requirements and other North Slope use.
This report focuses on the economics of applying technology that converts natural gas to high-quality liquid transportation fuels as a method to market the North Slope gas. In 1996, the Idaho NationalEngineering & Environmental Laboratory (INEEL) published a report for the U.S. Department of Energyentitled “Economics of Alaska North Slope Gas Utilization Options,” by Thomas, et al.1 In that report,which will be referred to as the 1996 DOE report, three gas marketing scenarios were compared. Sce-
nario 1 was to continue oil production operations with no major natural gas sales. Scenario 2 was toconstruct an 800-mile natural gas pipeline paralleling the trans-Alaska oil pipeline system (TAPS) andconvert the natural gas to liquefied natural gas (LNG) at or near Valdez, AK; marketing the LNG in theAsian Pacific Rim via LNG tankers. Scenario 3 was to build a gas-to-liquids (GTL) plant on the NorthSlope that would convert an equivalent quantity of natural gas into a stable, liquid fuel that would then betransported through TAPS – marketing the GTL product on the U.S. West Coast as transportation fuel.
Since 1996, new information regarding GTL technology has been released to the public that ap-pears to enhance the economic viability of the GTL project option for marketing ANS gas and was notincorporated in the 1996 DOE study. The objective of this current report is to expand the work completedin the 1996 DOE report and to conduct a focussed, follow-up investigation to that work. Specifically, toincorporate new information regarding GTL technology, and to look at the development-pace and place-ment of a GTL project. It has been argued that by constructing a large GTL facility in stages, one couldtake advantage of the learning curve associated with new technologies and reduce costs of subsequentstages. These cost savings could offset revenue losses associated with the time-value of money.
This report relies on portions of the work performed in the 1996 DOE report. For example, thePrudhoe Bay field analysis, the TAPS tariff calculation methodology, and the framework for the eco-nomic analysis were updated from the 1996 DOE report.
In performing an economic analysis of a gas-marketing scenario involving natural gas from theANS, it is necessary to understand the interrelationship between gas sales and oil revenue. For example,the quantity, timing, and pace of major gas sales can have a major impact on the oil recovery of the Prud-hoe Bay field. The Prudhoe Bay natural gas is currently being used to enhance oil recovery from thefield. If that gas is sold, it becomes unavailable for use in enhanced oil recovery operations, and althoughselling the gas may generate revenue, its use may reduce the revenue generated from oil operations. Theeconomic evaluation of a gas-marketing scenario, therefore, must include an analysis of the entire pro-ducing field – both oil and gas revenues – as well as an analysis of the operations of the gas-marketingscheme.

2
1.1 Purpose
The purposes of this study are:
1) To apply technical advances to the GTL scenario evaluated in the 1996 DOE report to determinethe effects new technology and knowledge have on the economics of the GTL project.
2) To evaluate the potential economic impact of a slower-paced, staged deployment of GTL tech-nology on the North Slope; thus taking advantage of experience and technological improvementsin later plant expansions.
3) To evaluate the concurrent development of both the LNG and GTL projects; with the GTL plantlocated in southern Alaska at the gas pipeline terminus.
2. OVERVIEW OF NORTH SLOPE FIELDS AND PRODUCTION
Oil production is projected to increase from the North Slope within the next five years, reversinga seven-year stretch of continual yearly declines. The increase is expected to be fueled by productionfrom six new fields – Alpine, Badami, Northstar, Liberty, Tarn, and PBU satellites; and by increased pro-duction from Schrader Bluff and West Sak. However, development has been slowed because of de-pressed oil prices in 1998 and early 1999.
2.1 ANWR Update2
The U.S. Geological Survey’s (USGS) mid-range estimate for oil-in-place under the 1002 area inthe Arctic National Wildlife Refuge was increased in May 1998 to 20.7 billion barrels, up from 13.8 bil-lion barrels estimated in 1987. The mid-range estimate of recoverable oil from this area was raised to10.3 billion barrels.
Several developments have influenced the understanding of oil potential in the area. Exploratorywells, such as those recently drilled in the Sourdough area,3 have provided new geologic data for theUSGS assessment. Seismic information from older wells drilled in the area was given to the USGS. Ad-vances in processing older 2-D seismic data have been developed and were used by the assessment team.Finally, cost-cutting and technological advances have reduced the minimum field size for stand-aloneeconomic development from 400 to 500 million barrels down to 100 million barrels.
2.2 Future Leasing Rounds
The U.S. Department of Interior (DOI) announced in 1998 that 4 million acres in the northeastcorner of the National Petroleum Reserve in Alaska – just to the west of the Alpine field, ARCO’s dis-covery on the Colville River delta – would be available for leasing. The Interior Department estimatesthe reserve’s northeast quadrant holds from 500 million barrels to 2.2 billion barrels of recoverable crudeoil.4
2.3 Prudhoe Bay Field
The Prudhoe Bay field is the largest field in North America and lies on the Arctic coastline about200 miles east of Point Barrow. There were about 23 billion barrels of oil originally in place (OOIP) and46 Tcf of gas originally in place. Ultimate oil-recovery estimates have been increasing over the years as

3
more is learned about the field and as enhanced oil recovery techniques and cost reduction efforts con-tinue to improve.
2.3.1 Development Plans
As of early 1998, development plans indicated that 105 penetrations were planned for the Prud-hoe Bay field in 1998 – 51 coiled tubing sidetracks, 33 will be conventional sidetracks, and 21 newwells.5 In 1999 and 2000, 115 penetrations are planned per year – 61 coiled tubing sidetracks, 32 con-ventional sidetracks, and 22 new wells. Development plans for years 2001 to 2005 were extrapolatedfrom historical data to 50 penetrations per year and the same ratio of penetration types was assumed.6 Nonew well penetrations were assumed beyond the year 2005 as shown in Fig. 1.
2.3.2 Production Forecasts and Recoverable Oil
Production curves in this report are forecasted through 2025 for the entire North Slope as well asfor the Prudhoe Bay unit. Forecasts were taken from data supplied by the Alaska Division of Natural Re-sources – Division of Oil and Gas (ADNR–DOG), which forecasts only through the year 2020.7 Oil pro-duction for the Prudhoe Bay field in 2020 is projected to be equal to 223 Mbbl/D, which is greater thanthe assumed minimum rate of 160 Mbbl/D necessary for economic viability of the field.a This indicatesthat more oil will be produced from Prudhoe Bay beyond 2020. An exponential decline rate of 0.054 yr-1
was calculated from data between 2005 and 2020 and was applied to a five-year extrapolation of theADNR–DOG forecast, which extended the forecast to 2025 as shown in Fig 2. Extending Prudhoe Bayproduction until 2025 brings the production rate down to 169 Mbbl/D, which is in line with industry’sassumed minimum rate for the field.
Ultimate recovery from the Prudhoe Bay unit (PBU) was estimated to be 13.0 billion barrels inthe 1996 DOE report. However, Platt’s Oilgram has reported that ultimate recovery could be higher than13 billion barrels.8 In addition, according to the 1998 ADNR–DOG oil production forecast, the ultimaterecovery from PBU is expected to be 13.32 billion barrels. By extrapolating the forecast data another fiveyears the expected ultimate recovery from PBU used in this study was increased to 13.67 billion barrels.
a Personal communication with industry representatives, March 1998.
0
100
200
300
400
500
600
1980-
1984
1985-
1989
1990-
1994
1995-
1999
2000-
2004
2005-
2009
Pen
etr
ati
on
s/y
ear
Figure 1 - Well penetrations in the Prudhoe Bay field.

4
2.3.3 Prudhoe Bay Investments
Estimates of future investments were based on drilling plans; current drilling costs; and plannedsurface facilities costs (see section 2.3.1). The cost of the average well penetration has been reduced fromthe $2.2 million used in the 1996 DOE report to $1.5 million.9 Investment for expansion of the ongoingmiscible injectant project is expected to total $165 million and is scheduled to be completed by 2000.
2.3.4 Operating Costs
Operating costs are estimated based on a cost per barrel of total fluid (BTF) produced. The fore-cast for future total fluid produced was obtained by plotting the water cut – obtained from historical Prud-hoe Bay production data – versus percent recovery and extrapolating to 75% water cut at 100% of ulti-mate recovery, as shown in Fig. 3. The water cut is defined as the fraction of the total produced fluid thatis water. The operating cost factor of $1.180/BTF used in this study was inflated to 1998$ from the oper-
0
500
1,000
1,500
2,000
2,500
19
70
19
75
19
80
19
85
19
90
19
95
20
00
20
05
20
10
20
15
20
20
20
25
Mb
bl/
DTotal ANS Prudhoe Bay
ForecastHistory
Figure 2 - Oil production forecast for the Prudhoe Bay unit and the
entire North Slope.
0.001
0.01
0.1
1
0 0.2 0.4 0.6 0.8 1
Fraction of ultimate recovery
Wa
ter
cu
t
Figure 3 – Water-cut curve used to calculate operating costs for the
Prudhoe Bay unit.

5
ating-cost factor used in the 1996 DOE report.
2.3.5 Transportation Costs
Transportation costs are the sum of costs associated with transporting the oil through TAPS andthose associated with shipping the oil from Valdez to world markets. Both costs are calculated as tariffs:a TAPS tariff and a marine tariff.
2.3.5.1 TAPS Tariff. The TAPS tariff used in this report uses the same methodology as in the 1996DOE report; however, the values of input variables have been updated to reflect 1998 values and forecastsof expenditures. Yearly tariffs used in the economic evaluations are based on total liquid throughput,pipeline operating expenses, and allowable margin. The calculated TAPS tariff for scenario 1 (no futuremajor gas sales) is shown in Fig. 4. TAPS tariff forecasts for other scenarios and their importance in eco-nomic evaluations are discussed in section 6.3.2.
2.3.5.2 Marine Tariff. The marine tariff values used in transportation calculations are taken from theAlaska Department of Revenue, Fall 1997 Revenue Sources Book, Table 8, and average about $1.80/bbl(1998$) in the future. Forecasted values are shown in Fig. 5.
2.3.6 Lost Oil Recovery due to Major Gas Sales
Oil recovery can be affected by marketing the produced natural gas off the North Slope as op-posed to using it to enhance oil production according to the 1996 DOE report. If major gas sales begin in2005, 400 million bbl of oil is assumed lost. This would occur because of the unavailability of the gas foruse in highly effective enhanced oil recovery programs such as pressure maintenance, miscible injectantflooding, and water-alternating-gas programs. Later major gas sales would have a lesser impact on oilrecovery simply because there would be less oil available to recover. Major gas sales beginning in 2010are assumed to cause a loss of 100 million bbl; and gas sales beginning in 2015 would have a negligibleeffect on oil recovery.
$0.00
$0.50
$1.00
$1.50
$2.00
$2.50
$3.00
$3.50
$4.00
$4.50
$5.00
19
95
20
00
20
05
20
10
20
15
20
20
20
25
20
30
1998$/b
bl
Figure 4 - TAPS tariff forecast for scenario with no major gas
sales.

6
2.3.7 Gas Production from Prudhoe Bay
Of the 46 Tcf of natural gas originally in place in the Prudhoe Bay field, 30 Tcf resides in the gascap and 16 Tcf lies within the oil rim.1 Natural gas (containing 12% CO2) is currently being produced at arate of about 8 Bcf/D from PBU as part of oil production operations. The heavier components of the pro-duced gas are removed and shipped to market as natural gas liquids (NGL) or used as miscible injectant torecover crude oil. Some of the lean gas is used as fuel and the remainder (about 7 Bcf/D) is reinjectedinto the gas cap. Of the original 46 Tcf in place, over 2.8 Tcf have been used as fuel for heating or sold asNGL to date.
A recovery factor of 80 percent is assumed to apply to the gas in the gas cap and a recovery factorof 60 percent to the gas in the oil rim. Recoverable gas in the gas cap is then 24 Tcf and oil rim gas is 9.6Tcf for a total of 33.6 Tcf of recoverable gas. A total of 8.8 Tcf are expected to be unavailable for saledue to total lease use, local sales, NGL sales, and shrinkage, which leaves net gas (including CO2) of 24.8Tcf. Removing the CO2 lowers the net gas available for sale from PBU to 21.8 Tcf.
3. CURRENT STATUS OF GAS COMMERCIALIZATION EFFORTS
Commercializing or marketing the natural gas residing on the North Slope has been a major goalof the field operators since the Prudhoe Bay field was first unitized. Recently, efforts to arrive at an eco-nomic marketing plan have intensified. Two scenarios receiving the most consideration are an LNG op-tion and a GTL option. The LNG scenario involves constructing an 800-mile gas pipeline, an LNG facil-ity in Valdez, AK, and shipping LNG to Asia via LNG tankers. The GTL scenario involves constructinga GTL plant on the North Slope and transporting the GTL product through TAPS and to market via regu-lar oil tankers. However, neither scenario has been selected exclusively as the preferred method to marketthe large gas resource on the North Slope.
In January 1998, the Alaska Department of Natural Resources released a report entitled AlaskaNorth Slope Gas Commercialization Team – Report to the Governor.10 This report discussed ways theState of Alaska and the federal government could improve the economic feasibility and competitivenessof a North Slope gas project and focused almost exclusively on the LNG option. It addressed ways the
1995 2000 2005 2010 2015 2020
$0.00
$0.50
$1.00
$1.50
$2.00
$2.50
$3.00M
ari
ne
ta
riff
(1
99
8$
/bb
l)
Figure 5 - Marine tariff forecast.

7
state could lower taxes or change the tax structure to increase the economic viability of a North Slope gasproject.
In letters attached to the Report to the Governor, ARCO, BP, and Exxon commented on the con-tents of the report and general gas-commercialization efforts. ARCO expressed concern that despite theState’s efforts, an LNG project may still be undercut by higher rate-of-return projects from around theworld to provide anticipated Far East markets. BP encouraged the state to address the fiscal and regula-tory system with respect to the emerging GTL technology as well. Exxon urged the State to maintainadequate flexibility to address the special needs of any stranded gas project, whether it be LNG or GTL.
ARCO has constructed a GTL pilot plant at Cherry Point, its refinery in Washington State, whereit is conducting research on catalysts and reactor design technology and employs a GTL approach thatuses air instead of oxygen to generate syn-gas. Catalyst selection and process reactor design changes arebeing studied to help reduce the costs of GTL technology.11
In July 1998, Exxon Corporation formed a study group to look at the potential for a gas-to-liquidsplant on Alaska’s North Slope. Although Exxon considers liquefied natural gas as the first option forAlaska’s Arctic gas reserves, the company believes there is enough gas on the North Slope for both anLNG and a GTL project.12
Yukon Pacific Corporation (CSX Corporation) reported in August 1998 that the cost to constructthe 800-mile gas pipeline could be reduced by $1 to $2 billion if the latest pipeline engineering technol-ogy was incorporated in the line’s construction cost estimates.13
Also in August 1998, it was announced that a group of five companies signed the Alaska NorthSlope (ANS) Gas Project Sponsor Agreement.14 The agreement is meant to identify a viable project fortransporting a portion of the vast ANS stranded gas reserves to markets in East Asia in the form of lique-fied natural gas. The initial phase of the agreement will cover a four-year period costing approximately$100 million, will focus primarily on defining costs and minimizing economic uncertainty, and will ad-dress possible pipeline routes, engineering, permitting, and commercial work of all aspects of the project.Companies involved in the agreement included ARCO Alaska, Inc. 37%, Foothills Pipe Lines Ltd. 22%,Marubeni Corporation 17%, Phillips Petroleum Company 12%, and CSX Corporation 12%. However, inAugust 1999, CSX withdrew from the group, opting to focus solely on a preferred gas pipeline to Valdezroute.
4. BRIEF REVIEW OF LNG STATUS
In 1997, total world LNG imports were 81.759 million tons, of which, 61.728 million tons wentto East Asia, or 75% of world LNG imports. Japan imported 47.106 million tons, Korea imported 11.457million tons, and Taiwan imported 3.165 million tons in 1997.15 Japan imports LNG from the U.S.A.(Alaska), Brunei, Abu Dhabi, Indonesia, Malaysia, Australia, and Qatar.16
LNG demand in East Asia is expected to rise to 80 million tons in 2000, 100 million tons in 2005,and 130 million tons in 2010.16 There are many new potential LNG supply sources competing to fill thisgrowing market. These include Qatar, Oman, and Yemen in the Middle East; Malaysia and Indonesia inAsia; the north and northwest areas of Australia; and Sakhalin and Alaska in the north Pacific.16 Indone-sia’s Tangguh Project boosted proved reserves, critical to the formation of an LNG project, dramaticallyfrom 6.3 Tcf reported in 1997 to 14.4 Tcf as of July 31, 1998.17 Whether an ANS gas project can com-pete with these or other new sources of LNG remains to be seen.

8
The state of Alaska passed the Alaska Stranded Gas Development Act in early 1998 that author-ized the state to negotiate payments from sponsors of the proposed gas line in lieu of taxes that otherwisewould be imposed. These taxes include state and local property taxes, sales and use taxes, production orseverance tax, and state corporate income tax. In addition, it provides municipalities the option of an eq-uity interest in the project in lieu of taxes. The Act was written exclusively for the gas pipeline/LNG op-tion, excluding the potential gas-to-liquids scenario for marketing ANS gas.18
According to a report by Pedro van Meurs, changes in the federal tax structure and reductions incapital costs are more important to the economics of a project than changes in state tax structure. 19 Nev-ertheless, the state tax restructuring accomplished by the State’s Stranded Gas Act would help the eco-nomics of the project, especially if combined with federal tax changes and reductions in capital costs.20
5. STATUS OF GTL TECHNOLOGIES
The GTL process evaluated in the1996 DOE report was based on the Shell middle-distillate syn-thesis technology as discussed in the J. Eilers et al. paper: “The Shell Middle Distillate Synthesis Process(SMDS).”21 This paper was written before Shell’s Bintulu, Malaysia plant began operation in 1992.Since that time, several competing technologies have been brought to light that could significantly im-prove the economics of GTL technology.
5.1 Advances in GTL Technology
The Alaska Department of Revenue compiled a brief comparison of six gas-to-liquid technolo-gies:
1) A basic Fischer-Tropsch (F-T) technology,2) Sasol’s F-T technology,3) Exxon’s AGC-21,4) BP’s compact steam reformer,5) Syntroleum’s diluted nitrogen technology, and6) An F-T process using DOE’s Ceramic Membrane.
This comparison (shown in the Appendix) gives capital costs per barrel of liquid product andO&M costs per barrel of liquid product. The values given have been generated from publicly availabledata, but not necessarily from existing plants. The Appendix compares not only costs, but explains eachprocess and notes differences in technology and approach.
Syntroleum has been a vigorous promoter of GTL technology and has presented some details oftheir progress and technology. It has taken the approach of using air instead of pure oxygen in the syn-gas generation step of the GTL process. In February 1998, SLH Corp, Syntroleum’s parent corporationannounced plans to build an 8,000 B/D gas-to-liquids plant in Sweetwater County, Wyoming in conjunc-tion with Enron Corp.22 ARCO has a license agreement with Syntroleum and began operation of a pilotplant of the GTL technology in Washington State in 1999.
Exxon operated a pilot-scale plant in Baton Rouge, LA from 1990 to 1993 and is studying appli-cation of GTL on the North Slope with data from that plant. In October in 1996, the Wall Street Journalreported that Exxon was holding talks with Qatar to build a GTL plant utilizing that country’s vast naturalgas resources. Although the project apparently fell through, a feasibility study of applying Exxon’s Ad-vanced Gas Conversion for the 21st Century (AGC-21) technology was completed jointly by Exxon andQatar General Petroleum Corp. The plant was to produce 50,000 B/D of middle distillates and other oilbased products from 500 million cubic feet of gas per day. Capital costs for the projects were estimated

9
to be $1.2 billion – or $24,000 per daily barrel (DBL) of capacity. Exxon published limited details on itstechnology at industry meetings in 1994 and again in 1995.23,24
The Alaska Department of Revenue’s brief comparison of six gas-to-liquid technologies is thesole source of information located for this report that gives details on the GTL process being explored byBP Exploration (Alaska).
5.2 Pipeline Transport of the GTL Product
Discussions with the Alyeska Pipeline Company were held in March of 1998 on the subject oftransporting the GTL product through the trans-Alaska pipeline system (TAPS). The GTL product couldeither be slugged down the pipeline or shipped concurrently with the crude oil (mixed). Alyeska has donesome calculations on how best to batch the GTL product through the pipeline, if the intent was to slug theproduct to avoid mixing with crude oil. Alyeska indicated that at high pipeline flow rates (around 1000Mbbl/D or above), the mixing zone between the GTL product and the crude oil would be sufficientlysmall to minimize contamination of the GTL product. However, at lower flow rates, a pigging systemcould be used to mechanically separate the two fluids to minimize mixing during pipeline transport. Aly-eska indicated that they have not publicly released any supportive documentation, but if there were a highprobability of a GTL project on the North Slope, a report or paper would be issued.
5.3 Value of the GTL Product
The price of gasoline has averaged $8/bbl over the price of crude oil and diesel has averaged$6/bbl over crude oil over the past 10 years.1 The product from Exxon’s AGC-21 process produces a re-finery feedstock free of most of the impurities found in conventional crude oil; being totally free of sulfur,nitrogen, nickel, vanadium, asphaltenes, multi-ring aromatics, and salt.23 The product-upgrading step of-fers a flexible petroleum-product slate. When operated at relatively low severity, it maximizes feed torefinery catalytic cracking and lubricant production. At higher severity, all catalytic cracker feed boilingmaterial can be eliminated, yielding up to 70% of the liquid product as jet and diesel fuel, with the re-mainder being naphtha. The process is not suitable for the direct production of gasoline; the major impactof this process is on the distillate (heating oil, jet fuel, and diesel) manufacturing industry, the petro-chemical industry, and the lube industry.25
Because the GTL product is a high-quality refinery feedstock, it must pass through a refinery be-fore becoming an end-use product such as diesel fuel or gasoline.23 To arrive at an upper bound for theproduct value, we assume the GTL product is batched through the pipeline and is input into a refinery as aclean feedstock that produces equal amounts of gasoline and diesel. The prices for diesel and gasolinehave historically been about $6.00/bbl and $8.00/bbl over world crude oil price respectively; therefore,the average premium of the refinery output would be $7.00/bbl over the world oil price. By subtractingan assumed gross refinery margin of $2.00/bbl26 from the output price, the GTL product premium be-comes $5.00/bbl over the world crude oil price.
The above methodology for obtaining an upper bound for the value of the GTL product ignorespossible added value based on future sulfur regulations. Because the GTL product is totally free of sulfur,nitrogen, nickel, vanadium, asphaltenes, multi-ring aromatics, and salt, the gasoline and diesel producedfrom the GTL feedstock could be of greater value than gasoline and diesel produced from conventionalcrude oil. Therefore, the premium could conceivably be higher than $5/bbl.
To obtain a lower bound of the product value, it was assumed that the product is of lesser qualityand is shipped together with the crude oil through TAPS and then refined. In this case, diesel or gasoline

10
may not be the primary product and additional refining may be necessary. A lower bound for the GTLproduct premium could be as low as $1.50/bbl over the average price of world crude oil.
The GTL product’s actual value most likely lies somewhere between $1.50 and $5.00 over theworld crude oil price. For this analysis, $3.50/bbl is the assumed GTL product premium over world crudeoil prices.
5.4 Capital Costs
In November of 1996, Salomon Brothers published a report on recent gas-to-liquids advances.27
The majority of their report focussed on Exxon’s process and Syntroleum’s process. The report statesthat the capital cost of a GTL plant is roughly estimated at between $25,000 per daily barrel (DBL) ca-pacity and $35,000/DBL, but suggest capital costs as low as $13,000/DBL are possible. Capital costs forExxon’s 50,000-B/D Qatar project were estimated to be $24,000 per daily barrel (DBL) of capacity.
The East-West Center in Honolulu, HI issued a bulletin, in early 1997 dealing with GTL technol-ogy.28 The bulletin reported that Syntroleum did a study in 1995 of a 5,000-B/D plant on the U.S. GulfCoast and calculated capital costs to be $27,000/DBL. It also stated that a more recent study for a sec-ond-generation design of 5,600-B/D capacity yielded an installed cost of $17,300/DBL. The bulletinfurther claimed that economies of scale associated with larger plants (30,000-B/D) could drive capitalcosts even lower, to the range of $12,000/DBL to $14,000/DBL on the Gulf Coast.
Capital costs for a generic GTL plant used in this evaluation are not taken from an operating GTLplant. There have been numerous reports of technological improvements and many studies indicating thatGTL-plant capital costs have decreased to the mid-$20,000/DBL range and future reductions to the mid-teens are anticipated. Given these circumstances, capital costs for a generic GTL plant are assigned avalue of $24,000/DBL, equal to the capital costs calculated in the Exxon/Qatar feasibility study men-tioned above.
5.4.1 Capital Costs – Alaska North Slope
This section discusses differences in capital costs for projects constructed on the North Slopecompared to projects constructed in the U.S. Gulf Coast area. Capital costs are higher on the North Slopebecause of a number of things. Large process plants are normally fabricated in the lower-48 and shippedto Alaska in sections on specialized barges. More steel is required in the modules for greater stability tobe able to withstand the shipping process. Depending on the weather, delays of up to 30 days have oc-curred because of ice on the water. After the barges arrive and are unloaded, the sections must be assem-bled. Because of the severe weather, all equipment must be enclosed in insulated buildings with freezer-type doors. Everything must be designed for temperature extremes not seen in the Gulf Coast region.Labor costs are higher on the North Slope, as well, because living quarters have to be provided, laborrates are higher, and all food must be transported long distances.
When considering an installation on the North Slope, applying a capital cost factor of between 1.3and 2.0 is reasonable for installations originally cost-estimated for the U.S. Gulf Coast area. A NorthSlope capital cost factor of 1.5 is used to calculate capital costs. Applying the 1.5 North Slope capitalcost factor to the base value of $24,000/DBL for the generic GTL plant yields capital costs for a NorthSlope location of $36,000/DBL.
11
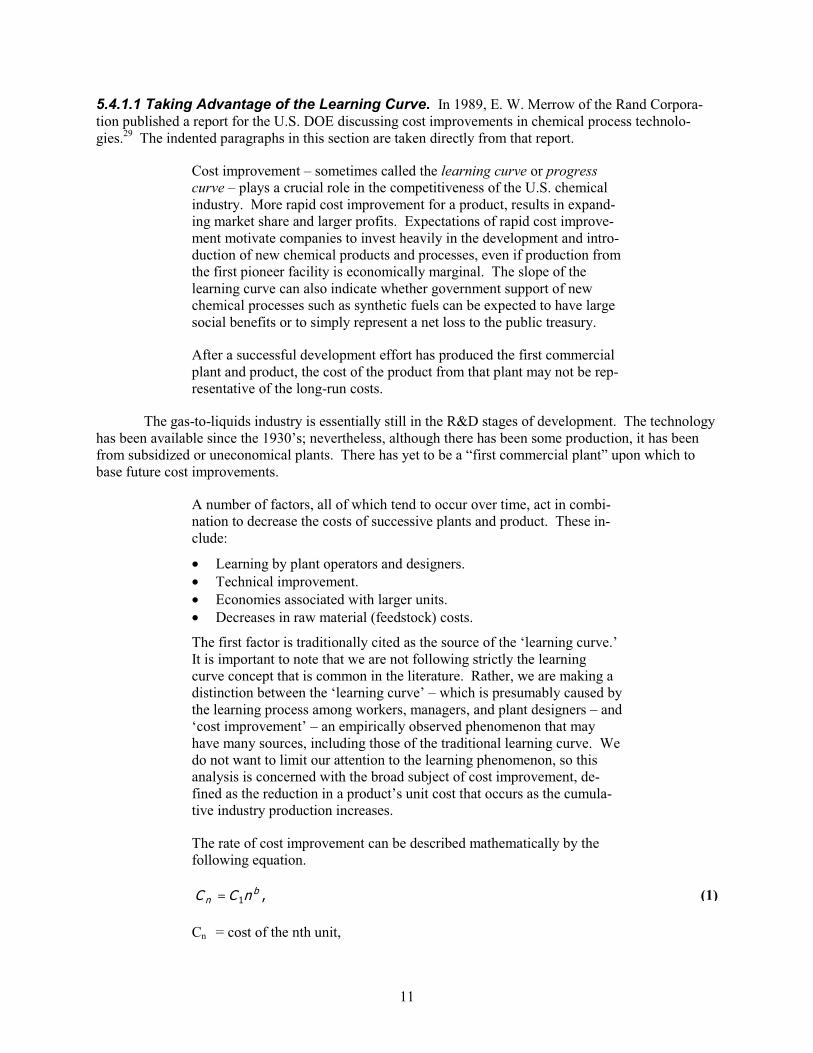
5.4.1.1 Taking Advantage of the Learning Curve. In 1989, E. W. Merrow of the Rand Corpora-tion published a report for the U.S. DOE discussing cost improvements in chemical process technolo-gies.29 The indented paragraphs in this section are taken directly from that report.
Cost improvement – sometimes called the learning curve or progresscurve – plays a crucial role in the competitiveness of the U.S. chemicalindustry. More rapid cost improvement for a product, results in expand-ing market share and larger profits. Expectations of rapid cost improve-ment motivate companies to invest heavily in the development and intro-duction of new chemical products and processes, even if production fromthe first pioneer facility is economically marginal. The slope of thelearning curve can also indicate whether government support of newchemical processes such as synthetic fuels can be expected to have largesocial benefits or to simply represent a net loss to the public treasury.
After a successful development effort has produced the first commercialplant and product, the cost of the product from that plant may not be rep-resentative of the long-run costs.
The gas-to-liquids industry is essentially still in the R&D stages of development. The technologyhas been available since the 1930’s; nevertheless, although there has been some production, it has beenfrom subsidized or uneconomical plants. There has yet to be a “first commercial plant” upon which tobase future cost improvements.
A number of factors, all of which tend to occur over time, act in combi-nation to decrease the costs of successive plants and product. These in-clude:
• Learning by plant operators and designers.
• Technical improvement.
• Economies associated with larger units.
• Decreases in raw material (feedstock) costs.
The first factor is traditionally cited as the source of the ‘learning curve.’It is important to note that we are not following strictly the learningcurve concept that is common in the literature. Rather, we are making adistinction between the ‘learning curve’ – which is presumably caused bythe learning process among workers, managers, and plant designers – and‘cost improvement’ – an empirically observed phenomenon that mayhave many sources, including those of the traditional learning curve. Wedo not want to limit our attention to the learning phenomenon, so thisanalysis is concerned with the broad subject of cost improvement, de-fined as the reduction in a product’s unit cost that occurs as the cumula-tive industry production increases.
The rate of cost improvement can be described mathematically by thefollowing equation.
Cn = cost of the nth unit,
,1b
n nCC = (1)

12
C1 = cost of the first unit,n = number of the unit being estimated, andb = exponent equal to the log of the improvement-curve rate divided by the log of 2.
The cost improvement rate for organic chemical production was found tobe 73.8 percent on the average, which means that for each doubling ofcumulative organic chemical production, costs decline to 73.8 percent ofwhat they were prior to that doubling.
Gas-to-liquids processes are included in the organic chemical production industry. The exponent“b” in Eq. (1) for the organic chemicals production industry is therefore:
The ‘cost of the nth unit’ as given in the Rand report applies to the end-product cost. This cost isa function of capital costs, operating cost, feedstock cost, tax cost, etc. However, in this report, cost im-provement is applied to capital costs instead of end-product cost. Our rationale for doing this is as fol-lows: The two main costs that give rise to end-product cost improvements are capital costs and operatingand maintenance costs. By applying the total cost improvement devised in the Rand report to the capitalcost variable, we account for all the end-product cost improvement in one input variable – capital costs.While the resulting capital cost improvements might be too large using this methodology when looked atindividually, they will be offset in the overall project economics by the non-improvements in other costssuch as operating and maintenance costs.
In this report, we assume that there will be no other GTL production anywhere else in the worldduring the 30-year life of the GTL project except from this plant in Alaska, which is probably an unrea-sonable assumption. If the initial plant proves to be successful, other plants around the world would mostlikely be built, and cumulative GTL production would be accelerated, which, in turn, would accelerate thecost improvements for additional expansions in Alaska. This is not accounted for in the analyses in thisreport, which implies that the cost savings used in this report would be conservative and that actual costsavings could be greater than those used. However, by using this approach, we feel confident that thecost improvement defined in the Rand report is fully and adequately incorporated into this study.
The variable “n” in Eq. (1) refers to cumulative production. Each time the production capacitydoubles, “n” is increased by one unit. Assuming the capital costs of the first GTL plant on the NorthSlope are $36,000/DBL as discussed in Section 5.4.1, the capital costs for a second plant of equal sizewould be reduced to $26,568/DBL according to Eq. (1) because the capacity is doubled. A third plant ofequal size would increase the capacity by an additional 50 percent; thus, the variable “n” in Eq. (1) for thethird plant would be 2.5, and the cost of the plant would be $24,093/DBL. The addition of the fourthplant would achieve the next doubling of capacity and “n” equals 3 for the fourth addition; and the costwould be $22,292/DBL. The cost of the fifth addition of 60,000 bbl/D of capacity would be$21,475/DBL.
6. ECONOMIC EVALUATIONS
6.1 Economic Input Variables
The LNG project evaluated here was described in detail in the 1996 DOE report and was not re-vised for this study except for two exceptions: values were updated from 1995 dollars to 1998 dollars andthe oil price forecast was changed. The GTL project was changed to include capital cost improvements;
.4383.00.2ln
738.0ln −==b (2)

13
data learned from the Rand report cited earlier; as well as updating costs from 1995 dollars to 1998 dol-lars. The Prudhoe Bay field model was revised and updated to include changes in costs, future invest-ments, and production forecasts
6.1.1 Oil Prices
Several oil price forecasts are available for use. The world oil price forecast that is used as the“base” case in this study is an $18/bbl flat price (in 1998 real dollars). The Energy Information Admini-stration (EIA) publishes an Annual Energy Outlook (AEO) every year in which they publish a set (high,low, and reference) of oil price forecasts. The EIA projects the AEO98 reference price forecast to theyear 2020. Historical world crude price as well as the projected AEO98 oil price forecast are shown inFig. 6. This forecast increases slightly throughout the forecast period in terms of real dollars. For eco-nomic evaluations beyond the forecast period, a linear extrapolation was used.
Oil prices, since 1986, on the average have remained relatively flat at around $20/bbl or slightlydeclined. The projects being evaluated in this study are long-term projects – ending between 2036 and2042. Oil prices will certainly vary somewhat during this period with normal vicissitudes. Although aflat oil price of $18/bbl may seem high or low depending on when this report is read, an $18/bbl oil priceappears reasonable over the length of these evaluations. In addition, a flat oil price allows comparisonswith other projects without the added variable of time-dependent oil prices.
6.1.2 Inflation
Inflation is the persistent rise in the prices of a Consumer Price Index type basket of goods, serv-ices, and commodities. In the USA and many other countries, this ‘basket’ is called the Consumer PriceIndex (CPI), which is made up of about 400 goods and services and commodities purchased by typicalconsumers.30 The U.S. Department of Labor, Bureau of Labor Statistics prepares the CPI on a monthlybasis. The seasonally adjusted CPI for all urban consumers is plotted in Fig. 7. Historically, although theannual inflation rate has fluctuated dramatically at times, it has remained below 15% since 1940. Sincethe early 1980’s, it has varied between 1% and 7%. In Fig. 7, the average annual inflation rate over thelast ten years of 3.0%/yr has been extrapolated over the approximate length of the projects evaluated. Thefuture annual inflation rate used in the economic evaluations in this report was 3.0%/yr.
Figure 6 - Historical and forecast world oil prices. Data from En-
ergy Information Administration.
$0.00
$10.00
$20.00
$30.00
$40.00
$50.00
$60.00
$70.00
1960 1970 1980 1990 2000 2010 2020 2030
Wo
rld
oil p
ric
e (
19
98
$/b
bl)
Historical Forecast
AEO98 forecast
Flat oil price forecast

14
6.1.3 Discount Rate
The discount rate used in discounted cash flow analyses can be defined as the expected rate ofreturn (ROR) that could be realized on similar alternative investments with equivalent risk. The mini-mum acceptable discount rate for new projects will vary for different projects and for different companiesdepending on the risk associated with the project, the economic climate of the nation, and the alternativeinvestment opportunities for a given company. The major developments on the North Slope including thePrudhoe Bay field and TAPS have multiple owners with varying ownership levels and competing inter-ests, which makes it impossible to select a discount rate representative for each company. However, anaverage or representative value of 10% is selected for the analyses of this study.
6.1.4 Taxes
The evaluations are performed on an after-tax basis. Alaska’s corporate income tax, like that ofmost other states, is based on apportioning either domestic or worldwide income to establish the“deemed” Alaska income subject to the state nominal tax rate of 9.4%. The apportionment fraction is theaverage amount of the taxpayer’s property, hydrocarbon extraction, and sales in Alaska relative to that inthe rest of the world. To precisely assess the state’s income tax, it is necessary to anticipate what the in-vestor’s worldwide income, worldwide property, worldwide extraction, and worldwide sales with bethroughout the life of the project; this is obviously impossible. To approximate the state income tax paidon project earnings, the nominal tax rate is halved to 4.7% and applied to all taxable income.
The federal income tax rate used in the analysis is 35%.
6.2 Method of Economic Evaluation
After-tax discounted cash flow analysis was used to evaluate the gas sales options. The net pres-ent value of a project resulting from this analysis is used to compare the options. The term cash flow re-fers to the net inflow (revenues, savings) and outflow (operating costs, taxes, capital expenditures) ofmoney that occurs during a given year. If costs exceed revenues, then the cash flow is negative for thatyear and, of course, if revenues exceed costs, then the cash flow will be positive for that year. The cashflows for each year the projects are evaluated are discounted to year zero to account for the time value of
-4
-2
0
2
4
6
8
10
12
14
16
1940 1960 1980 2000 2020 2040
An
nu
al
infl
ati
on
(%
)
extrapolation of
last 10-yr average
Figure 7 - Historical and projected annual inflation rate.

15
money. Hence, the term discounted cash flow. The rate at which future cash flows are discounted isknown as the discount rate and is discussed in section 6.1.3.
The projects are quantified in terms of the net present value. The net present value (NPV) of aproject is the sum of all the yearly discounted cash flows. It includes all investments, revenues, and costsof a project. The real utility of the NPV analysis is that it rolls the entire project into a dollar value thatcan be compared to other projects regardless of project length or timing. It enables investors to fairly andto properly compare projects and to determine which project has the greatest worth in today’s dollars.
The term NPV10 is used to signify a net present value evaluated at a 10 percent discount rate. Bydefinition, a project that produces a NPV10 equal to $0 has a rate of return equal to 10 percent. Therefore,a project with a positive NPV10 produces a rate of return greater than 10 percent, while a project with anegative NPV10 produces a rate of return less than 10 percent.
An economic model that incorporates the effect of gas sales, as well as oil sales, was developed toevaluate the Prudhoe Bay field. The Prudhoe Bay field is by far the largest current natural gas source onthe North Slope with 21.8 Tcf of natural gas estimated to be available for a future major-gas sale (seesection 2.3.7). Point Thomson may have as much as 5 Tcf available for sale according to recent esti-mates, with other fields offering much smaller amounts. Because Point Thomson is not a producing fieldand there are major concerns about its economic viability,1 an economic model for the Point Thomsonunit was not constructed in this study. However, gas from the potential production of Point Thomson, orother fields, can be included in the total amount of gas sold to a gas project.
IFPS/Plus™ ver. 5.1b was the commercial software used to perform the economic evaluations.This software allows a basic economic model to be constructed and run with a number of data files repre-senting different cases or projects. To evaluate gas sales from the North Slope, two different models wereconstructed: the Prudhoe Bay field model and the gas project model (the GTL plant, for example).
The Prudhoe Bay field model was run with three different data files along with a transportationmodule.
1) The base case data file supplies data to the Prudhoe Bay field model to evaluate the econom-ics of the field with no major gas sales in the future. Current field practices are continued inthis case with the produced gas processed and used for miscible injectant and pressure main-tenance to continue the highly effective oil-recovery processes in the field, but not sold.
2) The PBU-GTL data file supplies data to the Prudhoe Bay field model to evaluate the eco-nomics of the field with major gas sales to a GTL plant.
3) The PBU-LNG data file supplies data to the Prudhoe Bay field model to evaluate the eco-nomics of the field with major gas sales to an LNG project.
4) The transportation module calculates the transportation costs associated with transporting liq-uids through TAPS.
The gas project model was developed to evaluate the economic viability of a gas commercializa-tion project, either an LNG project or a GTL project. The model can be run with either the LNG data fileor the GTL data file. The LNG data file supplies data to the gas project model on the LNG project andaccepts gas from Prudhoe Bay, Point Thomson, or another field(s). The GTL data file provides data to
b A Comshare, Inc. product.

16
the gas project model on the GTL plant and also accepts gas from Prudhoe Bay, Point Thomson, or an-other field. The transportation module is used with the GTL data file to calculate transportation costs ofthe GTL product; however, the transportation module is not used when evaluating the LNG project be-cause no liquids are being shipped through TAPS.
Fig. 8 illustrates the relationships between the two economic models and the data files used inconjunction with those models.
6.2.1 Relationship between Prudhoe Bay and Gas Project
Both the field model and the gas project model are necessary to effectively evaluate the scenariosbeing considered and are tied together by the price of natural gas. The “natural gas sale price” for thefield operators’ model is equal to the “natural gas feed price” in the gas project model and is termed thegas transfer price. The gas transfer price is calculated with the use of the “net back” term. The “netback” refers to the ‘net’ fraction of the gas price sold by the gas project (GTL plant or LNG project) thatis returned ‘back’ to the Prudhoe Bay unit operators as payment for the gas. For the LNG project, theNorth Slope gas transfer price in $/MCF is calculated by the following equation.
If the East Asia LNG sale price were $3.50/Mcf, a net back of 0.20 means that the Prudhoe Bayoperators would receive 20% of $3.50 or $0.70/Mcf for the gas they sell to the project.
For the GTL plant, the North Slope gas price in $/Mcf is calculated by
back.netAsiainpriceLNGpricetransferGas ×=
back.netproductGTLofBTU
gasnaturalofBTUSlopeNorthonpriceproductGTLpricetransferGas ××=
Field-98
Prudhoe Bay withno gas sales
Prudhoe Bay withgas sales to GTL plant
Prudhoe Bay withgas sales to LNG project
Data filesModel
Transportationsubroutine
Model output
Net present value,
Gas production forecast,
Pipeline tariffs,
Cash flow forecast,
Revenue to state andfederal governments,
etc.
Alaska-98Gas-to-liquids plant
LNG project
(3)
(4)
Figure 8 - Flow chart describing economic evaluations and relationships between data files and
models.

17
If the North Slope GTL product price were $16/bbl, the natural gas BTU content were 1.150MMBTU/Mcf, the GTL product BTU content were 5.75 MMBTU/bbl, and the net back were 0.20, thenthe North Slope gas transfer price would be $0.64/Mcf.
6.3 Results of Economic Evaluations
6.3.1 Scenarios Evaluated
6.3.1.1 Prudhoe Bay Unit Scenarios. No major gas sales. Continue with current operations utilizingthe natural gas to maximize oil production. Under this scenario, oil production continues until 2025,when the economic limit of the field is reached.
Major gas sales to a gas-pipeline/LNG project beginning in 2005. Maximum gas production fromPrudhoe Bay of 2.0 Bcf/D is reached in 2009 after increasing the gas production rate by 20% of themaximum per year. Ultimate oil recovery is 400 million bbl less in this scenario than in the “no majorgas sales” scenario.
Major gas sales to a fast-paced GTL plant located on the North Slope beginning in 2005. Thisscenario follows the same gas sales rate schedule as the “sales to LNG” scenario. Ultimate oil recovery is400 million bbl less in this scenario than in the “no major gas sales” scenario.
Major gas sales to a fast-paced GTL plant located in southern Alaska beginning in 2005. Thisscenario is identical to the previous scenario except an extra cost is added to natural gas sold to accountfor transporting it from the North Slope to southern Alaska through an 800-mile pipeline.
Major gas sales to a slow-paced GTL plant located on the North Slope beginning in 2005. Thegas production rate from Prudhoe Bay begins at 0.5 Bcf/D for 5 years and then increases to 1.0 Bcf/D foranother 5 years, and so on until a maximum of 2.0 Bcf/D is reached in 2020. Under this assumption, ul-timate oil recovery will be equal to the “no major gas sales” scenario.
6.3.1.2 Natural Gas Pipeline/LNG Scenario. A potential natural gas pipeline/LNG project wasevaluated to accept 2.0 Bcf/D of natural gas sales from the Prudhoe Bay unit as well as 0.5 Bcf/D fromthe Point Thomson unit, which lies 50 miles east of Prudhoe Bay.
6.3.1.3 Three Scenarios Evaluated for Potential GTL Plant. A fast-paced GTL scenario where a300,000-B/D GTL plant is constructed on the North Slope to match the timing and volumes proposed byin the LNG scenario.
A slower-paced GTL construction schedule is assumed to take advantage of the learning curveassociated with implementation of newer technologies. Placement is on the Alaska North Slope and thisscenario is paired with the fourth scenario for the Prudhoe Bay unit – “major gas sales to slow-paced GTLplant.” The GTL plant purchases natural gas from Prudhoe Bay at a maximum rate of 2.0 Bcf/D and fromPoint Thomson, as well, at a rate of 0.5 Bcf/D.
A 300,000-B/D GTL plant (fast-paced) is located in Valdez, AK. This scenario assumes that thenatural gas pipeline is built and a tariff is charged to the gas passing through the line. The assumed gaspurchase rate is equal to the LNG scenario. A lower capital-cost factor (1.2) is applied at the Valdez lo-cation as opposed to a North Slope location (1.5).

18
The pipeline tariff of $0.80/Mcf was calculated for the third GTL scenario using two independentmethods. The first method used the following simple formula developed by the Alaska Department ofRevenue to estimate field pipeline tariffs.31
The cost of a natural gas pipeline has been estimated to be $6 billion. The total volume of gastransported through the pipeline from PBU and PTU to Valdez is 25 Tcf. A pipeline tariff of $0.80 is cal-culated using Eq. (5).
The other method used to calculate the gas pipeline tariff at Valdez was through amortizing thecapital costs of the pipeline to get an approximate yearly cost and then dividing by the yearly rate. Thismethod yields a natural gas pipeline tariff of $0.77/Mcf, which is comparatively close to the tariff calcu-lated from Eq. (5). A tariff of $0.80/Mcf is used in the economic evaluations of this scenario.
6.3.2 TAPS Tariff Discussion
The tariff that is charged for transporting liquid through the Trans-Alaska Pipeline System(TAPS) is an important economic parameter. The tariff calculation is based on costs to operate the pipe-line, future investments, pipeline profit, and liquid flowrate through the pipeline. TAPS tariffs are a veryimportant part of an analysis of projects affecting liquid production from the North Slope of Alaska. Thesame tariff is applied to all liquids passing through the pipeline; whether it be crude oil, natural gas liq-uids, or product from a GTL plant. The tariff is deducted from value of the crude oil or GTL product atdownstream refineries. A higher transportation tariff reduces the value of the wellhead product.
Fig. 9 shows the differences in TAPS tariff forecasts for four scenarios described in section 6.3.All of the four scenarios share the same TAPS tariff from 1998 through 2004 because no gas is sold andno extra liquids are produced during that time.
The LNG option tracks the no-gas-sales option until 2009 when the Pt. Thomson unit begins oiland gas production. At this point until 2016, the TAPS tariff is slightly lower for the LNG option than theno-gas-sales option. After 2016, the oil production rate from PBU declines because of the unavailabilityof gas for EOR and offsets the additional production from PTU, which causes the tariff for the LNG op-tion to rise above the no-gas-sales option. After 2021, the TAPS tariff for the LNG option rises dramati-cally when oil production from PBU is expected to cease.
In 2005, both GTL options begin to produce GTL liquids from the converted natural gas, reduc-ing the TAPS tariff relative to the no-gas-sales option. The fast-paced GTL development produces moreliquids initially than the slow-paced development and Pt. Thomson is developed sooner, which combineto reduce the tariff more rapidly because of the higher volume of liquid flowing through the pipeline.However, after 2022, the slow-paced development enjoys a lower TAPS tariff because of changes in oilproduction from PBU. In the fast-paced development, PBU stops producing crude oil in 2021, while theunit continues to produce oil until 2025 in the slow-paced scenario. Also, Pt. Thomson begins productionof the GTL product and natural liquids beginning in 2025, which helps keep the tariff lower for the slow-paced GTL development.
Besides improving the economics of the Prudhoe Bay and the Point Thomson units, lower TAPStariffs positively impact the economics of all other oil producing fields that transport liquids through thetrans-Alaska pipeline system. The benefit of lowering TAPS tariffs because of the addition of GTL prod-ucts to these other fields is not quantified in this report, but is expected to be significant as a whole.
35.3(Mcf)dtransportebeto volumetotal
($)pipelineofCosttariffPipeline ×=
(5)

19
6.3.3 Results
Results of the economic evaluations are best represented by the net present value of the project.The term NPV10 represents the net present value evaluated at a discount rate of 10%. Table 1 shows theresults of the evaluations described above. Project economics (meaning the sum of the field and gas mar-keting scheme) of all the scenarios are linked together by way of the natural gas price or gas transferprice. The gas transfer price for each scenario was optimized between the gas seller (PBU) and the gasbuyer (gas marketing scheme) by varying the net back fraction until the combined NPV10 was maximized.
Figure 9 - TAPS tariff forecasts in 1998$ for four scenarios.
0
1
2
3
4
5
6
7
8
9
10
19
95
20
00
20
05
20
10
20
15
20
20
20
25
20
30
20
35
20
40
20
45
1998$/b
bl
No Salesfast GTL PlantLNG Projectslow GTL Plant
Scenario Entity NPV10 ($, millions)
Incremental Prudhoe Bay unitGas-pipeline/LNG-plant
589-2,991
Major gas sales to gas-pipeline/LNG-plant
Total -2,402
Incremental Prudhoe Bay unitGTL plant
914-1,297
Major gas sales to GTLplant on North Slope (fast-paced) Total -383
Incremental Prudhoe Bay unitGTL plant
542-1,908
Major gas sales to a GTLplant in southern Alaska(fast-paced) Total -1,366
Incremental Prudhoe Bay unitGTL plant
-113945
Major gas sales to GTLplant on North Slope (slow-paced) Total 832
Table 1. Economic evaluations of major gas sales from the North Slope of Alaska.

20
In the evaluation of scenarios involving the Prudhoe Bay unit, low net back fractions can causecash flows to become negative after oil operations cease. In cases such as these, only net back fractionsthat were high enough to keep Prudhoe Bay yearly cash flows positive were evaluated. Table 1 shows theresults of the economic evaluations. The net present value of the incremental Prudhoe Bay unit given inTable 1 is simply the difference between the NPV10 of the Prudhoe Bay unit without any gas sales and theNPV10 of the Prudhoe Bay unit with major gas sales. A negative incremental NPV10 indicates that thePrudhoe Bay unit is worth more if the gas is not sold.
6.3.4 Discussion of Results
Evaluation of the Prudhoe Bay unit economics for the gas sales scenarios required the comparisonof the economics of the each gas sales scenario with the economics of the base scenario (no major gassales). If the NPV10 of PBU with a gas sales option is positive, but still less than the base scenario, then,obviously, it would make economic sense from the PBU operator’s point of view to not market the gas.The ‘incremental Prudhoe Bay unit’ in Table 1, represents the difference between the NPV10 of the Prud-hoe Bay unit with major gas sales and the NPV10 of the Prudhoe Bay unit with no major gas sales.
The economic results shown in Table 1 were achieved by varying the net back until the combinedNPV10’s of the Prudhoe Bay unit and the gas marketing scheme (total scenario economics) reached amaximum. This approach assumes that the total scenario economics are maximized with the only con-straint being that the Prudhoe Bay unit have a positive cash flow while production operations were ongo-ing.
The net back is a variable that sets the transfer price for the natural gas between the producer andthe buyer (LNG project or GTL project), and is explained in section 6.2.1. The gas transfer price is a keyvariable in the economic evaluation of both the Prudhoe Bay field and the gas-marketing scheme. In thisanalysis, the transfer price is consistent within each scenario; that is, the gas producer sells the gas at thesame price that the LNG or GTL project buys it.
Because the transfer price is a negotiated percentage of the product sale price it will be differentfor each scenario. A higher net back or transfer price increases the gas sales price on the North Slope andmeans higher profits for the Prudhoe Bay unit and lower profits for the gas-marketing project. A lowernet back means lower profits for the Prudhoe Bay unit and higher profits for the gas-marketing projectbecause North Slope gas price is lower. Figures 10, 11, 12, and 13 show how the project economics var-ied with respect to the net back.
Of the four gas sales scenarios (see Table 1), the slow-paced North Slope GTL development sce-nario is the only one with a positive incremental combined net present value using a discount rate of 10%.A negative NPV10 does not necessarily mean that a project loses money; it simply means that the rate ofreturn for that scenario is less than 10% (the discount rate). A lower discount rate may show positive netpresent values for some or all the scenarios; however, this dependence was not quantified.
The gas sales revenues of slow-paced North Slope GTL plant are realized later in the life of thisscenario than in the fast-paced GTL scenarios and the LNG scenario, which tends to decrease the net pre-sent value of the project. However, the savings in capital costs associated with the “learning curve” thatare incorporated into this option outweigh the added discount in revenue caused by delaying the gas sales.
The total scenario for the GTL plant at a southern Alaska location includes the Prudhoe Bay unit,a gas-pipeline/LNG project, and a GTL plant in southern Alaska. This placement for the GTL plant al-lows some potential advantages compared to a North Slope location. (In this case, the capital cost in-vestment follows the same schedule as the fast-paced GTL plant development.) The capital cost factor

21
would be less for a southern location than for the North Slope because of reduced shipping, labor, andmaterials costs. In the economic evaluation, the capital cost factor was lowered from 1.5 (for the NorthSlope location) to 1.2. The other major change in evaluations is the additional price of the natural gas atValdez. The $6 billion gas pipeline transporting natural gas from the North Slope to Valdez would stillbe constructed; adding about $0.80/Mcf to the gas feed cost (see section 6.3.1.3 for more detail). How-ever, the additional cost of the natural gas feed more than offsets the reduced capital costs associated withthe Valdez location.
The LNG scenario evaluated here is the same as in the 1996 DOE report except that the costswere updated from 1996 dollars to 1998 dollars and the $18/bbl flat oil price forecast was used instead ofthe forecast used in the 1996 study. We did not include possible cost savings in pipeline construction nor
-6,000
-5,000
-4,000
-3,000
-2,000
-1,000
0
1,000
2,000
3,000
0.00 0.05 0.10 0.15 0.20 0.25 0.30
Net back (fraction)
NP
V (
MM
$)
Prudhoe Bay unit
Total scenario
LNG project
Figure 10 – NPV calculations for gas sales to LNG scenario.
-4,000
-3,000
-2,000
-1,000
0
1,000
2,000
3,000
0.00 0.05 0.10 0.15 0.20 0.25 0.30
Net back (fraction)
NP
V (
MM
$)
Total scenario
Prudhoe Bay unit
GTL project
Figure 11 - NPV calculations for gas sales to a North Slope GTL
plant (fast-paced) scenario.

22
did we include the possible effects of the Stranded Gas Act, which could reduce tax payments in the ear-lier portion of the project.
We left the LNG scenario unchanged from the 1996 DOE report with the exception of the oilprice forecast and updating costs from 1996 dollars to 1998 dollars because it provided a base point tocompare advances in GTL technology. In the 1996 DOE study, the evaluation of the LNG option and thefast-paced GTL option resulted in relatively equivalent economic scenarios. However, the fast-pacedGTL development scenario that includes technological and cost improvements now has a decided advan-tage over the LNG scenario. When the added cost improvements associated with the learning curve areincluded, the slow-paced GTL development scenario is even more attractive. We should note, however,that potential cost savings in the LNG scenario (see section 3) were not included in the economic evalua-tion of this scenario. In addition, potential tax savings associated with the Alaska Stranded Gas Devel-
-1000
-500
0
500
1000
1500
0.00 0.05 0.10 0.15 0.20 0.25 0.30
Net back (fraction)
NP
V (
MM
$)
Prudhoe Bay unit
Total scenario
GTL project
Figure 12 - NPV calculations for gas sales to a North Slope GTL
plant (slow-paced) scenario.
-8000
-6000
-4000
-2000
0
2000
4000
0.20 0.30 0.40 0.50 0.60
Net back (fraction)
NP
V (
MM
$)
Prudhoe Bay unit
Total scenario
GTL project
Figure 13 – NPV calculations for gas sales to a GTL plant (fast-
paced) in southern Alaska.

23
opment Act (see section 4) were not included in the economic evaluation.
6.3.5 Sensitivity Analyses
There are many sensitivity analyses that could be run on these evaluations. Learning the ramifi-cations of varying input parameters is important to understanding project economics. As this study wasprimarily concerned with economics of gas-to-liquids technology Alaska, sensitivities were performedonly on the GTL plant portion of the total scenarios. The field portion of the scenarios was not furtherincluded in the sensitivity analyses. The object of the analysis was to determine which input parameterscause the greatest effect on project economics. This information is vital in determining those parametersthat offer the greatest potential for increasing or decreasing economic viability. These parameters requirethe most attention and are natural targets for further study by increasing research efforts.
The parameters selected for the sensitivity analysis were:
• Capital costs for a GTL plant on the Gulf Coast
• World oil price
• North Slope cost factor applied to capital costs
• Premium of the GTL product over crude oil prices
• Operation and maintenance costs of GTL plant
• Rate of cost improvement on subsequent GTL plant capacity
• Federal income tax rate
• Total GTL plant efficiency
• Natural gas feed BTU content per cubic foot
• Alaska state income tax rate
• GTL product BTU content per barrel
Fig. 14 shows the result of a sensitivity analysis of the input data for the slow-paced GTL plantdevelopment. The input parameter that influences the economical output is that with the longest bar andis placed at the top of the plot; while the parameter with the least influence is placed at the bottom. Thenumbers on each end of the respective horizontal bars indicate the possible range of the variable in ques-
Figure 14 - Sensitivity of input parameters with respect to project
economics for the slow paced, staged GTL development scenario.
9.0% 10.0% 11.0% 12.0% 13.0%
GTL liquids BTU (BTU/bbl)
State income tax rate
Natural gas BTU (BTU/SCF)
GTL plant efficiency
Federal income tax rate
Cost improvement rate
O & M cost factor ($/bbl)
GTL liquids premium ($/bbl)
North Slope cost factor
Flat oil price ($/bbl)
Gulf coast plant cost ($/DBL)
Rate of return
15,00030,000
15 20
1.32.0
1.5 5.0
7.0 4.5
0.55 0.62
1050 1200
5.75.8
-0.85 -0.70
0.35 0.28
0.047 0.030
most likely
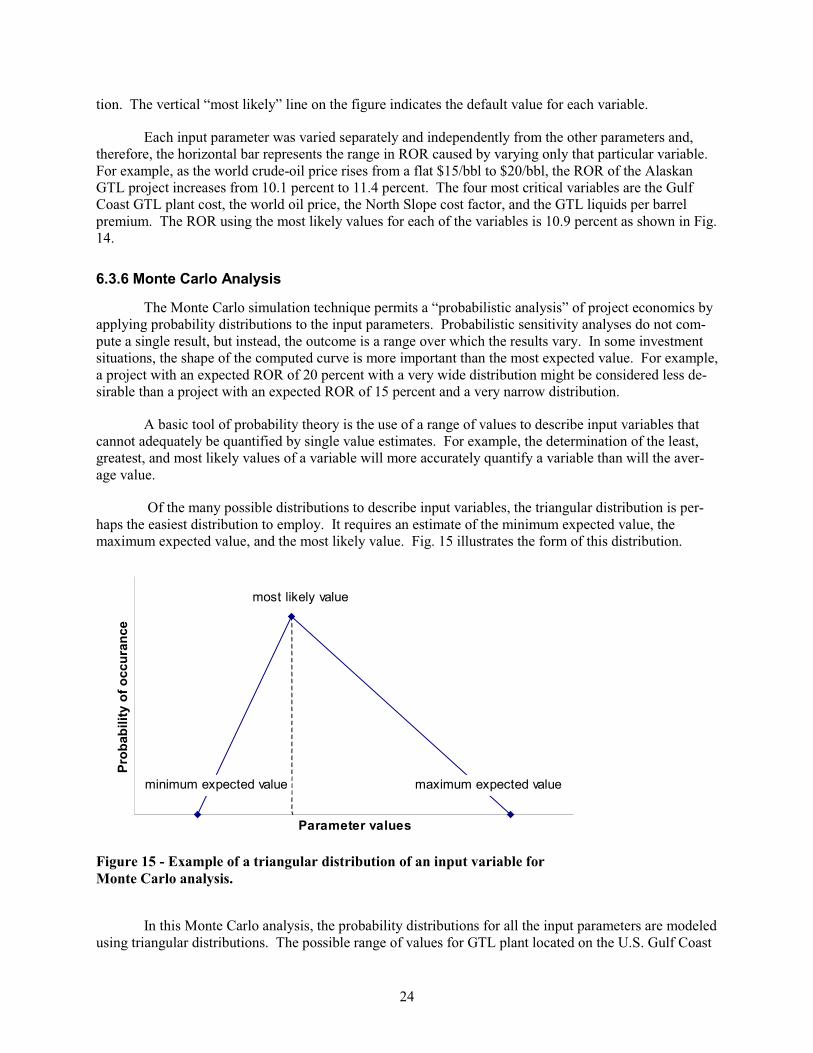
24
tion. The vertical “most likely” line on the figure indicates the default value for each variable.
Each input parameter was varied separately and independently from the other parameters and,therefore, the horizontal bar represents the range in ROR caused by varying only that particular variable.For example, as the world crude-oil price rises from a flat $15/bbl to $20/bbl, the ROR of the AlaskanGTL project increases from 10.1 percent to 11.4 percent. The four most critical variables are the GulfCoast GTL plant cost, the world oil price, the North Slope cost factor, and the GTL liquids per barrelpremium. The ROR using the most likely values for each of the variables is 10.9 percent as shown in Fig.14.
6.3.6 Monte Carlo Analysis
The Monte Carlo simulation technique permits a “probabilistic analysis” of project economics byapplying probability distributions to the input parameters. Probabilistic sensitivity analyses do not com-pute a single result, but instead, the outcome is a range over which the results vary. In some investmentsituations, the shape of the computed curve is more important than the most expected value. For example,a project with an expected ROR of 20 percent with a very wide distribution might be considered less de-sirable than a project with an expected ROR of 15 percent and a very narrow distribution.
A basic tool of probability theory is the use of a range of values to describe input variables thatcannot adequately be quantified by single value estimates. For example, the determination of the least,greatest, and most likely values of a variable will more accurately quantify a variable than will the aver-age value.
Of the many possible distributions to describe input variables, the triangular distribution is per-haps the easiest distribution to employ. It requires an estimate of the minimum expected value, themaximum expected value, and the most likely value. Fig. 15 illustrates the form of this distribution.
In this Monte Carlo analysis, the probability distributions for all the input parameters are modeledusing triangular distributions. The possible range of values for GTL plant located on the U.S. Gulf Coast
Figure 15 - Example of a triangular distribution of an input variable for
Monte Carlo analysis.
Parameter values
Pro
bab
ilit
y o
f o
ccu
ran
ce
most likely value
maximum expected valueminimum expected value

25
was discussed in section 5.4. The world oil price forecasts and variations are discussed in section 6.1.1.The capital cost factor applied to projects for placement on the North Slope of Alaska is discussed in sec-tion 5.4.1. The premium over the price of crude oil applied to the GTL product is discussed in section5.3. Operation and maintenance (O & M) costs for large plants such as a GTL plant can be effectivelyapproximated on a cost-per-output-barrel basis. The most likely value for O & M costs used in thisanalysis is $6/bbl, with a minimum of $4/bbl and a maximum of $7/bbl. The rate of cost improvement forsuccessive GTL plants is discussed in section 5.4.1.1. The maximum expected values for federal andstate income taxes are equal to the most likely values of 0.35 and 0.047 respectively. The minimum ex-pected values were taken to be 80% of the most likely values; or, 0.28 for federal and 0.03 for the state.The efficiency of a GTL plant is estimated to be 60% (most likely) with a minimum of 55% and a maxi-mum of 62%. The BTU content of the natural gas feed and the GTL product were previously discussedby Thomas et al.1 Table 2 tabulates the minimum, maximum, and most likely values for the input pa-rameters varied as part of the Monte Carlo analysis.
In a Monte Carlo analysis, a value is calculated for each distributed input variable from randomnumbers. Then, using the randomly selected parameter values, the ROR is calculated. This process isrepeated, picking a new set of random numbers to determine the ROR of the project. For this analysis,the ROR was calculated repeatedly (10,000 iterations) to get a smooth rate-of-return distribution.
6.3.6.1 Results of Monte Carlo Analysis. Fig. 16 is a plot of the probability-of-occurrence versusrate-of-return for a slow-paced GTL plant development on the North Slope. Fig. 17 was obtained byplotting the cumulative probability of the ROR outcome. From Fig. 16, possible rates of return can rangefrom 8.7 percent to 13.1 percent. However, from Fig. 17, a 90 percent confidence interval on the rate ofreturn of between 9.8 percent and 11.9 percent can be obtained by picking the 5 percent and 95 percentcumulative probability with their corresponding rates of return. The median value of 10.8 percent indi-cates that half of the time, a rate of return calculation would return a value of 10.8 percent or greater.
The median ROR of 10.8 percent is slightly lower than the 10.9 percent ROR calculated whenusing the most likely values for the input parameters. This difference occurs because the triangular distri-butions of most of the input parameters are skewed. For example, the flat-oil-price input variable rangesfrom 15 to 20, with 18 being the most likely. However, the average value of the distribution is actually17.67, which is slightly less than the most likely value of 18. The standard deviation is 0.7 percent, whichdemonstrates that the results are tightly centered on the average of 10.8 percent.
Minimum expectedvalue Most likely value
Maximum expectedvalue
Gulf coast plant cost ($/DBL) 15,000 24,000 30,000Flat oil price ($/bbl) 15 18 20North Slope cost factor 1.3 1.5 2.0GTL liquids premium ($/bbl) 1.5 3.5 5.0O & M cost factor ($/bbl) 4.5 6.0 7.0Cost improvement rate -0.70 -0.74 -0.85Federal income tax rate 0.28 0.35 0.35GTL plant efficiency 0.55 0.60 0.62Natural gas BTU (BTU/SCF) 1050 1150 1200State income tax rate 0.030 0.047 0.047GTL liquids BTU (BTU/bbl) 5.70 5.75 5.80
Table 2. Minimum, maximum, and most likely values for triangular distributions used in Monte Carloanalysis.

26
Figure 16 - Frequency plot of the rate of return for a slow-paced
GTL plant development after 10000 iterations.
Figure 17 - Cumulative probability of occurrence for the rate of return of a slow-
paced GTL plant development.
0.00
0.02
0.04
0.06
0.08
0.10
0.12
0.14
0.16
8.5
%
8.9
%
9.4
%
9.9
%
10
.3%
10
.8%
11
.3%
11
.7%
12
.2%
12
.7%
13
.1%
Rate of return
Pro
ba
bil
ity
Slow-paced GTL development
0.08 0.09 0.1 0.11 0.12 0.13 0.14Rate of Return
0
0.1
0.2
0.3
0.4
0.5
0.6
0.7
0.8
0.9
1
Cu
mu
lative
pro
ba
bili
ty

27
7. SUMMARY
The Alaska North Slope has a vast natural gas resource that is currently being used to enhance oilrecovery. It is estimated that the Prudhoe Bay field alone will have 21.8 Tcf of natural gas available forsale after oil operations cease. Currently, there are two broad schemes proposed for commercializing thenatural gas on the North Slope. One is the proposed gas-pipeline/LNG-plant scenario; the other convertsthe natural gas to syn-crude in a North Slope GTL plant, eliminating the need for an additional pipelinefrom the North Slope.
The purposes of this report were to investigate and explore the effect of applying new technologyto the economics of a proposed GTL plant, to evaluate the potential of a slower-paced deployment ofGTL technology, and to evaluate the effect of GTL plant placement on economics.
Of the gas marketing scenarios evaluated, results indicate that the slow-paced GTL scenario is theonly one with a rate of return greater than 10 percent. The other scenarios did not show positive net pres-ent values under the economic conditions selected for the simulations. Their rank, in order of net presentvalue, is as follows: slow-paced GTL development, no-major-gas-sales, fast-paced GTL development,fast-paced GTL development in southern Alaska, and finally a gas-pipeline/LNG project.
The slow-paced GTL development would allow cost savings on subsequent expansions. Theseassumed savings along with the lowering of the transportation tariff combine to distinguish this option formarketing the North Slope gas from the other scenarios. Critical variables that need further considerationinclude the GTL plant cost, the GTL product premium, and operating and maintenance costs. Reducingthese costs or increasing the premium could dramatically increase the profitability of the GTL process.Understanding these variables better and reducing their uncertainty would allow a more accurate predic-tion of economic profitability. Further study of these variables (GTL plant cost, GTL product premium,and O & M costs) is recommended. In addition, a study to quantify the benefit of a tariff reduction causedby a North Slope GTL plant to the economics of other fields (besides Prudhoe Bay) is also recommended.

29
8. APPENDIX
Comparison of Six Gas-to-Liquids Technologiesc
c Based on information provided by the Alaska Department of Revenue.

30
Step One: Oxygen getting
Exxon's AGC-21
Air Separation Plant: Toseparate O2 from N2, the plant
cryogenically cools air into aliquid, then heats the liquid.
The N2 will boil off first,leaving the O2.
Nitrogen
Cost/bbl
Capital $2.50O&M $0.40
Total $2.90
Oxygen
Step Two: Syngas generation
Exxon's AGC-21
spentcatalyst
Partial oxidationand steam
reforming takeplace concurrently
in a fluid-bed reactor
Methane
Steam
Oxygen
Catalyst particles
heat
syngas
High temperaturereaction taking placein a single largevessel, replacingseveral smallervessels; thus realizingeconomies of scale.
Cost/bbl
Capital $2.25O&M $1.00
Total $3.25
Sasol'sFischer-Tropsch (F-T)Technology
Basic Technology
Air, with some othertrace gases.
Air Separation Plant: Toseparate O2 from N2, the plant
cryogenically cools air into aliquid, then heats the liquid.
The N2 will boil off first,leaving the O2.
Nitrogen
Cost/bbl
Capital $2.75O&M $0.40
Total $3.15
Oxygen
Air, with some othertrace gases.
Smaller Air Separation Plant: Toseparate O2 from N2, the plant
cryogenically cools air into aliquid, then heats the liquid.
The N2 will boil off first,leaving the O2.
Nitrogen
Cost/bbl
Capital $1.25O&M $0.20
Total $1.45
Oxygen
As less O2 is needed,a smaller plant is required.
heat
O2
methane
Partial oxidation(Pox):Heat breaks bondsin chamber andallows new bondsto form.No catalyst needed.
Cost/bbl
Capital $2.75O&M $0.40
Total $3.15
Basic Technology - two methods
or
Steam Reforming(SR):Mix super hot steamwith methane, andrun over fixed-in-placecatalyst in steeltubesto break and createnew bonds.
heat
steam
methane
Cost/bbl
Capital $3.50O&M $3.70
Total $7.20
CO2added toadjust theCO/H2ratio
CO + 2H2 CO + 2H2
Sasol's F-T technology
O2
Partial oxidation(Pox):Heat breaks bondsin chamber andallows new bondsto form.No catalyst needed.
Cost/bbl
Capital $3.35O&M $1.50
Total $4.85
CO + 2H2
In its Moss Bay plant, Sasol uses a combinationof Pox and SR, called autothermal reforming.
steamreformer
steam
CO + 3H2
Syngasheat
methane
heat

31
Step Three: Fischer Tropsch synthesis
Exxon's AGC-21
Exxon uses a multiphase slurry reactor with a cobalt catalyst to make a waxy paraffin whilelimiting lighter gas and water production. The slurry reactor provides economies-of-scalebenefits. Chemically, the reaction is (2n+1)H2 + nCO = CnH2n+2 + nH2O.
slurryreactor
heat
Gases (light hydrocarbons and steam)
waxes with paraffinstructure
a slurry of fine catalystparticles, waxy product,and syngas
heat
syngas
Step 4: Product Upgrading
Exxon's AGC-21
Cost/bbl
Capital $1.55O&M $2.48
Total $4.03hydrocracker
Paraffin waxes
Hydrogen
heat
fixed-bed catalyst
fractionator
hydrocarbongases
Distillates(diesel)
hydrocracker heats waxy,paraffin product in thepresence of H2 and acatalyst to crackmolecule into lowerweight molecules
the olefin molecules(CnH2n) becomesaturated with H2,creating a range ofparaffins and iso-paraffins
(CnH2n+2, where‘n’ is at least 20)
Cost/bbl
Capital $1.30O&M $3.00
Total $4.30
Basic Technology
syngas carbon dioxide
Sperical pellets ofan iron or cobaltcatalyst
Liquid product ofmiddle distillatesand waxesSteamCarbon dioxide to be
recycled in order tofacilitate heat transfer
heat
waxes
distillates
Pass H2 and CO through a fixedbed of an iron or cobalt catalyst,and have H2 and CO combine toform small-, medium-, andlong-chain hydrocarbons. Somepossible reactions with a cobaltcatalyst are:
11H2 + 5CO = C5H12 + 5H2O
21H2 + 10CO = C10H22 + 10H2O
41H2 + 20CO = C20H42 (wax) + 20H2O
water is a byproduct of thereaction.
C21H44 = C8H16 + C13H28
C8H16 + H2 = C8H18 + heat
Cost/bbl
Capital $2.30O&M $3.70
Total $6.00
Sasol's F-T technology
slurryreactor
Gases (lighthydrocarbonsand steam) arerecycled.
waxes with paraffinstructure
a slurry of fine catalystparticles, waxy product,and syngas
heat
Cost/bbl
Capital $2.30O&M $3.70
Total $6.00
heat
syngas
Sasol's Slurry Phasedistillate reactor bubblessyngas through a mixtureof waxes and iron catalystparticles. The reactioncreates a waxy product.
hydrocracker
Paraffin waxes
Hydrogen
heat
fixed-bed catalyst
fractionator
hydrocarbongases
Distillates(diesel)
hydrocracker heats waxy,paraffin product in thepresence of H2 and acatalyst to crackmolecule into lowerweight molecules
the olefin molecules(CnH2n) becomesaturated with H2,creating a range ofparaffins and iso-paraffins
(CnH2n+2, where‘n’ is at least 20)
Cost/bbl
Capital $1.30O&M $3.00
Total $4.30
C21H44 = C8H16 + C13H28
C8H16 + H2 = C8H18 + heat
Sasol's F-T technology
Basic Technology

32
BP's compact steam reformer
BP does not need an air separation plant to makeoxygen because it generates syngas using onlysteam methane reforming (SMR)
Cost/bbl
Capital $0.00O&M $0.00
Total $0.00
BP's compact steam reformer
BP removes heat from within the reactor's steeltubes, thereby allowing for a more compact design
heat
steam
methane
The steam reactorwith fixed bedcatalyst is better atremoving the heatgenerated whensyngas forms.
Cost/bbl
Capital $2.25O&M $2.00
Total $4.25
Syntroleum's Nitrogen-diluted GTL technology
Department of Energy's Ceramic Membrane technology
Syntroleum doen not need an air separation plantbecause it uses air rather than oxygen to generatesyngas.
DOE's technology does not require an air separationplant since it separates oxygen from the other componentsof air at the same time as it generates syngas.
Cost/bbl
Capital $0.00O&M $0.00
Total $0.00
Cost/bbl
Capital $0.00O&M $0.00
Total $0.00
Syntroleum’s N2-diluted technology
Syntroleum usesautothermalreforming withair instead ofoxygen. Thenitrogen by-product travelsthrough theprocess.
nicklecatalyst
Cost/bbl
Capital $2.00O&M $1.50
Total $3.50
air
methanehot steam
heat
DOE's Ceramic Membrane technology
methane
heat
catalyst
nitrogen
oxygen
air
syngas
The oxygen in theair travels throughthe ceramic mem-brane to reactwith the methaneto form syngas.
Cost/bbl
Capital $2.75O&M $0.40
Total $3.15
Step Two: Syngas generationStep One: Oxygen getting
22HCO +
2CO
22N2HCO ++

33
BP's compact steam reformer
syngas
heat
waxes to go toproduct upgrading
F-T reactor
(BP is workingon improvingthe catalyst)
Cost/bbl
Capital $2.30O&M $3.70
Total $6.00
hydrocracker
Paraffin waxes
Hydrogen
heat
fixed-bed catalyst
fractionator
hydrocarbongases
Distillates(diesel)
hydrocracker heats waxy,paraffin product in thepresence of H2 and acatalyst to crackmolecule into lowerweight molecules
the olefin molecules(CnH2n) becomesaturated with H2,creating a range ofparaffins and iso-paraffins
(CnH2n+2, where‘n’ is at least 20)
Cost/bbl
Capital $1.30O&M $3.00
Total $4.30
BP's compact steam reformer
C21H44 = C8H16 + C13H28
C8H16 + H2 = C8H18 + heat
Syntroleum’s N2-diluted technology
syngas
heat
waxes to go toproduct upgrading
F-T reactor
(DOE is notworking toimprovethis step)
Cost/bbl
Capital $2.30O&M $3.70
Total $6.00
DOE's Ceramic Membrane technology
Syntroleum uses a fluid-bed F-T reactor. Catalystparticles are mixed withsyngas, which causes areaction. The catalystparticles are then separatedfrom the syngas product.A cobalt catalyst is usedand Syntroleum claims thatit can limit the growth ofhydrocarbon chains toprevent the formation ofmuch wax.
Cost/bbl
Capital $0.80O&M $2.25
Total $3.05
syngas + nitrogen
cobalt catalyst particles
heat
distillates
waxes
spent catalyst
nitrogen-dilutedgases to disposal
Syntroleum’s N2-diluted technology
hydrocracker
Paraffin waxes
Hydrogen
heat
fixed-bed catalyst
fractionator
hydrocarbongases
Distillates(diesel)
hydrocracker heats waxy,paraffin product in thepresence of H2 and acatalyst to crackmolecule into lowerweight molecules
the olefin molecules(CnH2n) becomesaturated with H2,creating a range ofparaffins and iso-paraffins
(CnH2n+2, where‘n’ is at least 20)
Cost/bbl
Capital $1.30O&M $3.00
Total $4.30
C21H44 = C8H16 + C13H28
C8H16 + H2 = C8H18 + heat
hydrocracker
Paraffin waxes
Hydrogen
heat
fixed-bed catalyst
fractionator
hydrocarbongases
Distillates(diesel)
hydrocracker heats waxy,paraffin product in thepresence of H2 and acatalyst to crackmolecule into lowerweight molecules
the olefin molecules(CnH2n) becomesaturated with H2,creating a range ofparaffins andiso-paraffins
(CnH2n+2, where‘n’ is at least 20)
Cost/bbl
Capital $0.80O&M $2.25
Total $3.05
C21H44 = C8H16 + C13H28
C8H16 + H2 = C8H18 + heat
A smaller hydrocrackeris needed because ofthe smaller amount ofparaffin waxes.
DOE's Ceramic Membrane technology
Step Four: Product upgradingStep Three: Fischer Tropsch synthesis

35
9. REFERENCES
1 Thomas, C.P., Doughty, T.C., Hackworth, J.H., North, W.B., and Robertson, E.P.: “Economics of Alaska NorthSlope Gas Utilization Options,” INEL-96/0322 (August 1996).
2 “More Oil in ANWR,” Petroleum News Alaska, Vol. 3, No. 5, (May 25 – June 21, 1998) p B1.3 “Discovery at Sourdough,” Petroleum News Alaska, Vol. 2, No. 3, (March 1997) p A1.4 “Group wants fast oil lease sales in Alaska reserve,” Reuters newswire, (September 9, 1998).5 “ARCO to participate in 1,100 development penetrations in next five years,” Petroleum News Alaska, Vol. 3, No.
2 (Feb 23-Mar 22, 1998) p A18.6 ARCO 1997 Security Analyst Meeting – Upstream Operations, Ken Thompson, Figure 54.7 “Historical and Projected Oil and Gas Consumption," (April 1998) ADNR – DOG, Table 1, Table 2A and Table
3.8 “Prudhoe Reserves Get 1-Bil Boost,” Platt’s Oilgram News, Vol. 71, No. 137 (July 16,1993) p 2.9 ARCO 1997 Security Analyst Meeting – Upstream Operations, Ken Thompson.10 “Alaska North Slope Gas Commercialization Team – Report to the Governor,” Wilson L. Condon, Commis-
sioner – Department of Revenue, John T. Shively, Commissioner – Department of Natural Resources, and BruceM. Botelho, Attorney General (7 January 1998).
11 “Role of technology development at ARCO,” Petroleum News Alaska, Vol. 3, No. 2 (Feb. 23 – Mar. 22, 1998) pB1.
12 “Exxon forms GTL study group,” Petroleum News Alaska, Vol. 3, No. 6 (June 22 – July 26, 1998) p A3.13 “Improving the Odds,” Petroleum News Alaska, Vol. 3, No. 7 (July 27 – Aug. 30, 1998) p A1.14 Press releases from CSX Corp. and Foothills Pipe Lines Ltd. (11 August 1998).15 LNG Market Assessment by Zeus Development Corp. (1998).16 Meet Alaska ’97, the 14th Annual Conference for Alaska’s Business Community.17 “Reserves Boosted for Indonesia’s Tangguh Project,” PI/Dwights International Industry News (August 24-31,
1998).18 “Governor’s North Slope gas development bill passes Legislature,” Petroleum News Alaska, Vol. 3, No. 5 (May
25 – June 21, 1998) p A8.19 Pedro van Meurs: “Suggestions for New Terms for the Alaska North Slope LNG Project – Background Report,”
(12 February 1997) van Meurs & Associates Ltd., Calgary, Alberta, Canada.20 “New Tax Attitude,” Journal of Alaska Business and Commerce (March 2, 1998) p 11.21 J. Eilers et al.: “The Shell Middle Distillate Synthesis Process (SMDS),” Catalysis Letters, 7 (1990) 253-270.22 “SLH Corporation Announces Syntroleum Agreement with Enron Capital and Trade Resources,” Business Wire
(Feb. 24, 1998).23 B. Eisenberg, L.L. Ansell, R.A. Fiato, and R.F. Bauman: “Advanced Gas Conversion Technology for Remote
Natural Gas Utilization,” presented at the 73rd Annual GPA Convention (March 7-9, 1994) New Orleans, LA.24 B.M. Everett, B. Eisenberg, and R.F. Bauman: “Advanced Gas Conversion Technology: A New Option for Natu-
ral Gas Development,” presented at the First Doha Conference on Natural Gas (March 14, 1995) Doha, Qatar.25 “Gas-to-Liquids Technology – Dawning of New Era for Global Natural Gas,” Salomon Brothers Inc. (November
8, 1996).26 Survey of 1998 data from Oil & Gas Journal, Statistics section on gross refining margins.27 “Gas-to-Liquids Technology – Dawning of New Era for Global Natural Gas,” Salomon Brothers Inc. (November
8, 1996).28 W.S. Pintz: “Economical Conversion of Natural Gas to Liquid Synthetic Fuels: The Next Megatrend?,” East-
West Center, Energy Advisory No. 192 (15 January 1997) Honolulu, HI.29 Edward W. Merrow: “An Analysis of Cost Improvement in Chemical Process Technologies,” DOE paper R-
3357-DOE (May 1989).30 F.J. Stermole and J.M. Stermole, Economic Evaluation and Investment Decision Methods, eighth edition,
Golden, Colorado: Investment Evaluations Corporation (1993) 215-216.31 U.S. Department of Energy, Alaska Oil and Gas – Energy Wealth or Vanishing Opportunity?, DOE/ID/01570-
H1 (January 1991)
Related Documents