Optimum Sustainable Population & Changes in Carrying Capacity Michael C. Runge USGS Patuxent Wildlife Research Center Marine Mammal Commission 2014 Annual Meeting Theme 5: Issues Associated with Increasing Marine Mammal Stocks 7 May 2014, Washington, DC

Welcome message from author
This document is posted to help you gain knowledge. Please leave a comment to let me know what you think about it! Share it to your friends and learn new things together.
Transcript
Optimum Sustainable Population
& Changes in Carrying Capacity
Michael C. Runge
USGS Patuxent Wildlife Research Center
Marine Mammal Commission 2014 Annual Meeting
Theme 5: Issues Associated with Increasing Marine Mammal Stocks
7 May 2014, Washington, DC
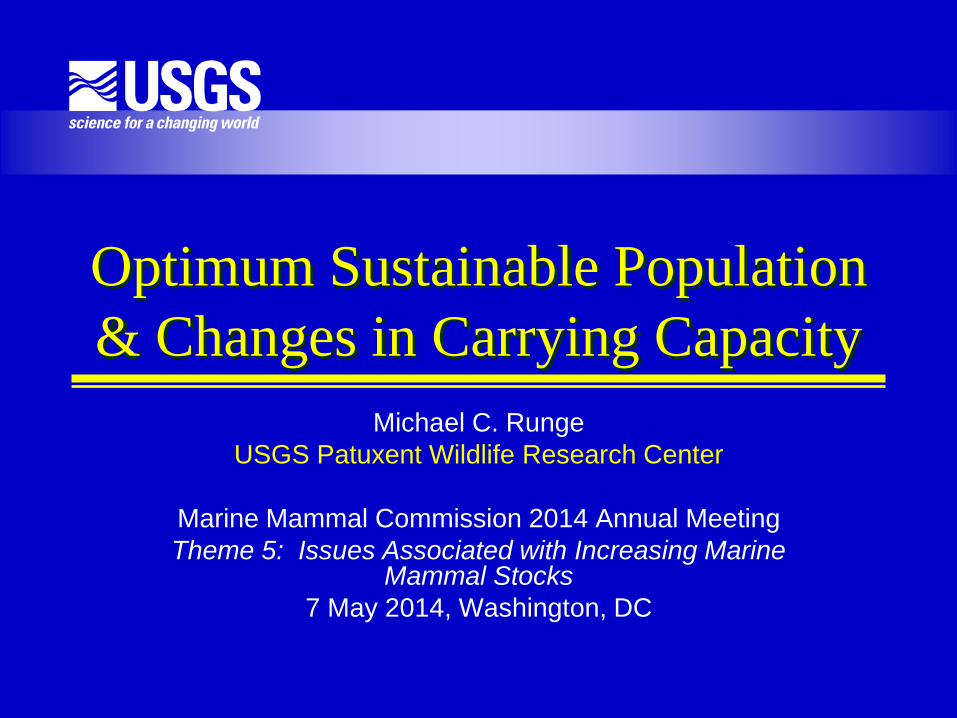
Population Growth with Take
0 10 20 30 40 50 60 70 80 90 100 0
K/2
Carrying Capacity (K)
Time
Po
pu
latio
n S
ize
Unrestrained growth
(rmax = 12%)
Take allowed at 6%
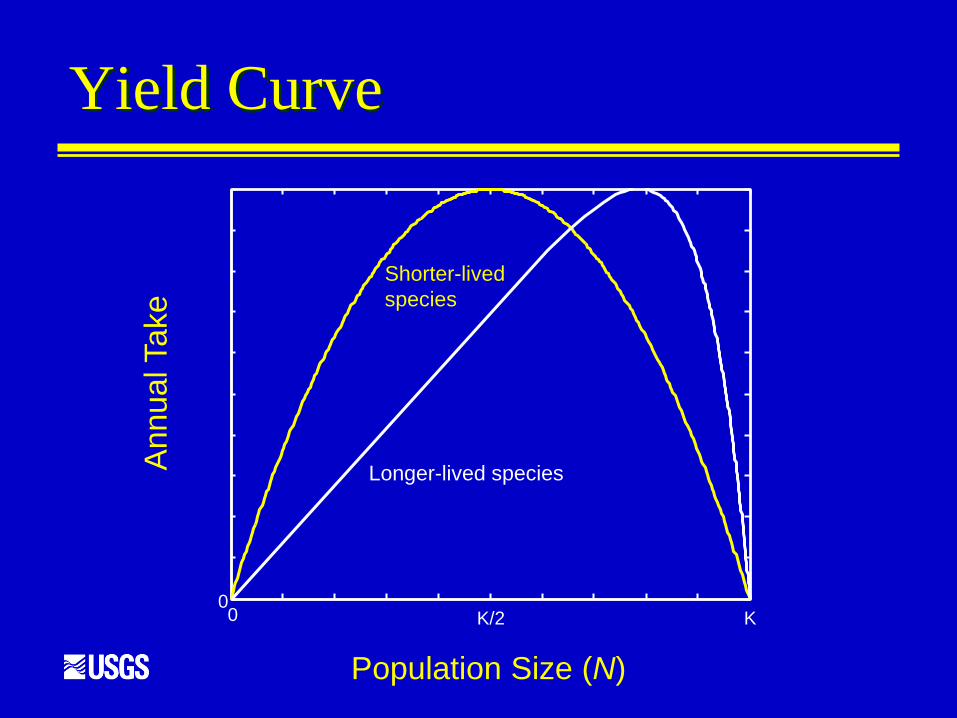
Yield Curve
0 0
K K/2
Ann
ua
l Ta
ke
Population Size (N)
Shorter-lived
species
Longer-lived species
OSP
Concept defined in the MMPA
Optimum sustainable population
• A population that is between the “maximum net
productivity level” and the carrying capacity
Think of this as being on the right shoulder of
the yield curve
• Or having population size greater than the species-
specific fraction of carrying capacity
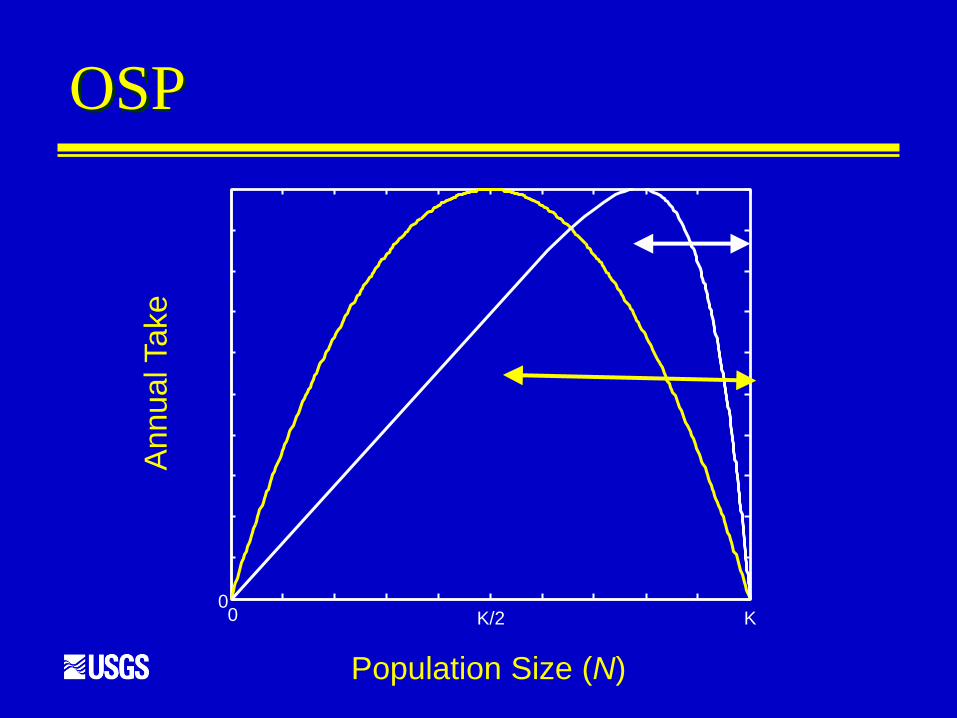
OSP
0 0
K K/2
Ann
ua
l Ta
ke
Population Size (N)
How to determine if OSP is met
Method 1: Compare current population
size to maximum net productivity level
• Determine MNPL as appropriate fraction of
carrying capacity: requires estimation of K
and modeling to determine the fraction
• Modern methods: “integrated population
models”
• Estimate current population size
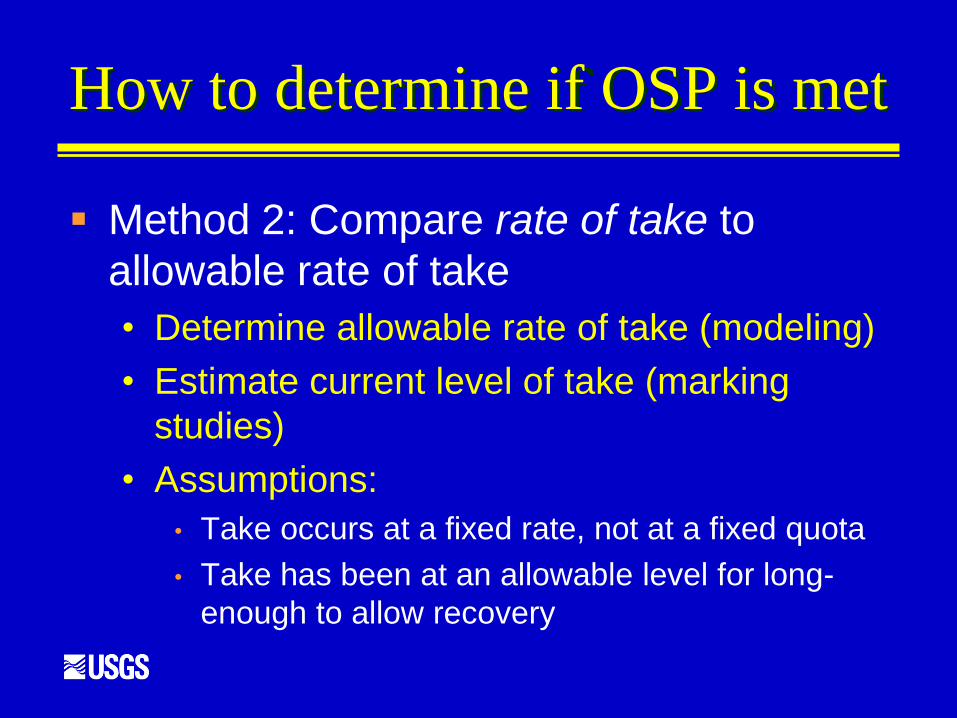
How to determine if OSP is met
Method 2: Compare rate of take to
allowable rate of take
• Determine allowable rate of take (modeling)
• Estimate current level of take (marking
studies)
• Assumptions:
• Take occurs at a fixed rate, not at a fixed quota
• Take has been at an allowable level for long-
enough to allow recovery
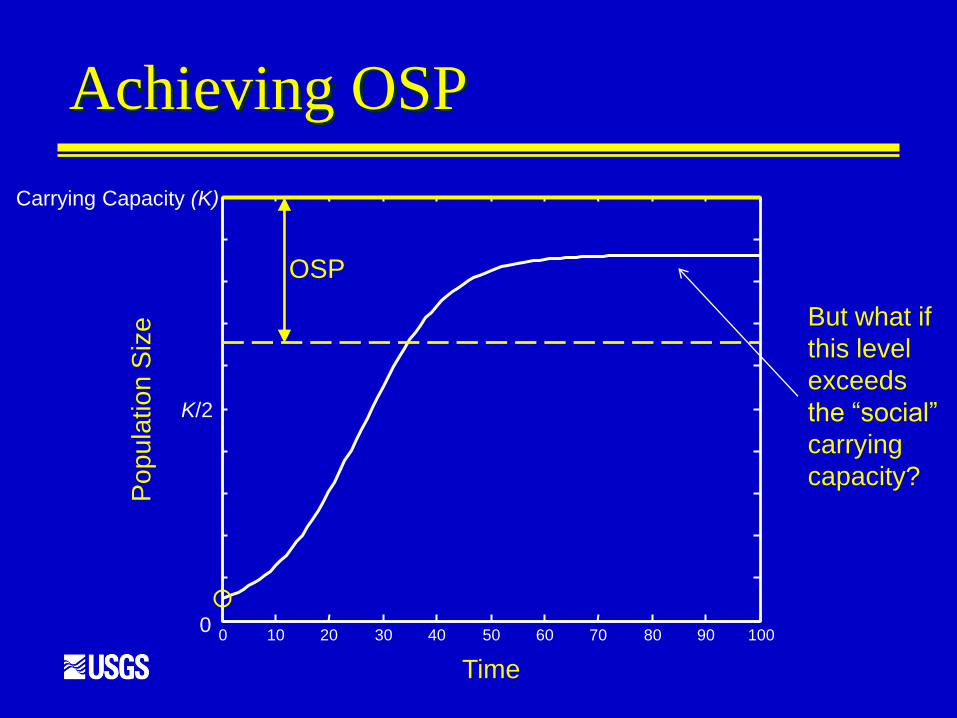
Achieving OSP
0 10 20 30 40 50 60 70 80 90 100 0
K/2
Carrying Capacity (K)
Time
Po
pu
latio
n S
ize
OSP
But what if
this level
exceeds
the “social”
carrying
capacity?
Spatial scale of OSP
OSP is determined at the scale of the
marine mammal stock
• Carrying capacity, OSP, and allowable take
are all defined at that same scale
Take could occur at more local scales
• A stock could still meet OSP even if a local
take rate exceeded allowable levels
What Happens if Carrying
Capacity Changes?
What does OSP mean?
OSP and Changing K
The concepts described in the
MMPA (OSP, PBR, MNPL, etc.)
• Are most easily understood in the
context of a stable carrying capacity
But what does OSP mean when the
carrying capacity increases or
decreases?
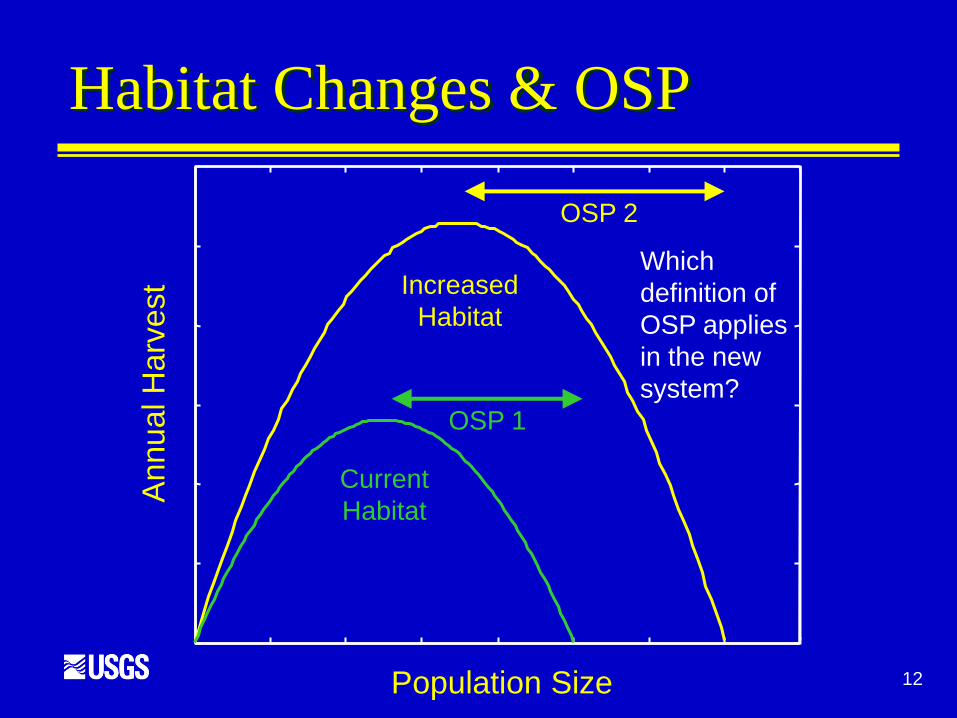
Population Size
Annual H
arv
est
12
Increased
Habitat
Current
Habitat
Habitat Changes & OSP
OSP 2
OSP 1
Which
definition of
OSP applies
in the new
system?
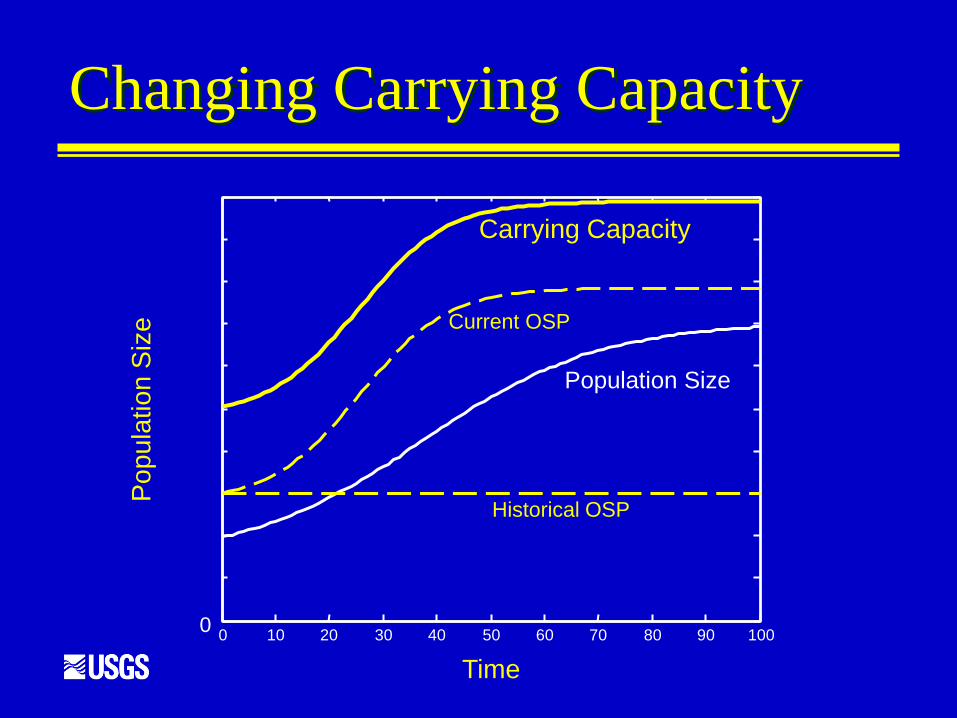
Changing Carrying Capacity
0 10 20 30 40 50 60 70 80 90 100 0
Time
Po
pu
latio
n S
ize
Carrying Capacity
Population Size
Historical OSP
Current OSP
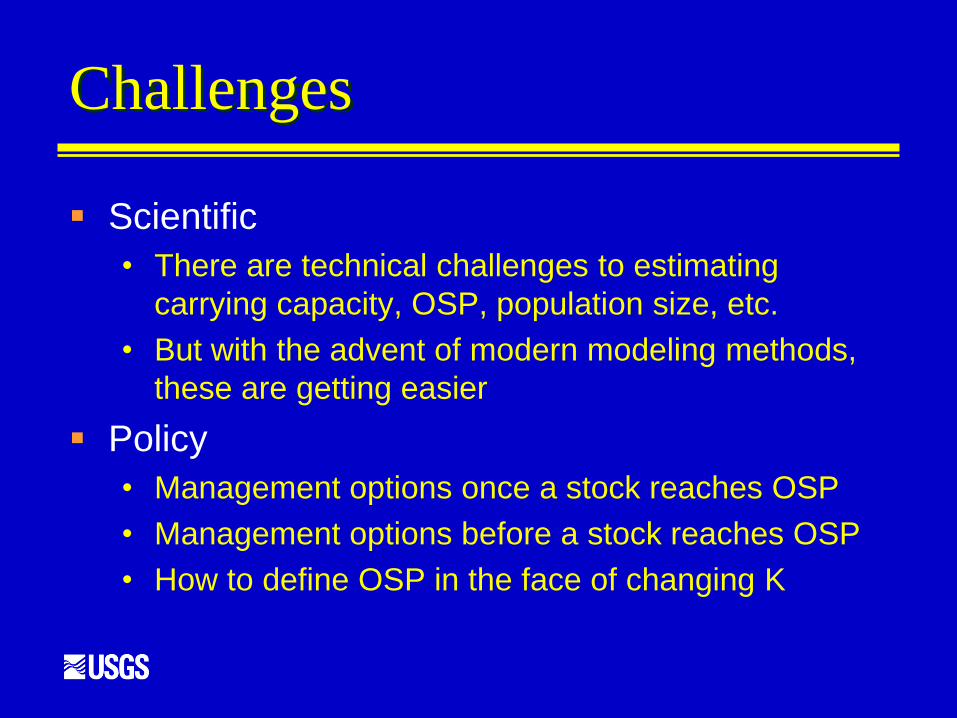
Challenges
Scientific
• There are technical challenges to estimating
carrying capacity, OSP, population size, etc.
• But with the advent of modern modeling methods,
these are getting easier
Policy
• Management options once a stock reaches OSP
• Management options before a stock reaches OSP
• How to define OSP in the face of changing K
Related Documents