© 2016 Apple Inc. All rights reserved. Redistribution or public display not permitted without written permission from Apple. Developer Tools #WWDC16 Session 420 Optimizing Web Content in Your App Jon Davis Web Technologies Evangelist Brian Burg Safari and WebKit Engineer

Welcome message from author
This document is posted to help you gain knowledge. Please leave a comment to let me know what you think about it! Share it to your friends and learn new things together.
Transcript

© 2016 Apple Inc. All rights reserved. Redistribution or public display not permitted without written permission from Apple.
Developer Tools #WWDC16
Session 420
Optimizing Web Content in Your App
Jon Davis Web Technologies EvangelistBrian Burg Safari and WebKit Engineer


Web Inspector

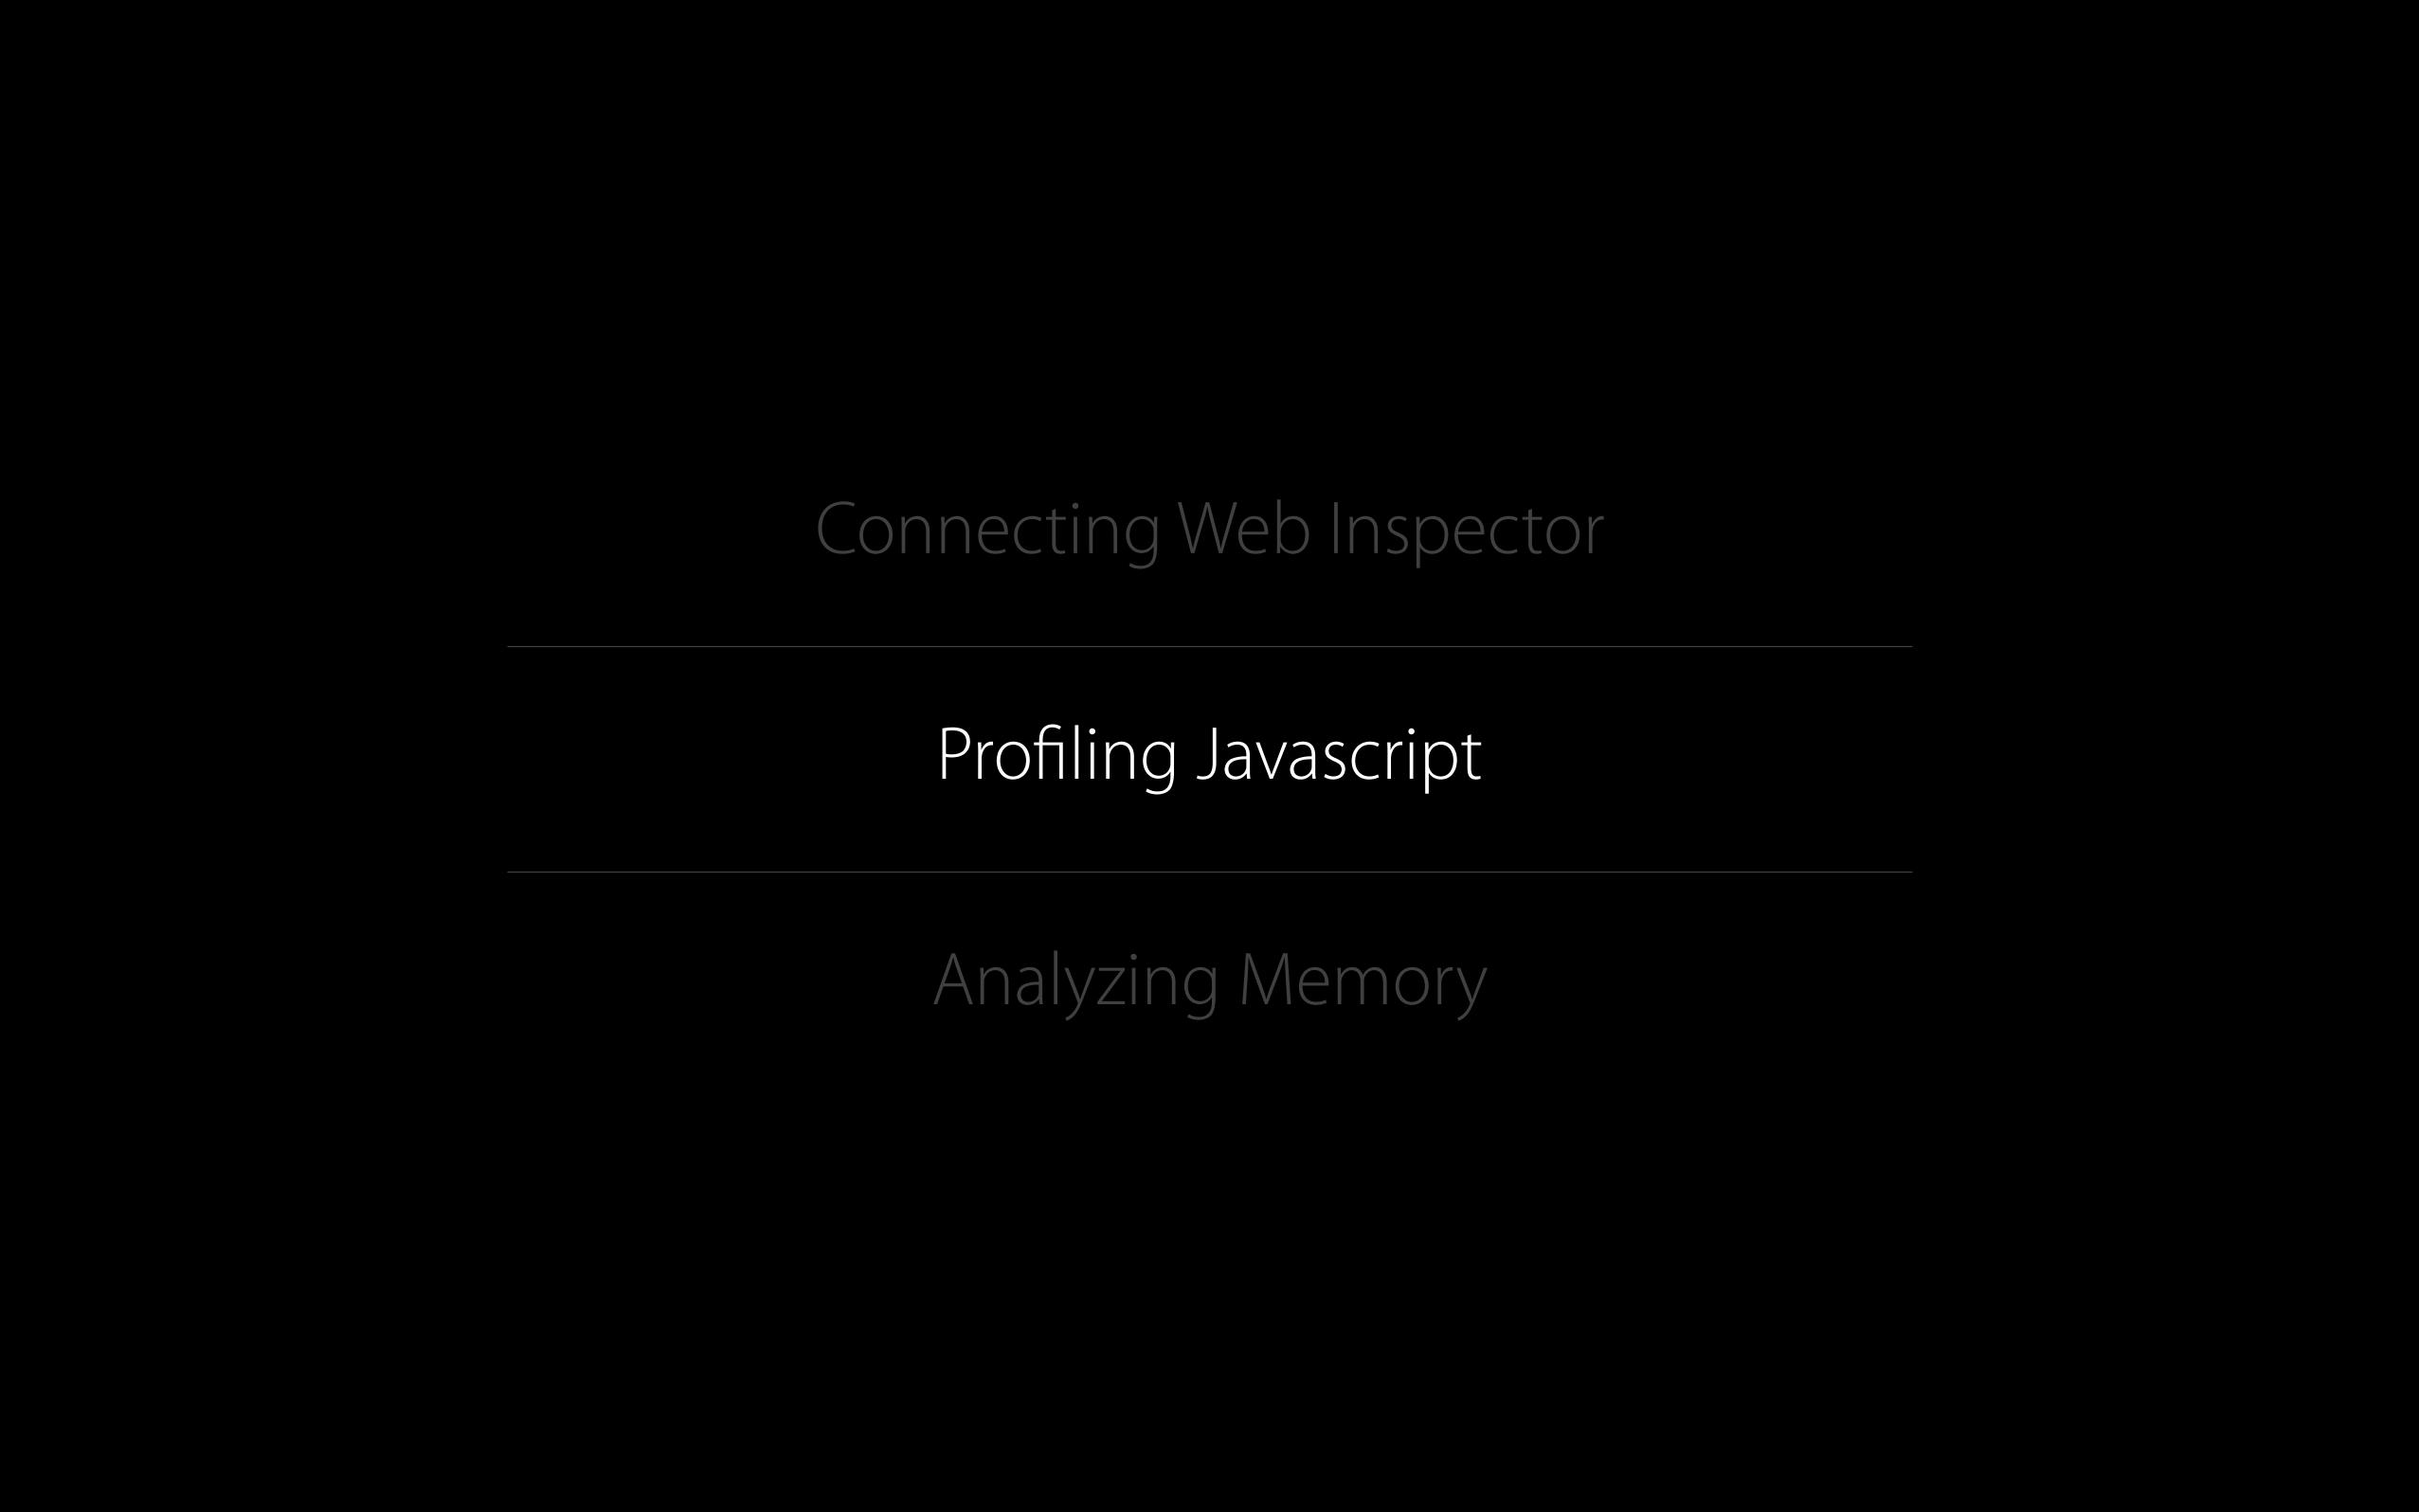
Connecting Web Inspector
Profiling Javascript
Analyzing Memory

Connecting Web Inspector
Profiling Javascript
Analyzing Memory

Connecting Web Inspector
Profiling Javascript
Analyzing Memory

Connecting Web Inspector
Profiling Javascript
Analyzing Memory

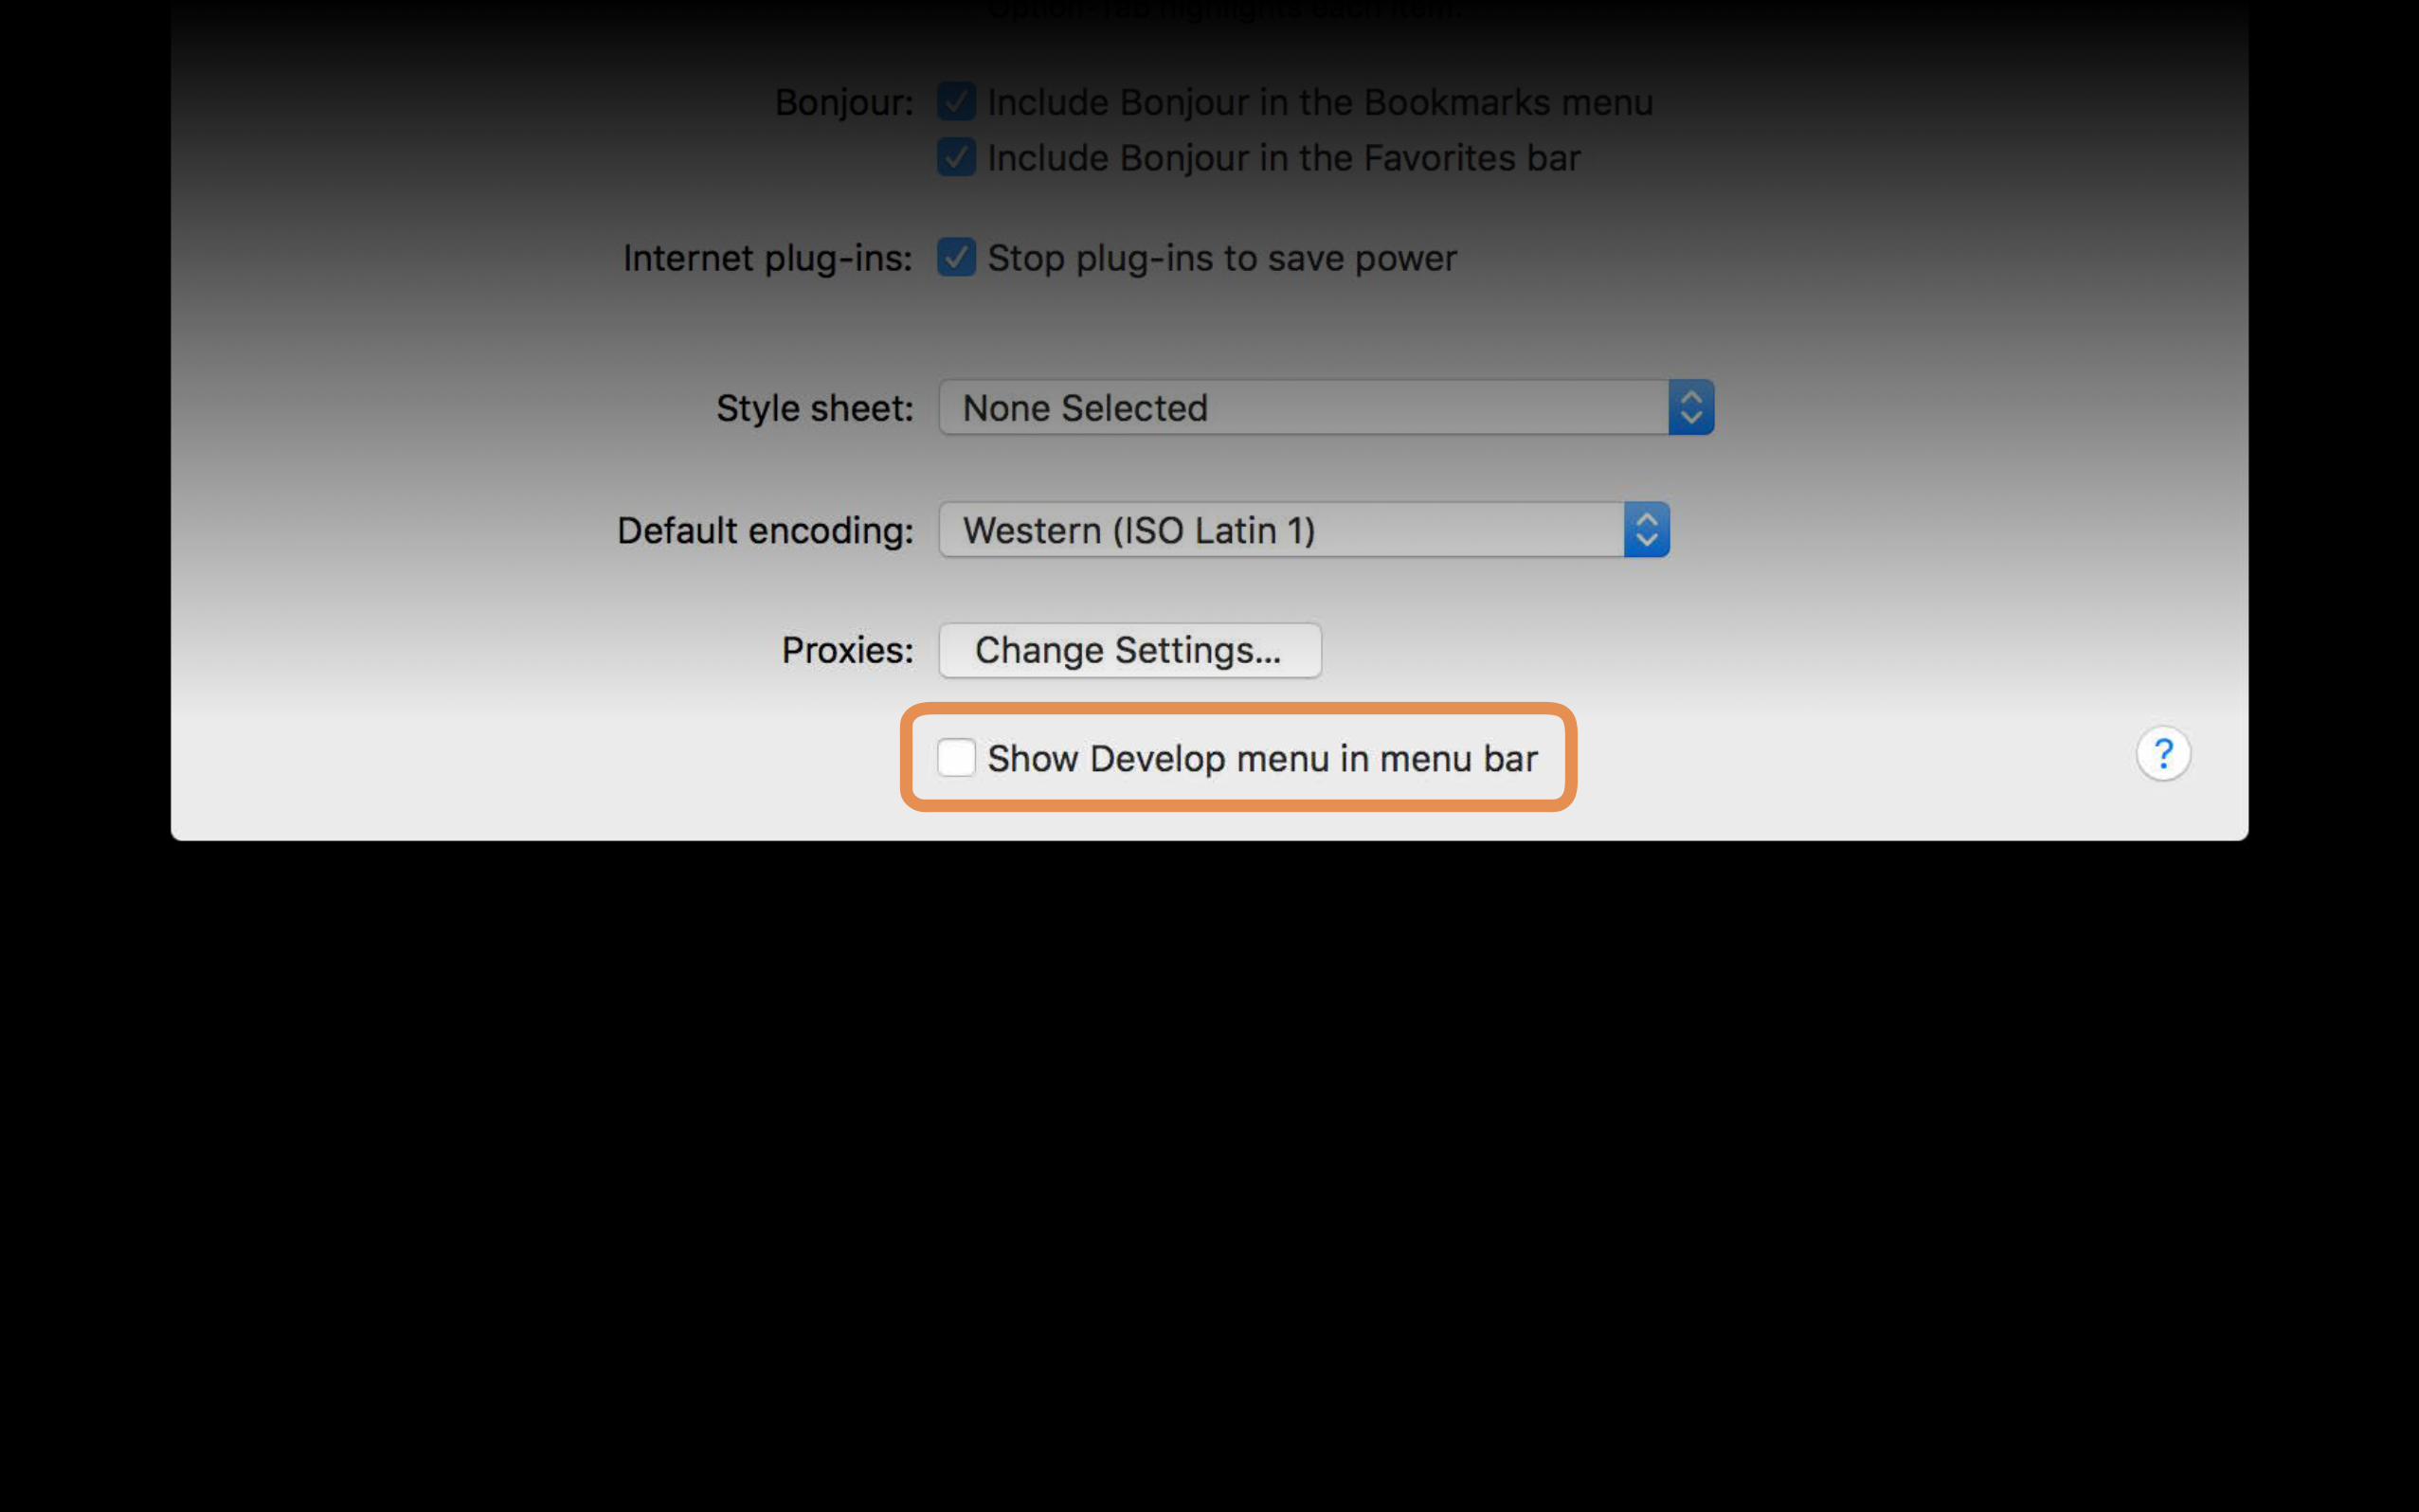
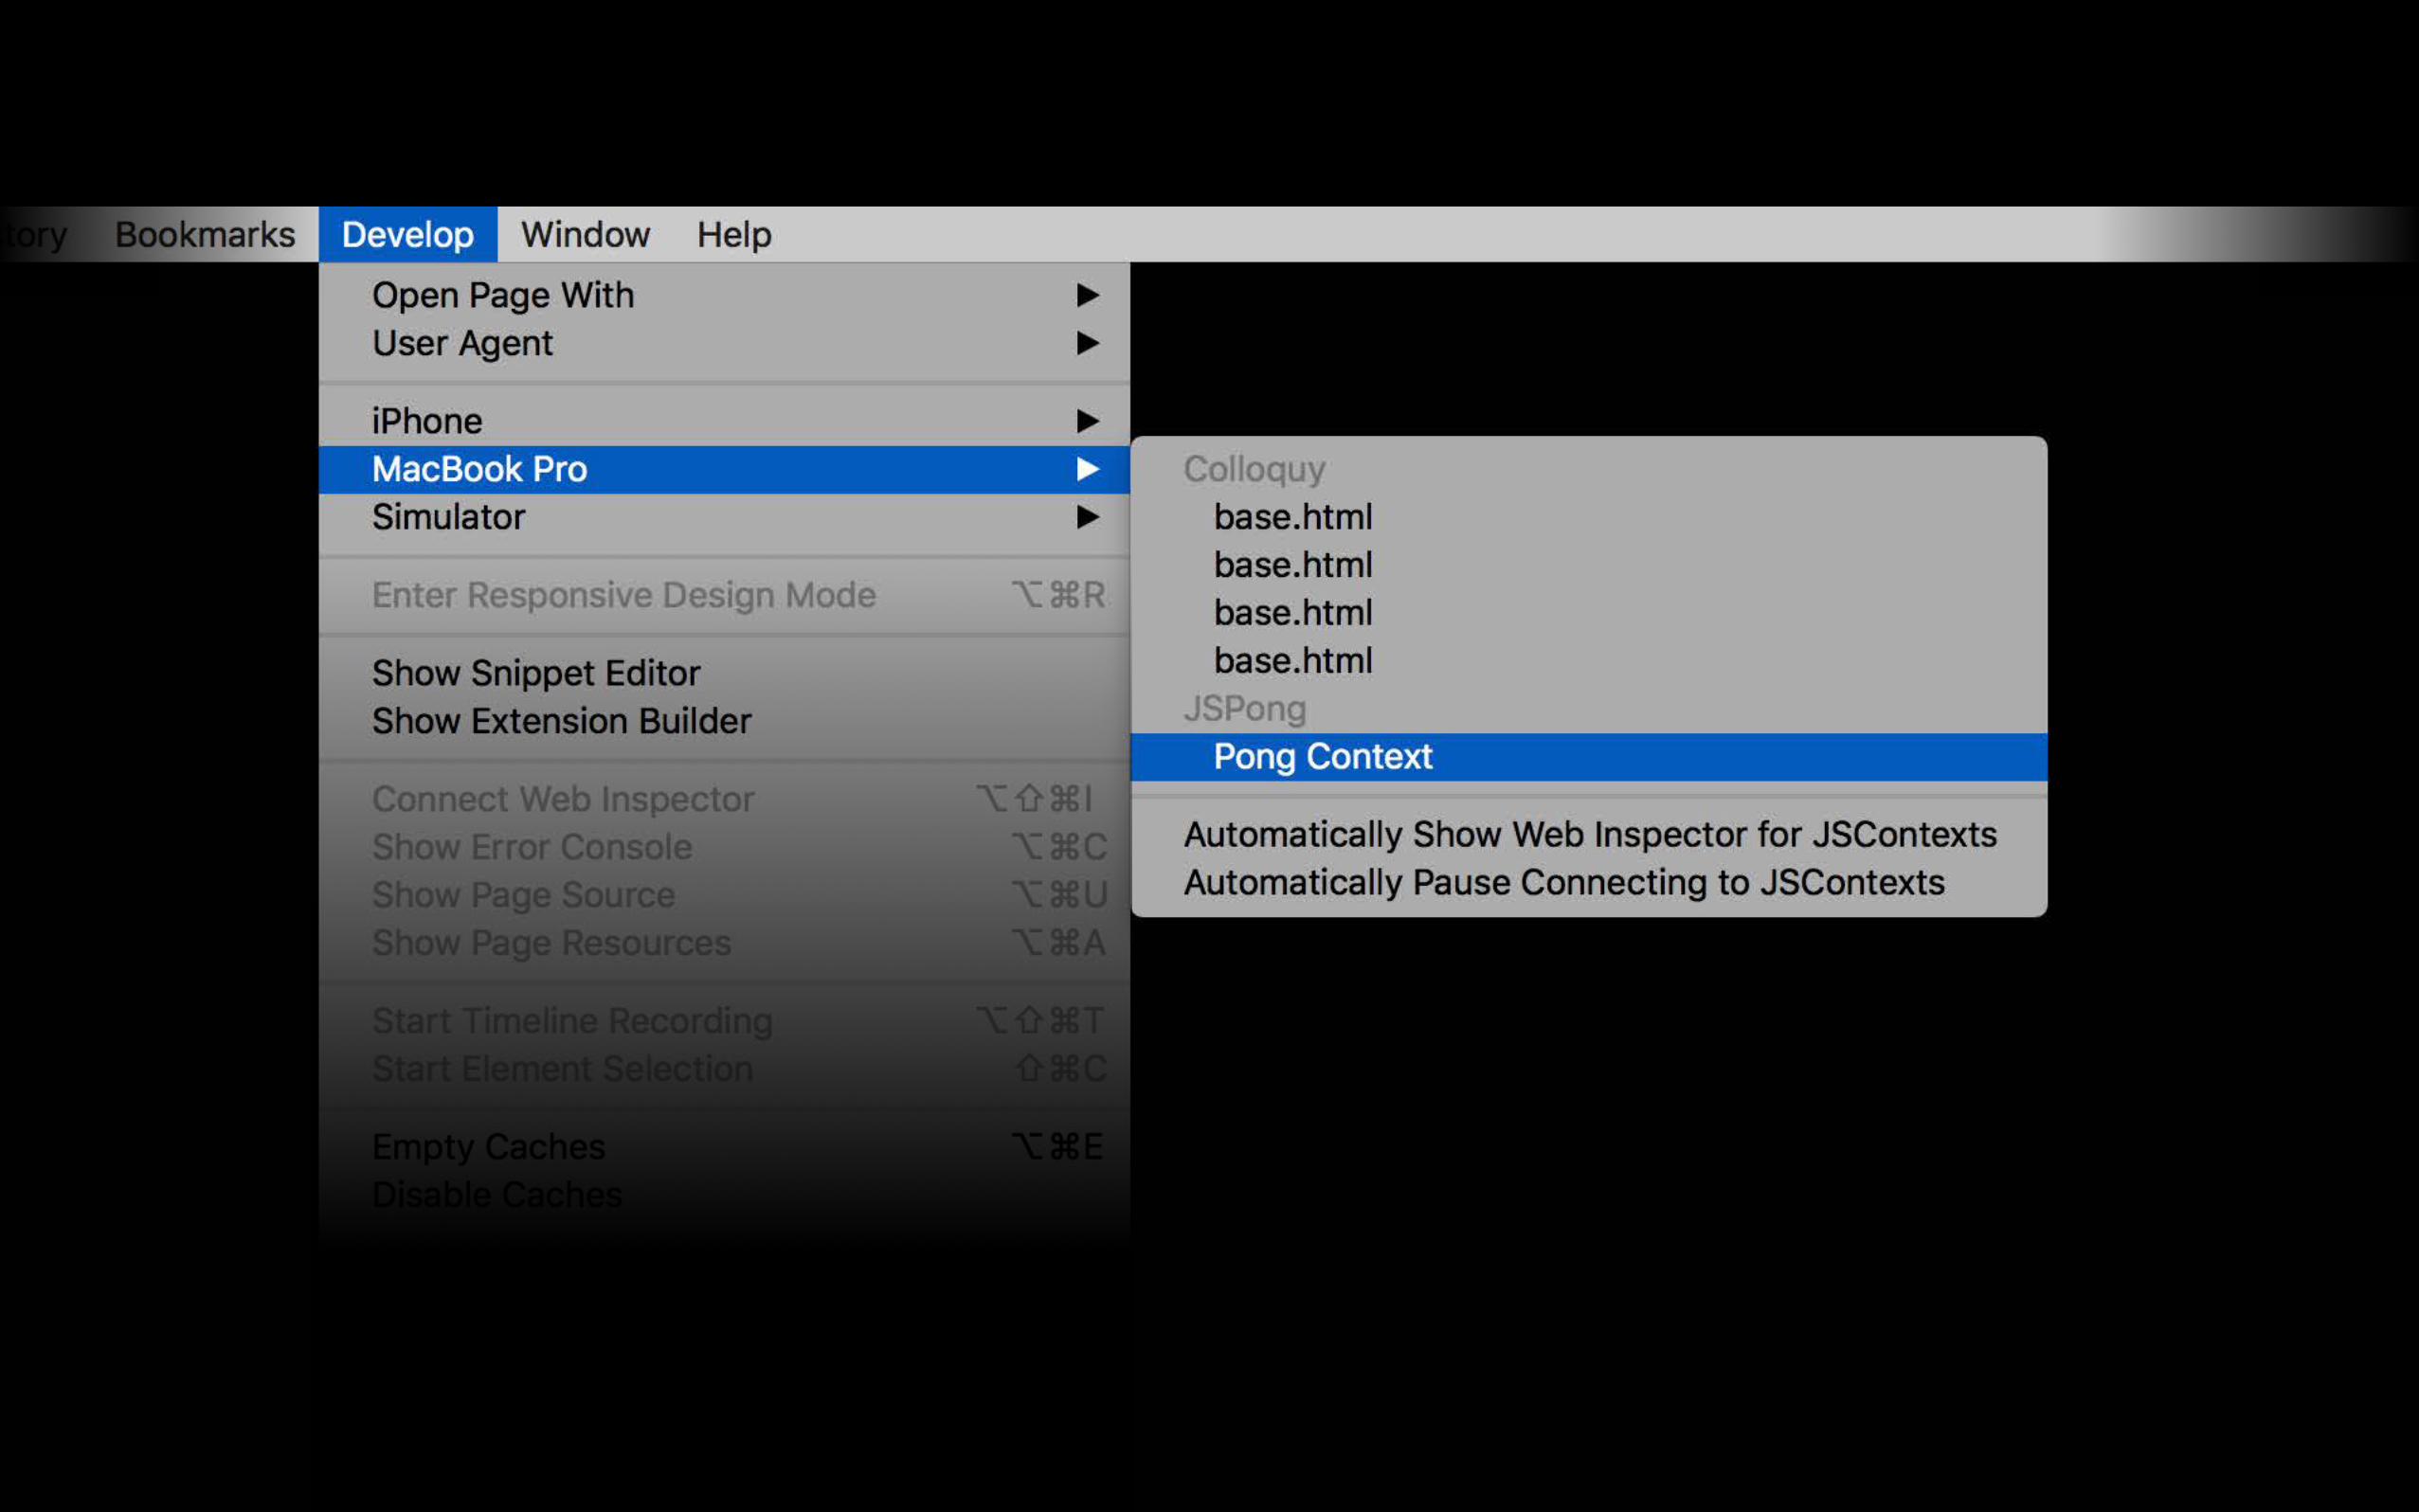
Connecting Web Inspector


JSContext


Introducing Safari View Controller WWDC 2015


WKWebView

Introducing Safari View Controller WWDC 2014


Web Inspector


Key Type Value
▼ Entitlements File Dictionary (1 item)
com.apple.webinspector.allow Boolean YES


Connecting Web Inspector
Profiling Javascript
Analyzing Memory
Connecting Web Inspector
Profiling Javascript
Analyzing Memory

Profiling JavaScript

Sampling Profiler
NEW

Sampling ProfilerProfiling JavaScript
Where is the time being spent?
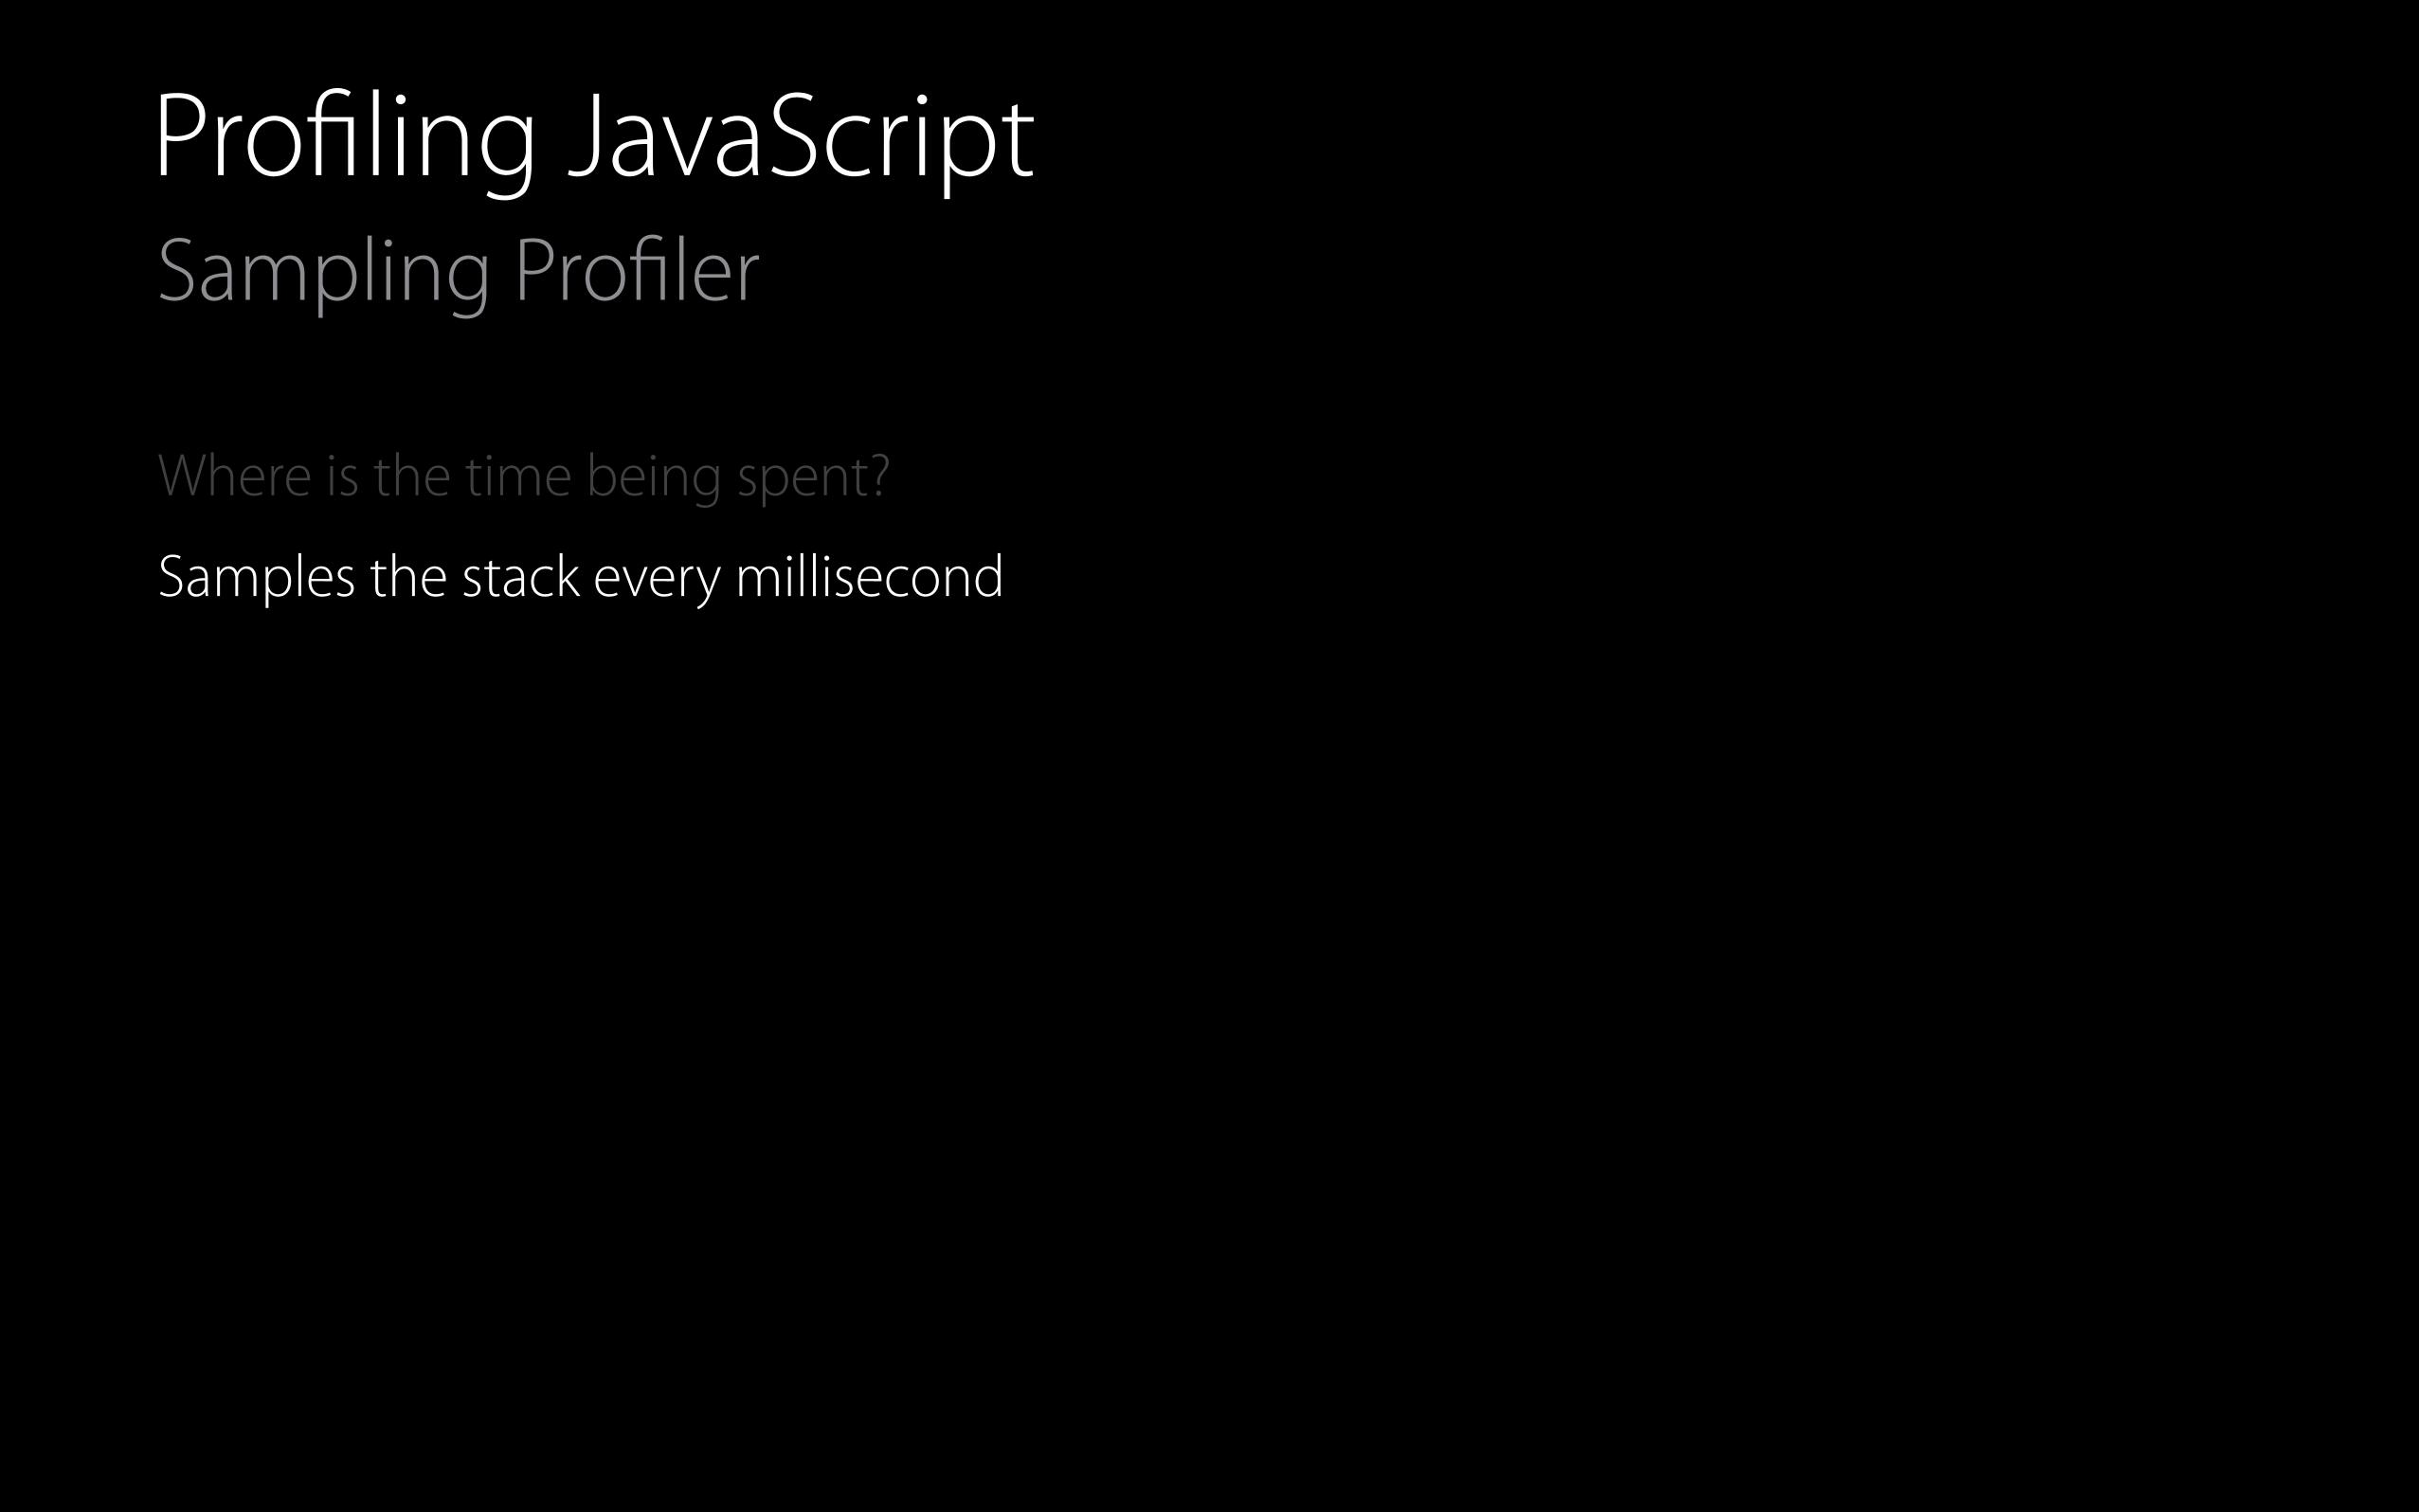
Sampling ProfilerProfiling JavaScript
Where is the time being spent?Samples the stack every millisecond

Sampling ProfilerProfiling JavaScript
Where is the time being spent?Samples the stack every millisecondRuns with all four tiers of the JIT compiler

Sampling ProfilerProfiling JavaScript
Where is the time being spent?Samples the stack every millisecondRuns with all four tiers of the JIT compilerBreakpoints and debugger statements are ignored

JavaScript Profiling Speed Improvement
30×Up to

Events viewProfiling JavaScript
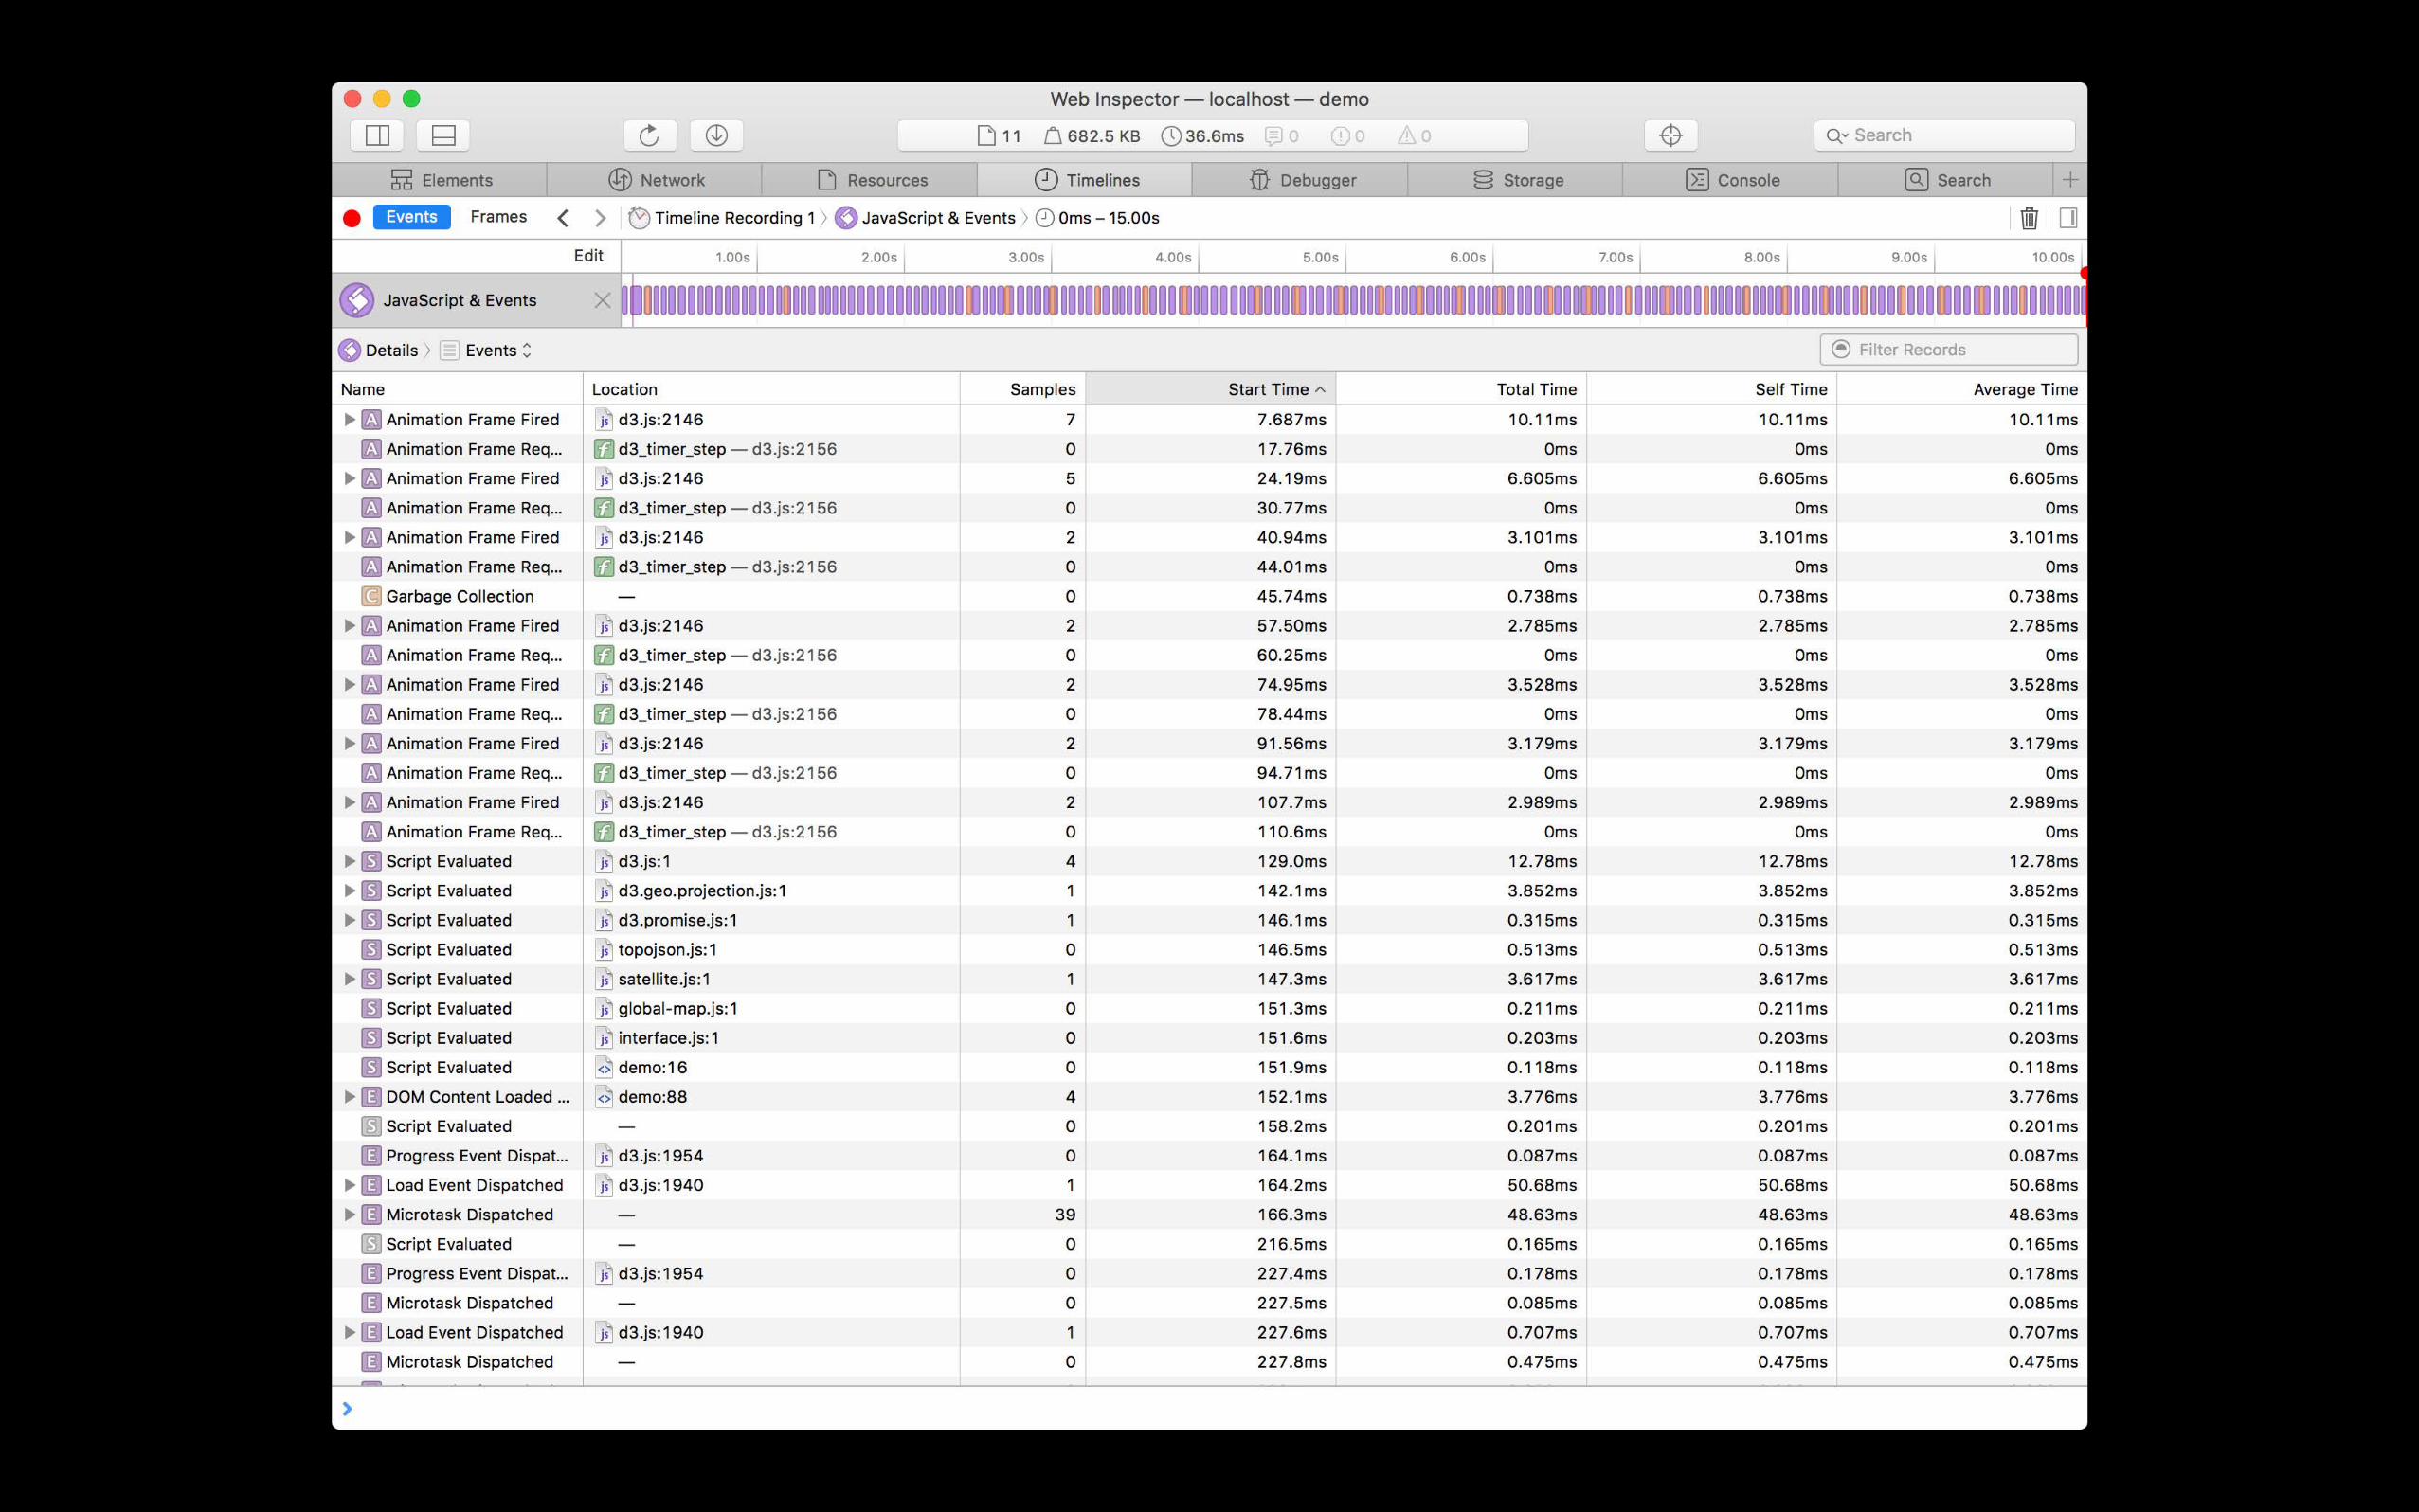


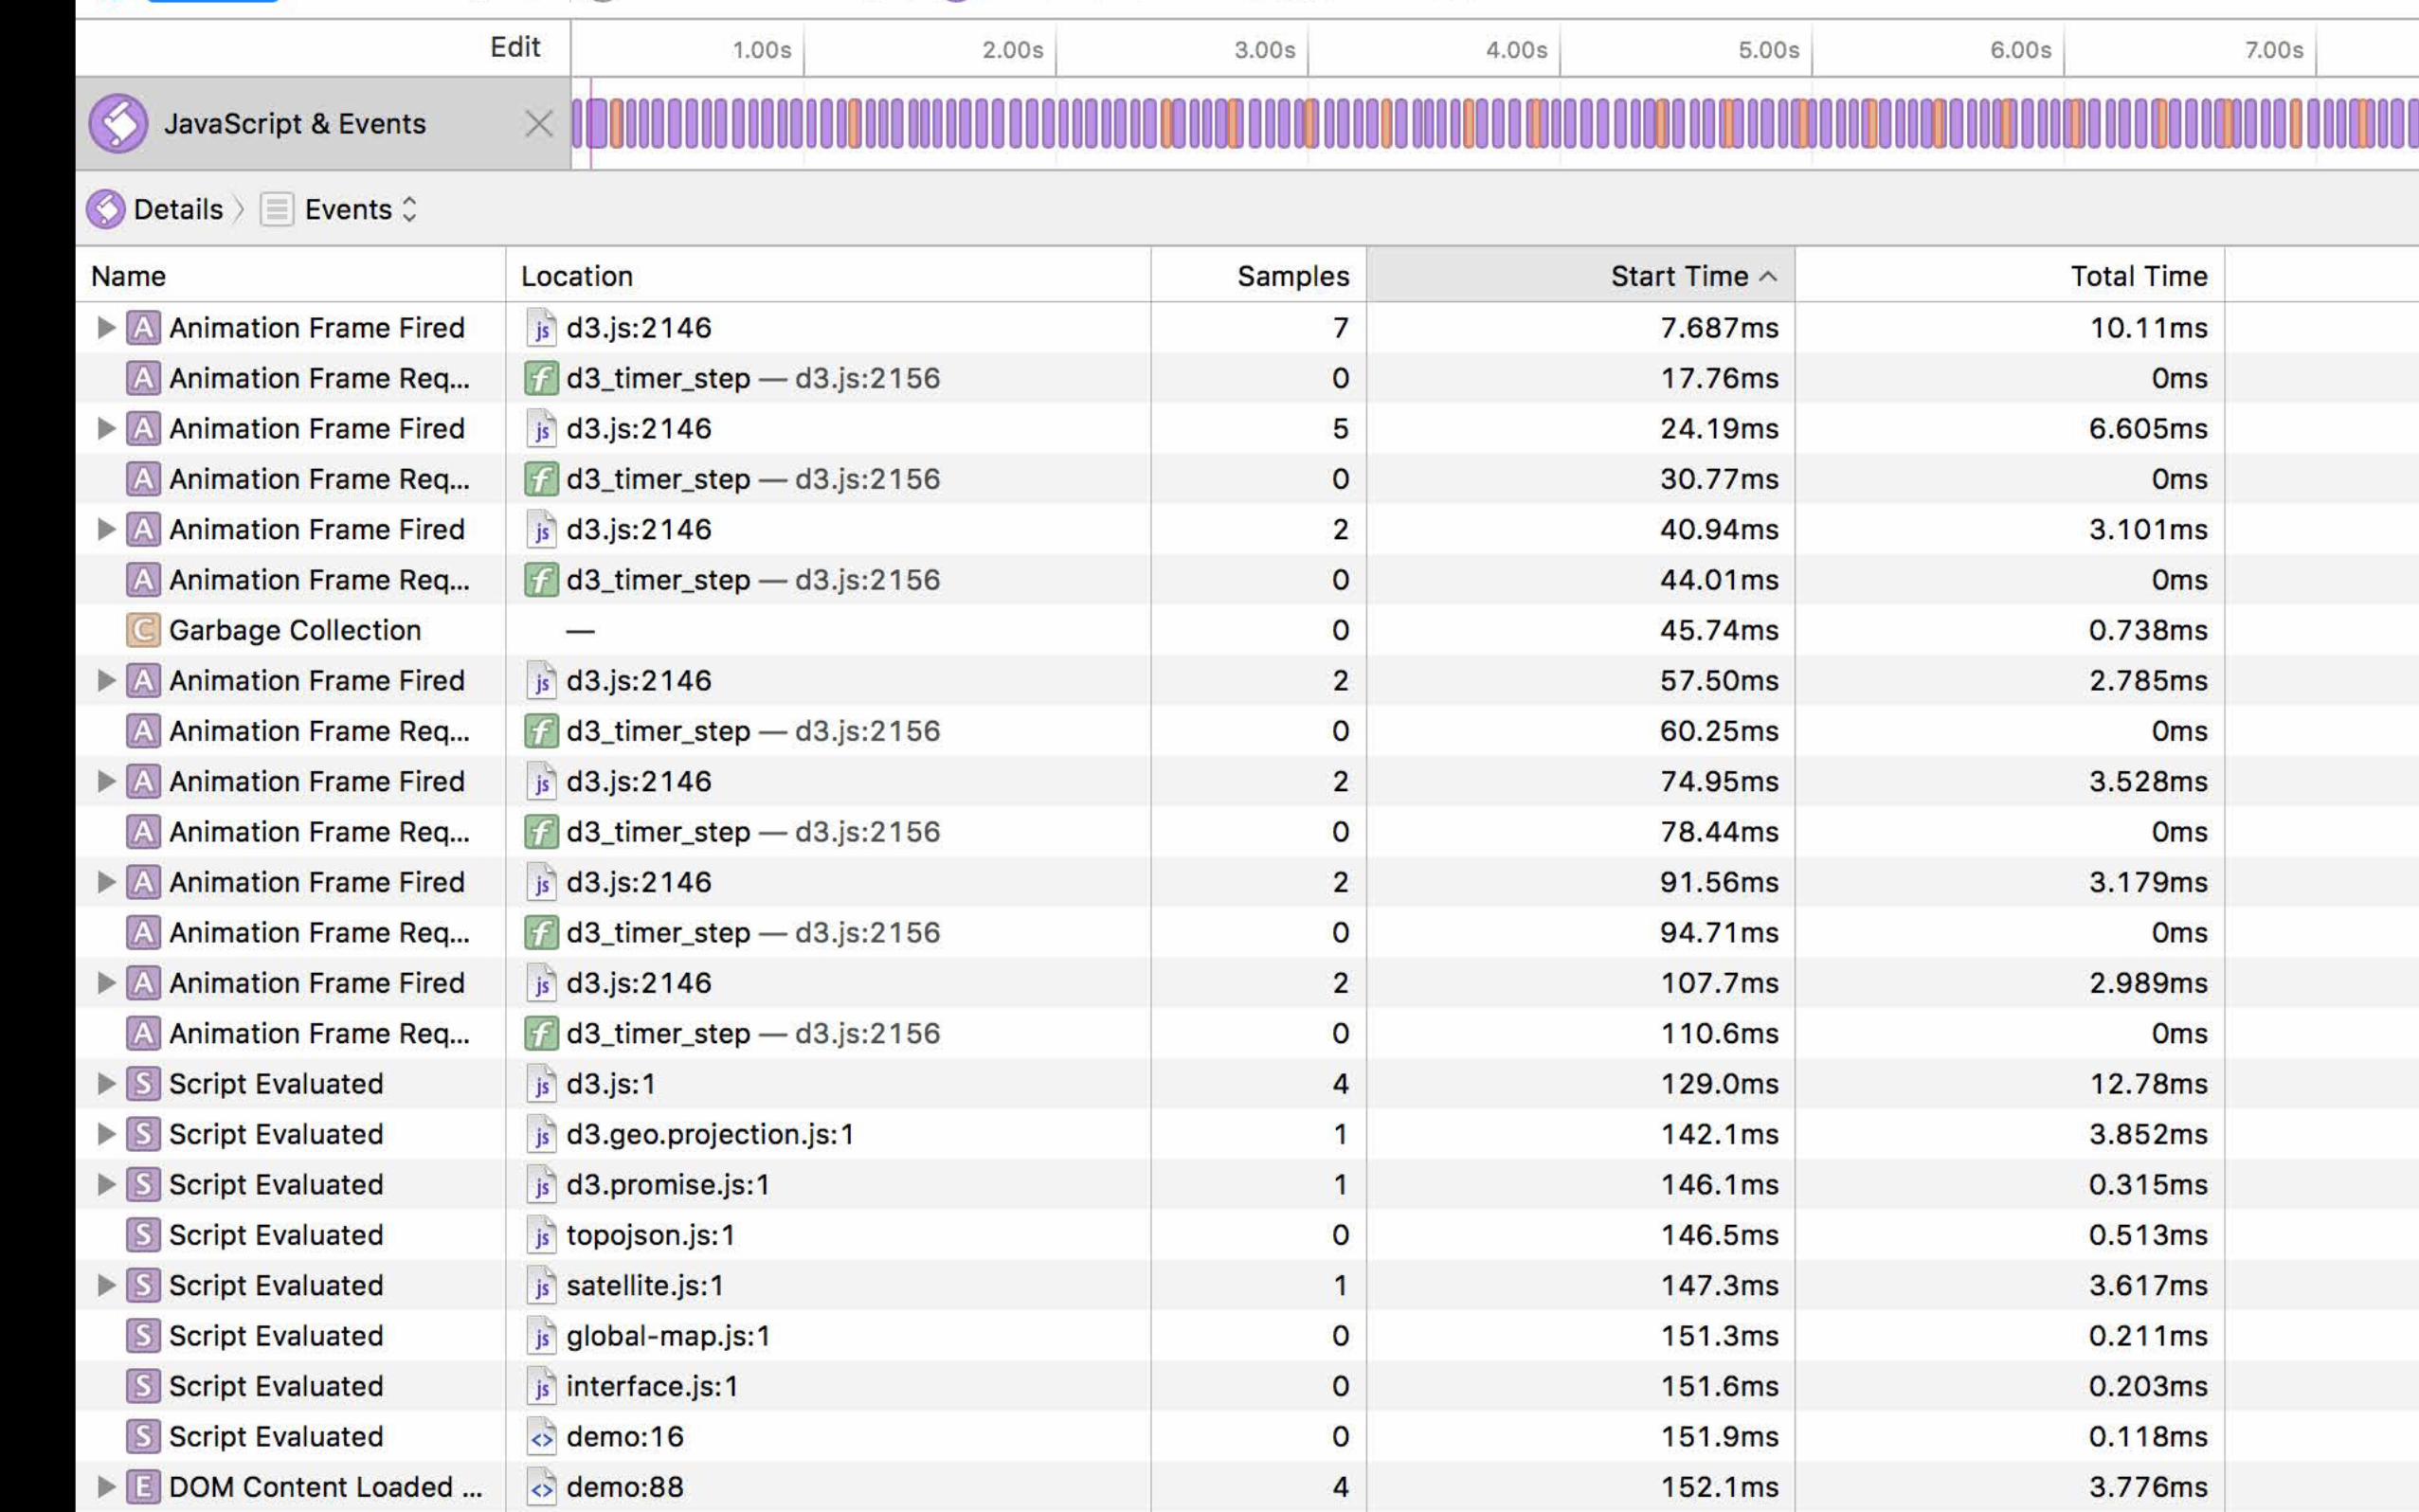
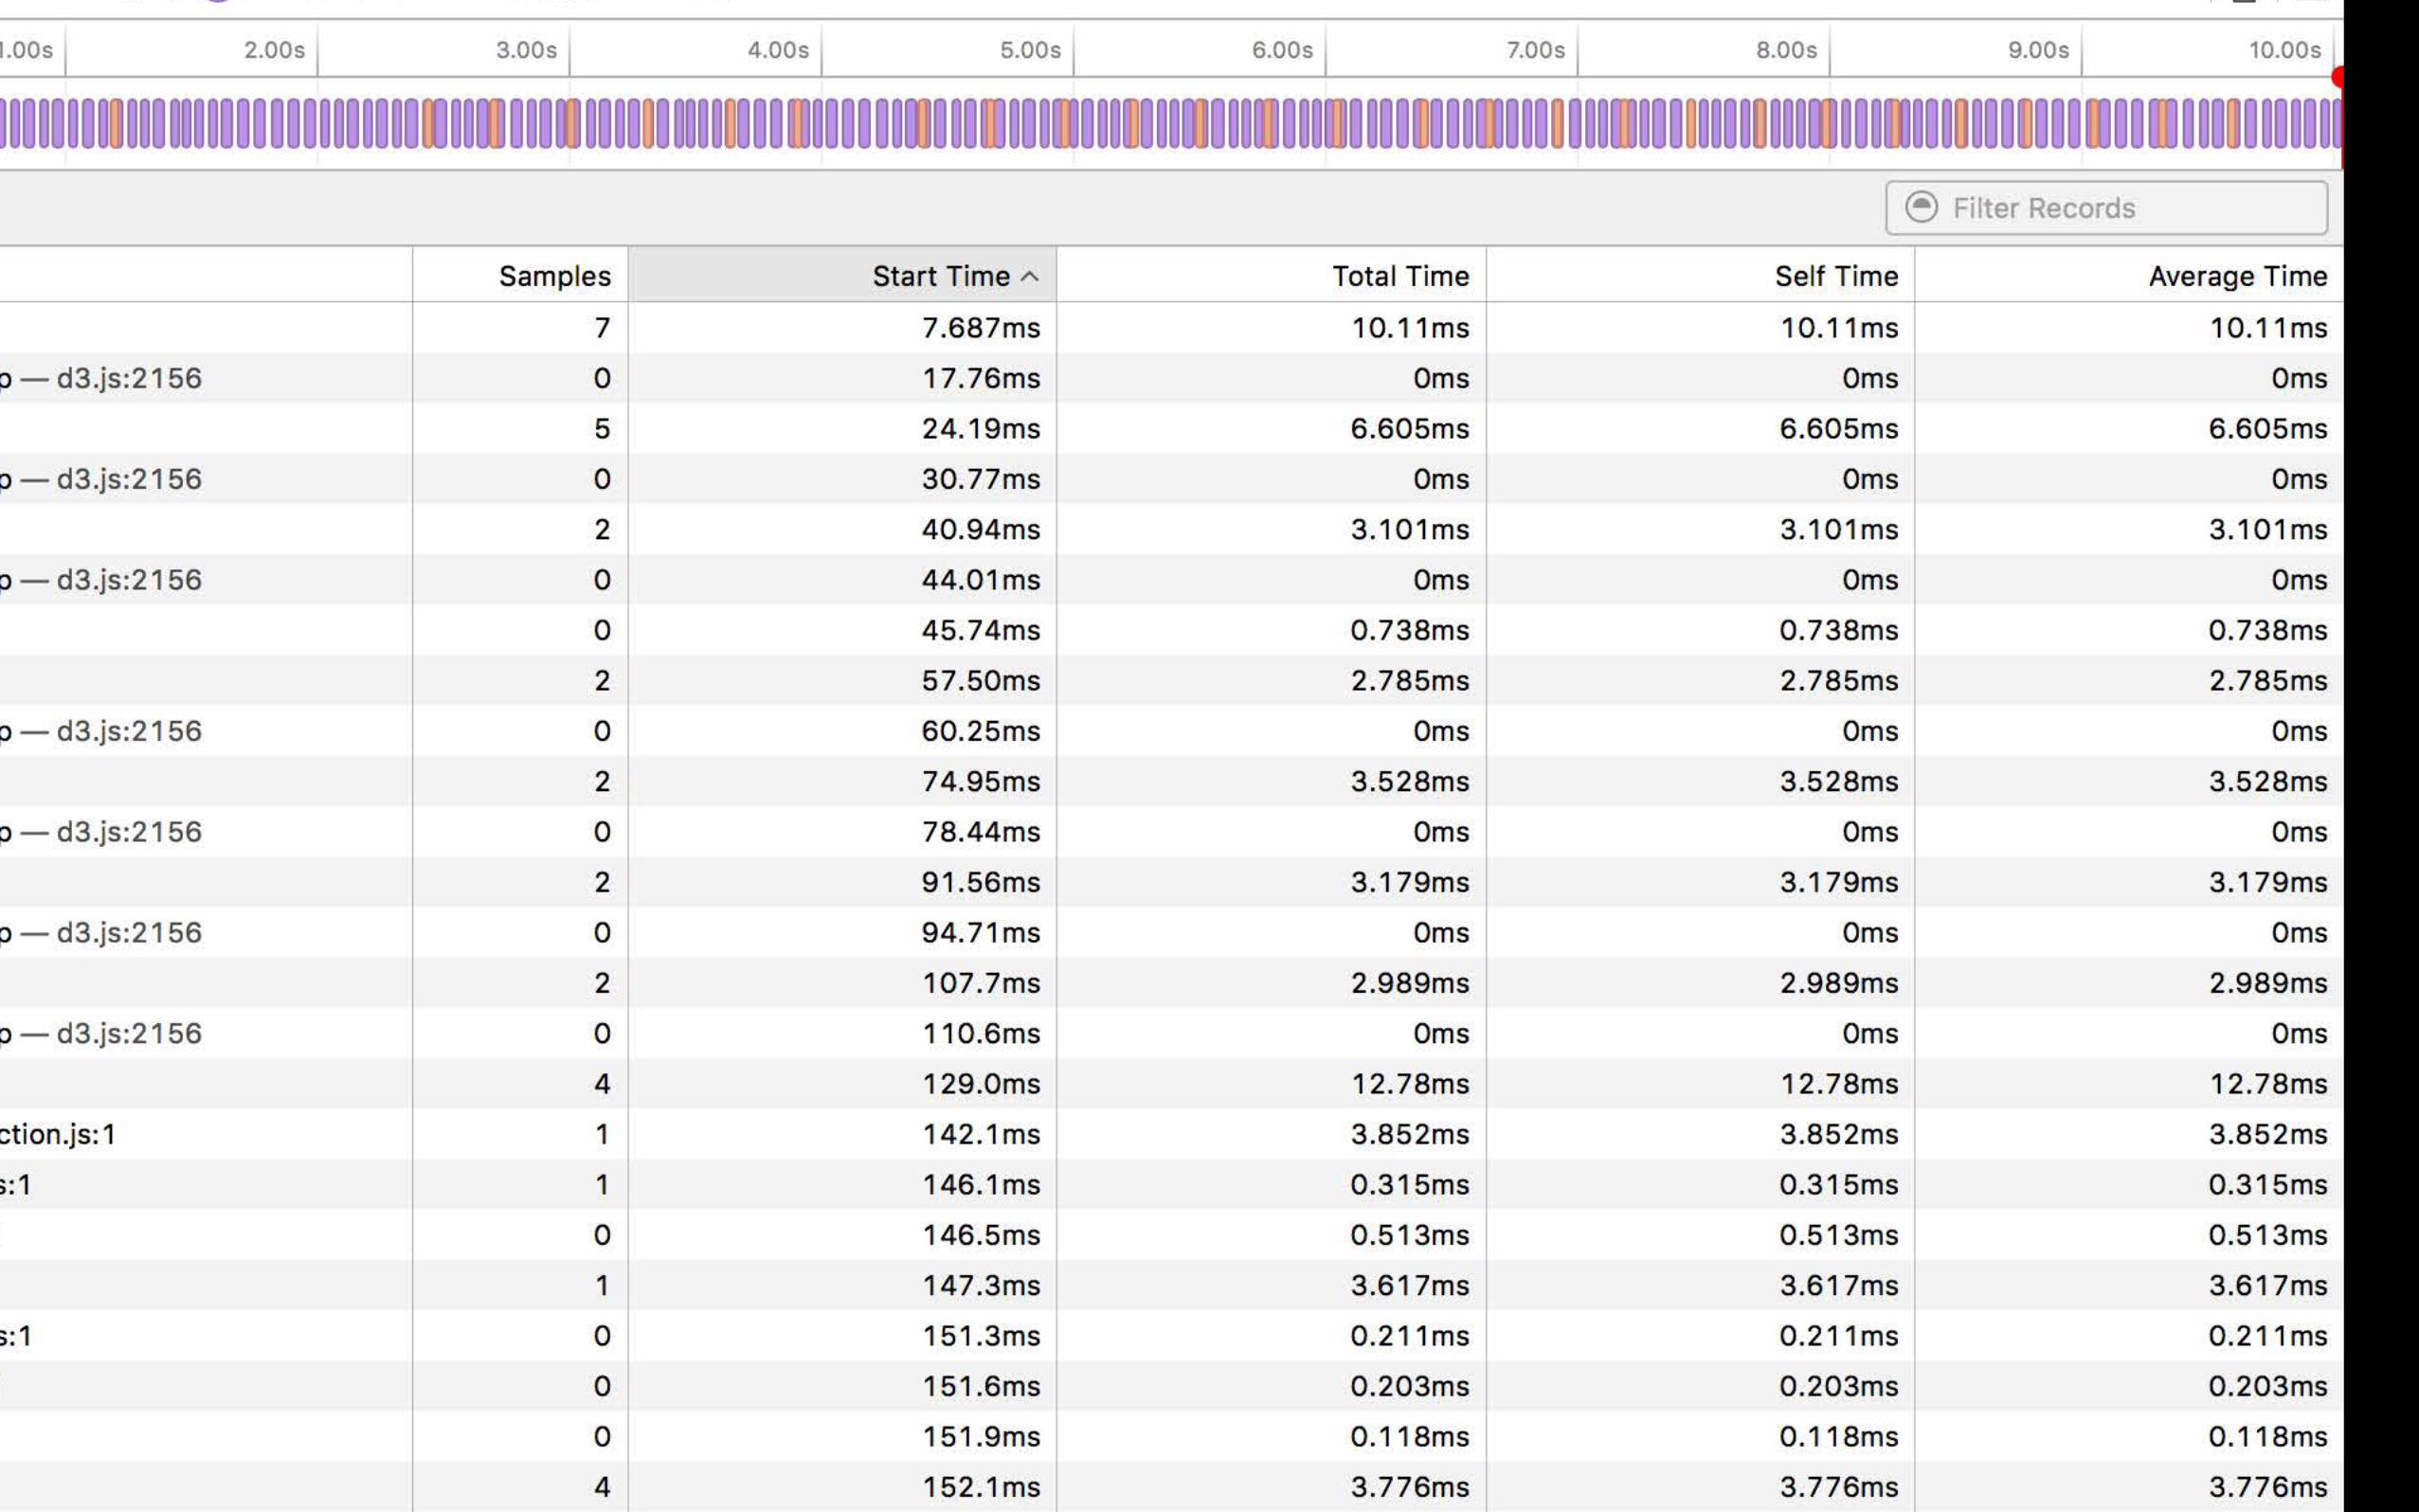


Events viewProfiling JavaScript
•Events view is helpful, but there is another view that we've added for you…

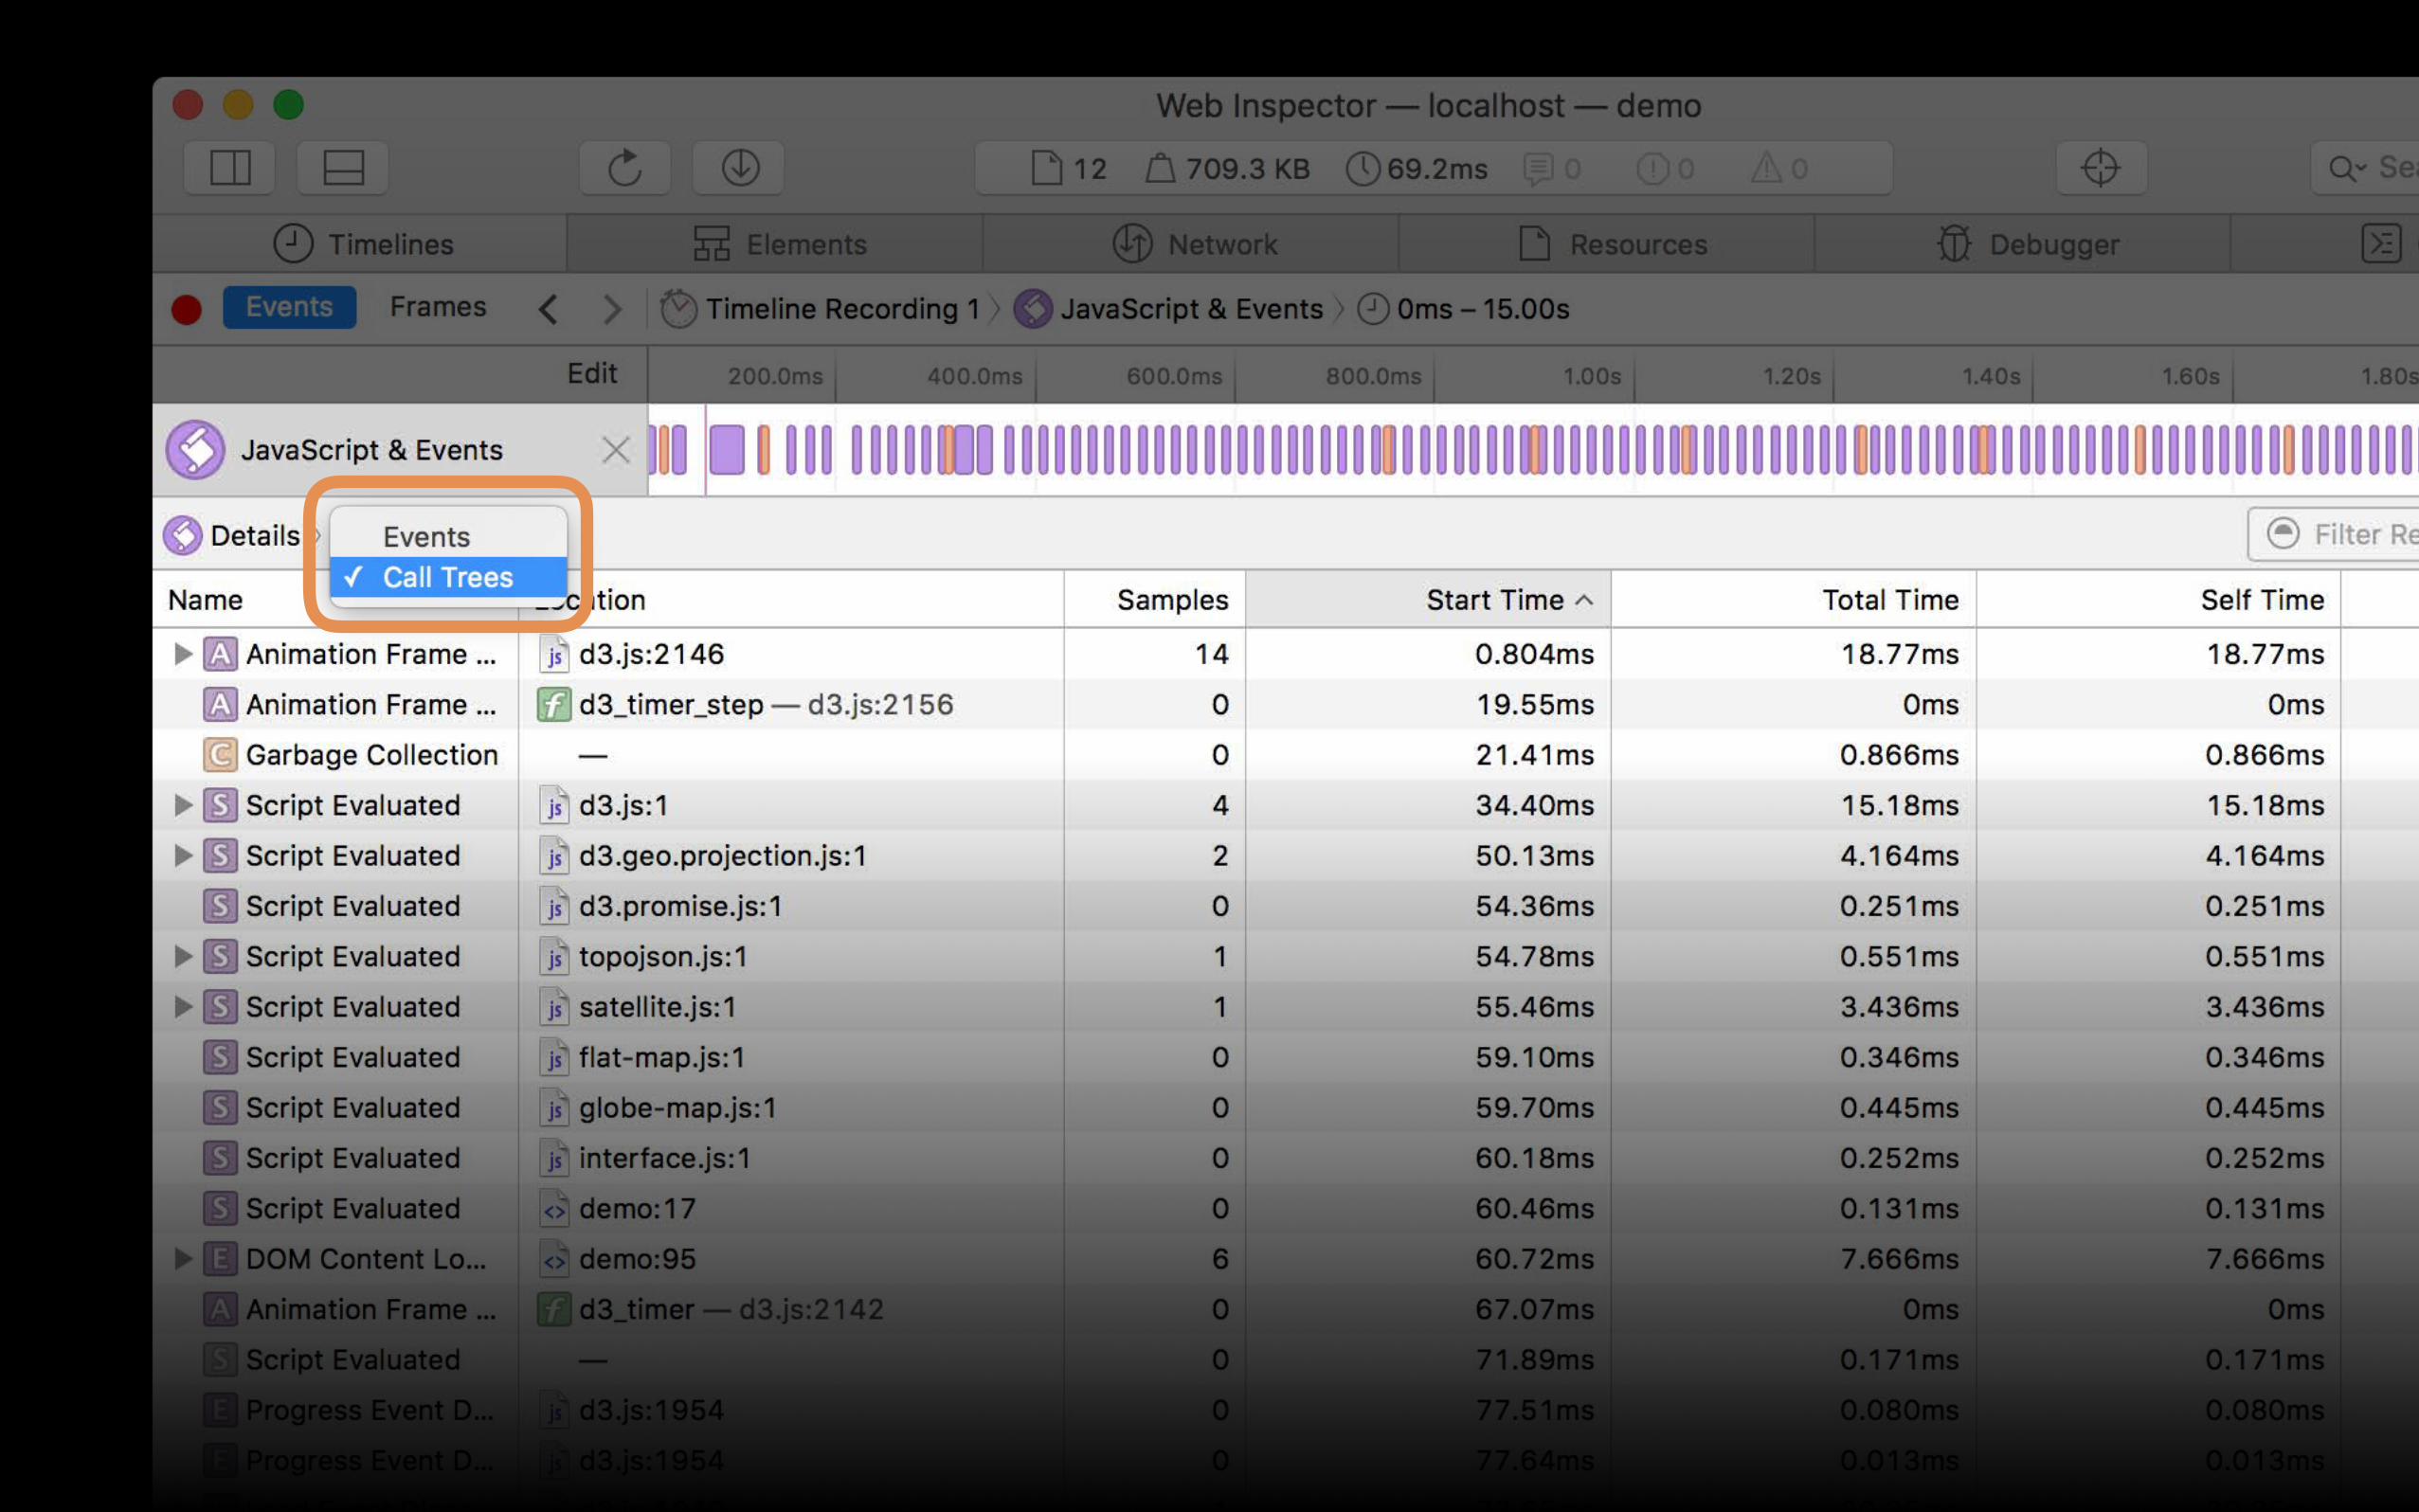
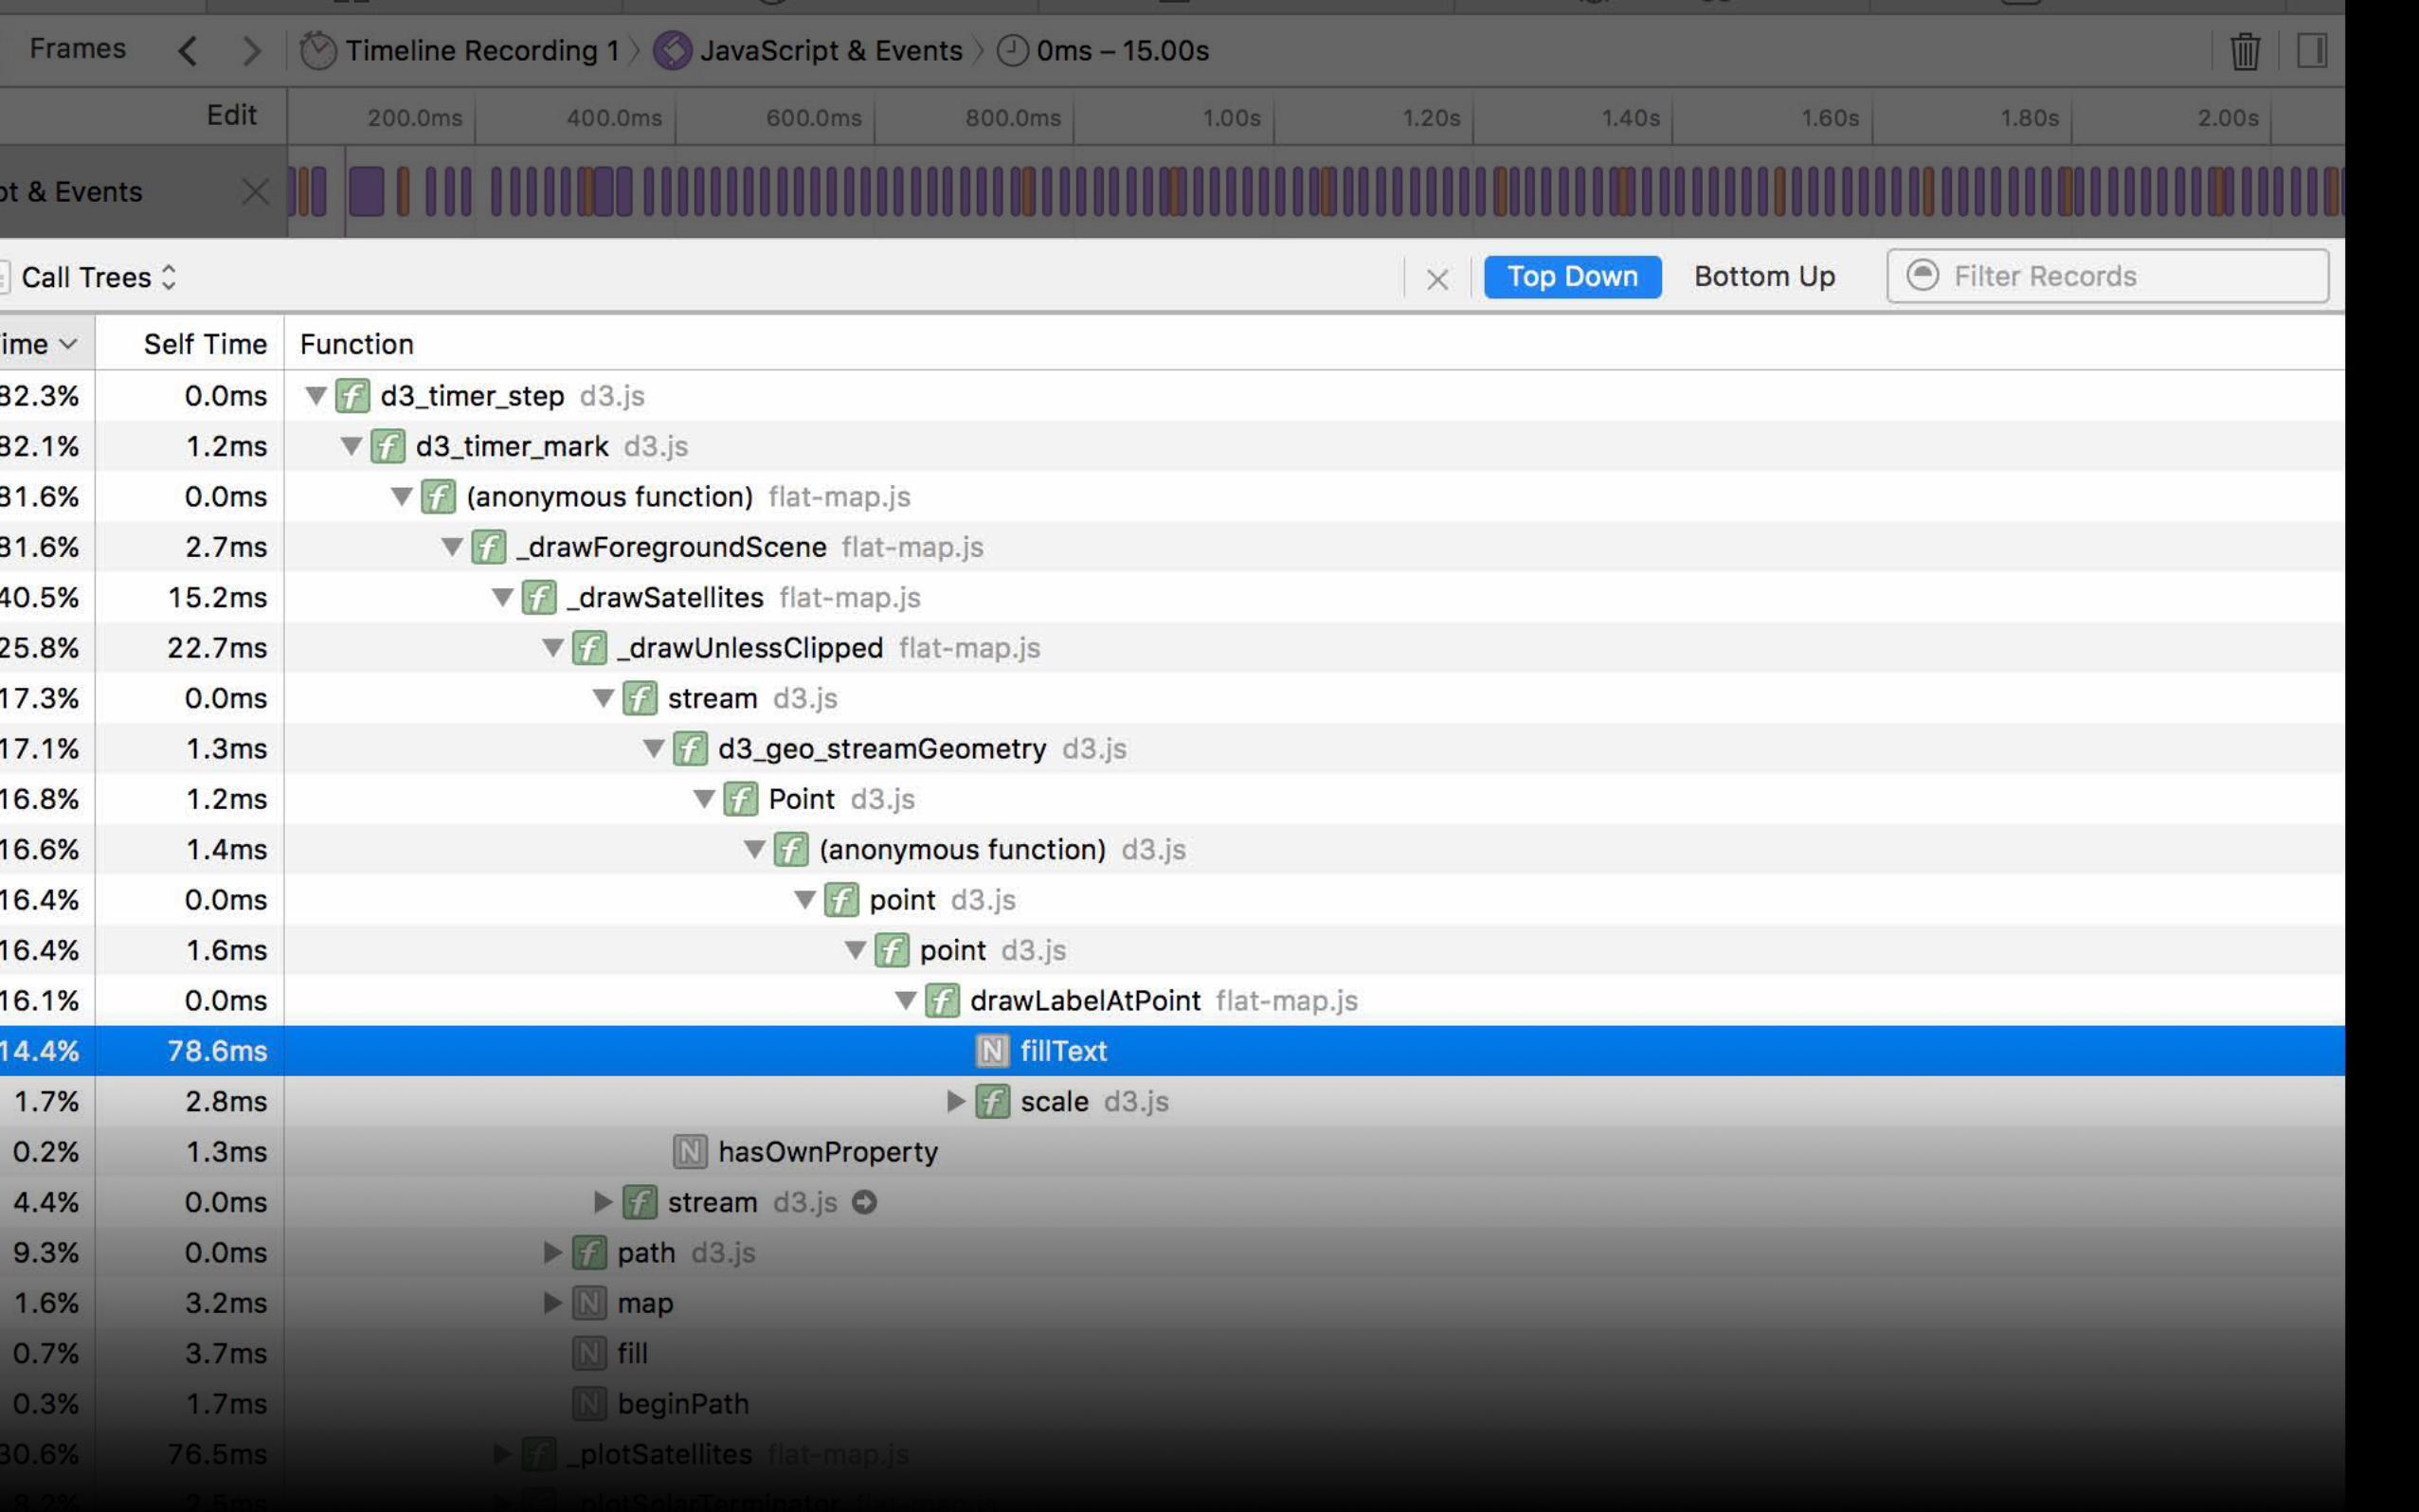
Call Trees viewProfiling JavaScript
NEW


DemoJavaScript profiling
Brian BurgSafari and WebKit Engineer
SummaryProfiling JavaScript
Profiling so fast it's accurate
SummaryProfiling JavaScript
Profiling so fast it's accurateFind slow handlers with the Events view

SummaryProfiling JavaScript
Profiling so fast it's accurateFind slow handlers with the Events viewSee time costs pile up in the Call Trees view
SummaryProfiling JavaScript
Profiling so fast it's accurateFind slow handlers with the Events viewSee time costs pile up in the Call Trees viewBottom Up view shows the best places to start optimizing

Connecting Web Inspector
Profiling Javascript
Analyzing Memory

Connecting Web Inspector
Profiling Javascript
Analyzing Memory

Memory timelineAnalyzing Memory
NEW


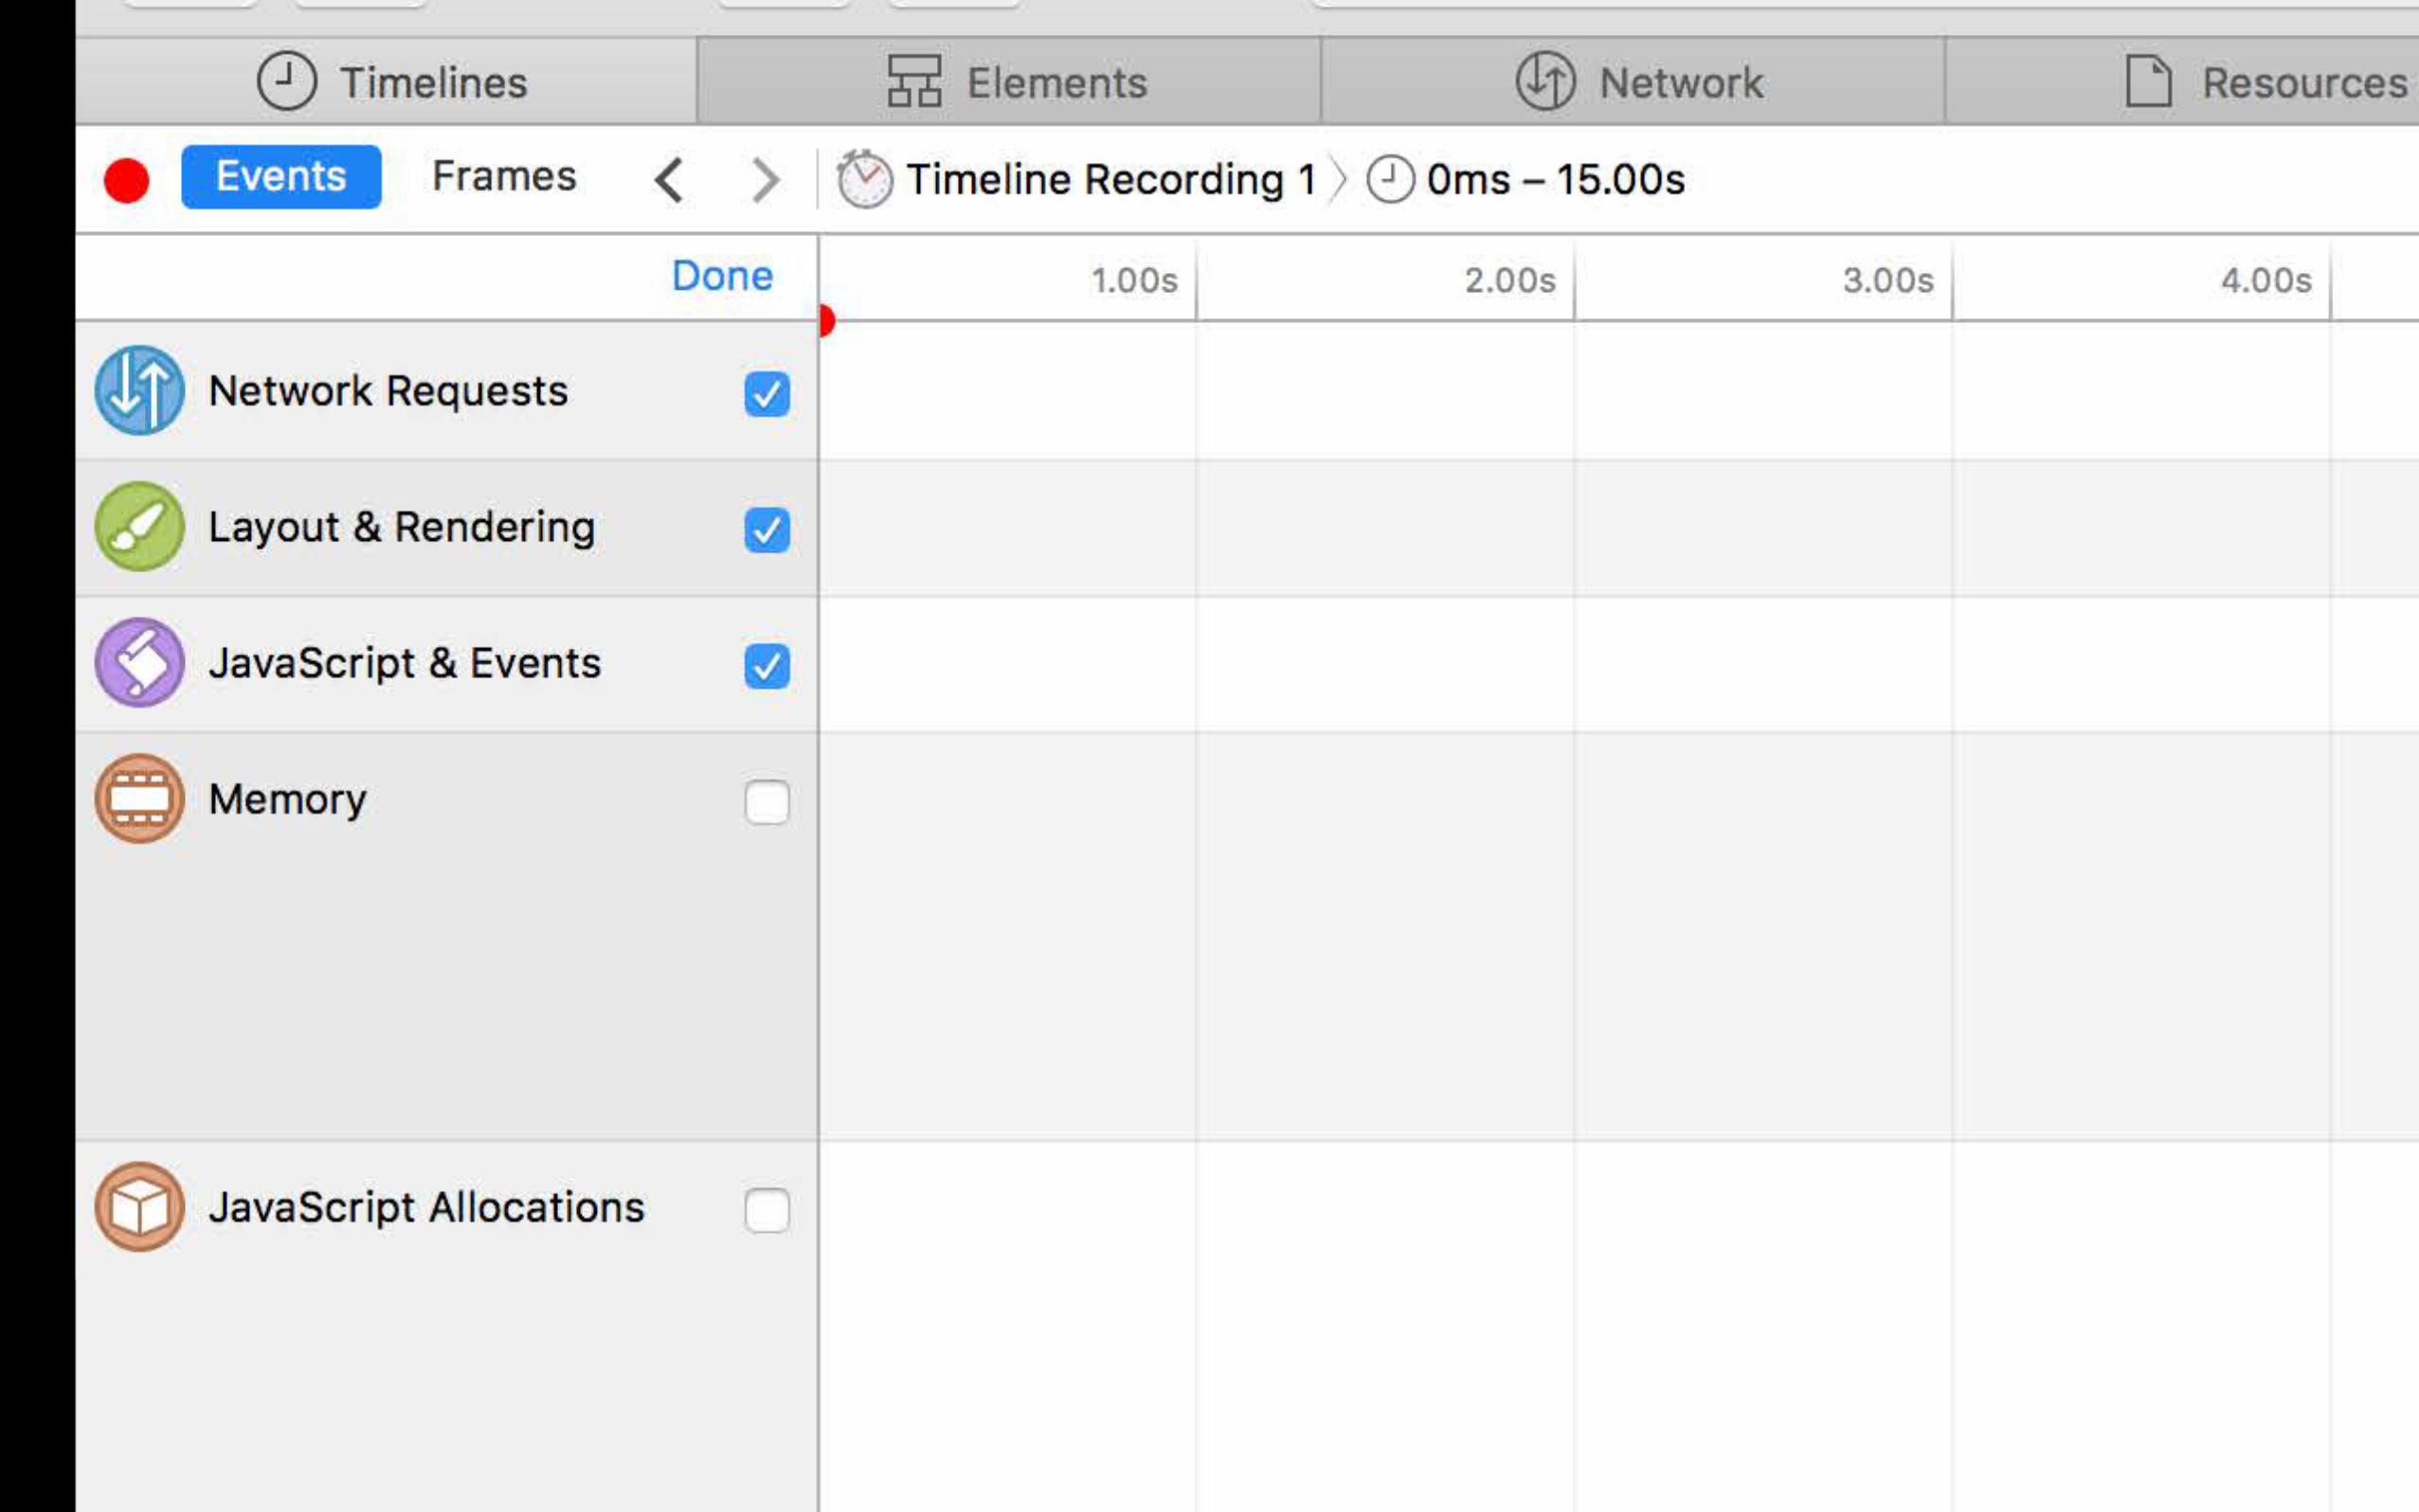


Memory timelineAnalyzing Memory

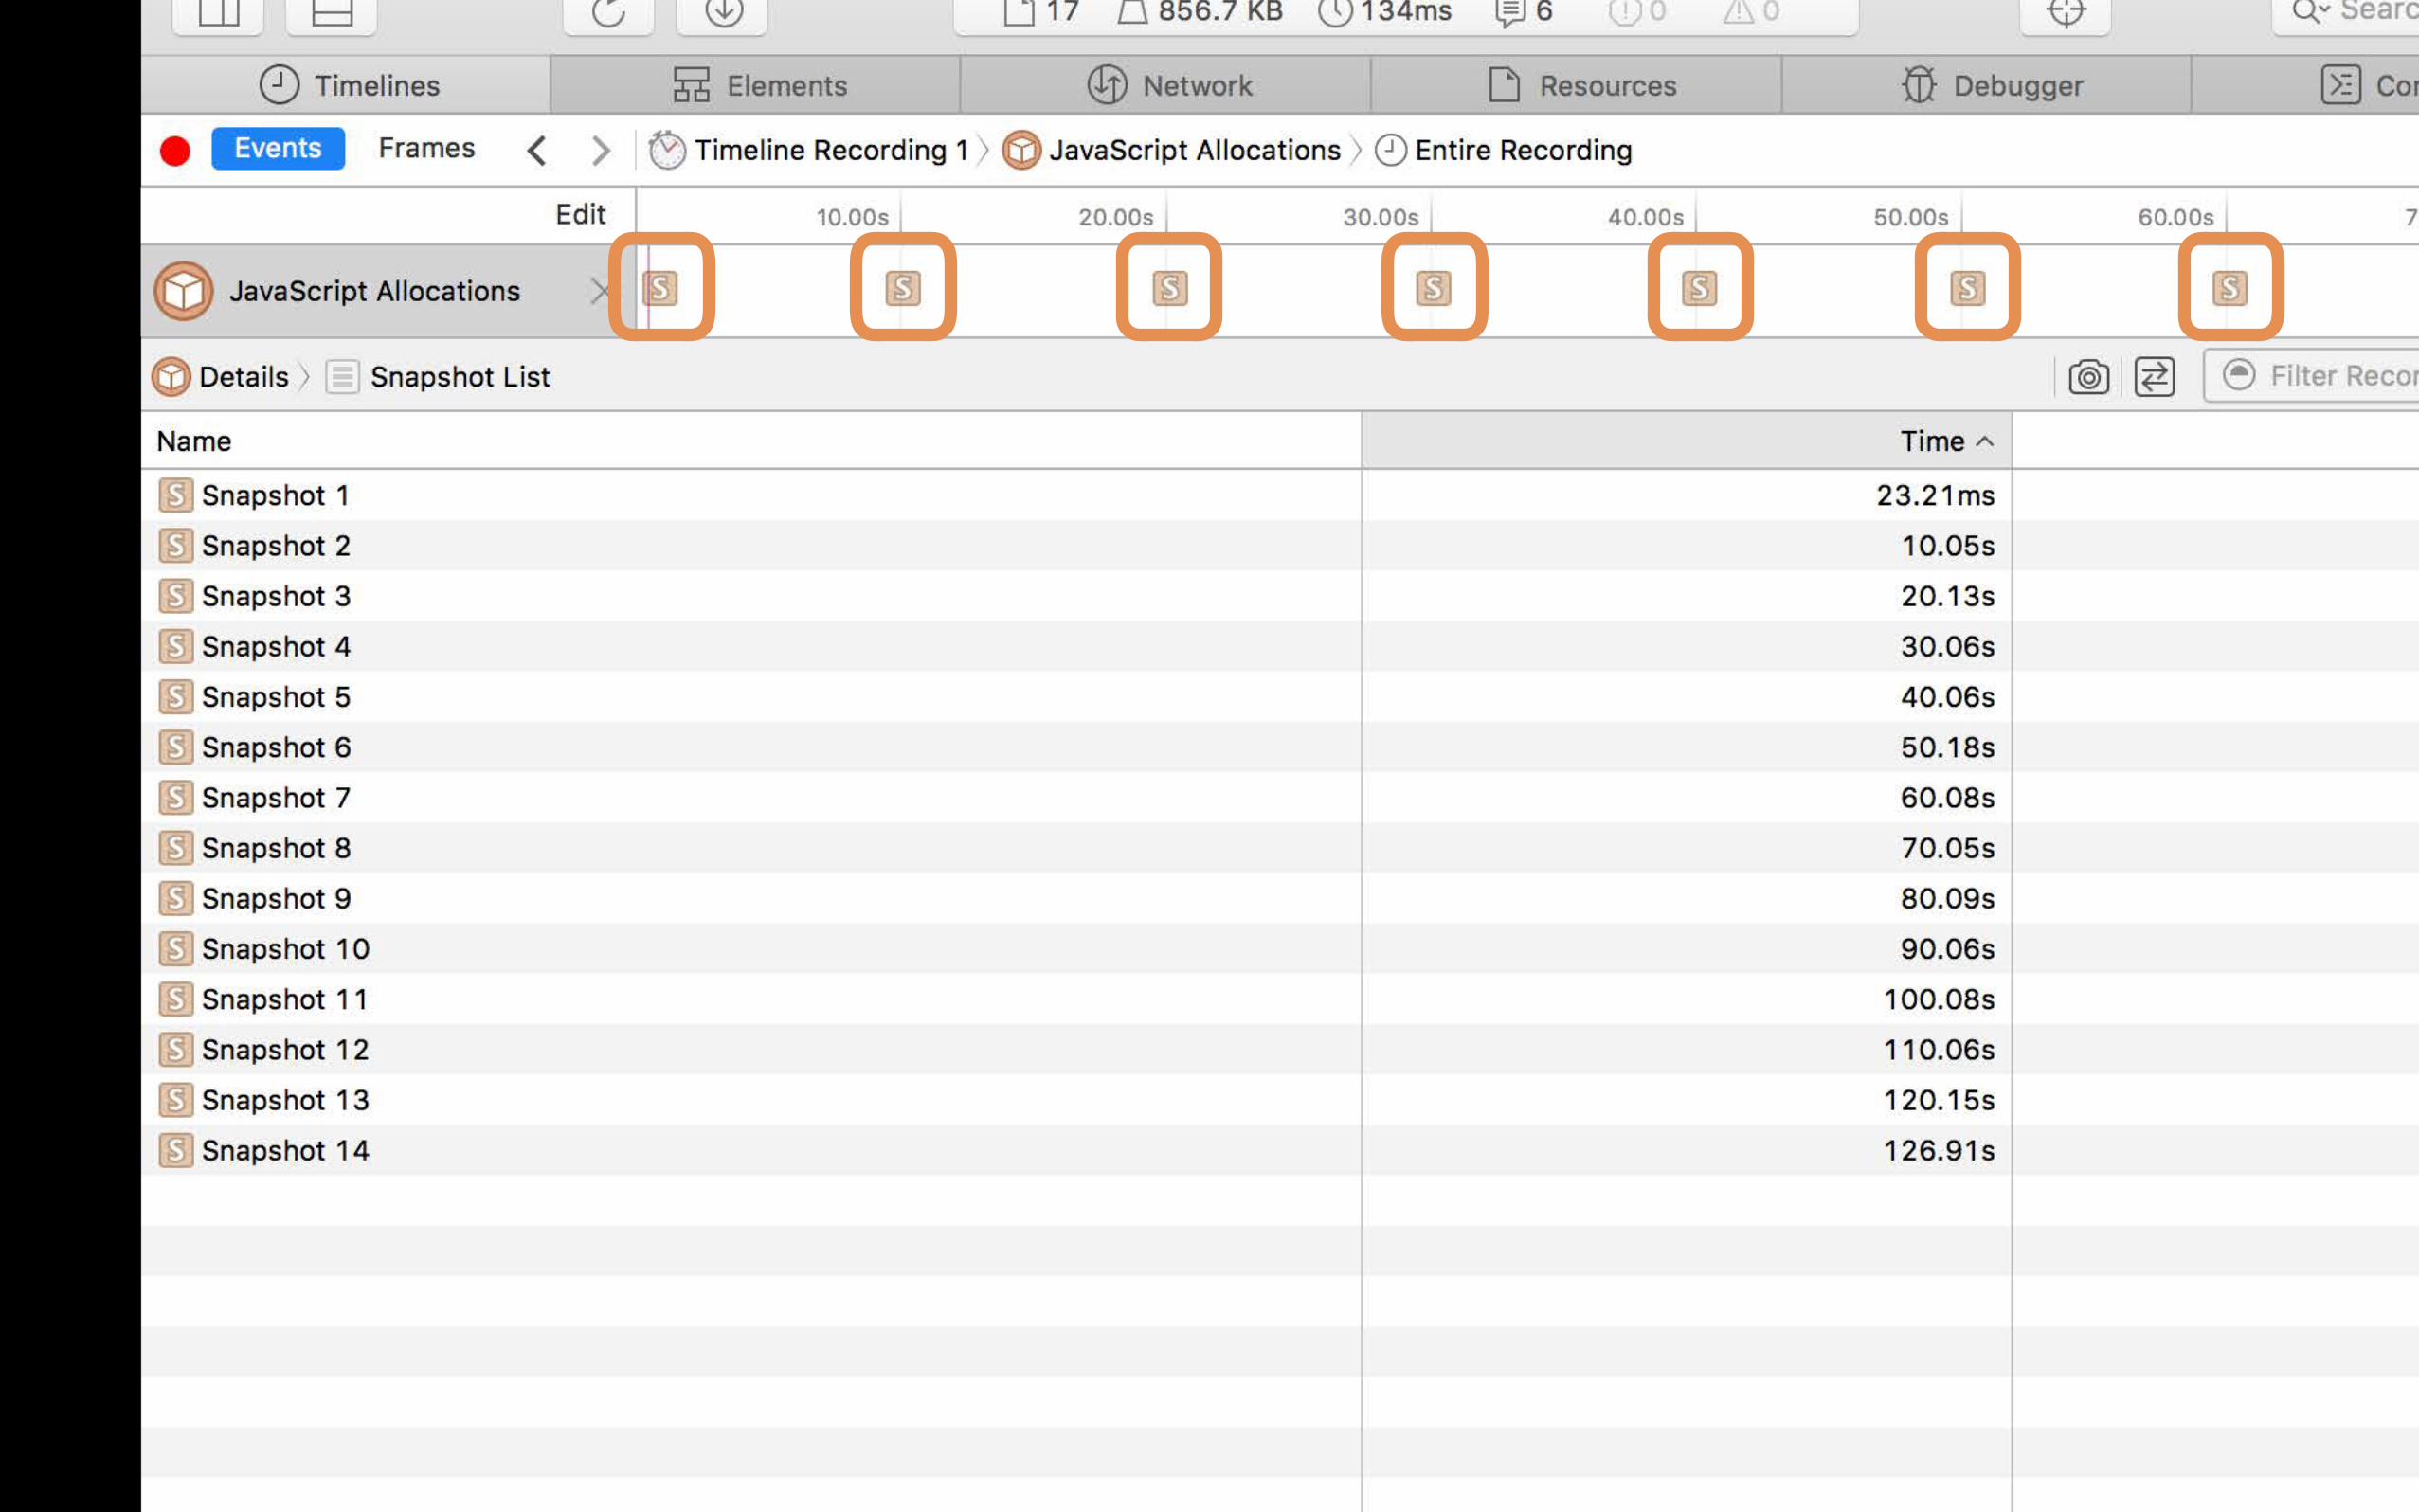
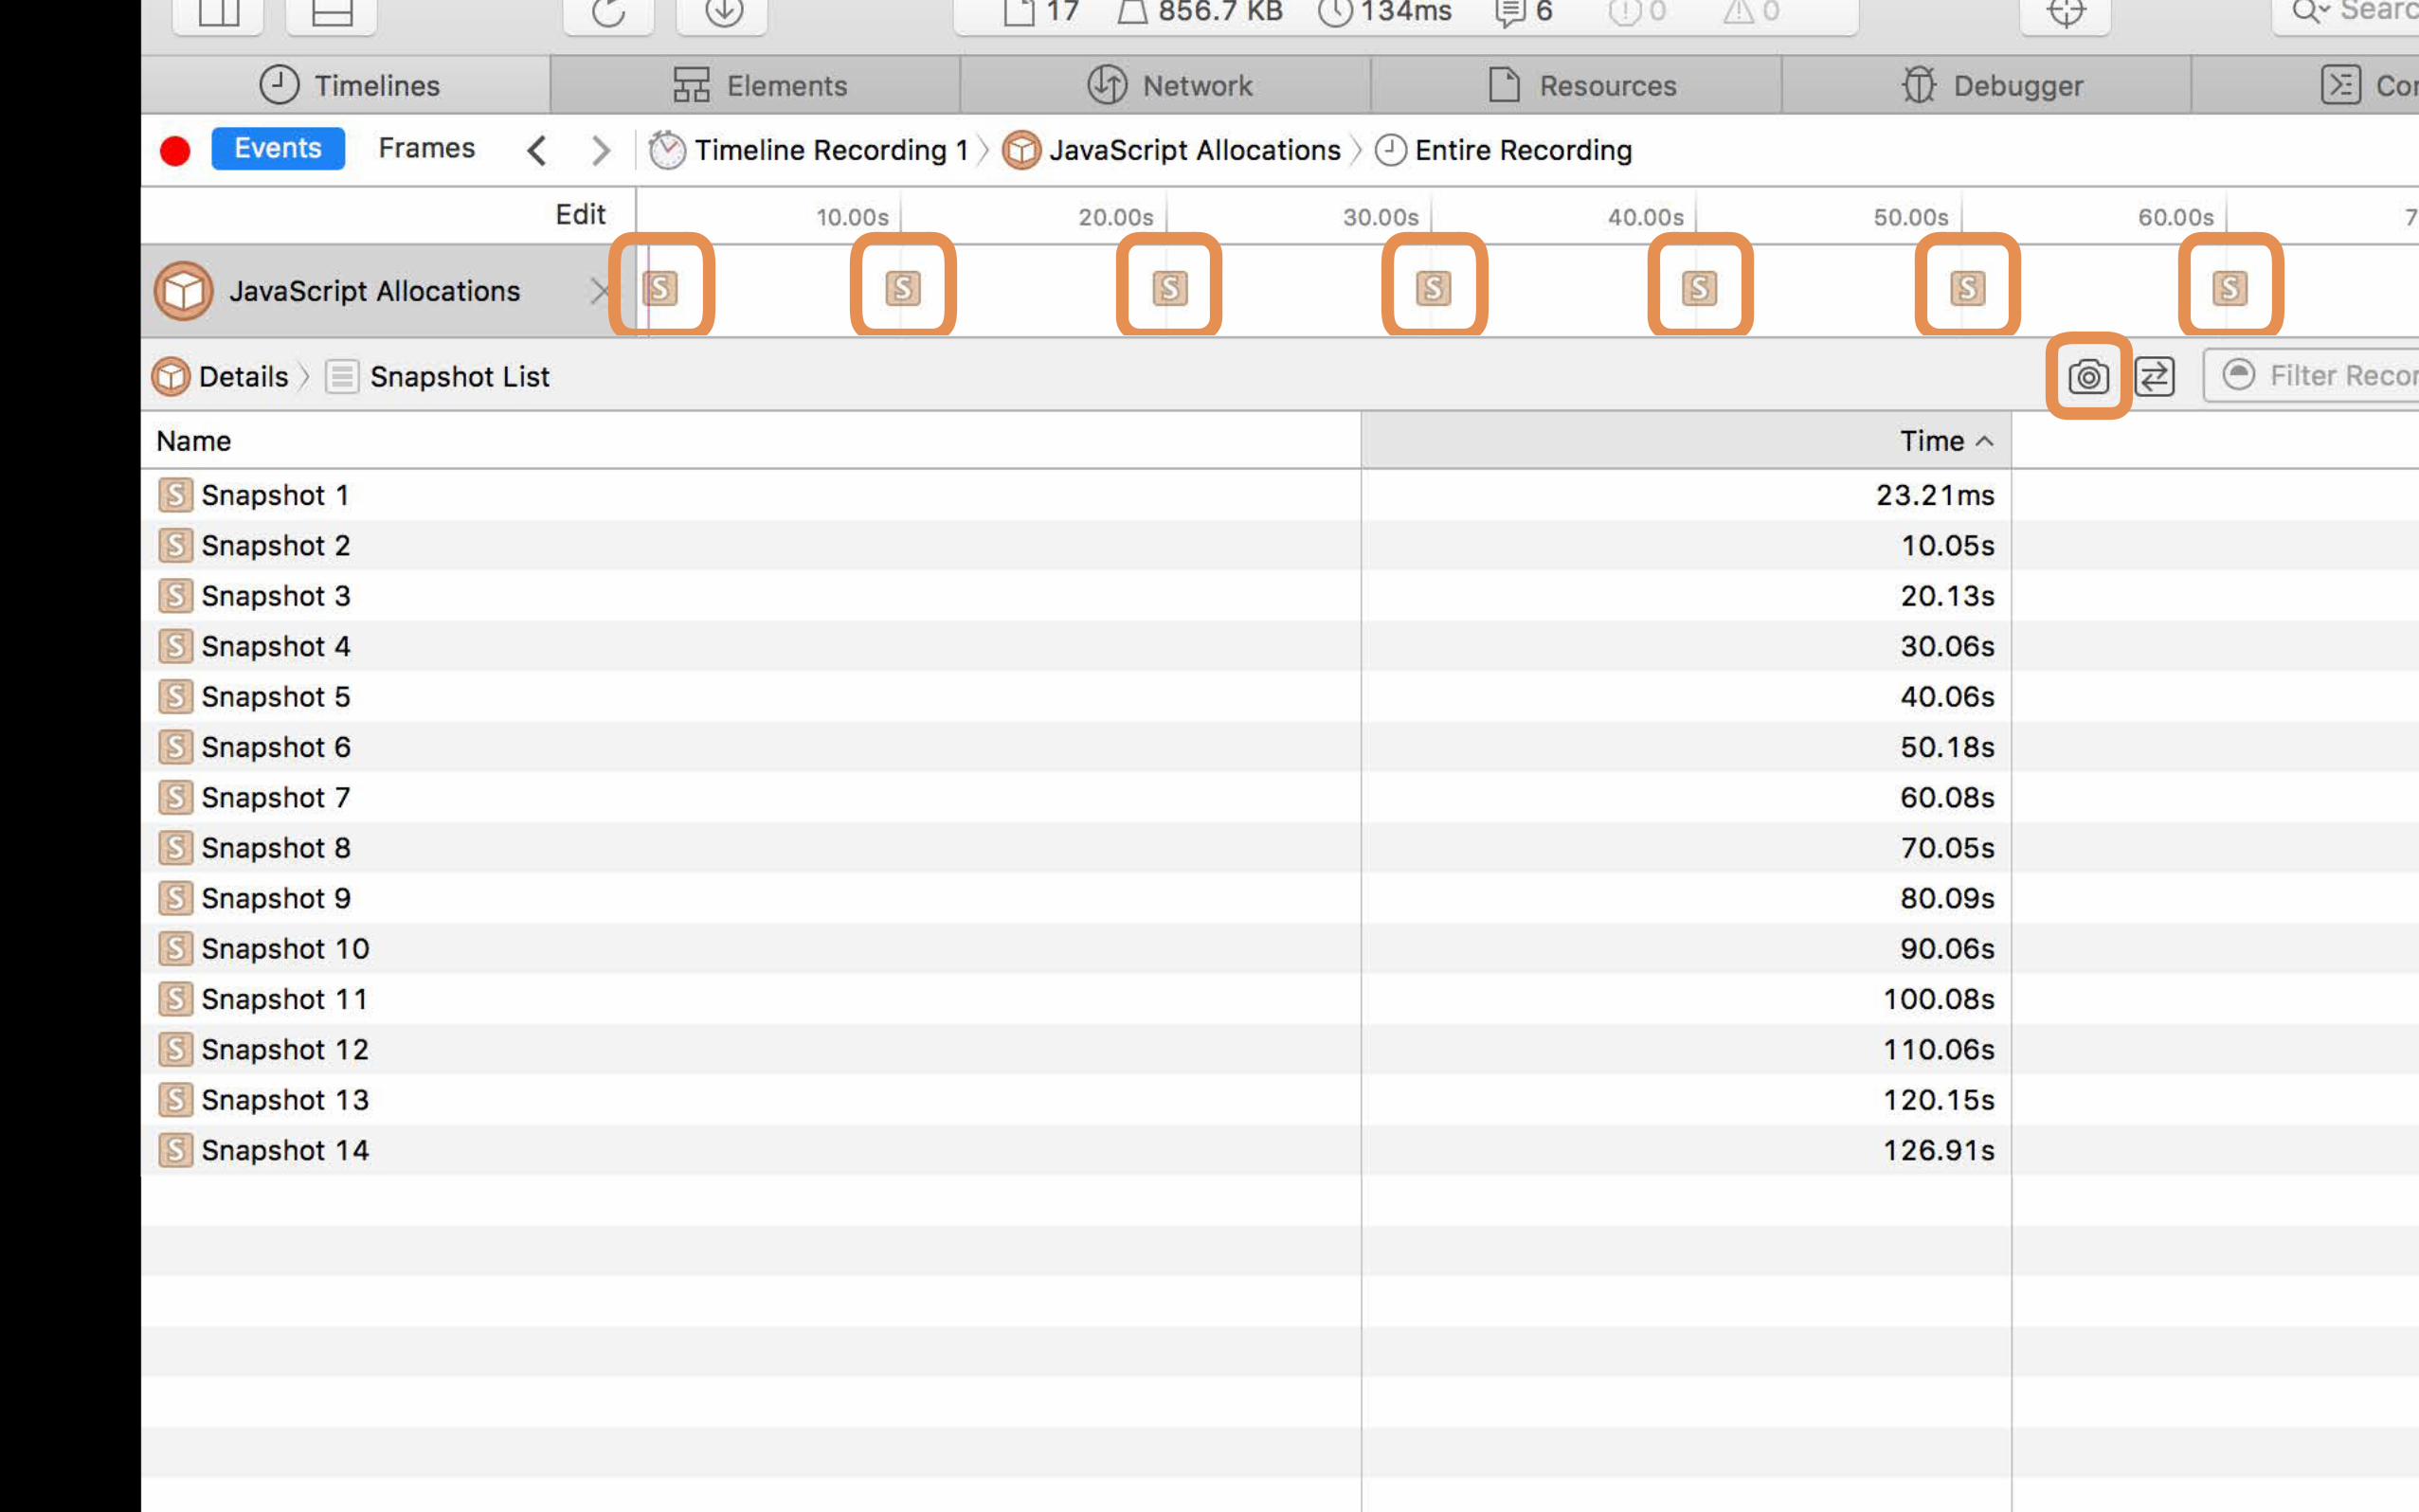
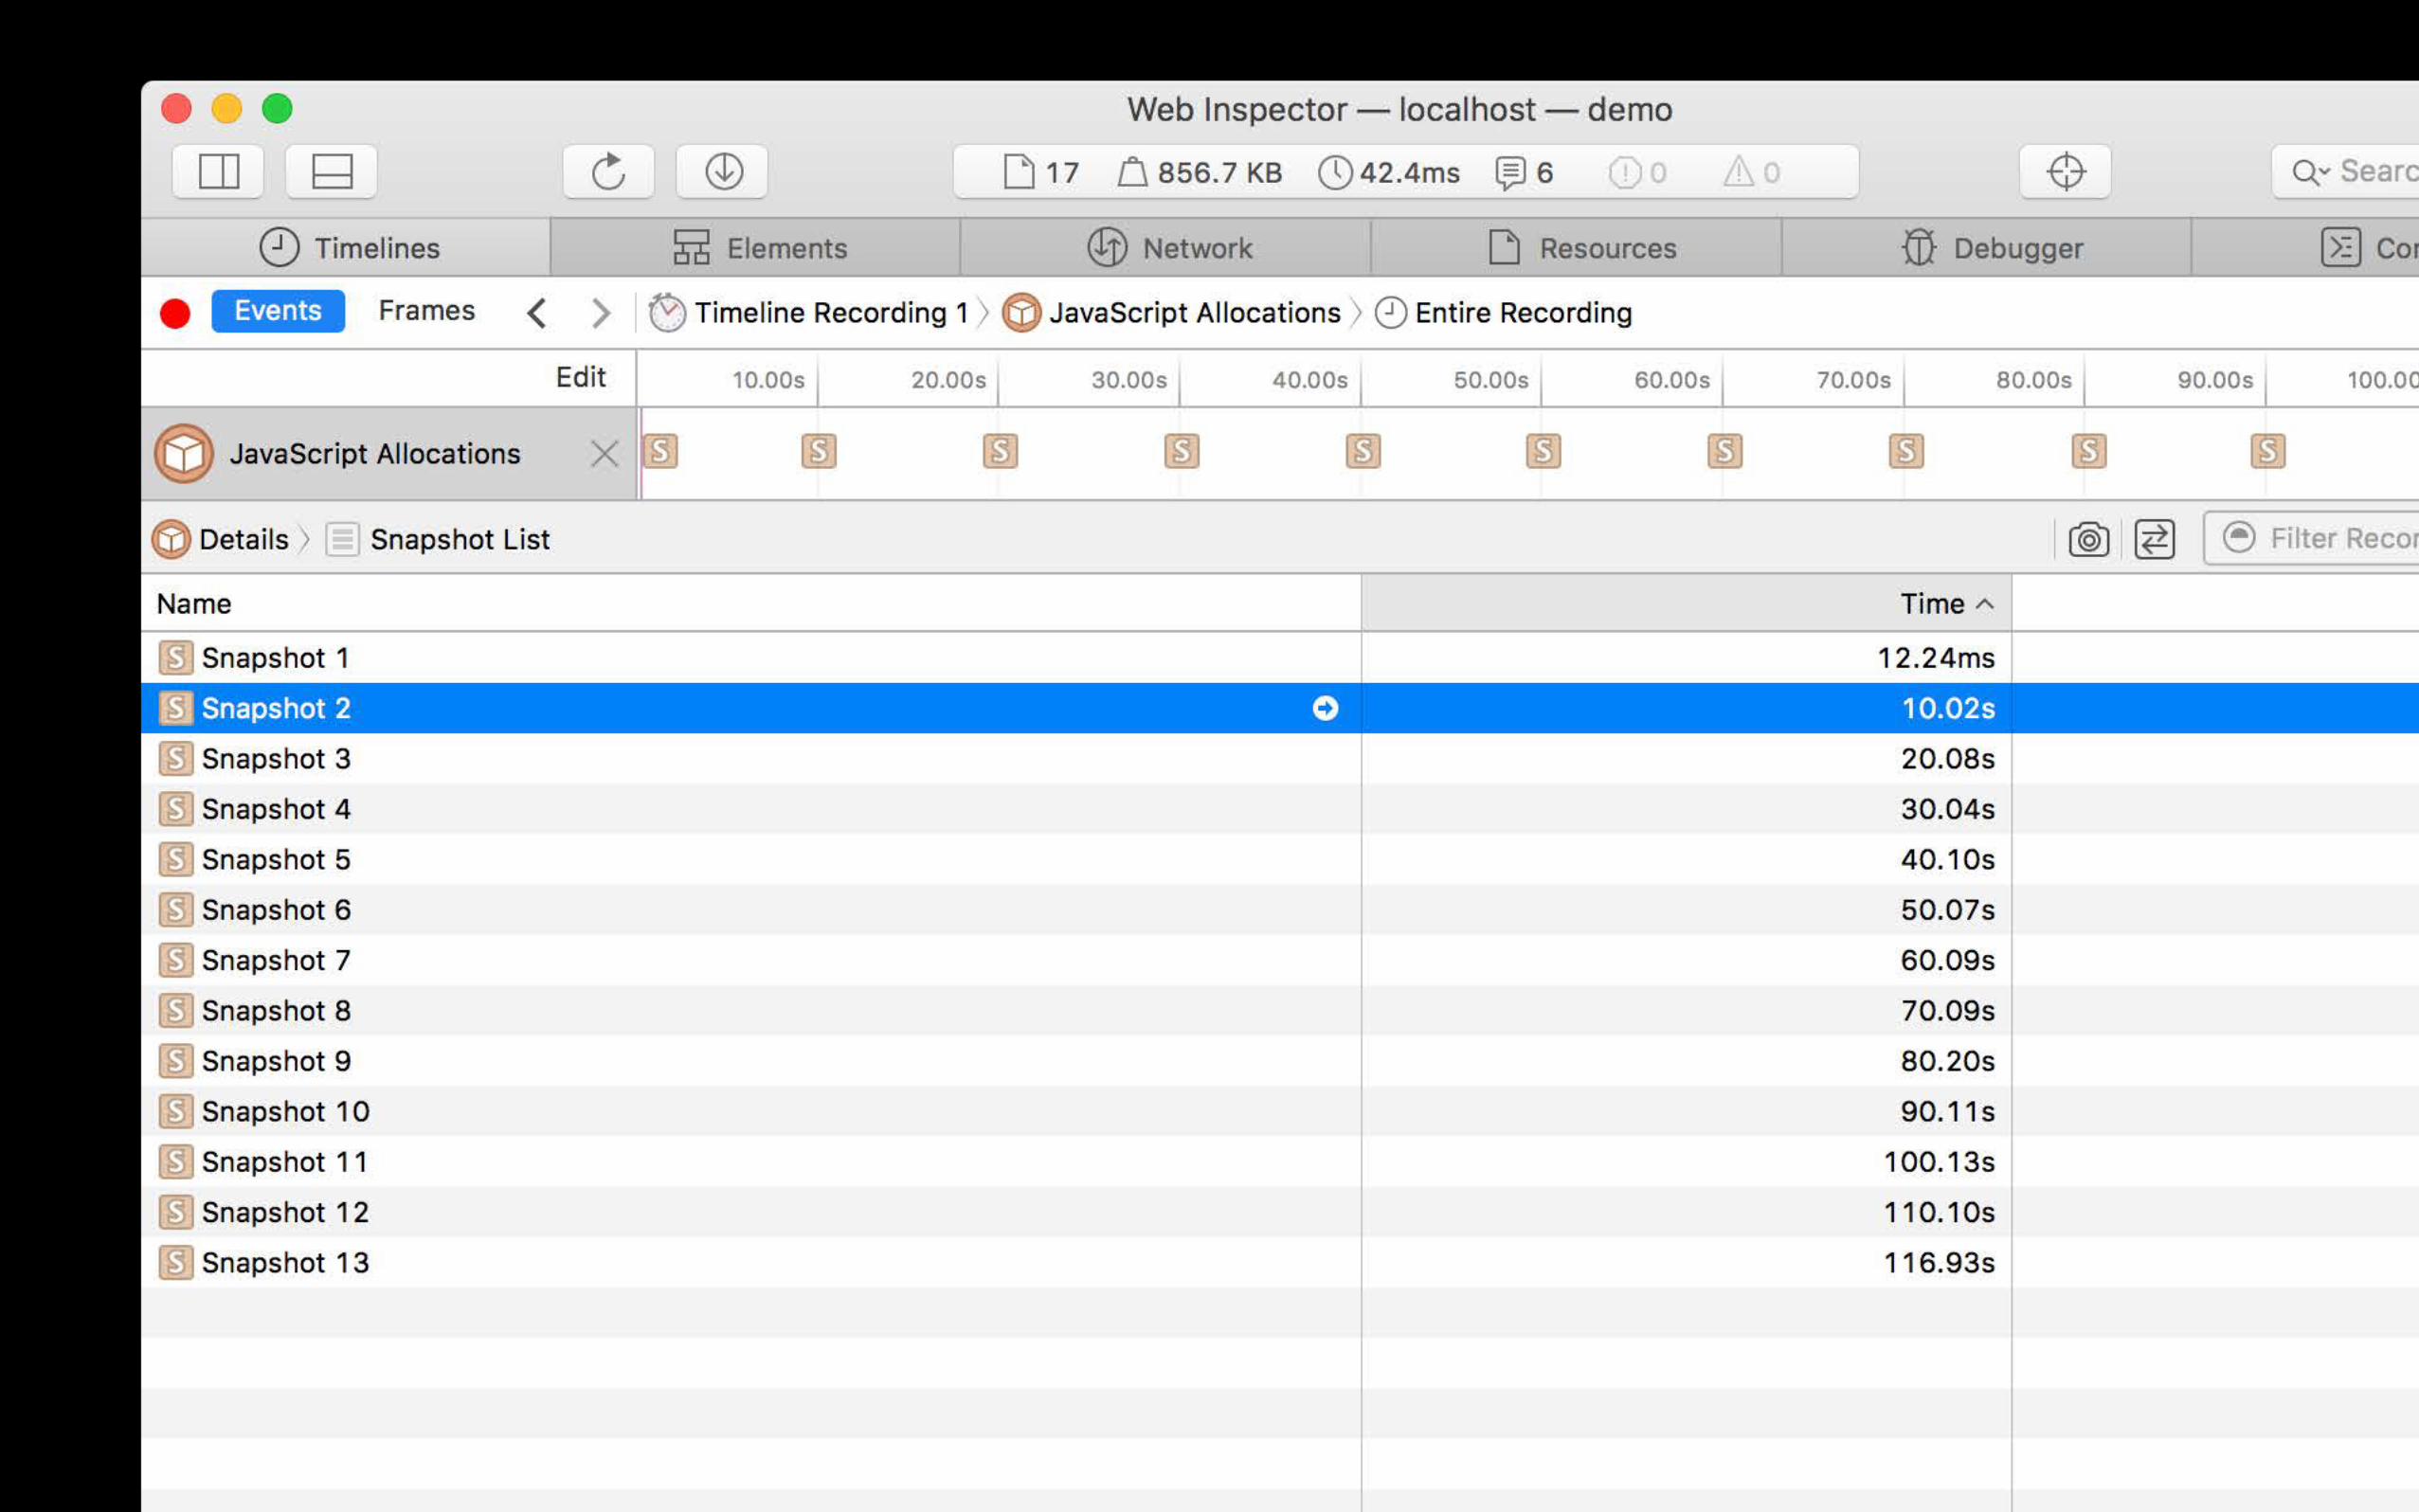
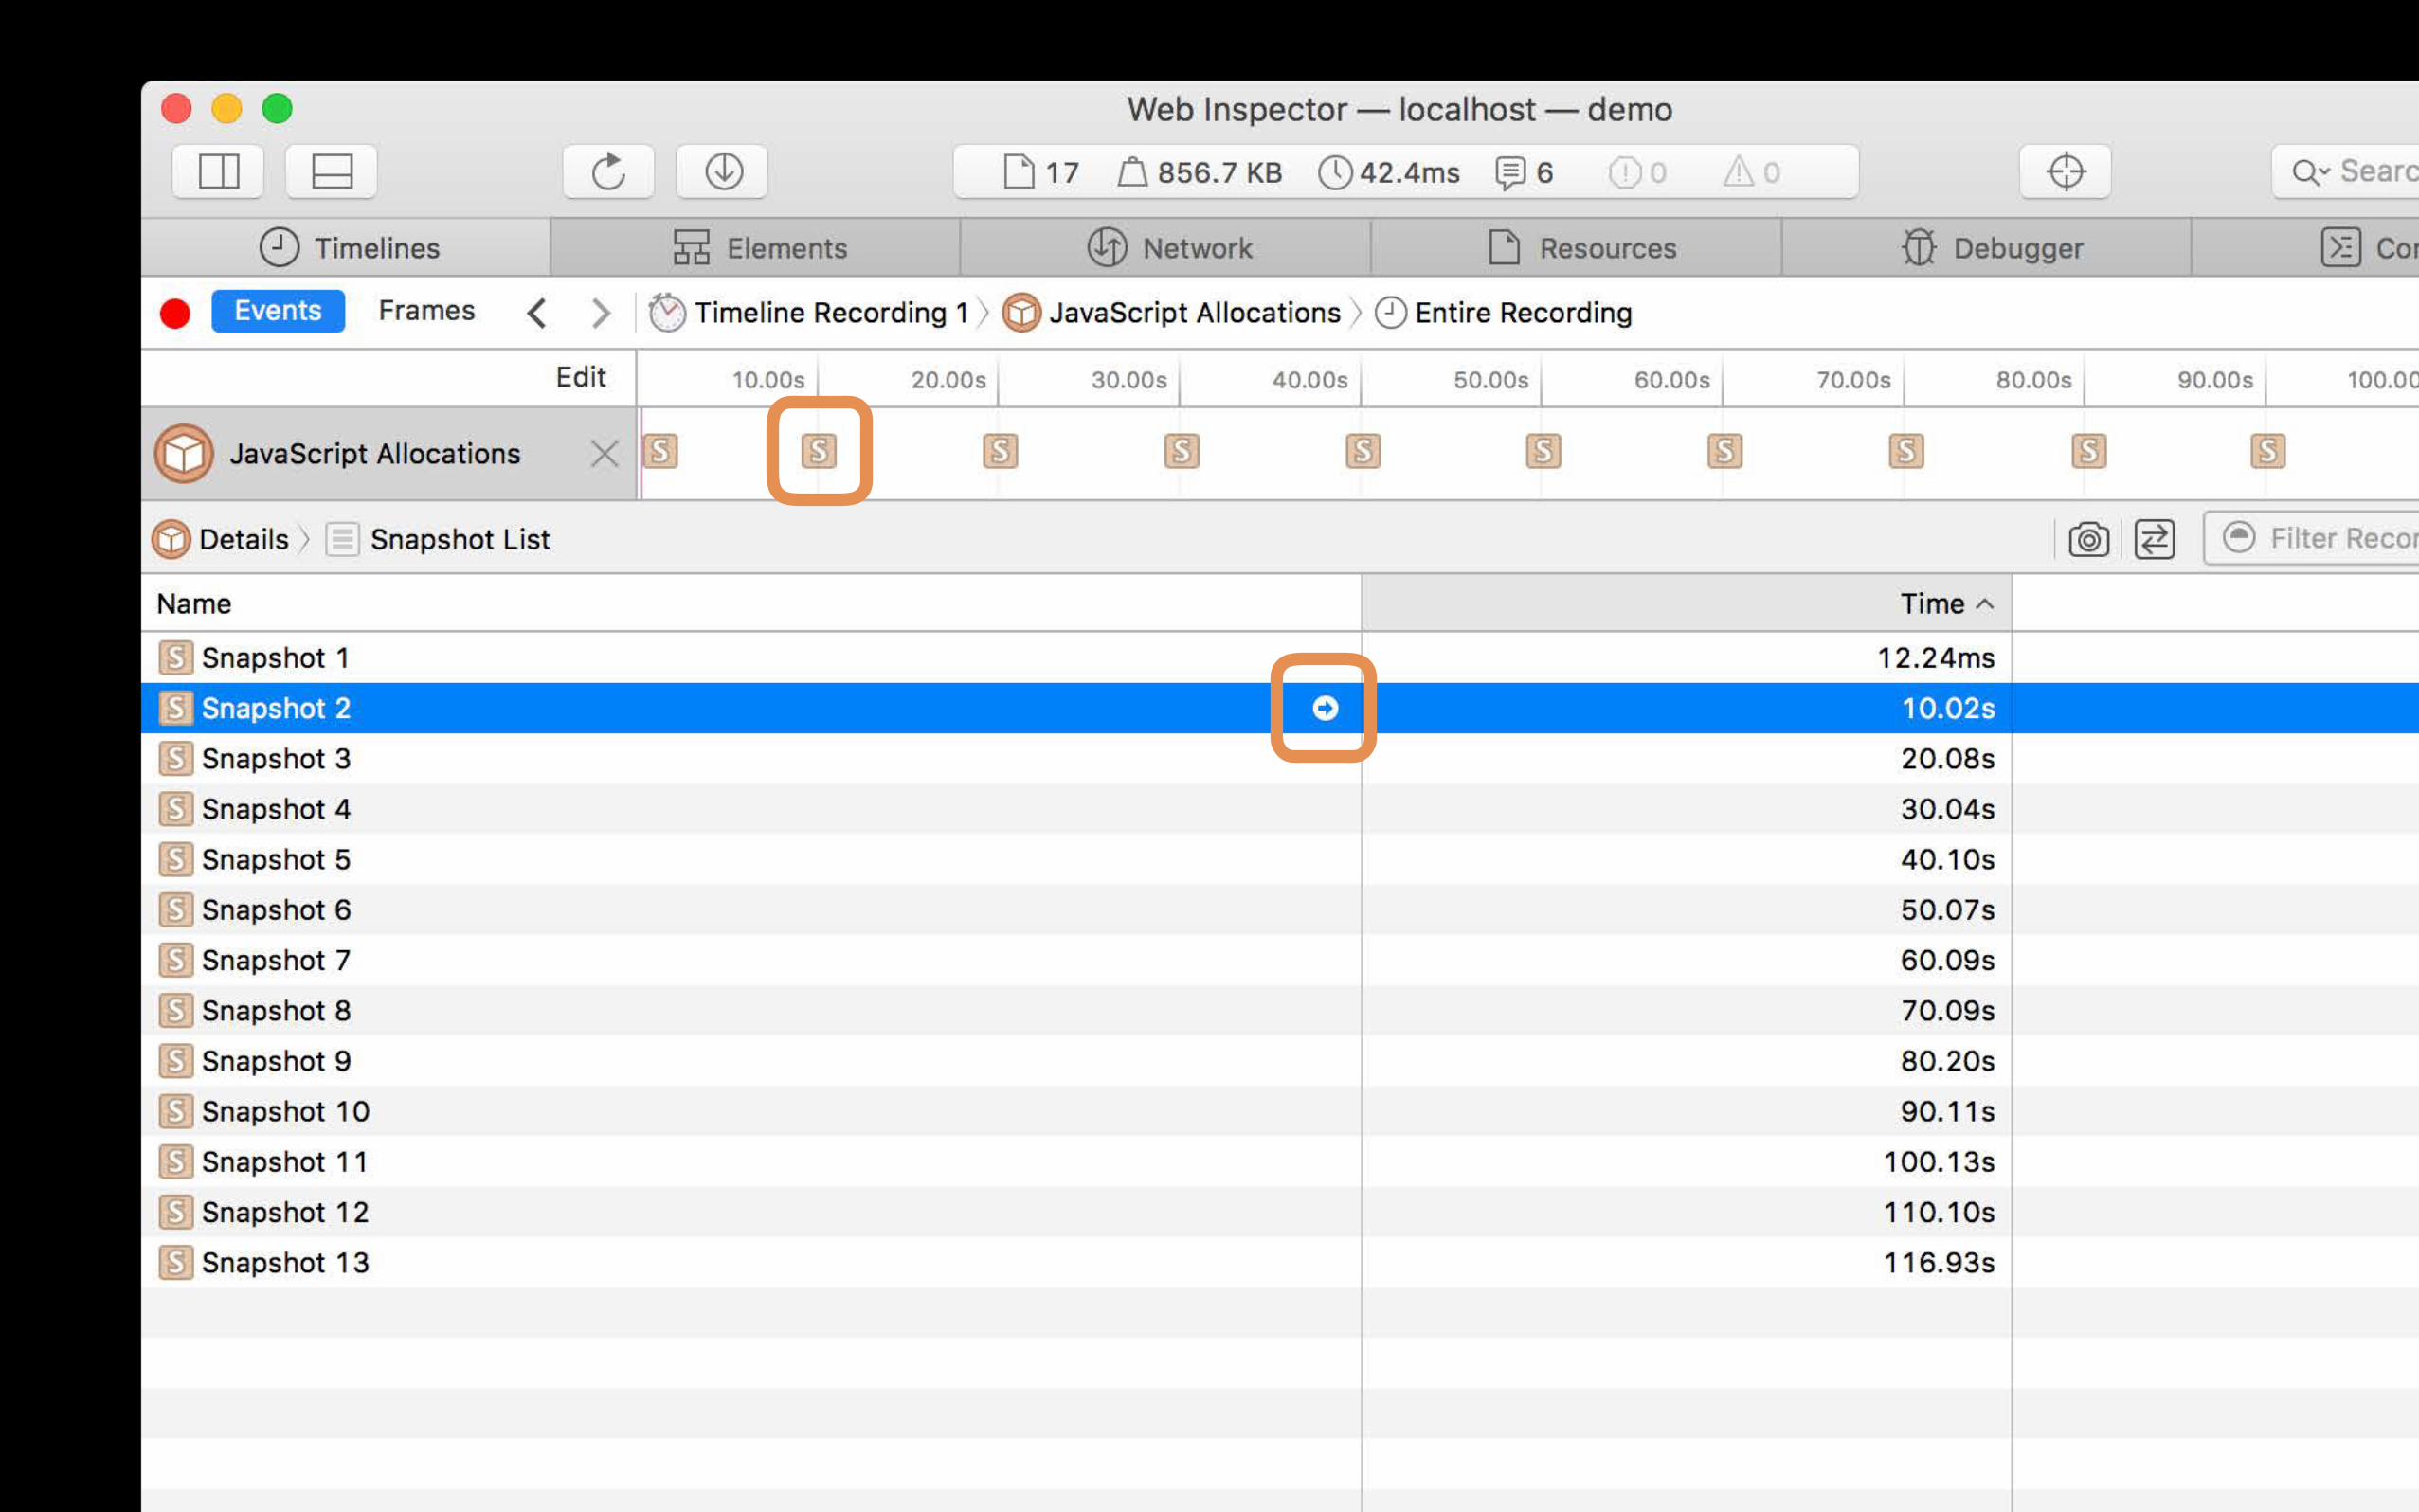
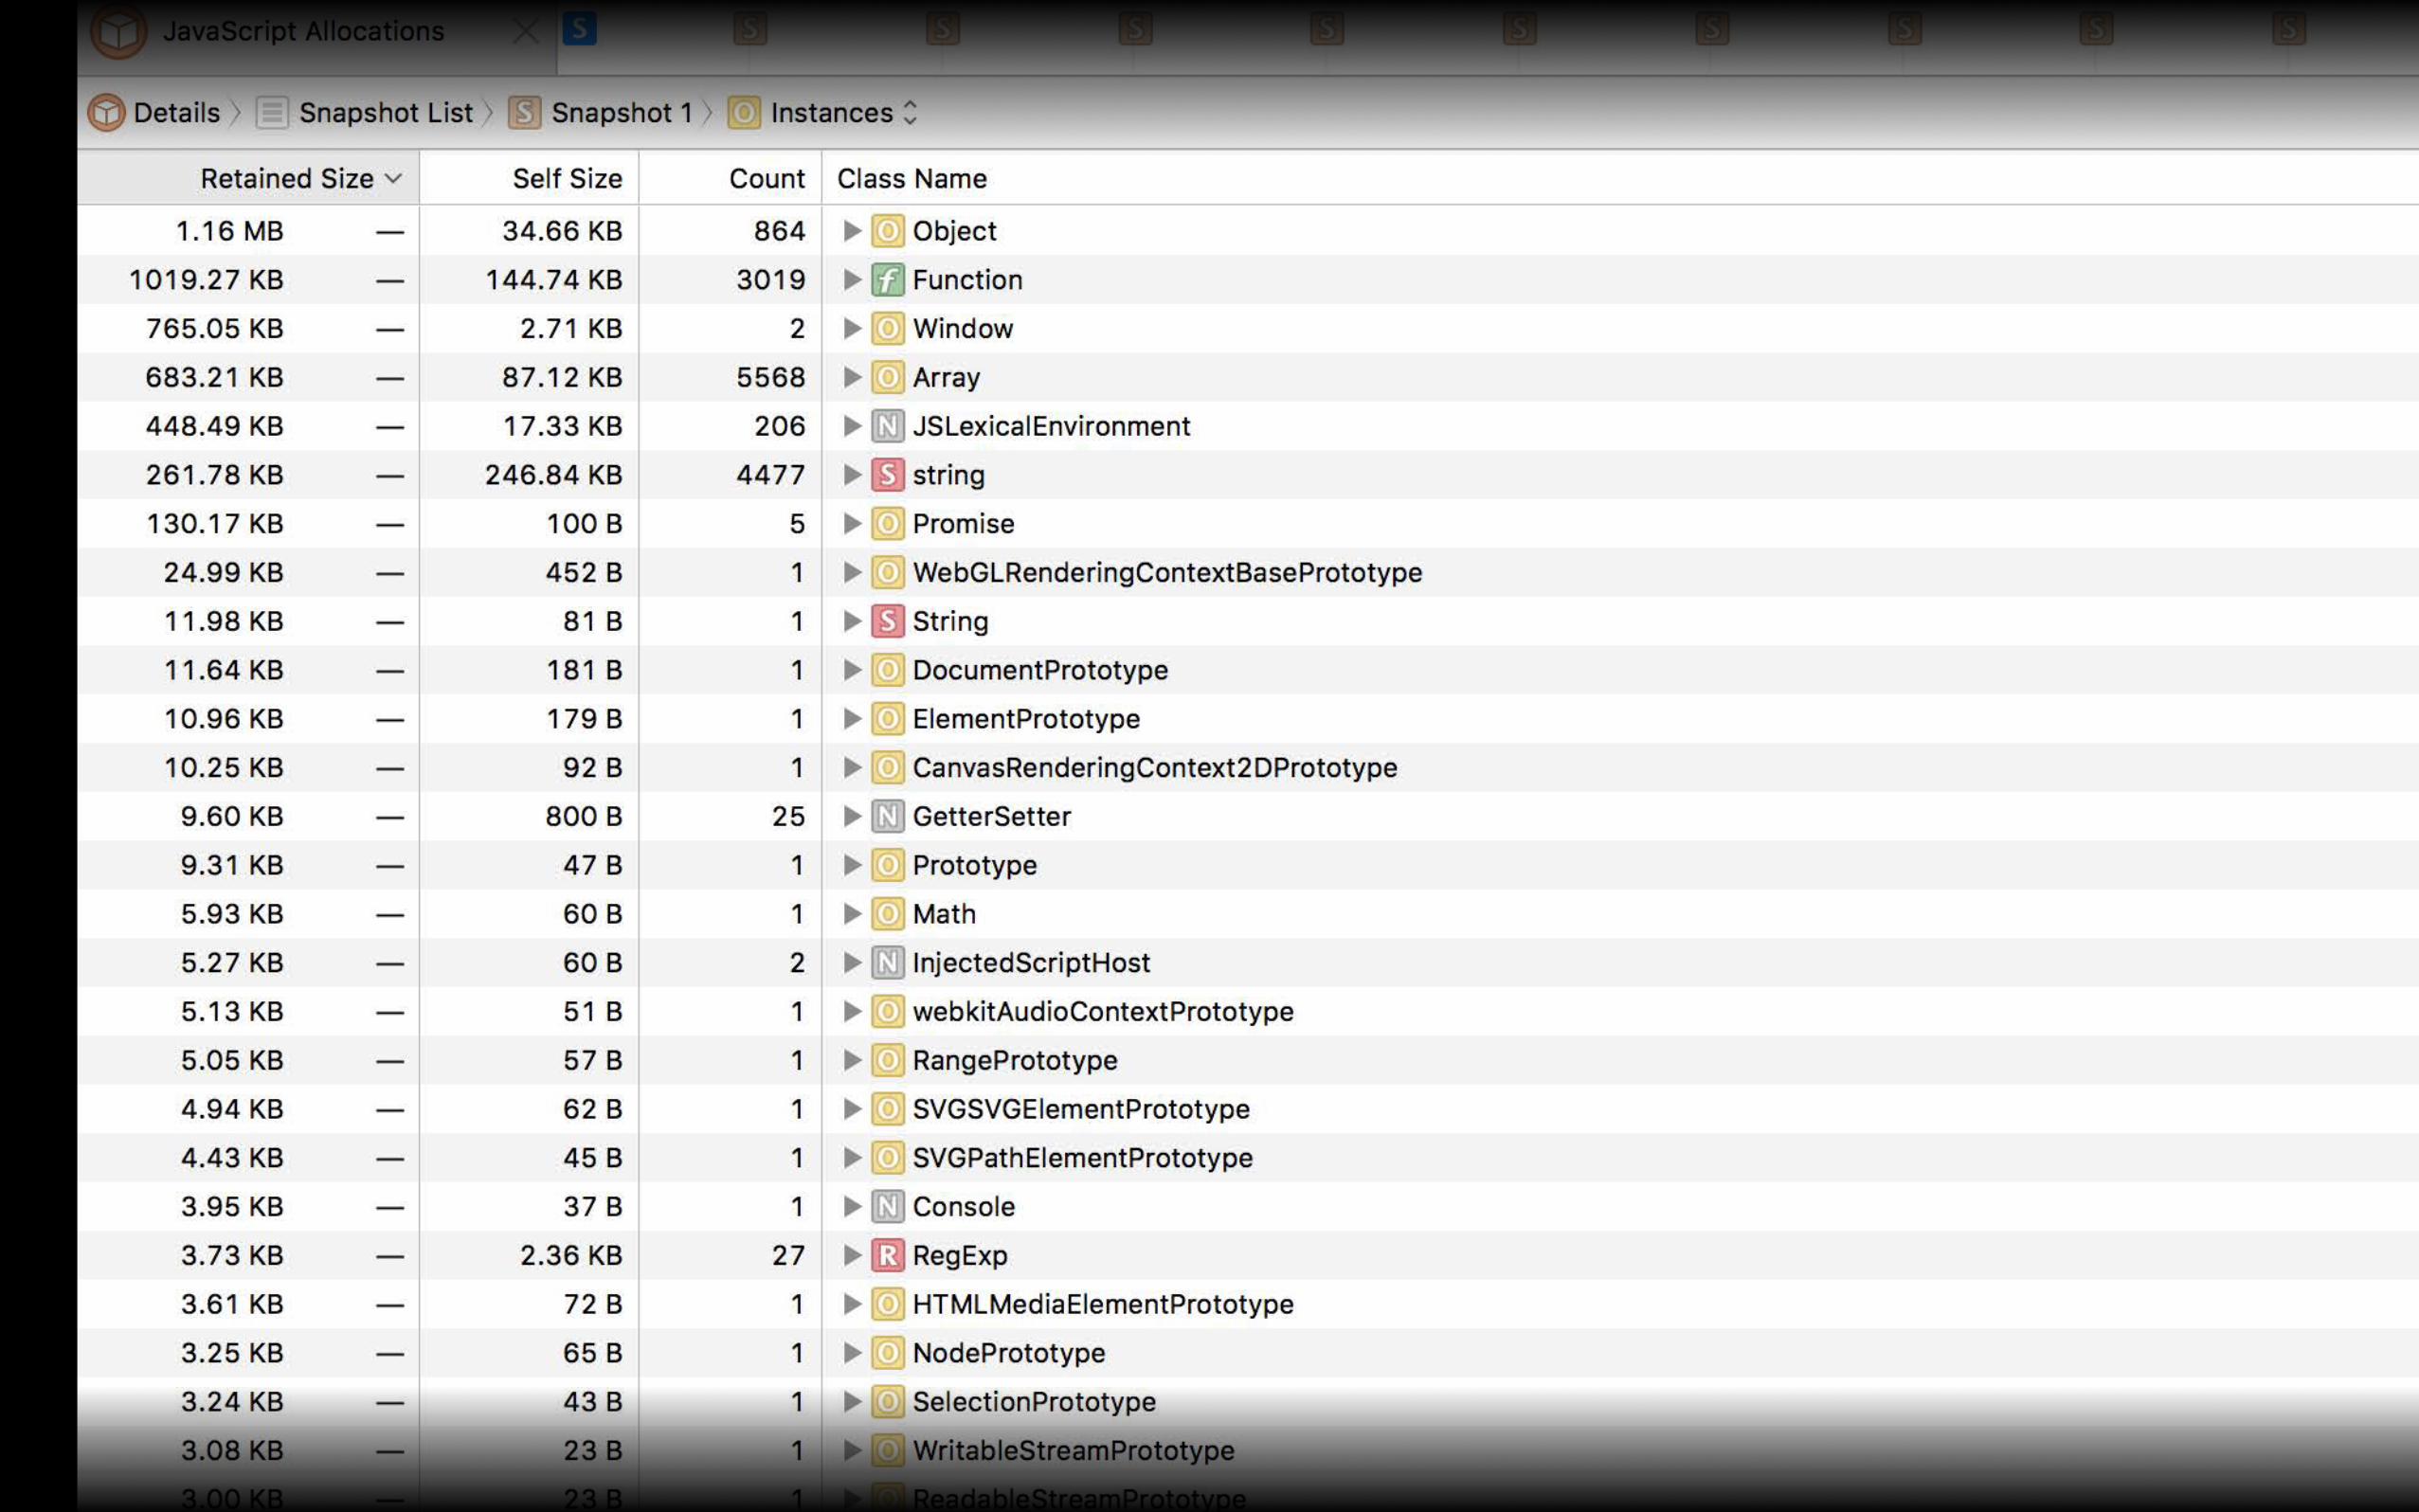
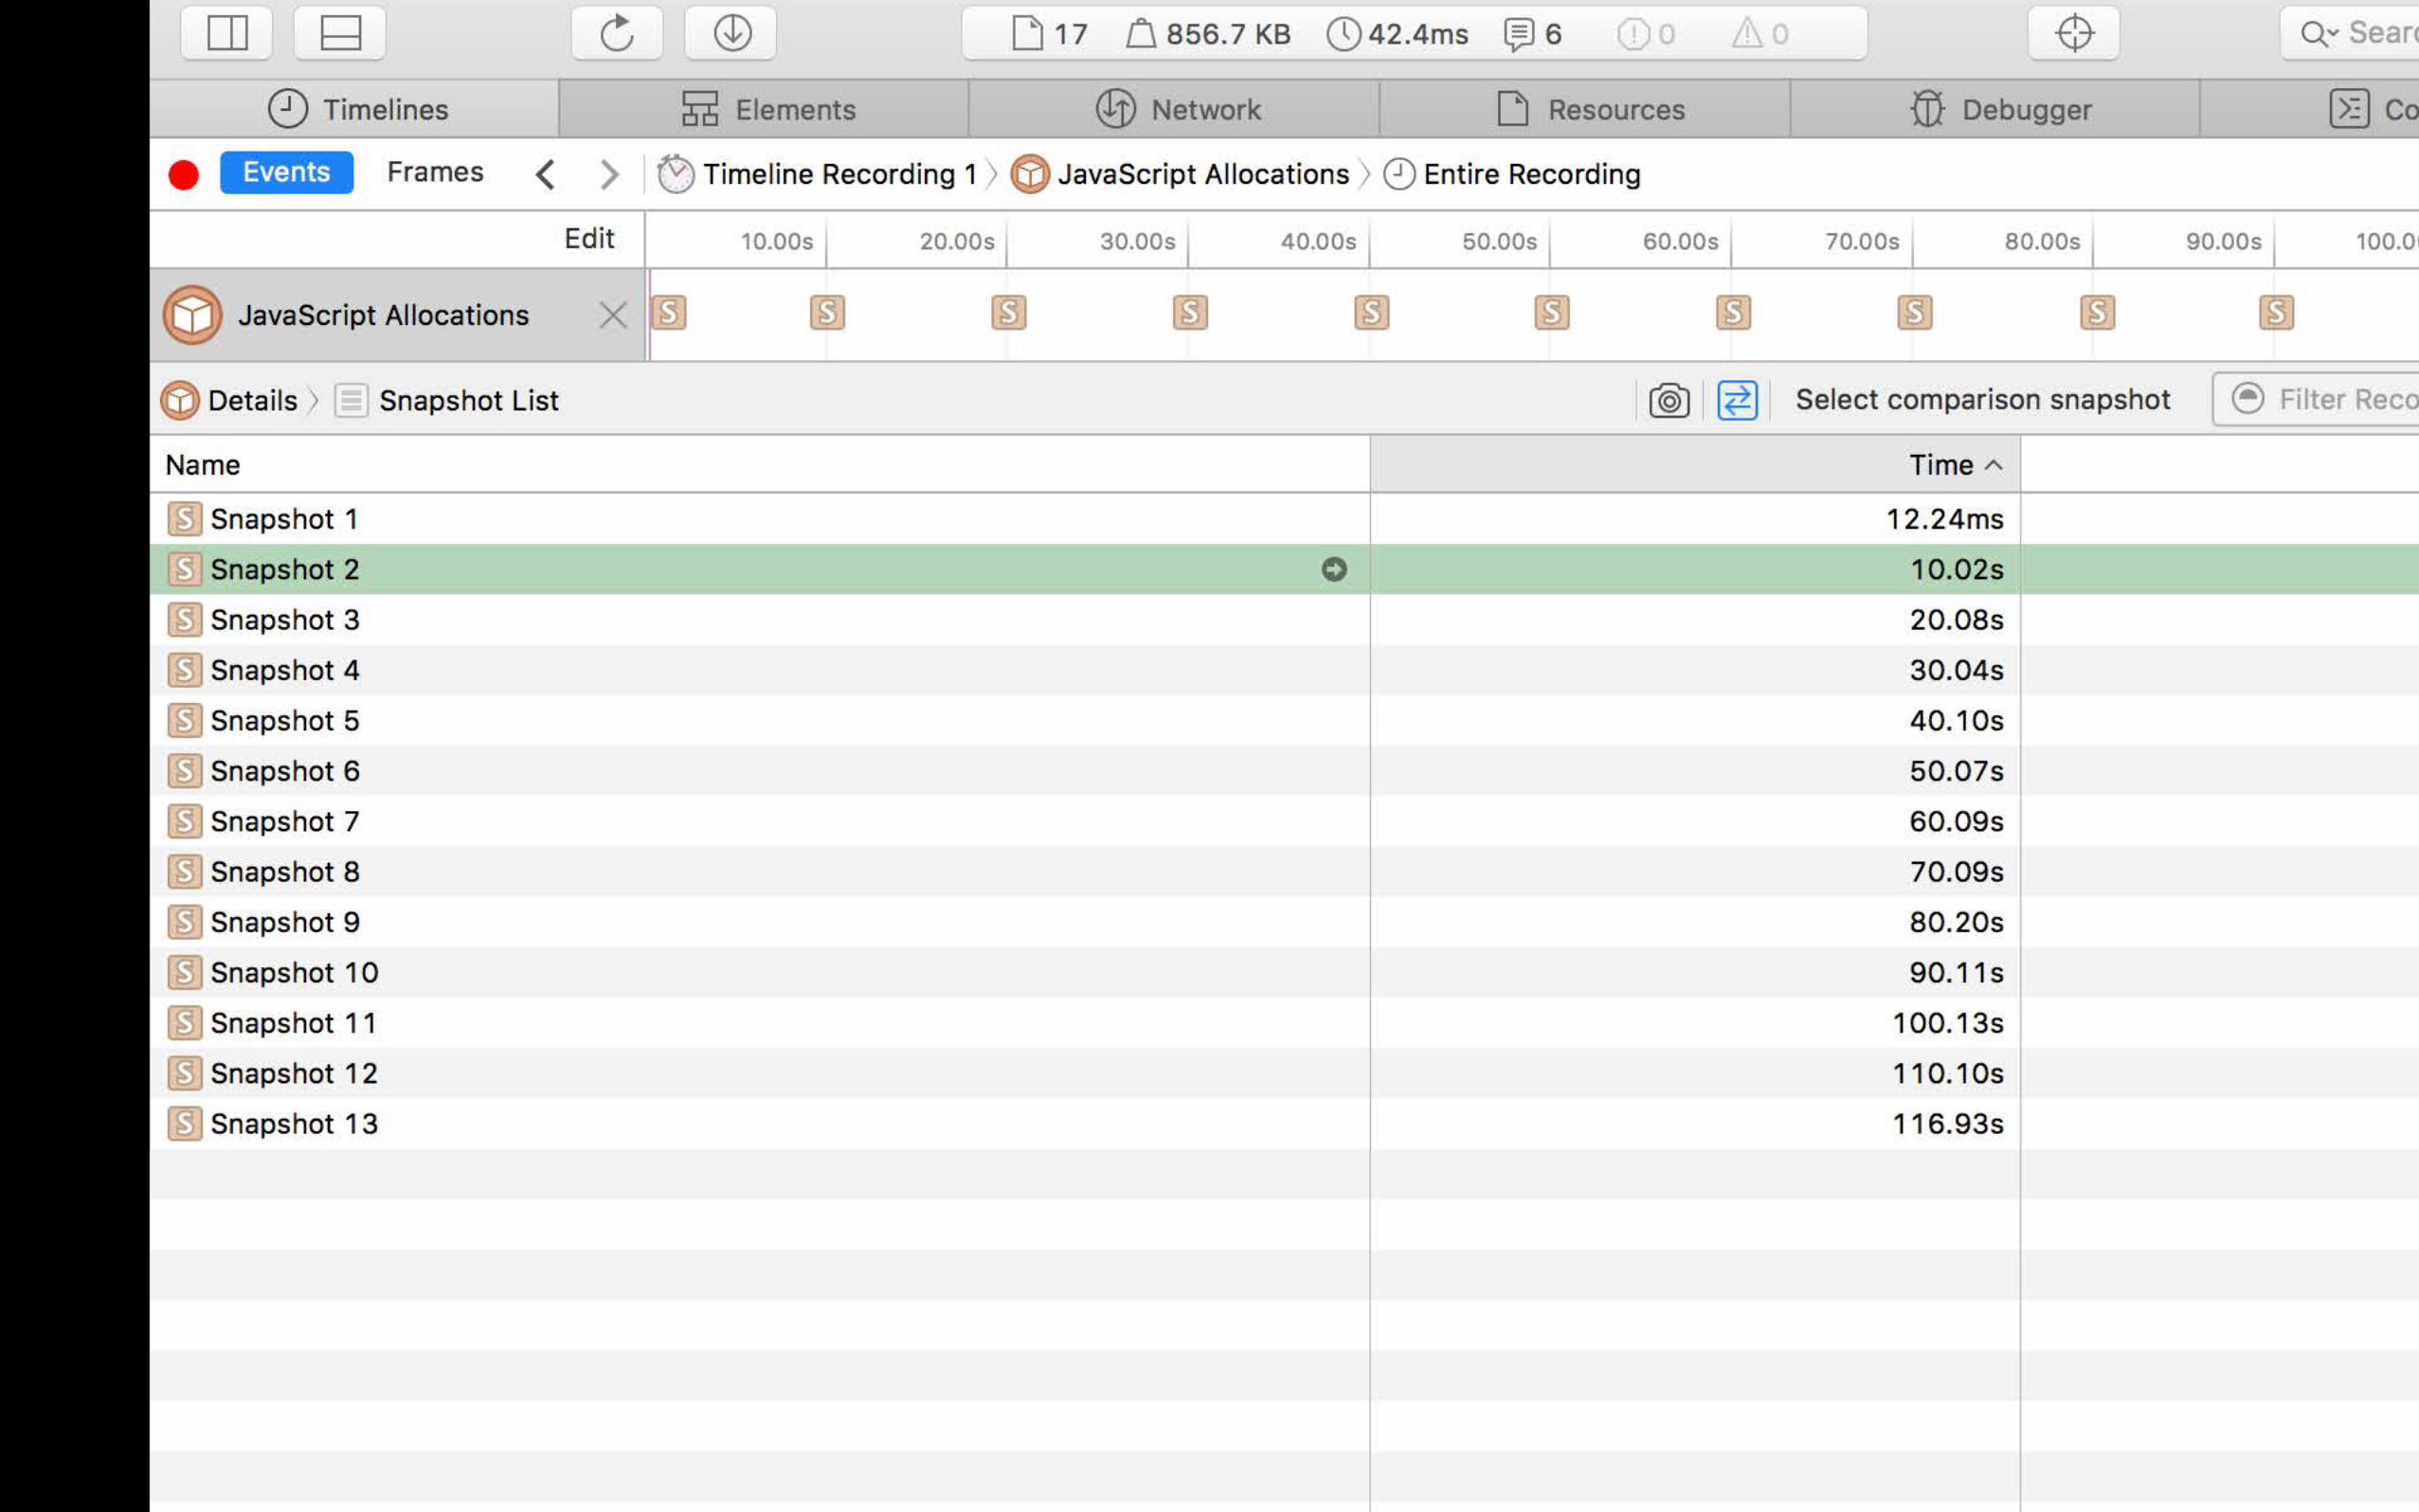
JavaScript Allocations timelineAnalyzing Memory
NEW

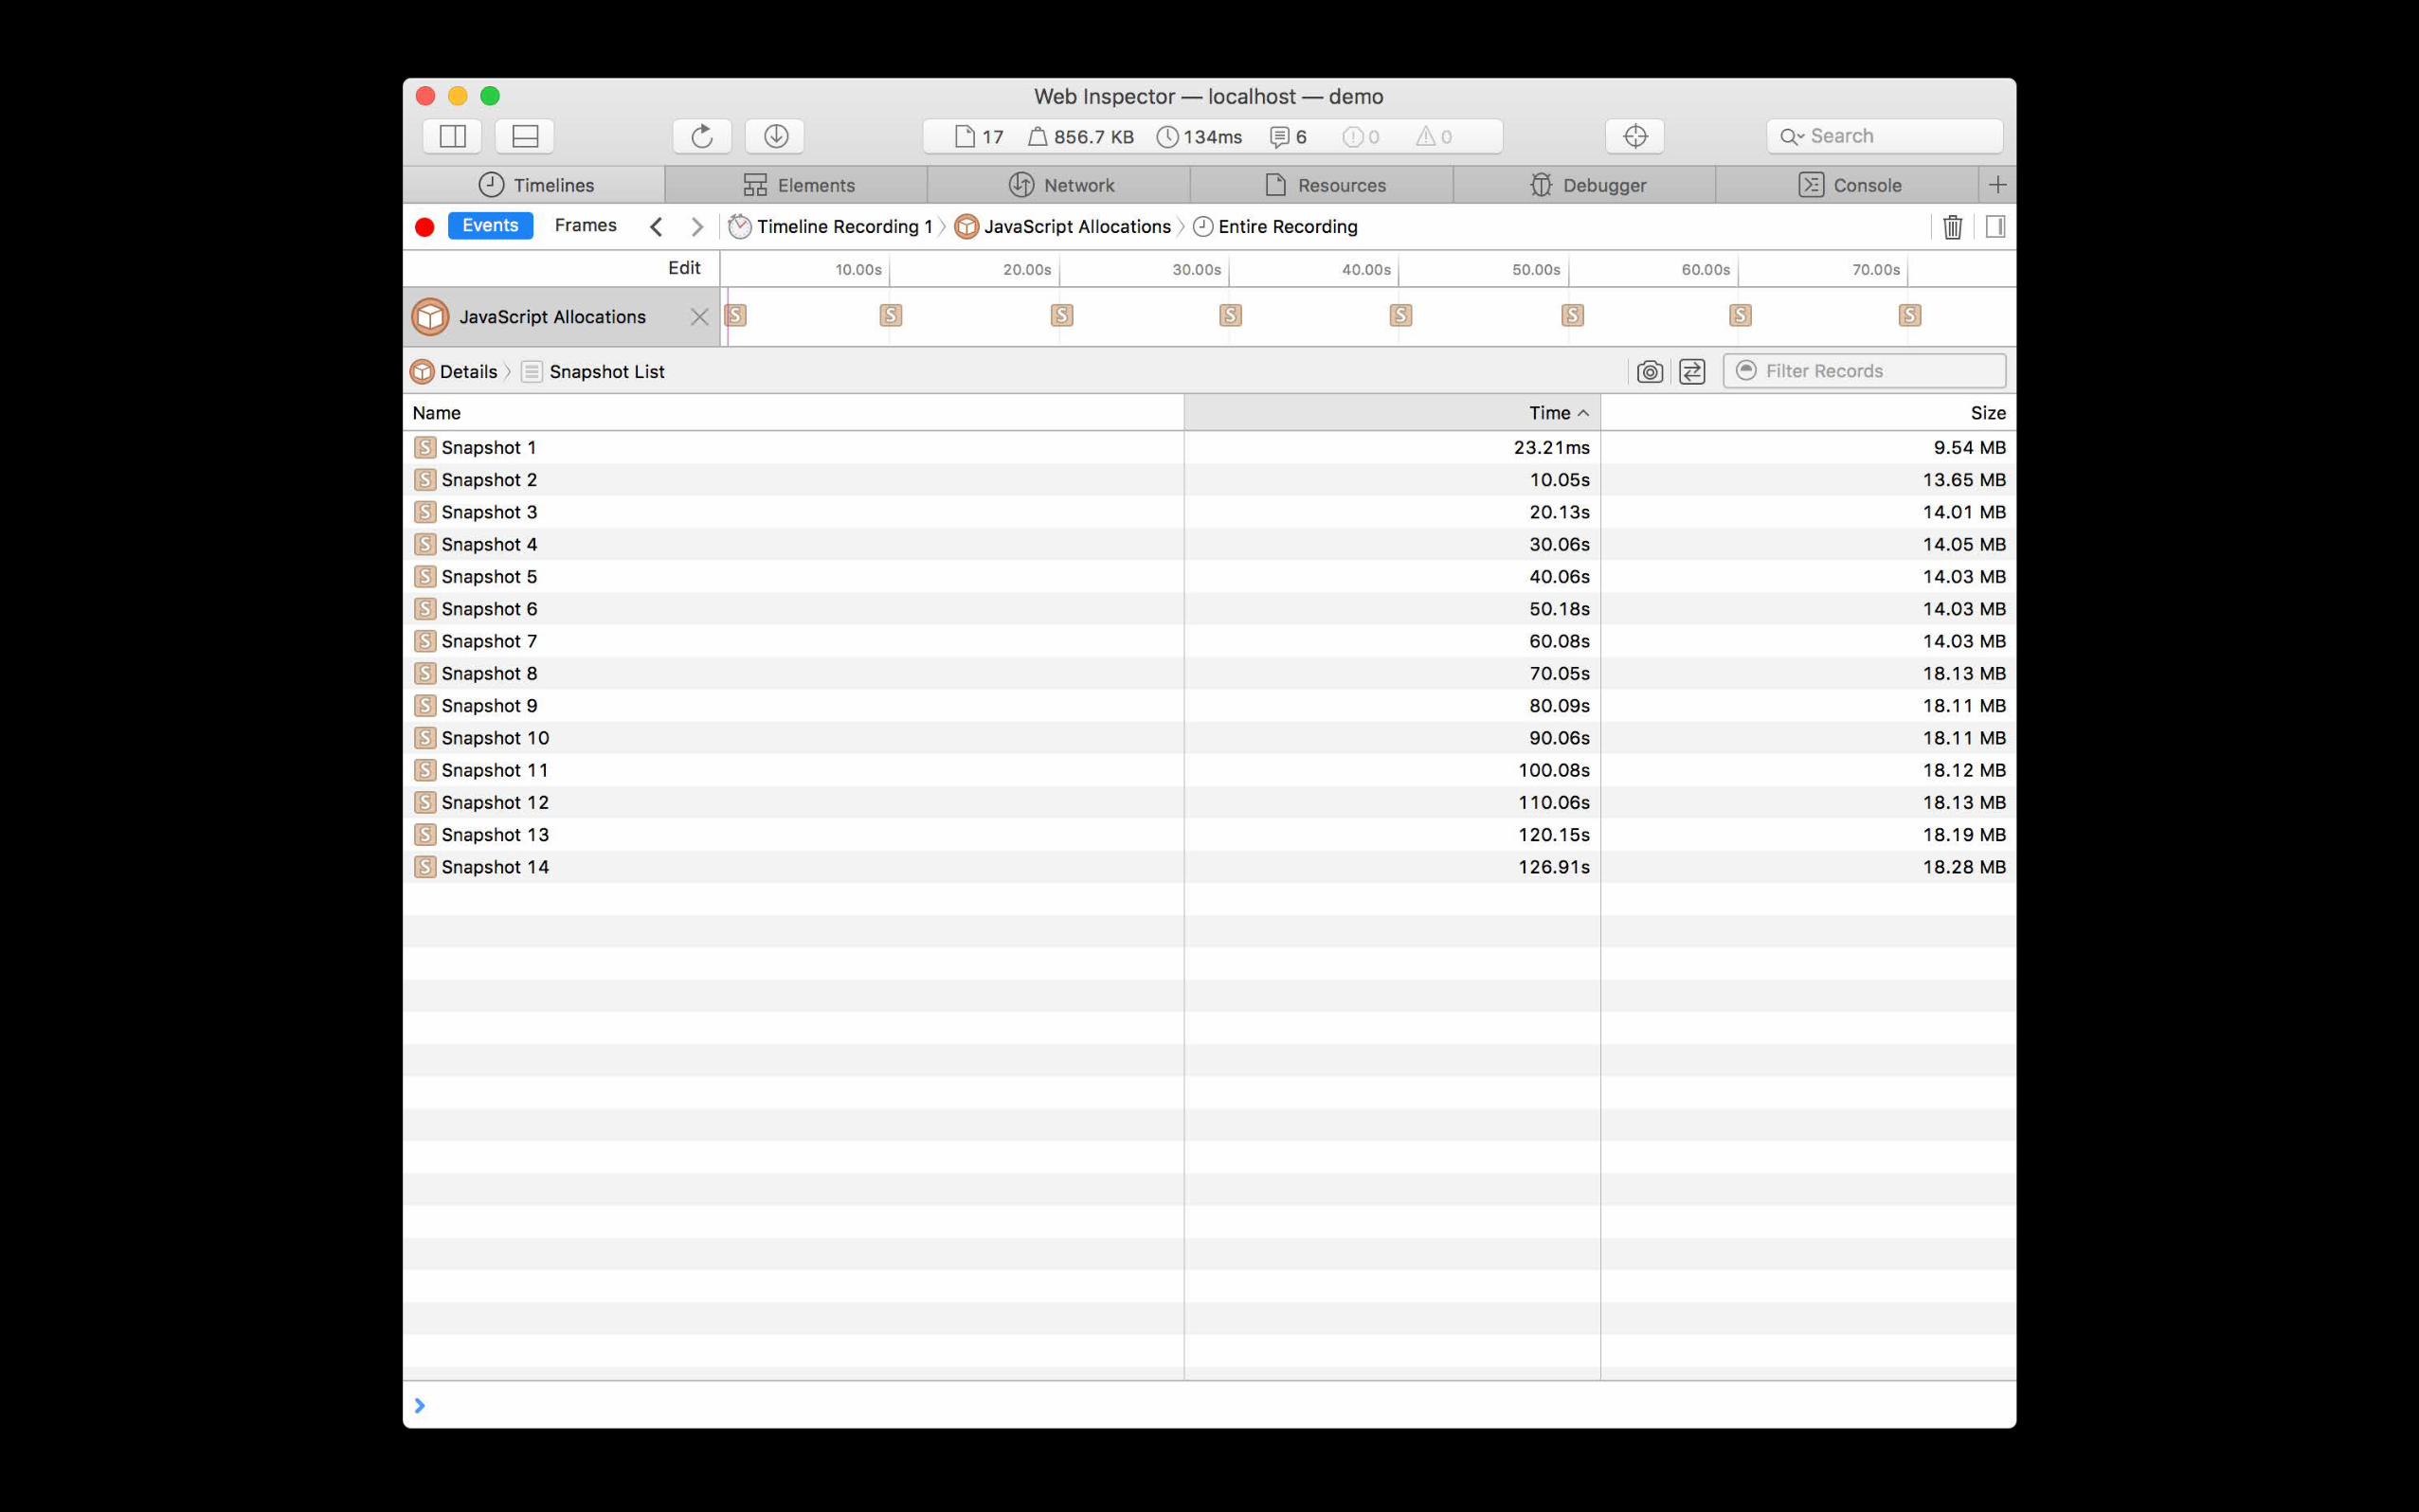
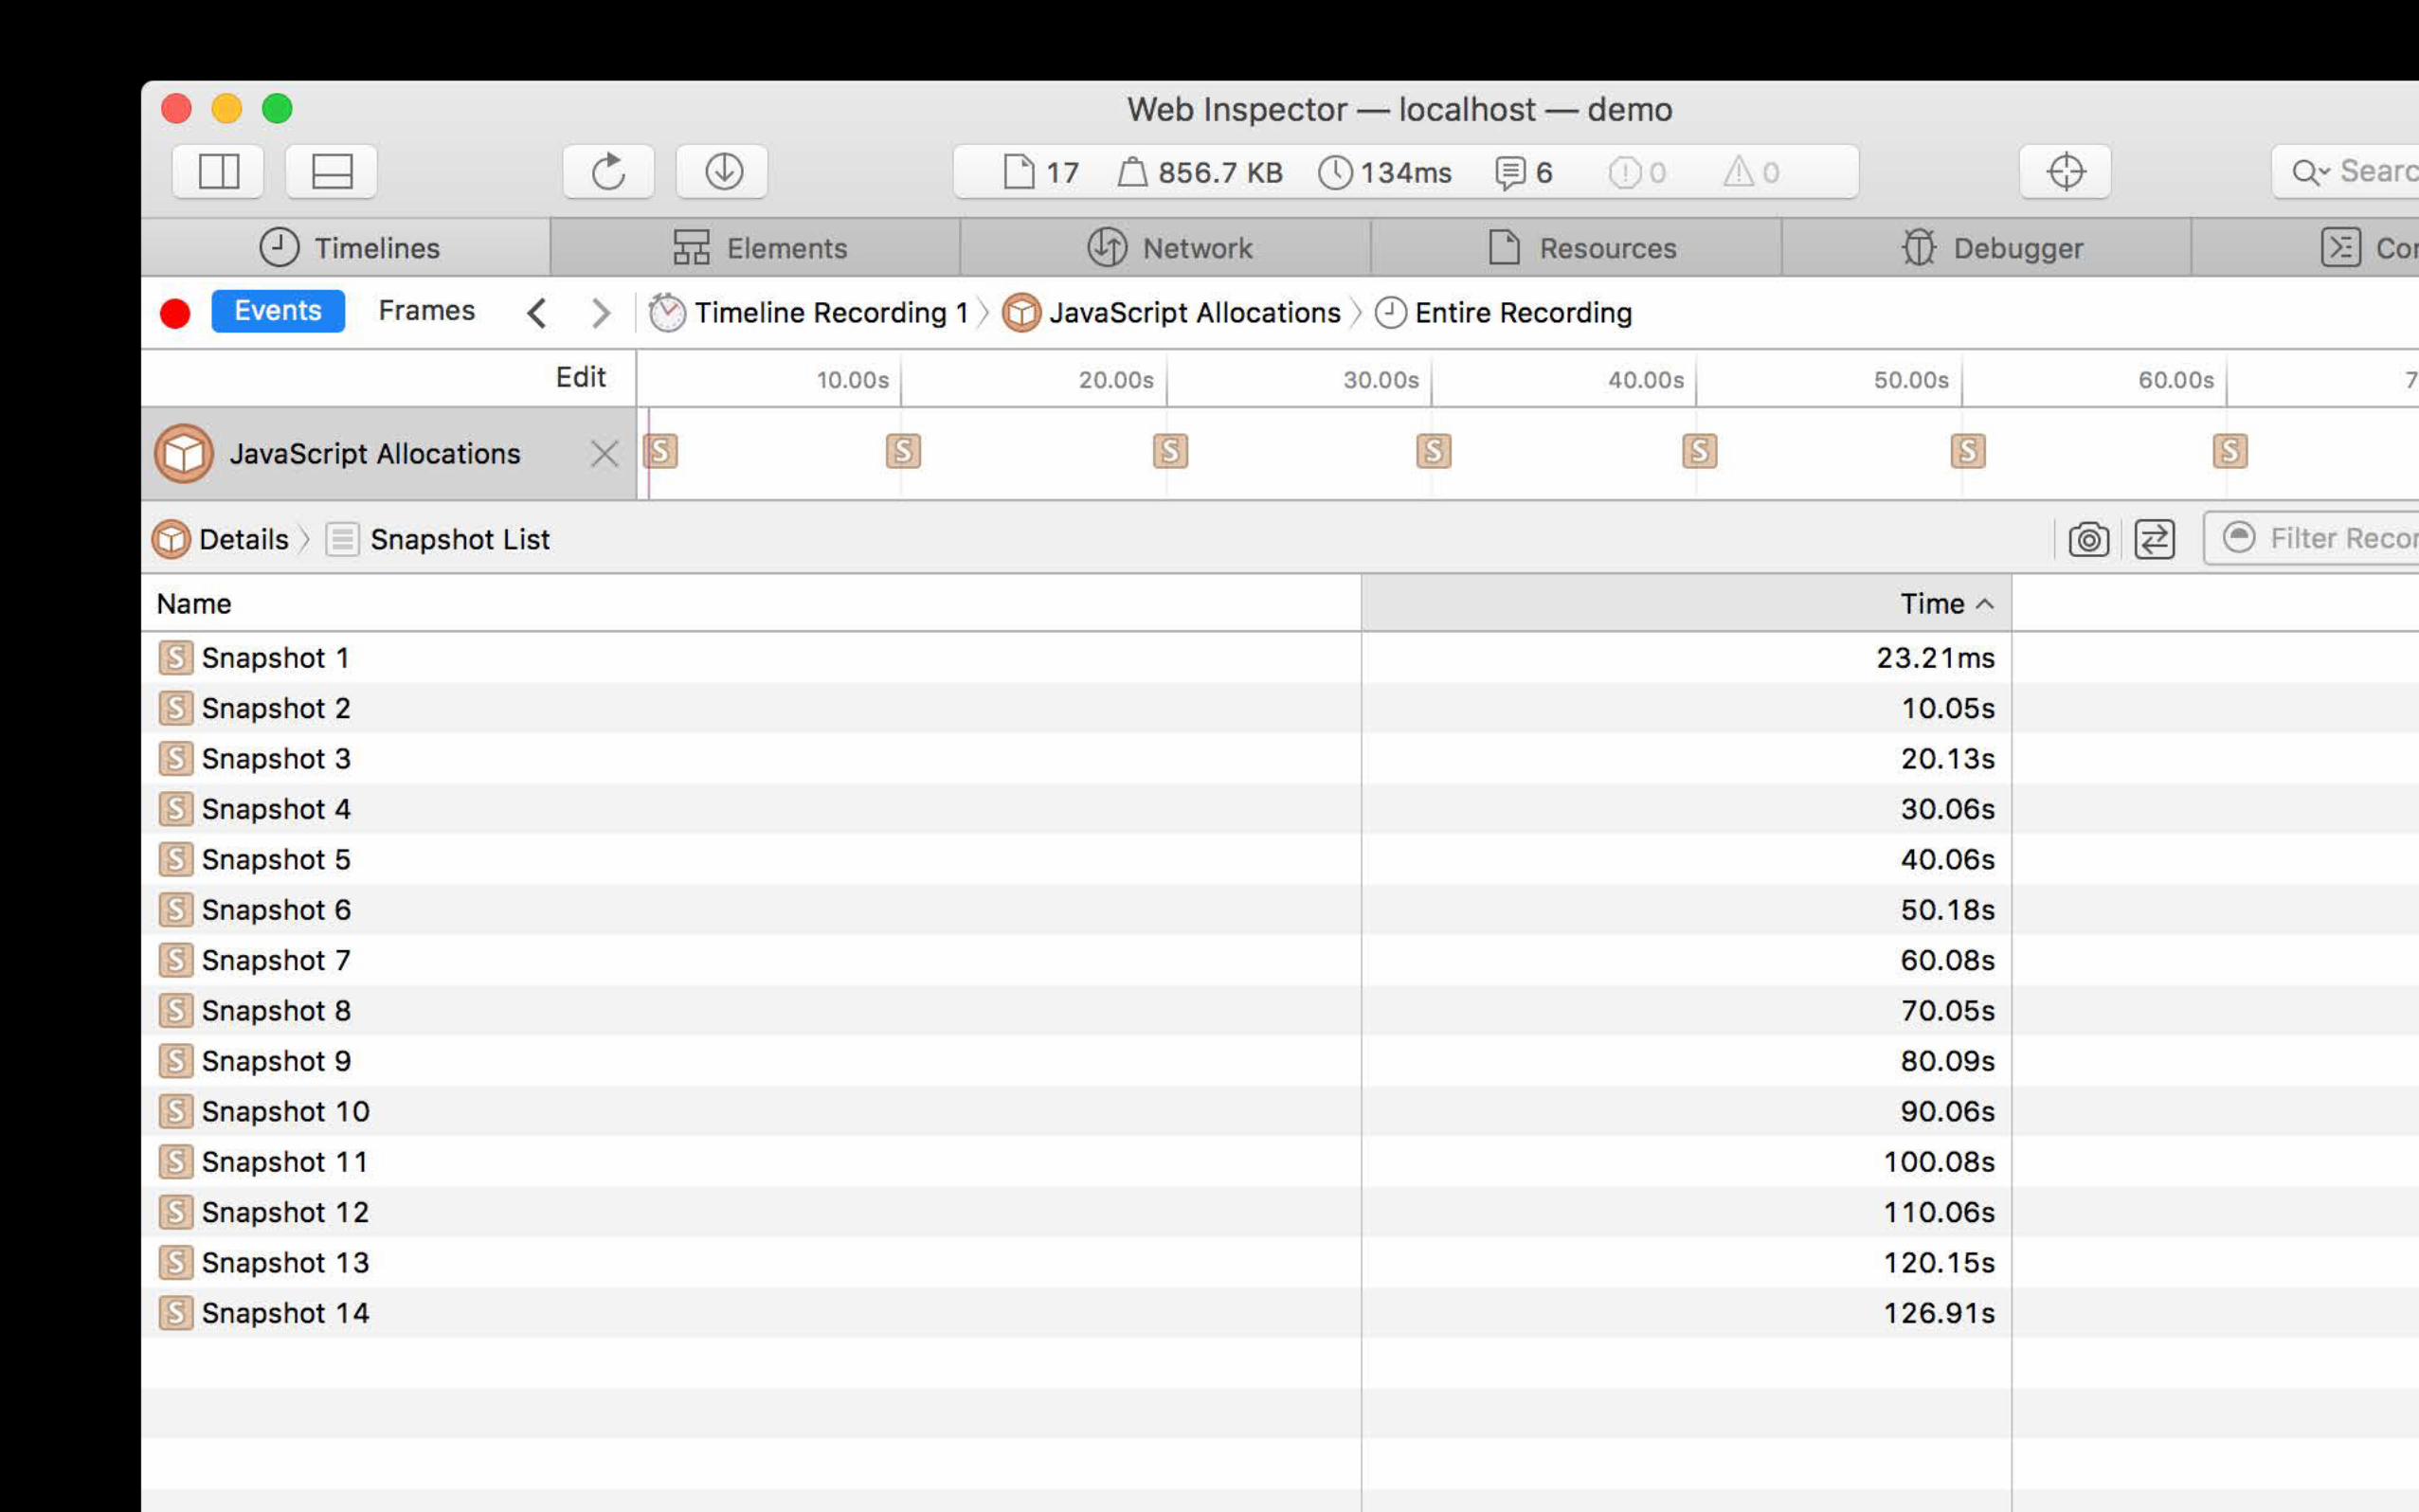
JavaScript Allocation Snapshots

JavaScript Allocation Snapshots


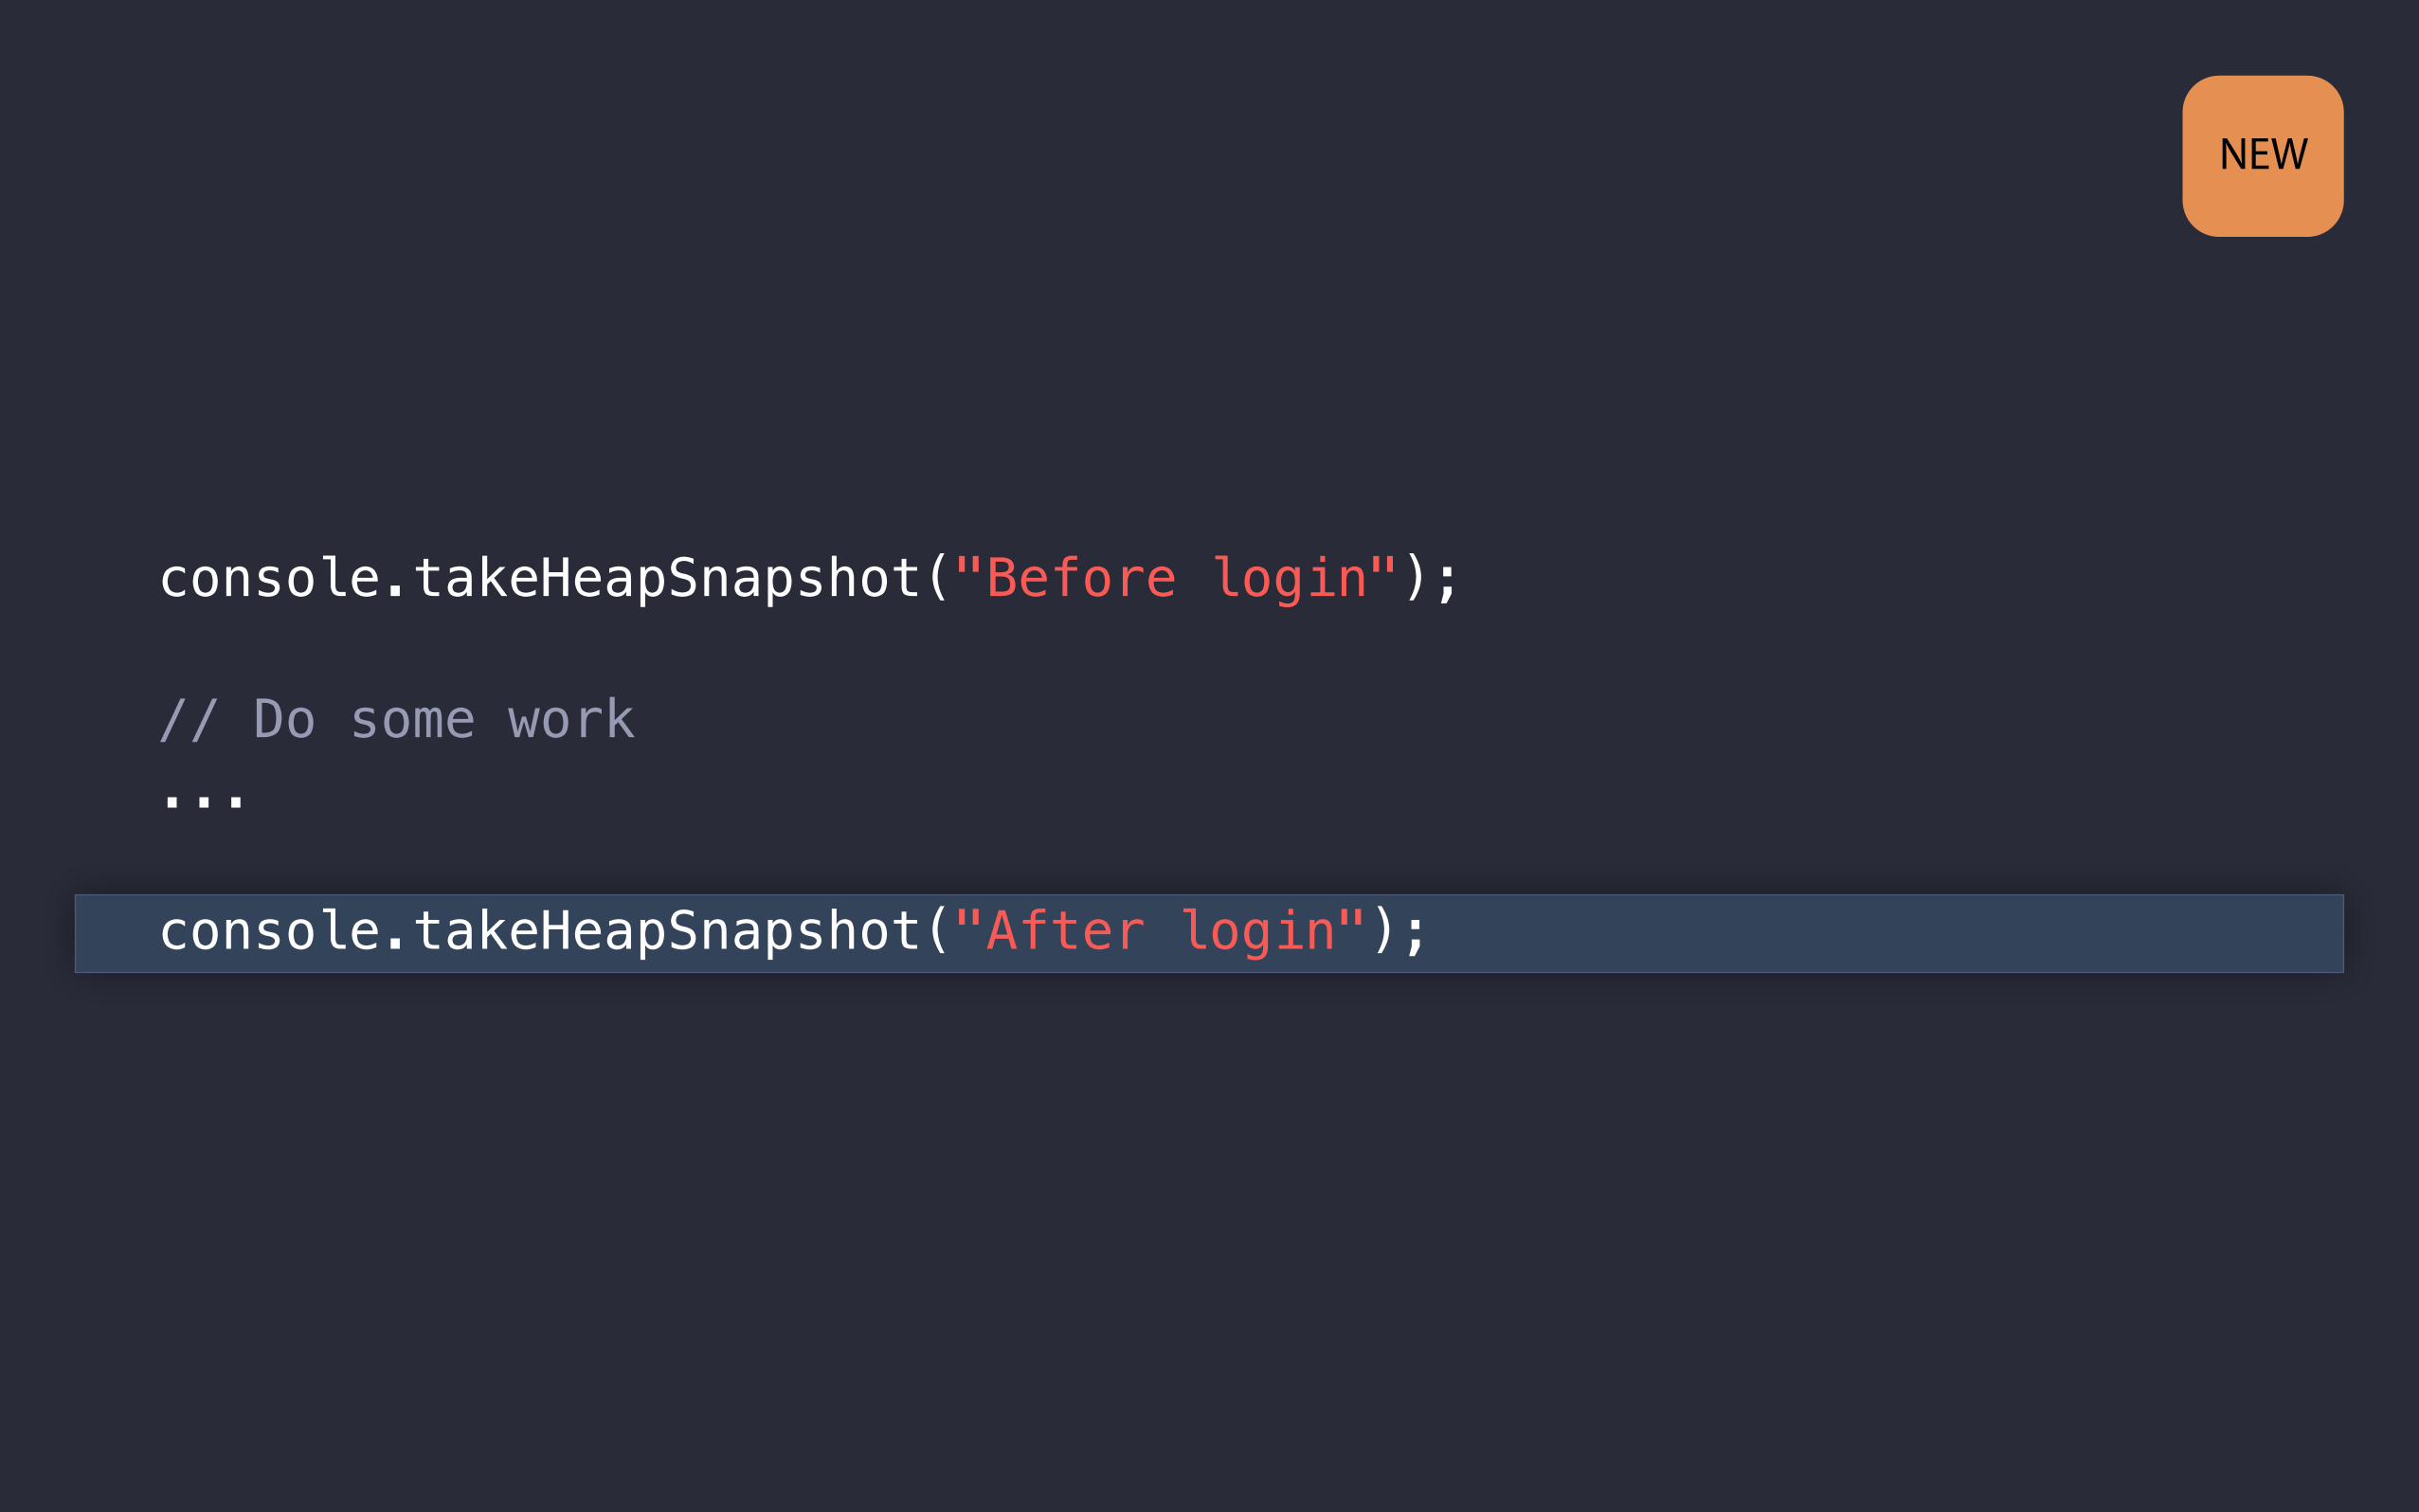
console.takeHeapSnapshot("Before login");
// Do some work ...
console.takeHeapSnapshot("After login");
NEW
console.takeHeapSnapshot("Before login");
// Do some work ...
console.takeHeapSnapshot("After login");
NEW
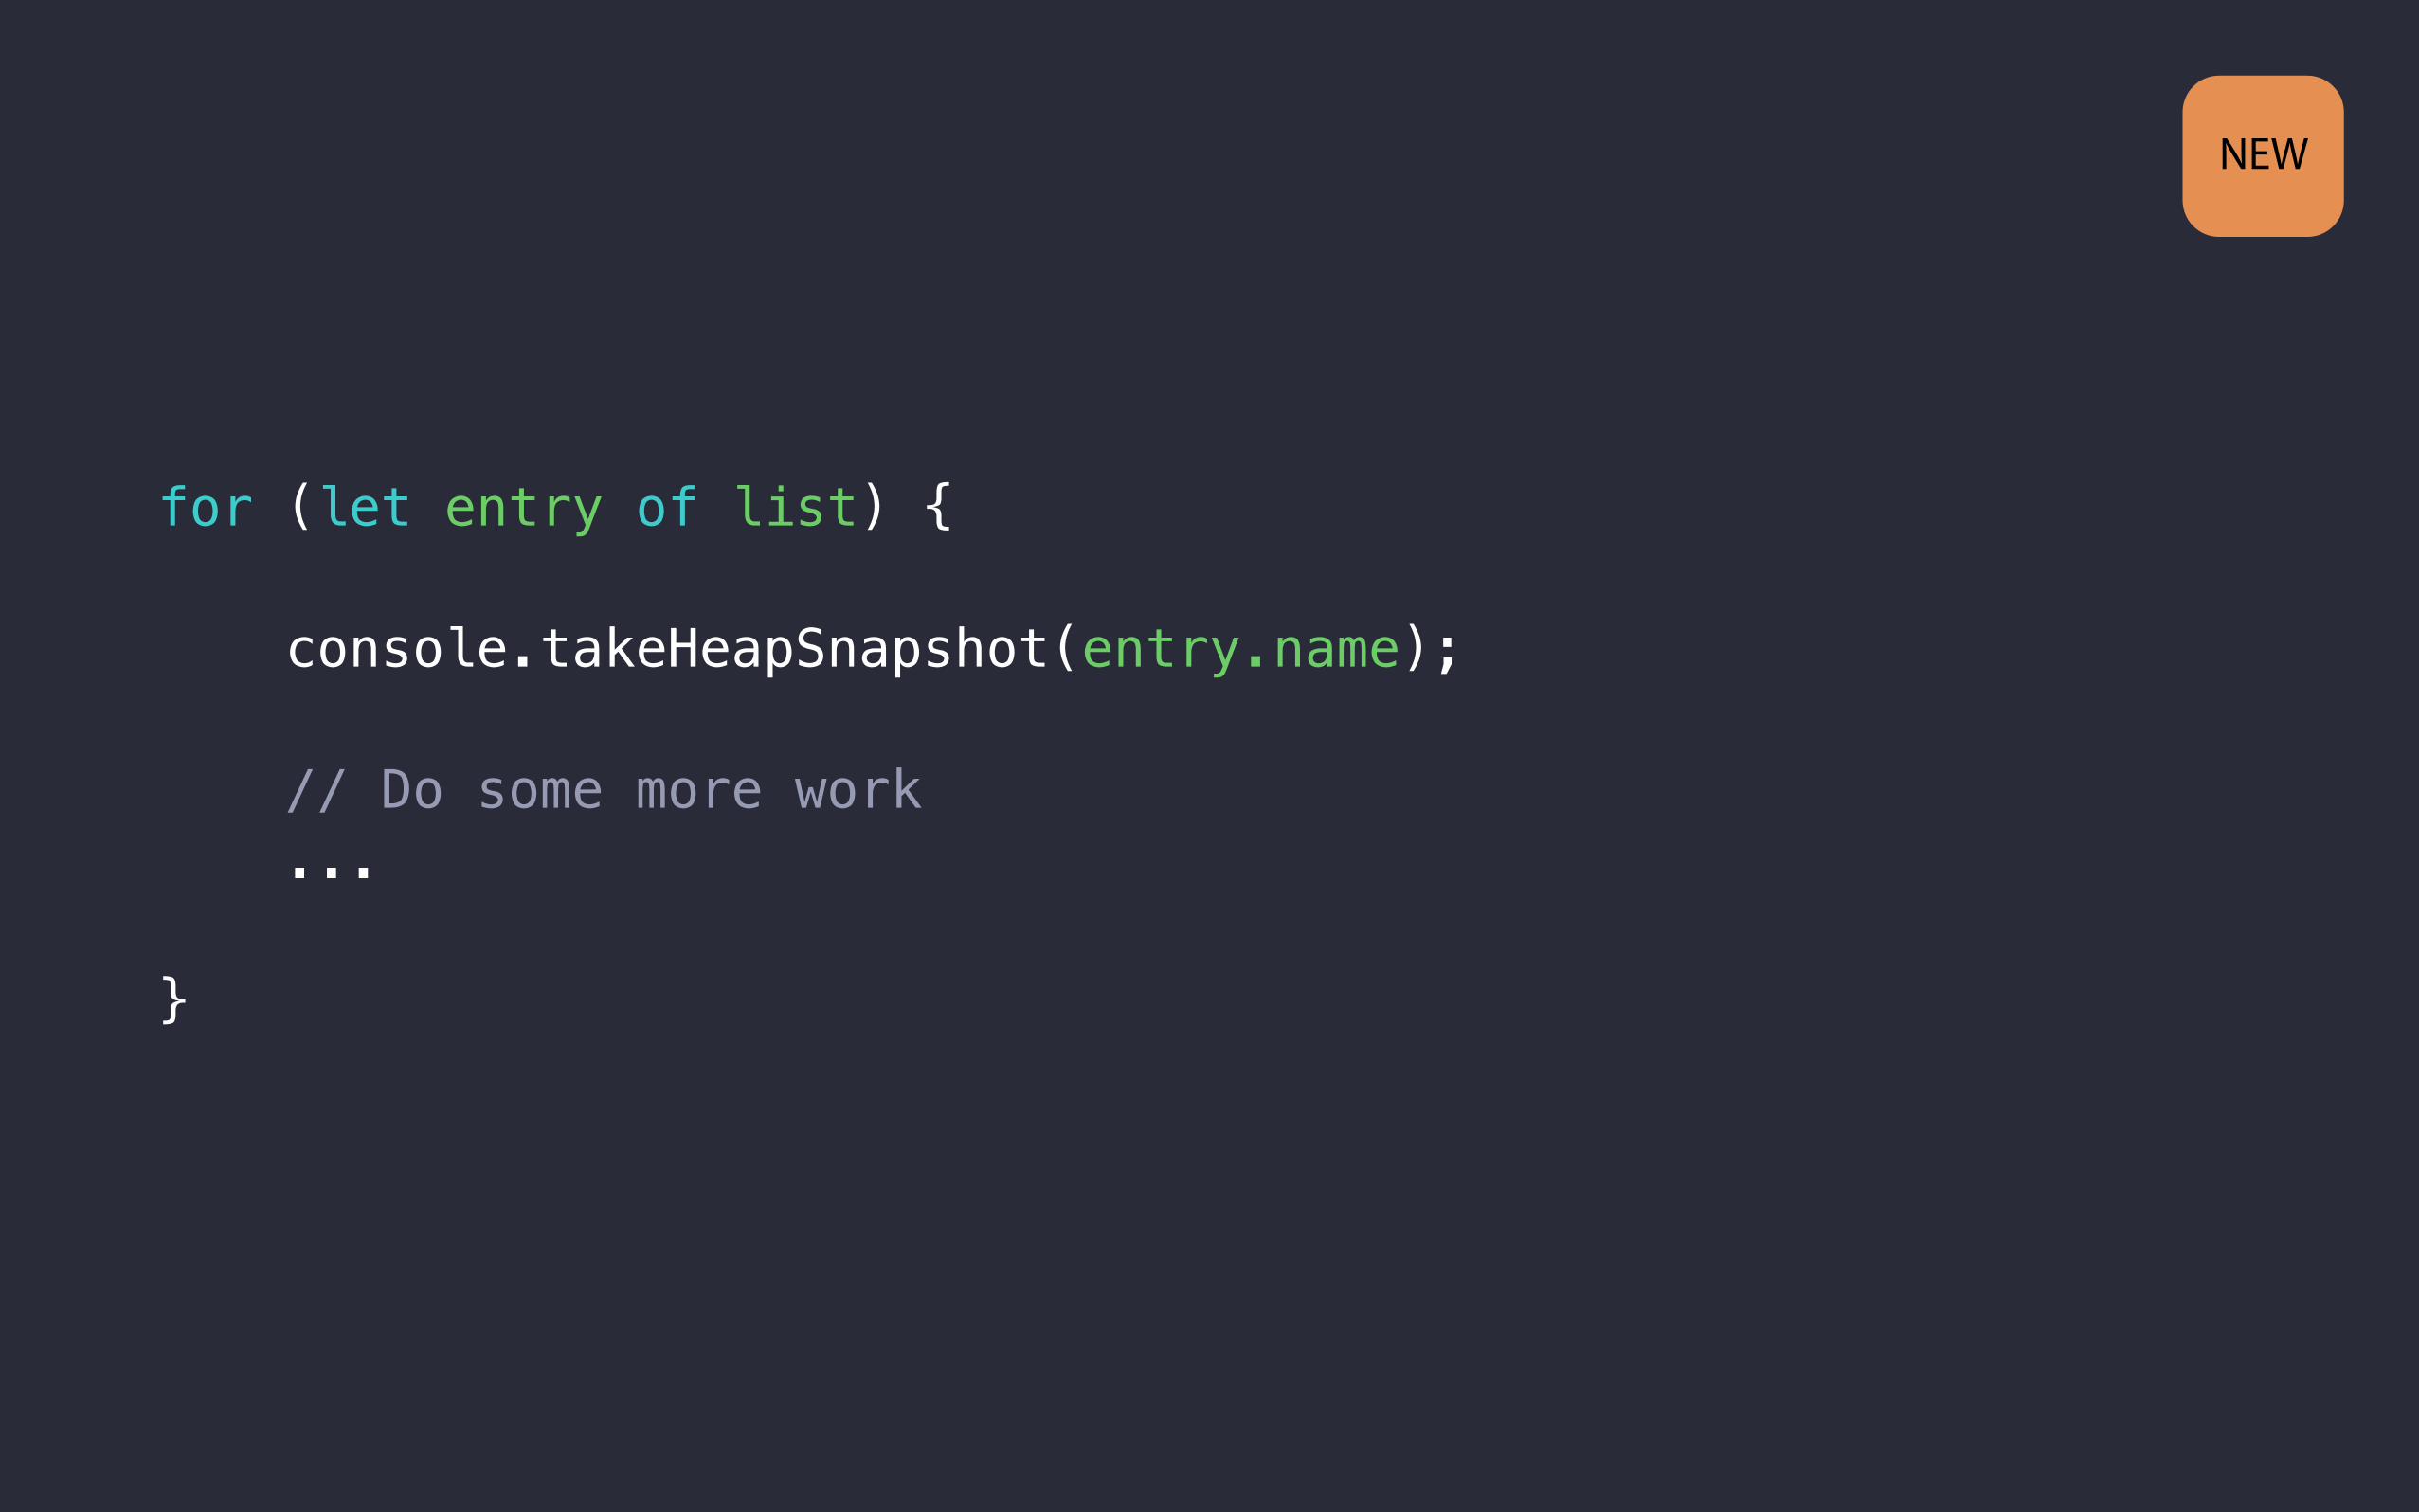
for (let entry of list) {
console.takeHeapSnapshot(entry.name);
// Do some more work ...
}
NEW

for (let entry of list) {
console.takeHeapSnapshot(entry.name);
// Do some more work ...
}
NEW

console.takeHeapSnapshot()Analyzing Memory
Snapshots can impact performance
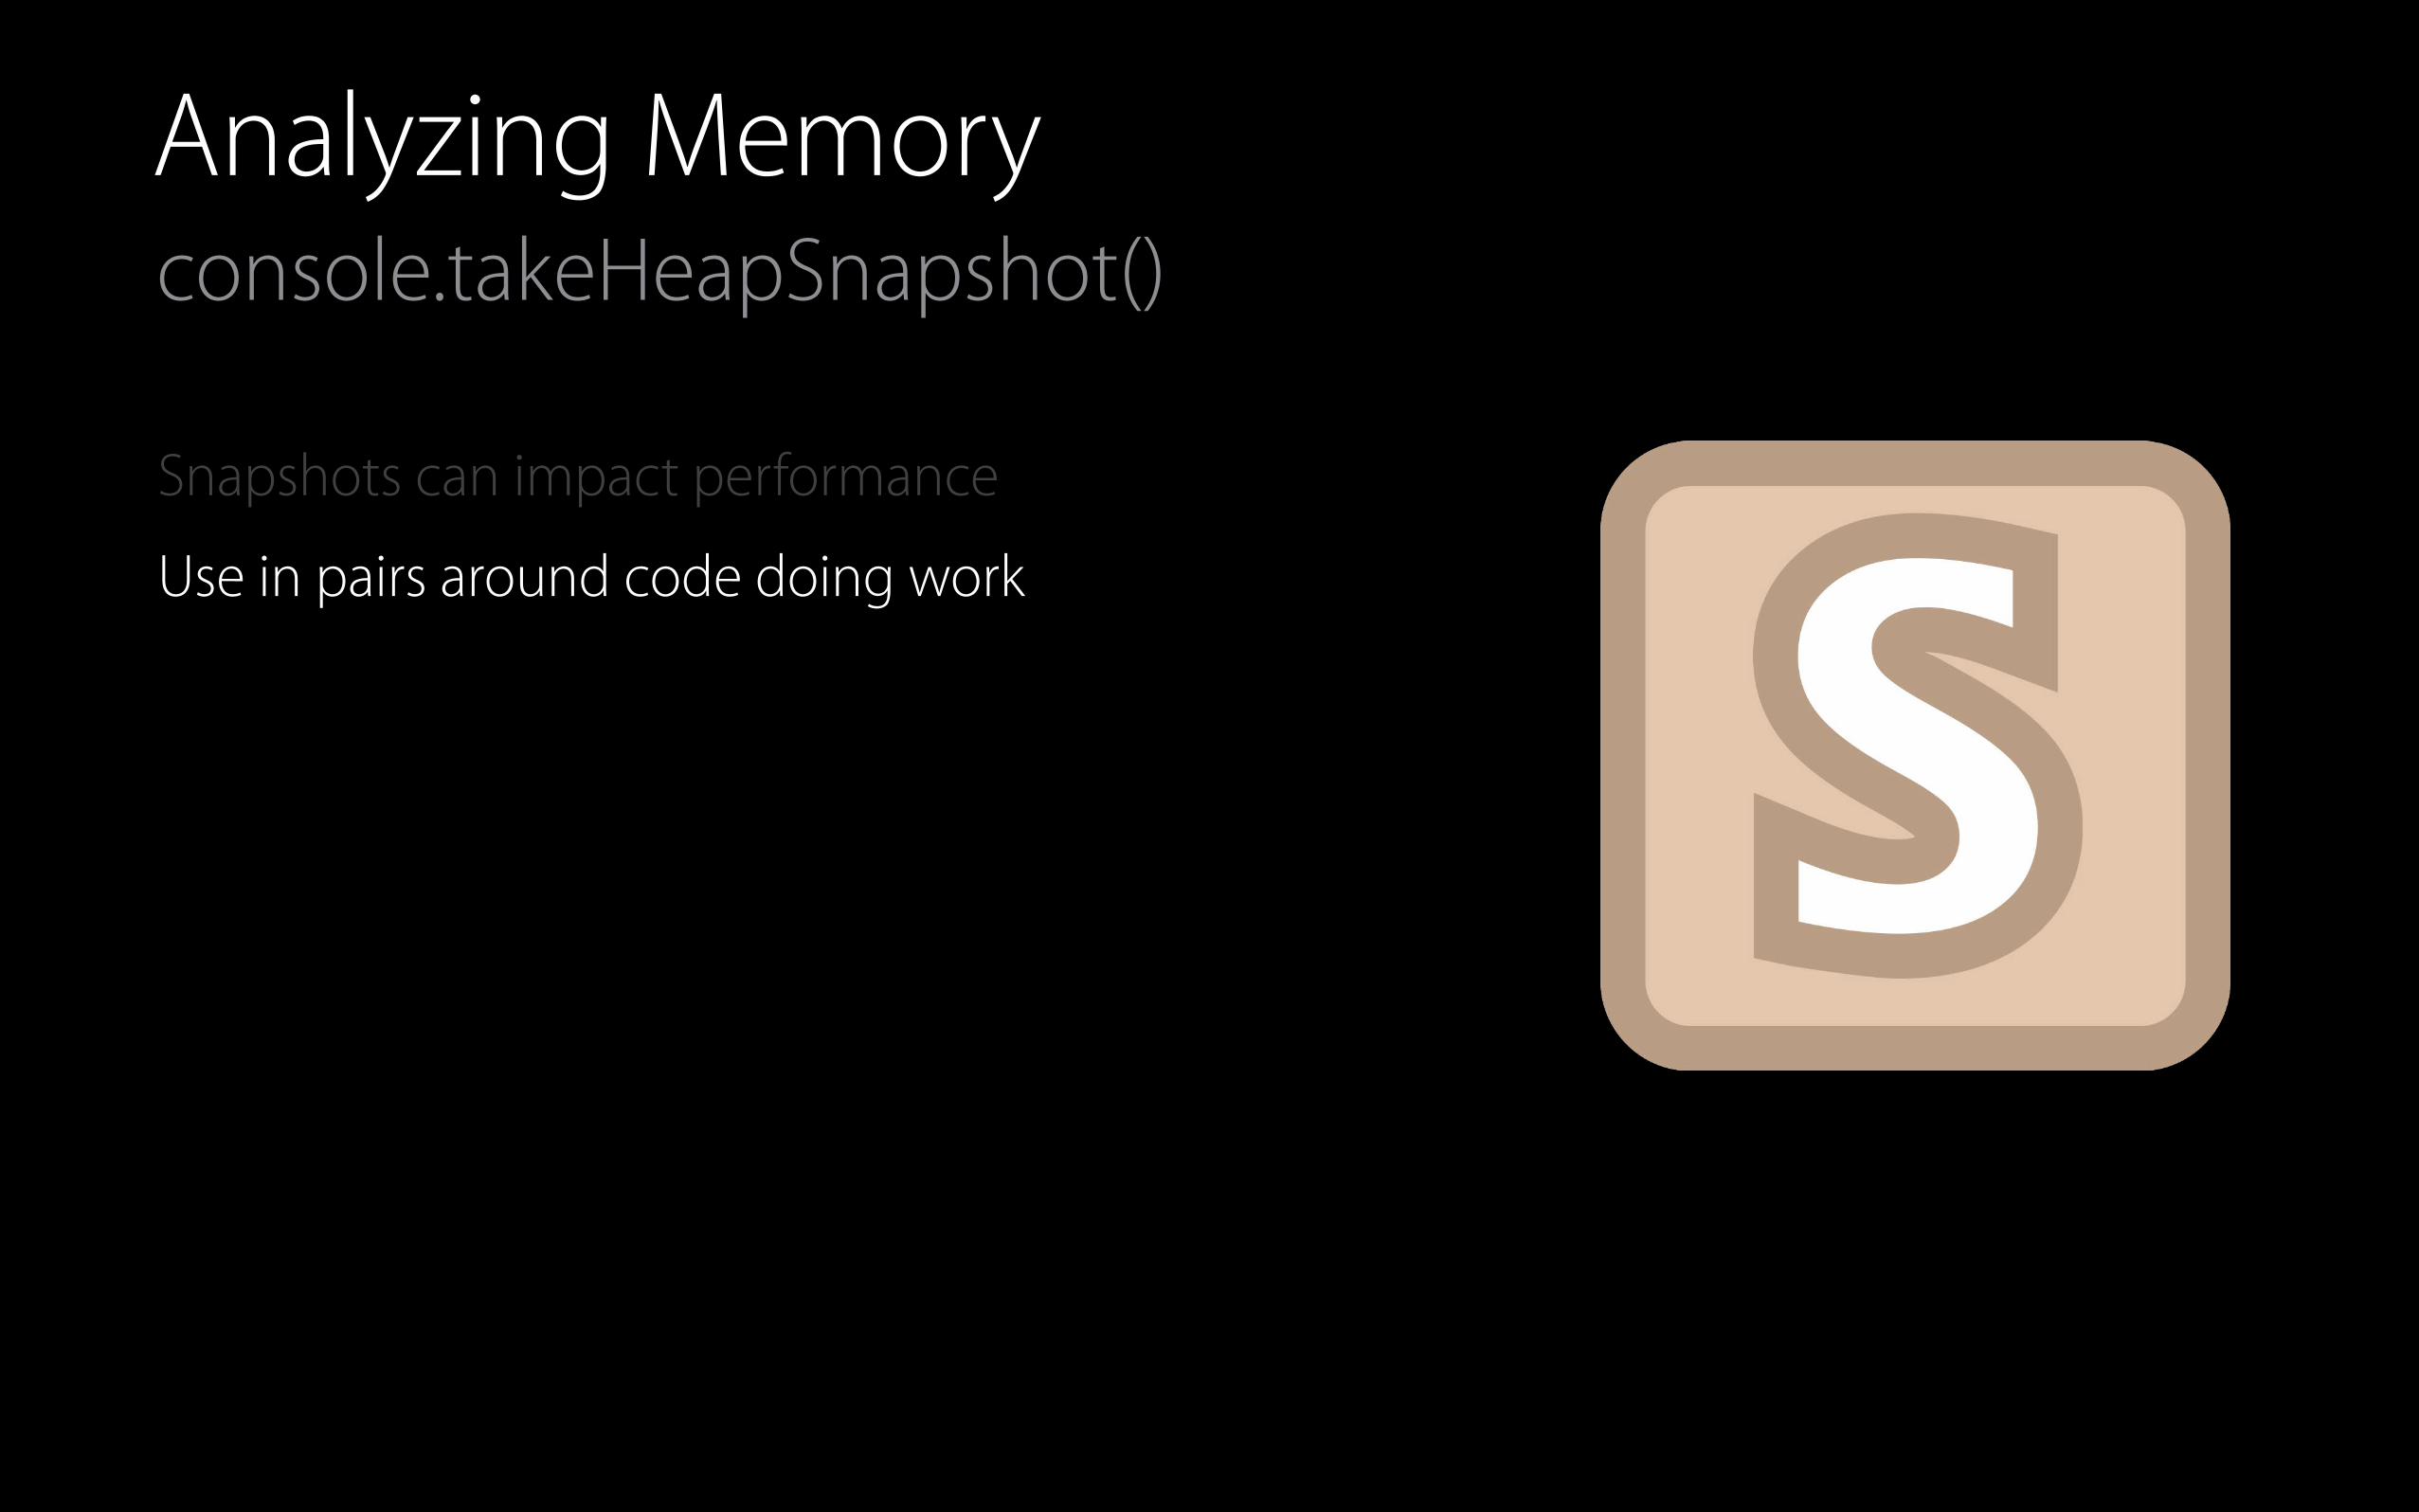
console.takeHeapSnapshot()Analyzing Memory
Snapshots can impact performanceUse in pairs around code doing work
console.takeHeapSnapshot()Analyzing Memory
Snapshots can impact performanceUse in pairs around code doing workDon't leave in console.takeHeapSnapshot()


DemoMemory and JavaScript Allocations timelines
Brian BurgSafari and WebKit Engineer

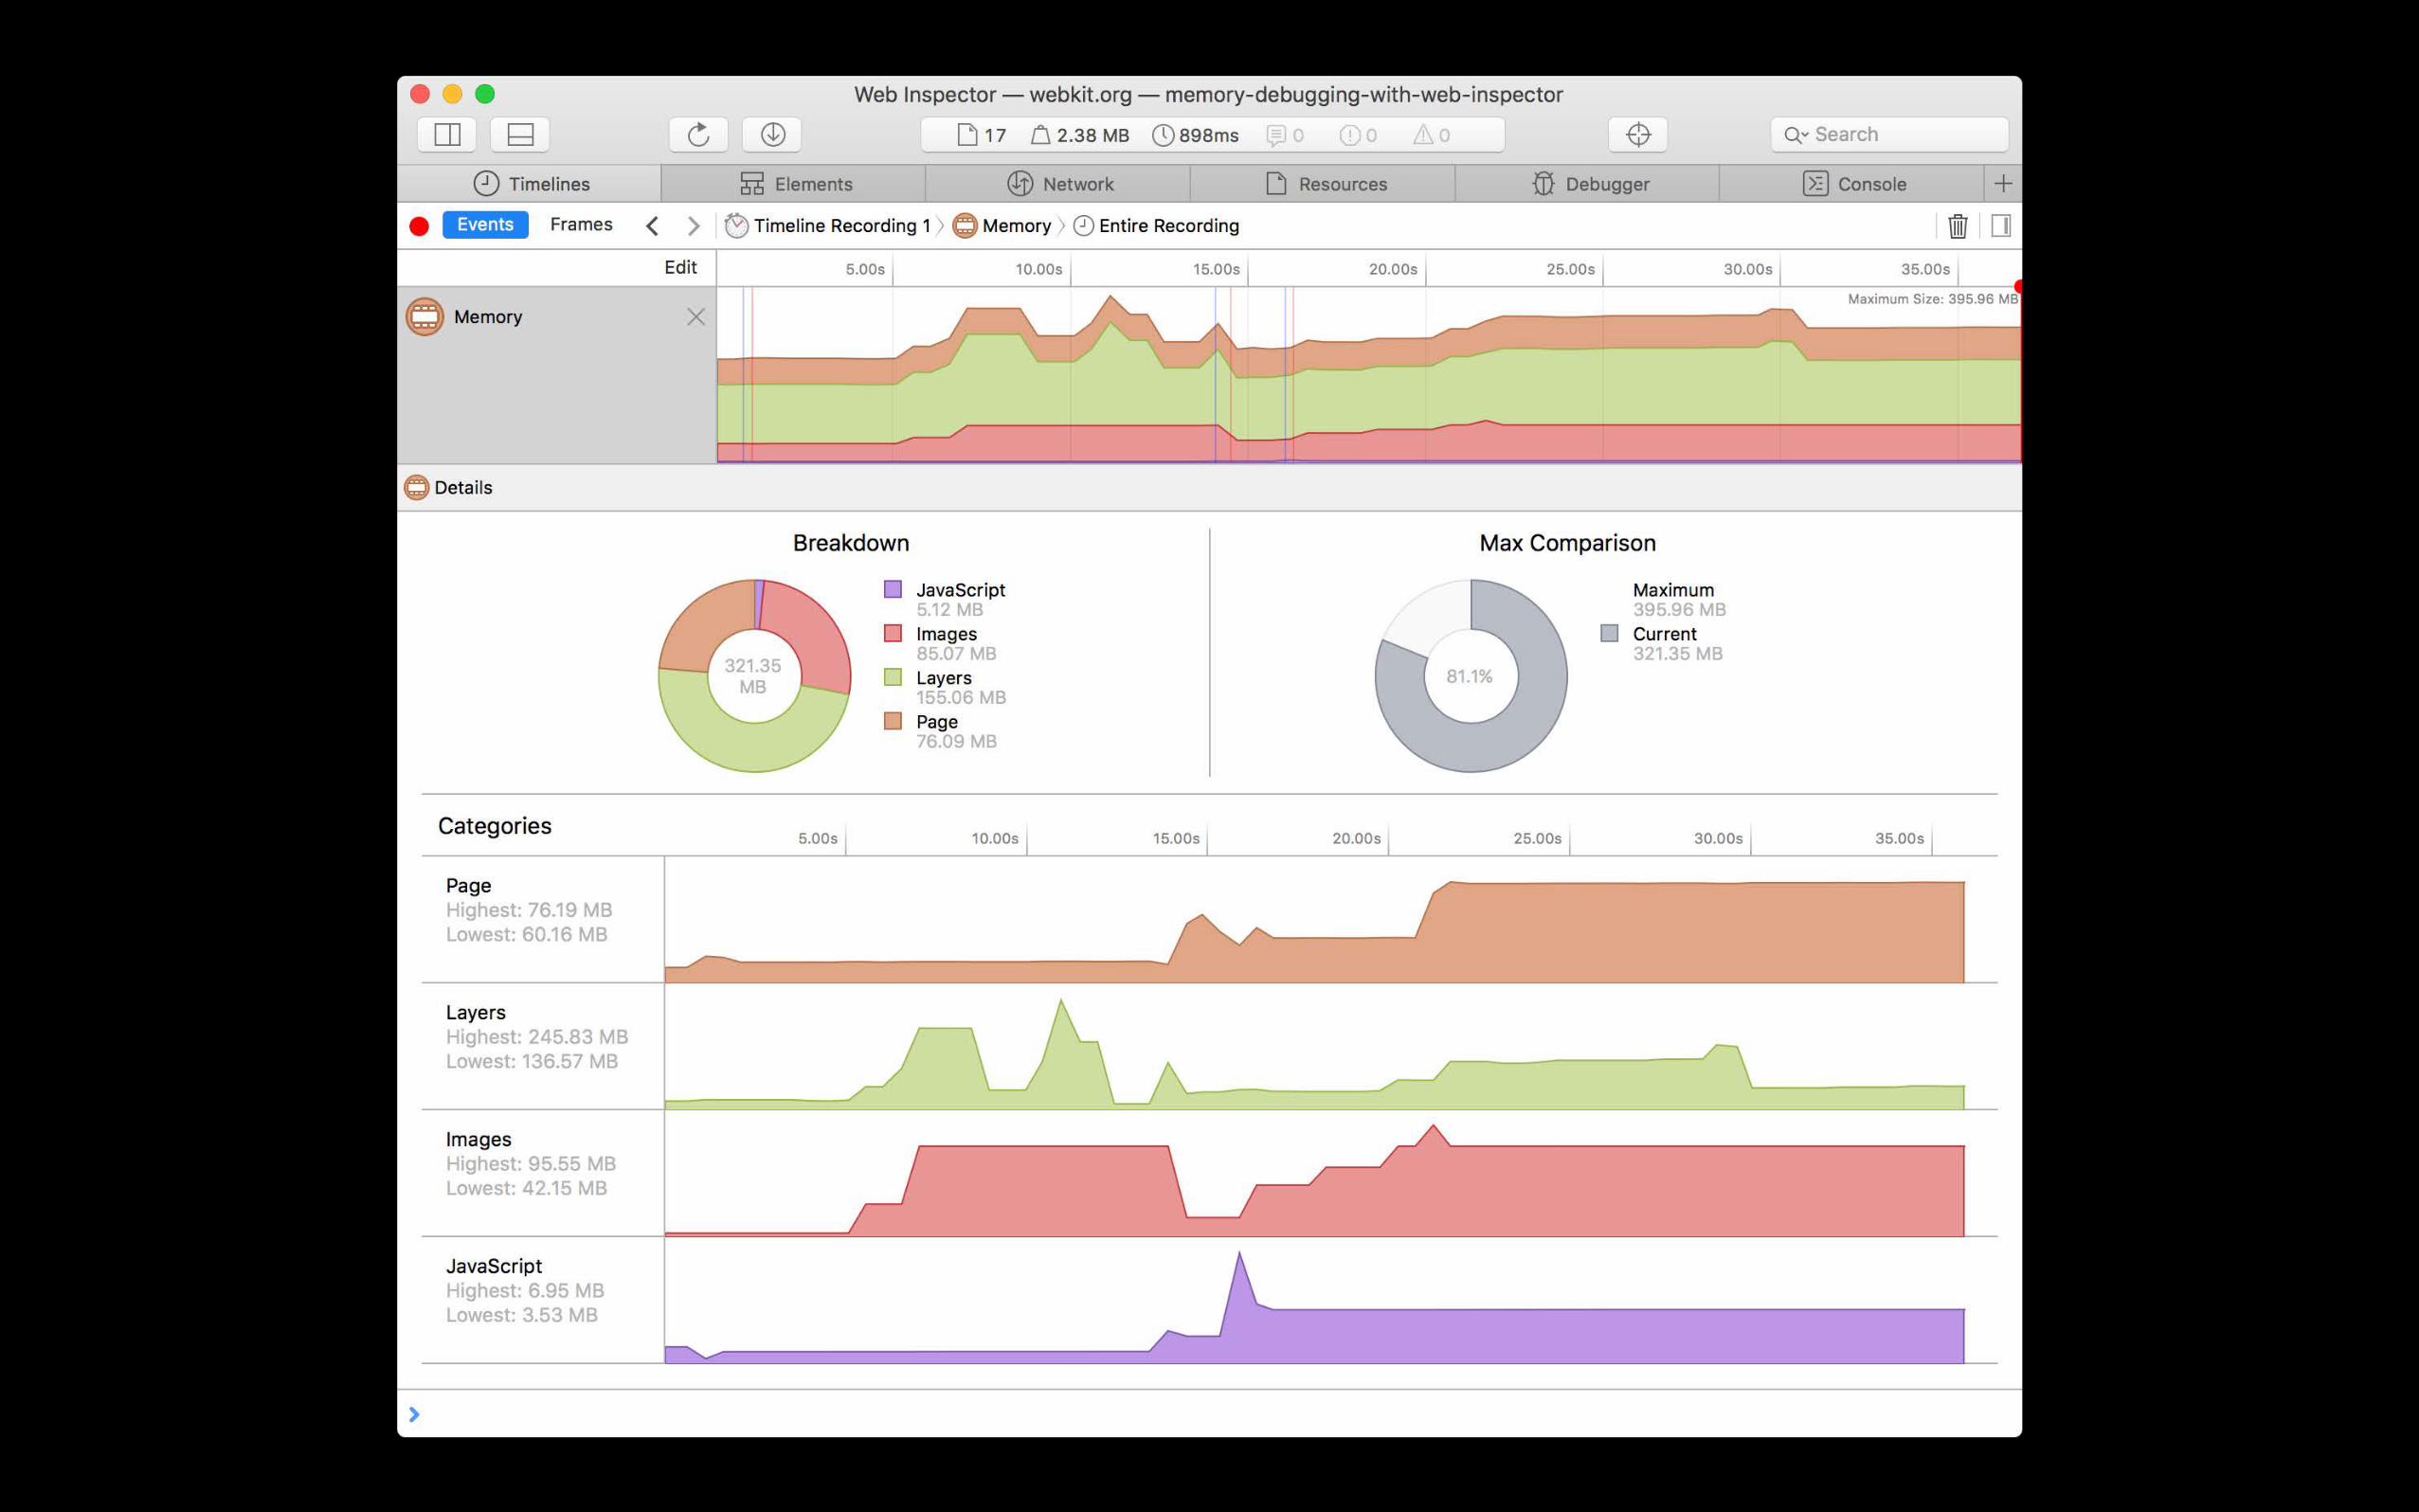
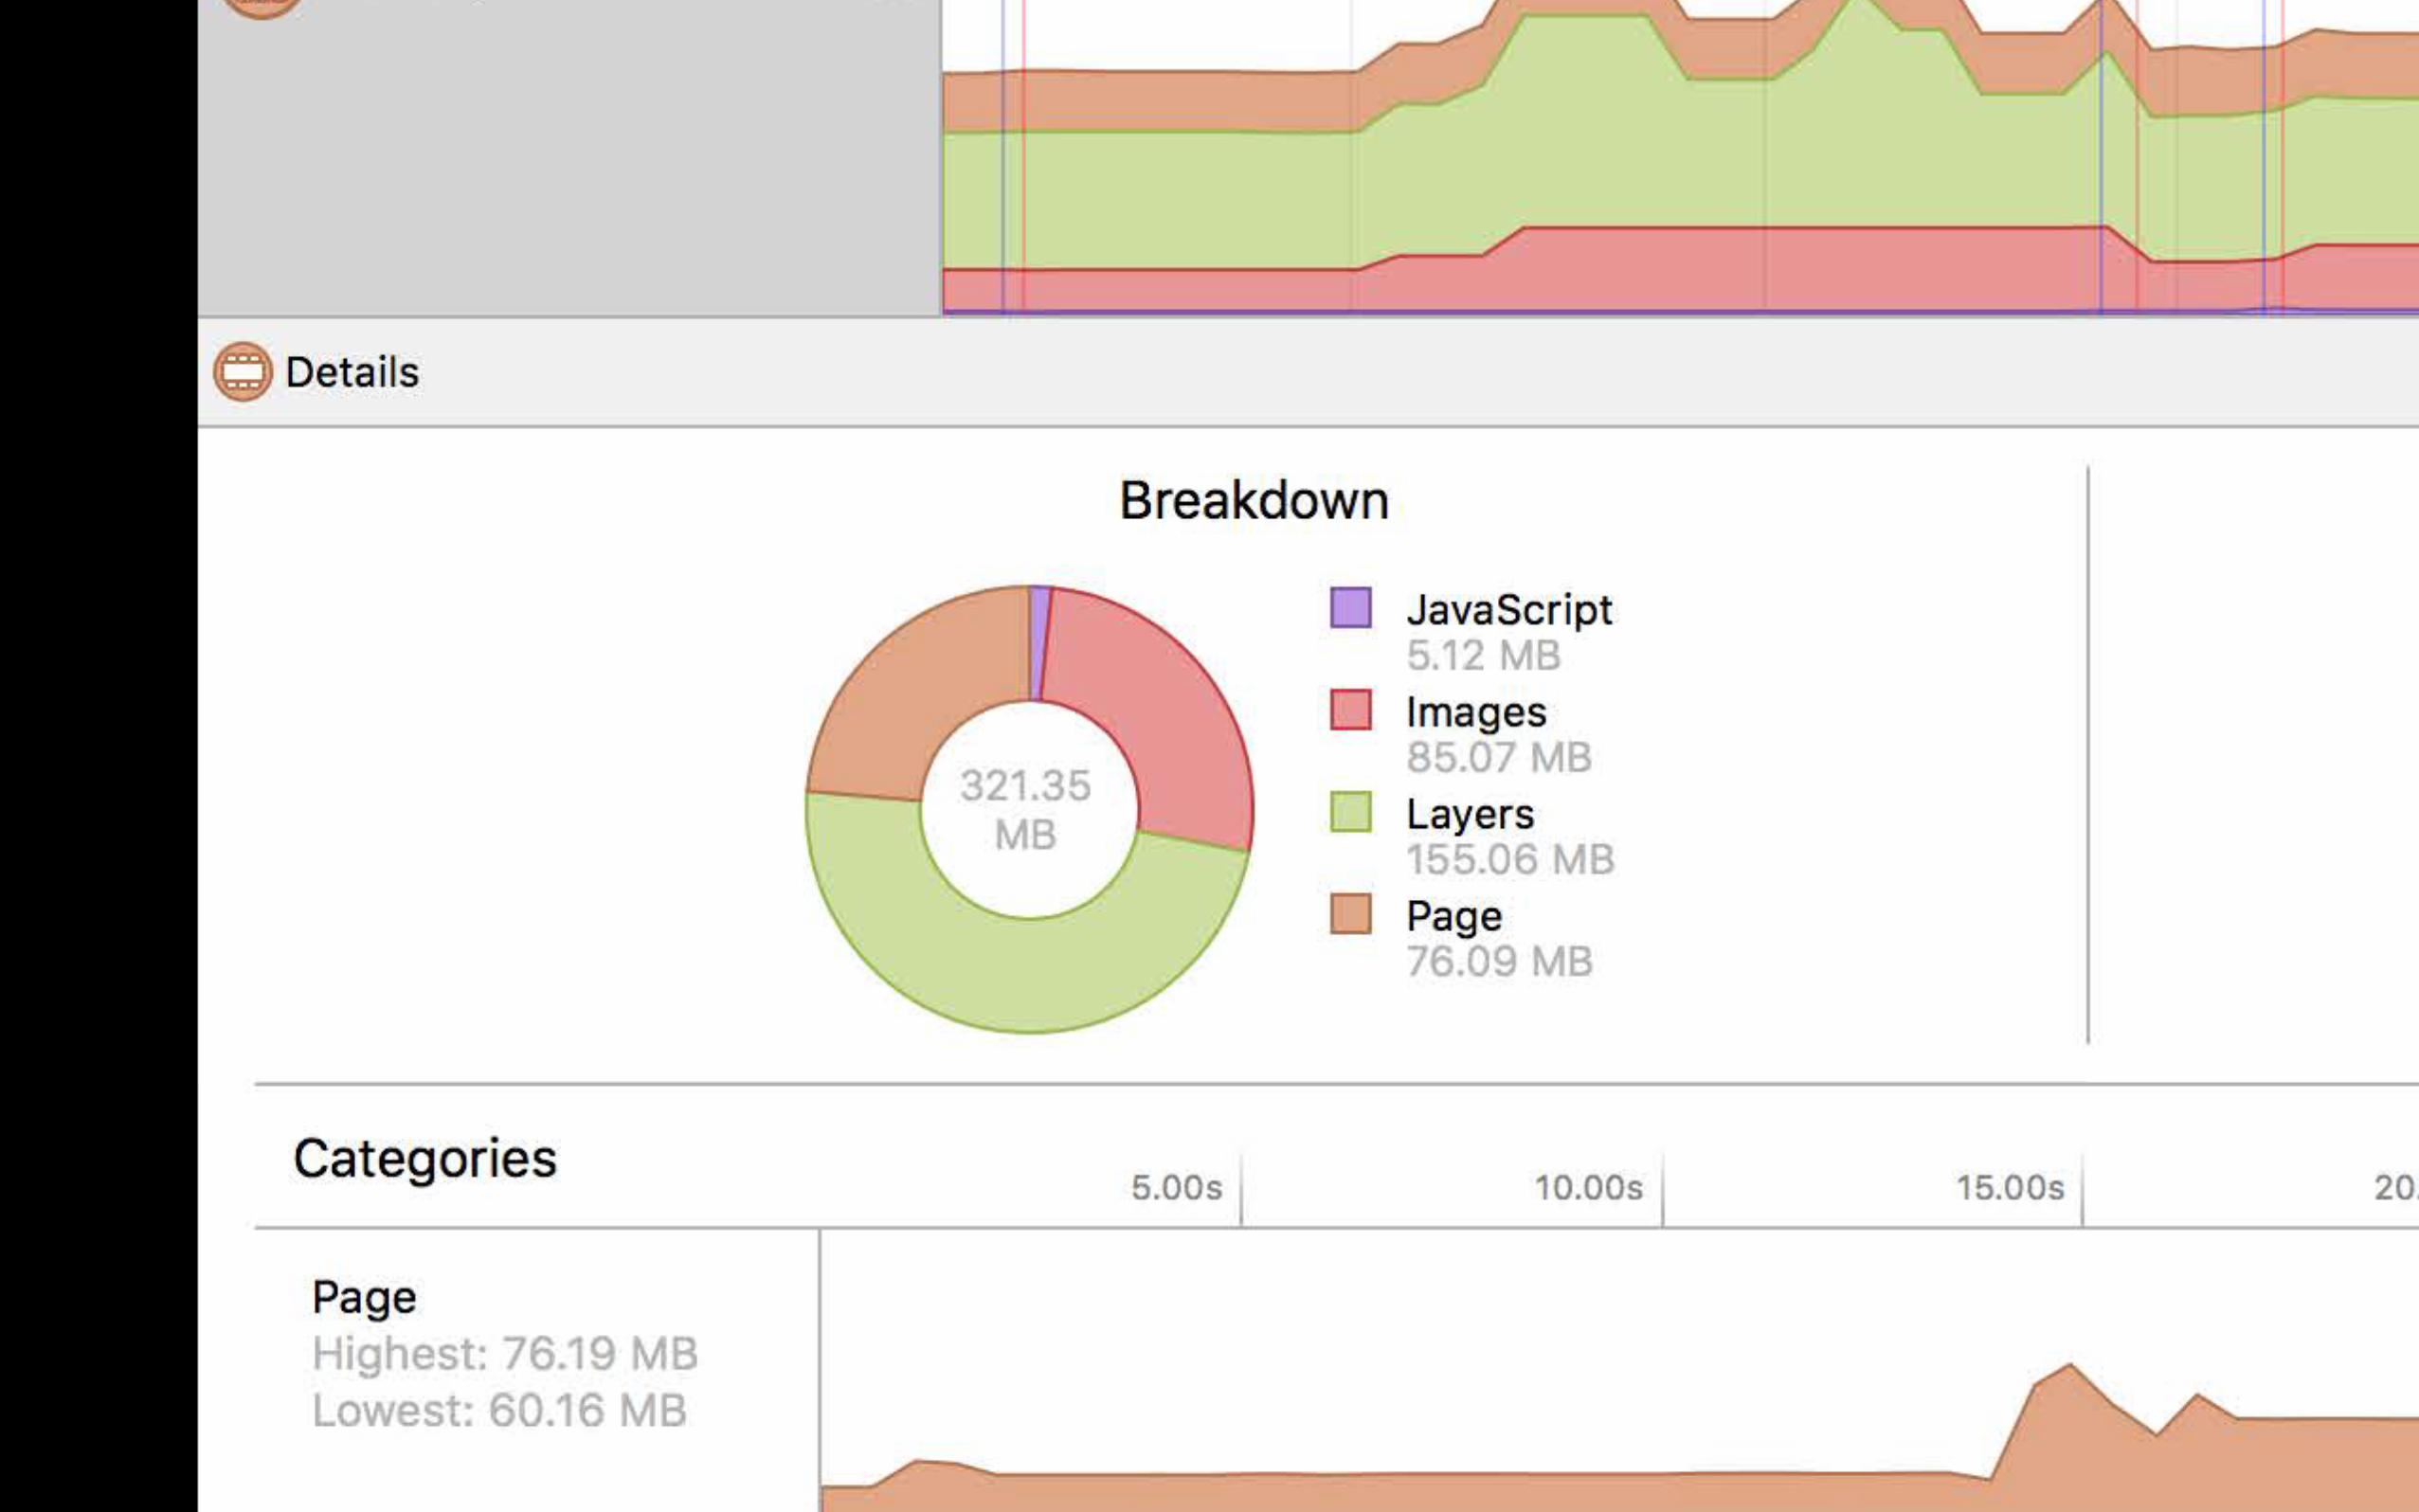
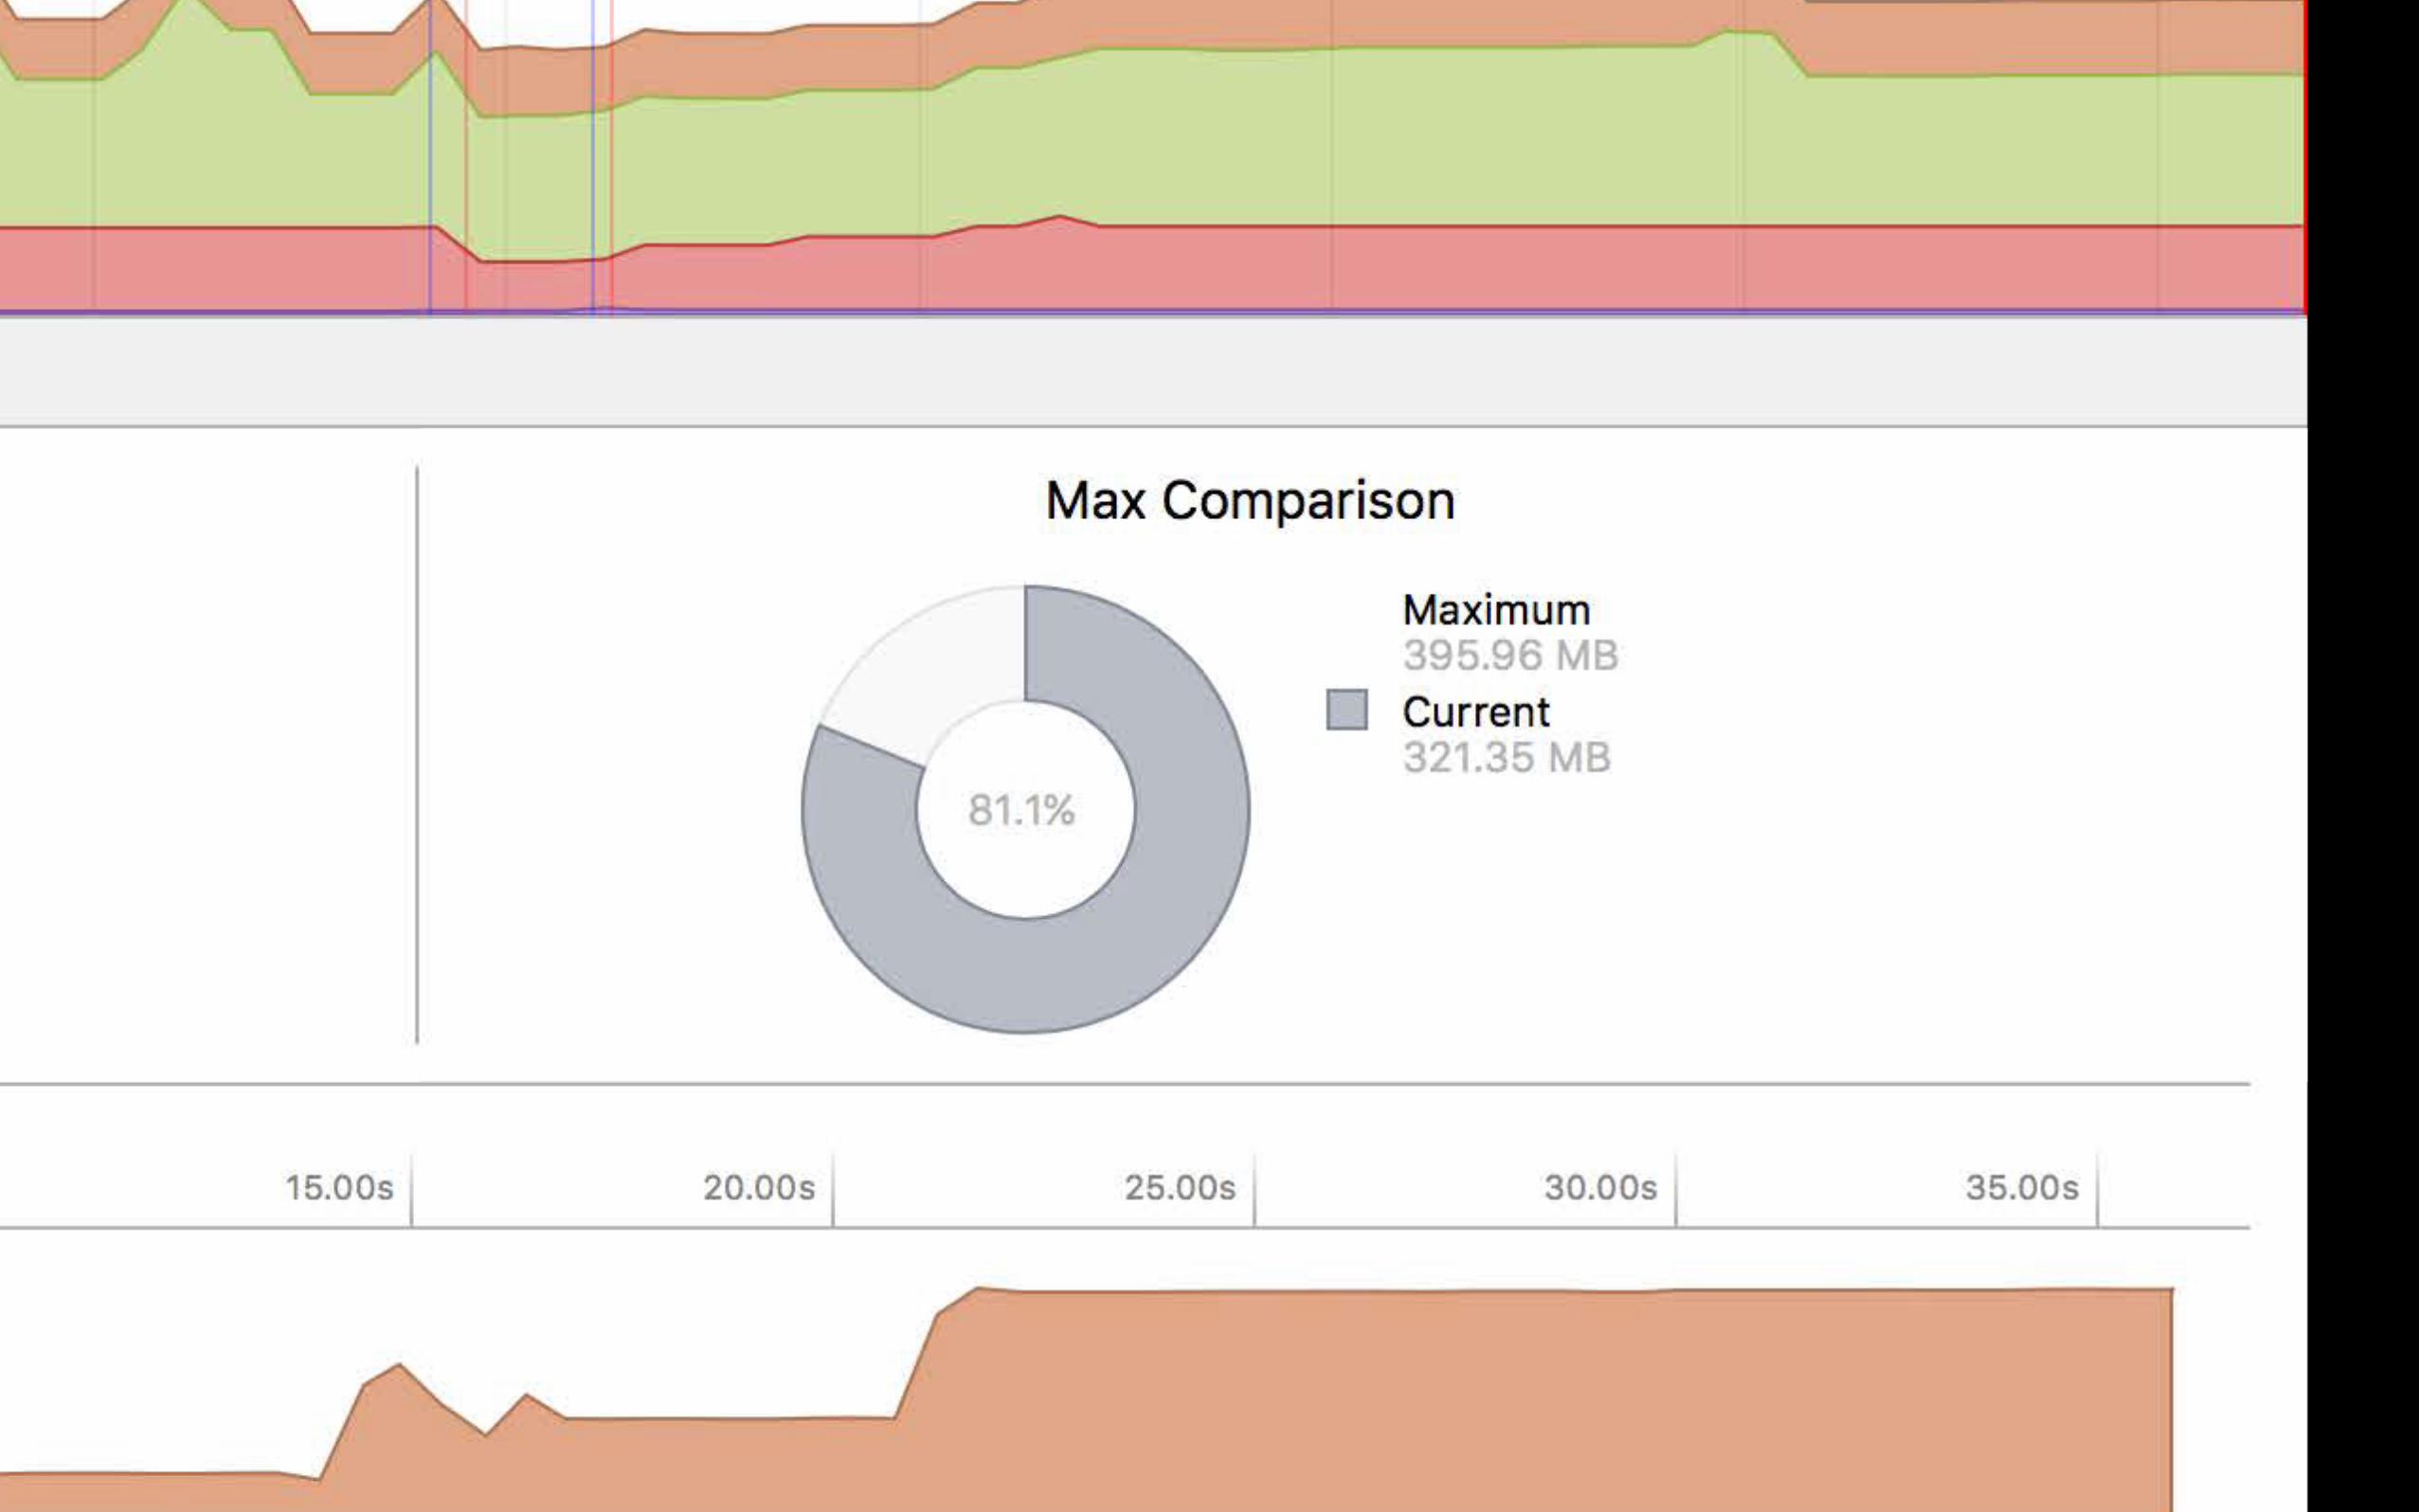
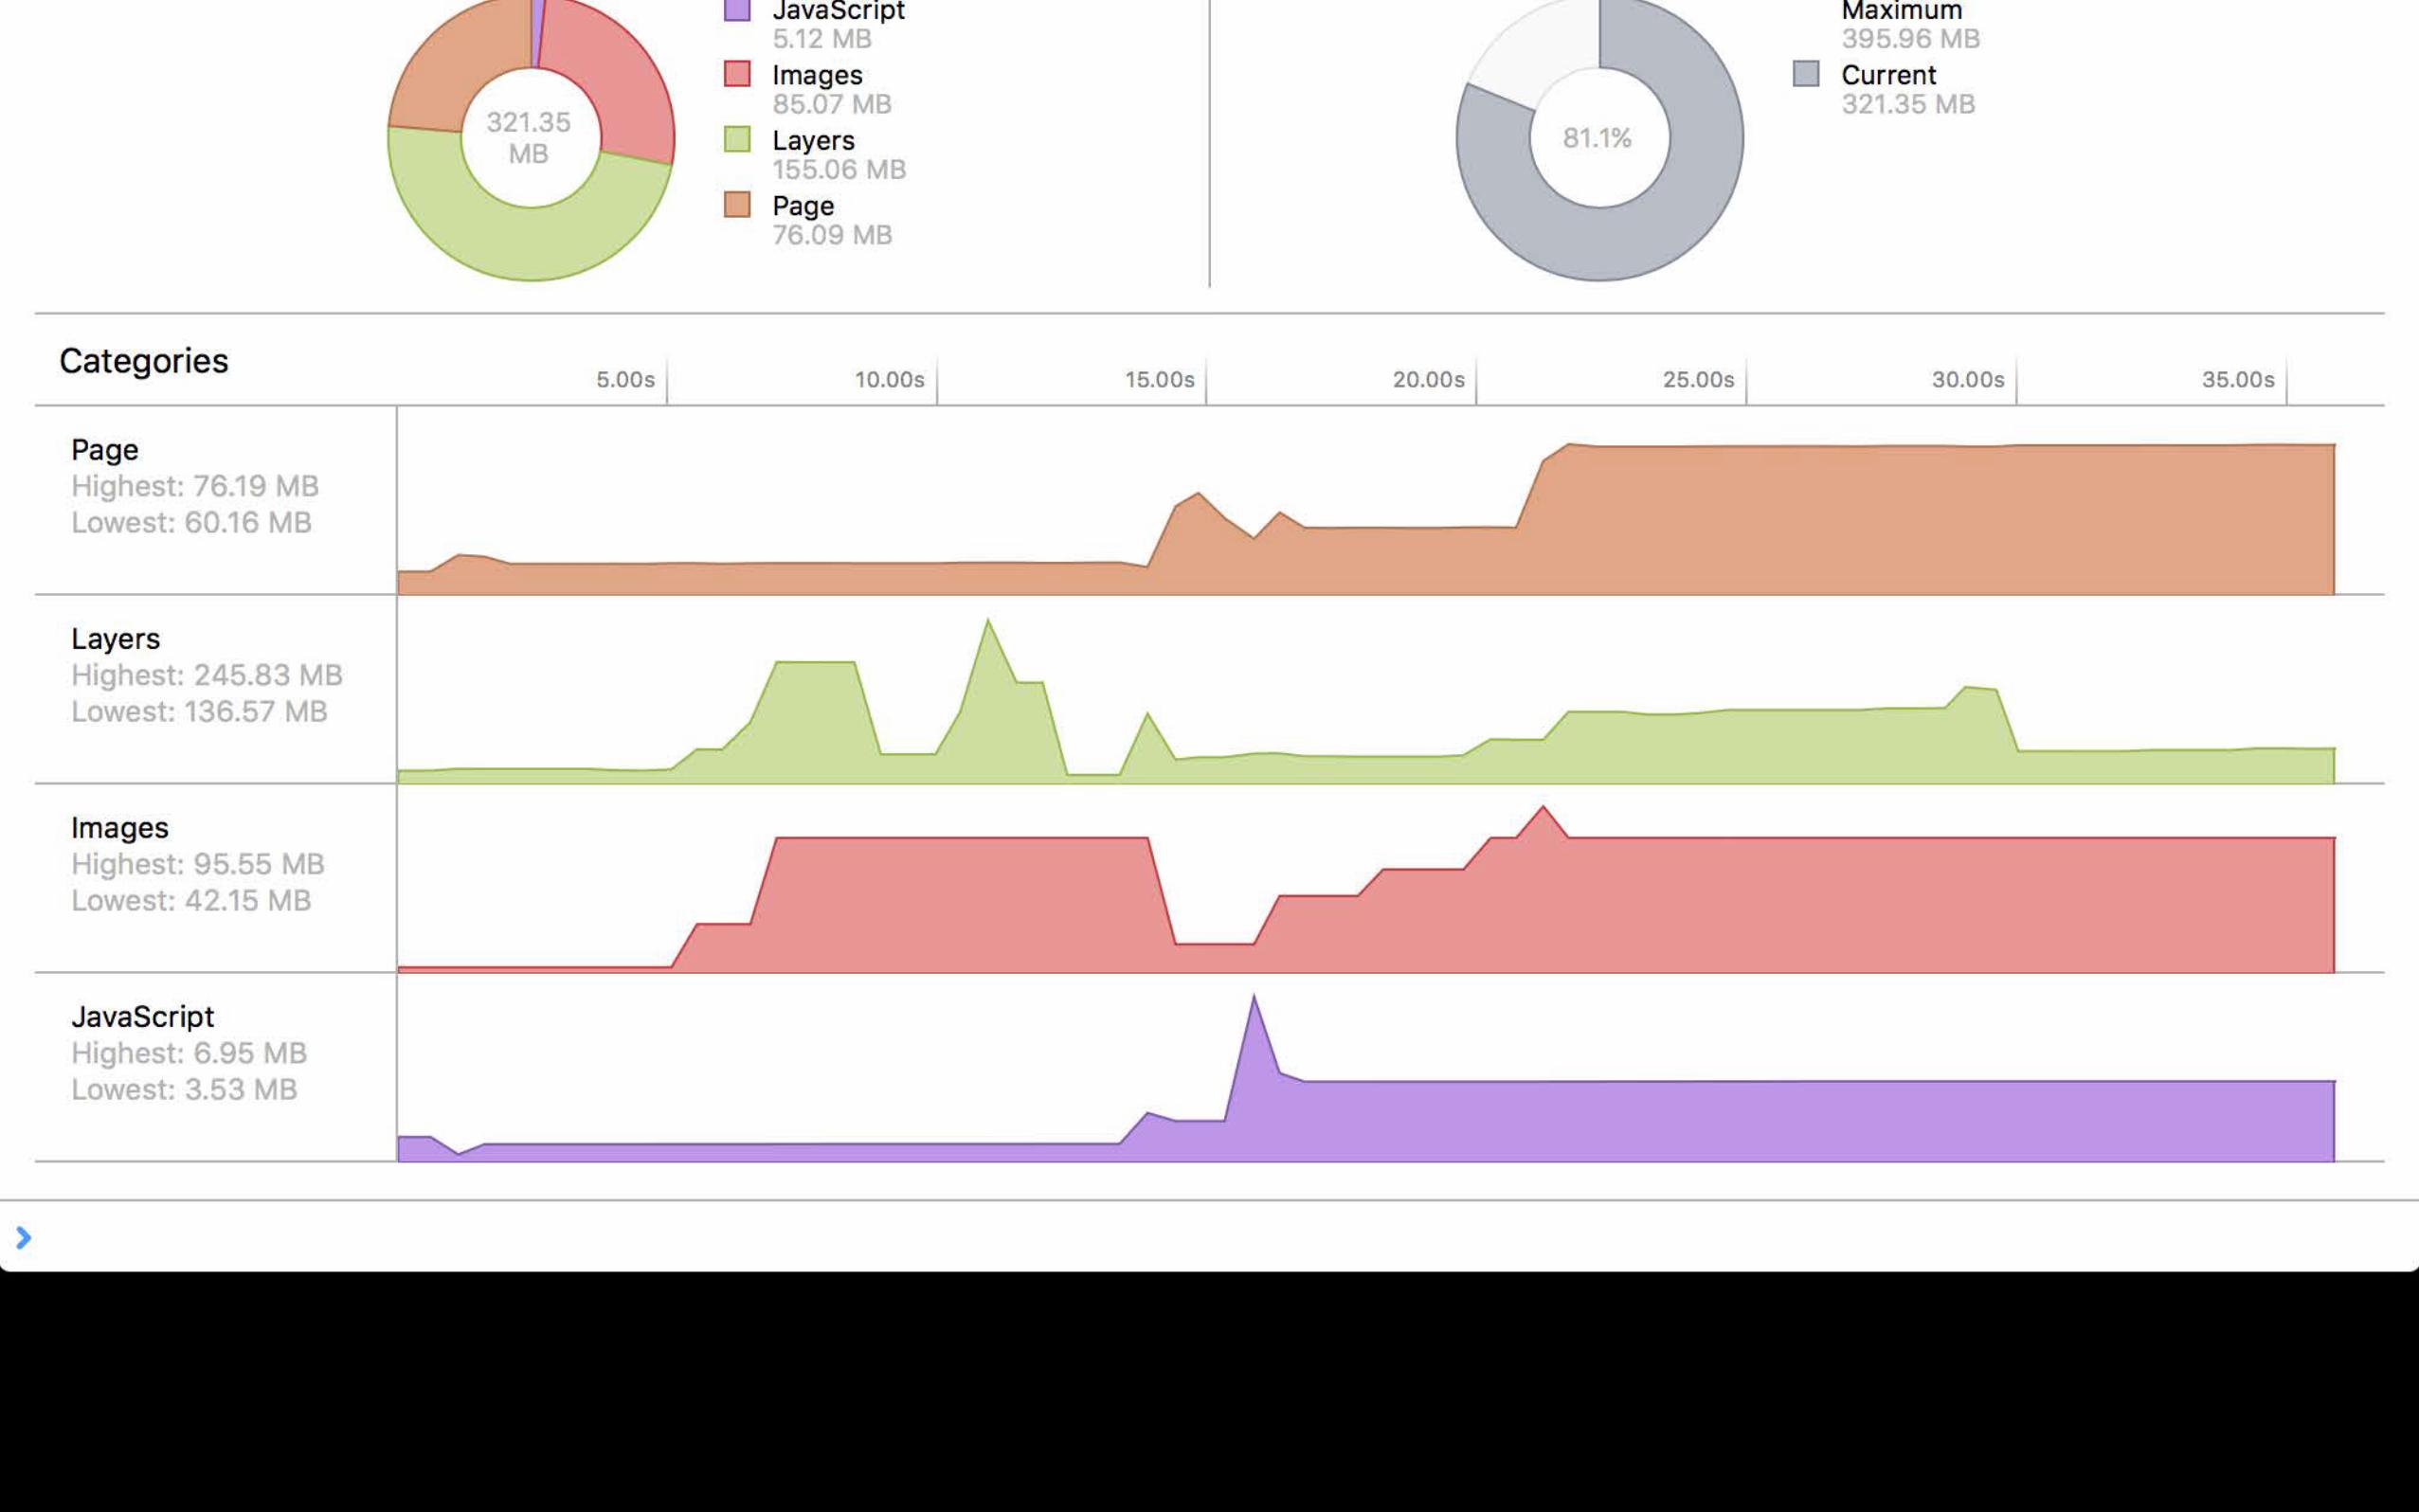
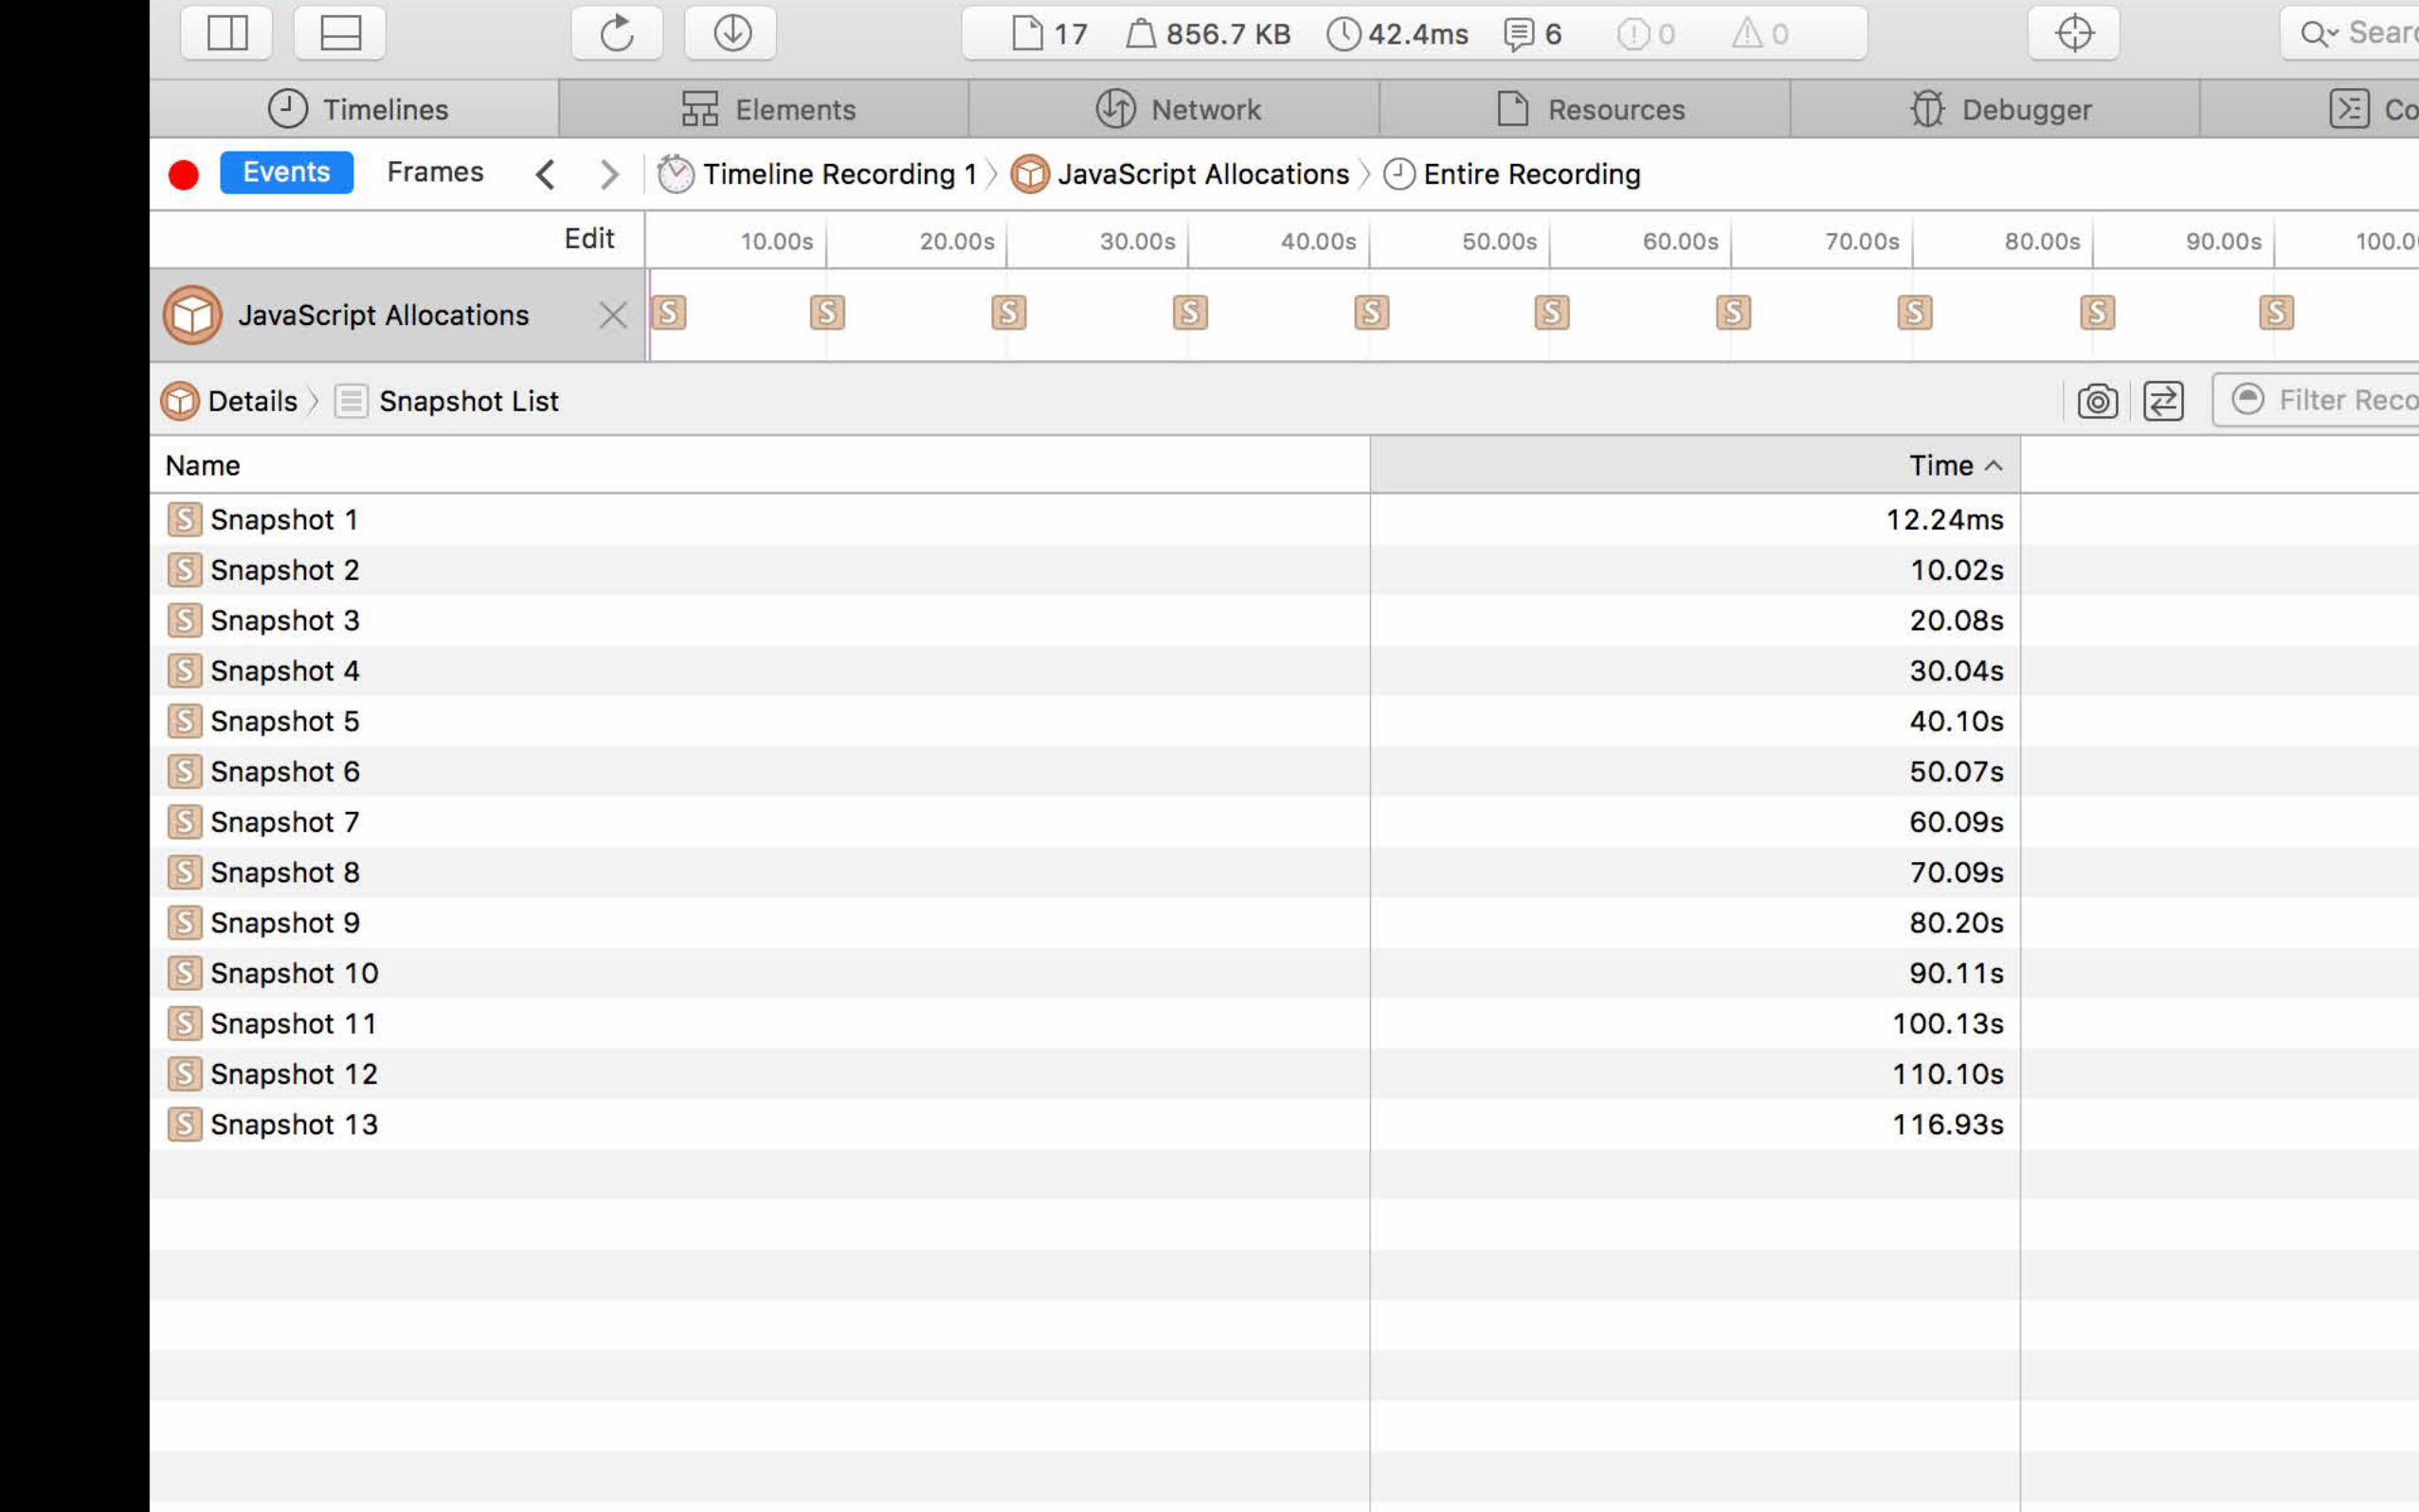
Memory and JavaScript Allocations timelinesAnalyzing Memory
Quickly see memory spikes to investigate
Memory and JavaScript Allocations timelinesAnalyzing Memory
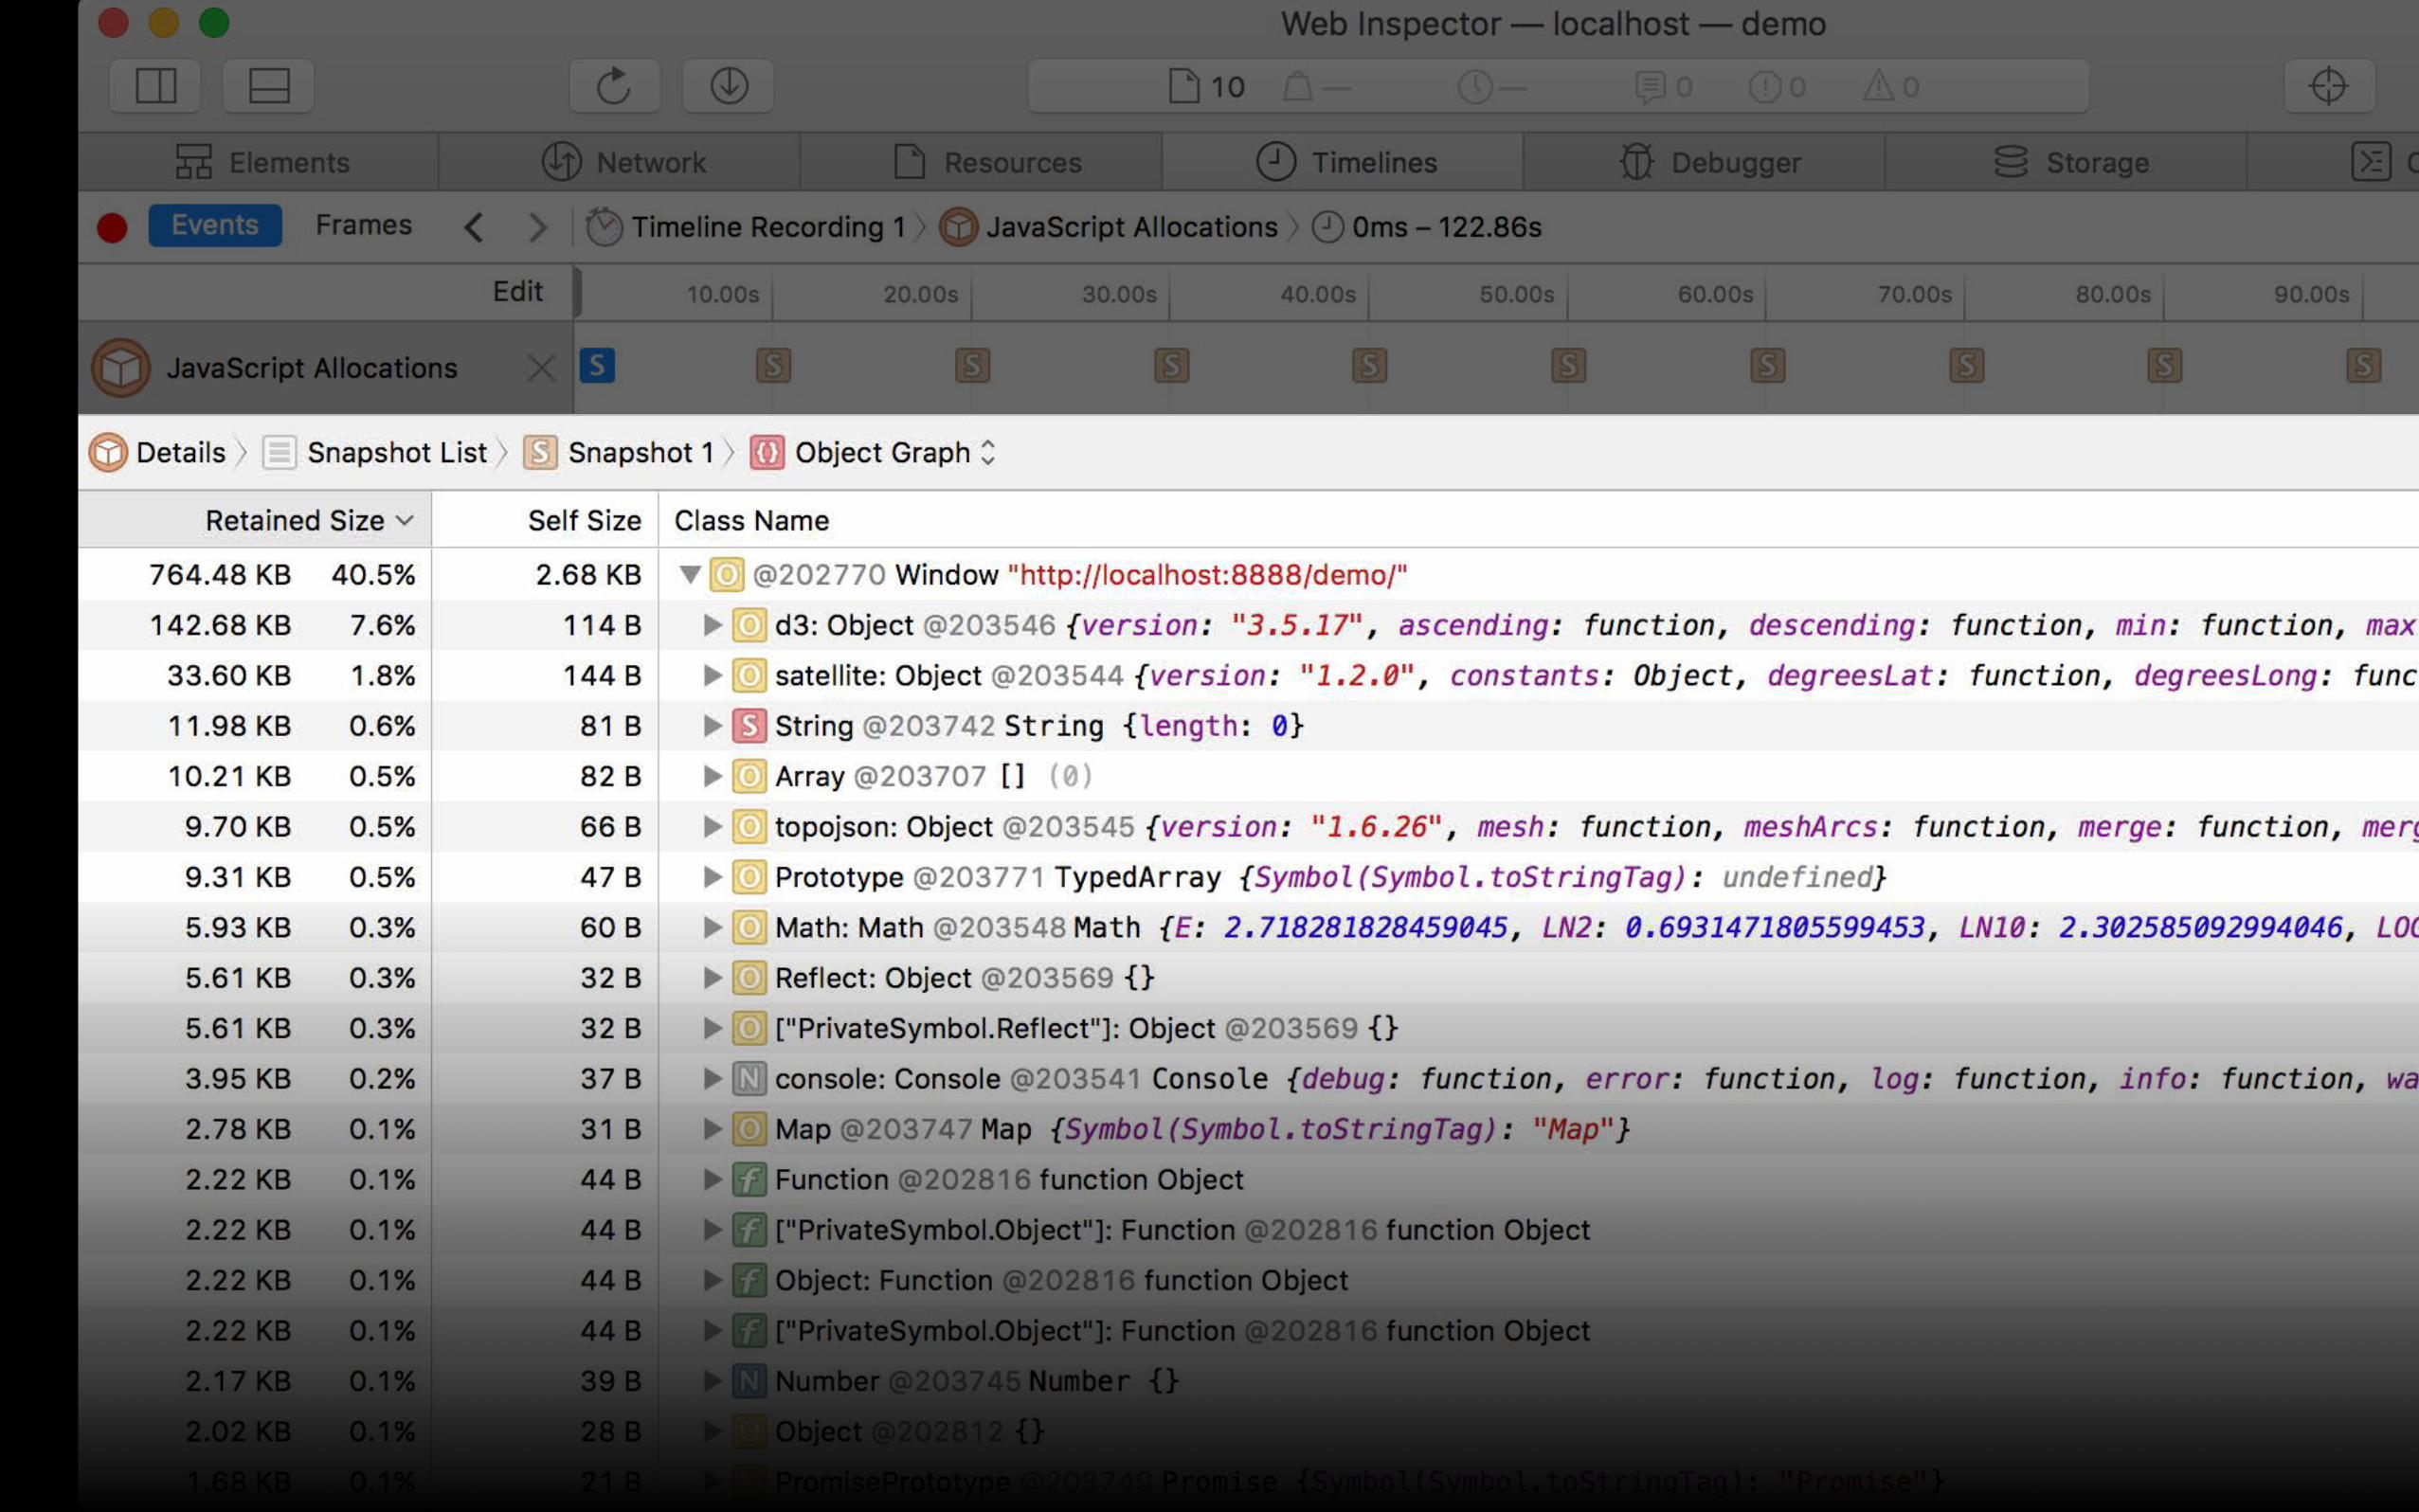
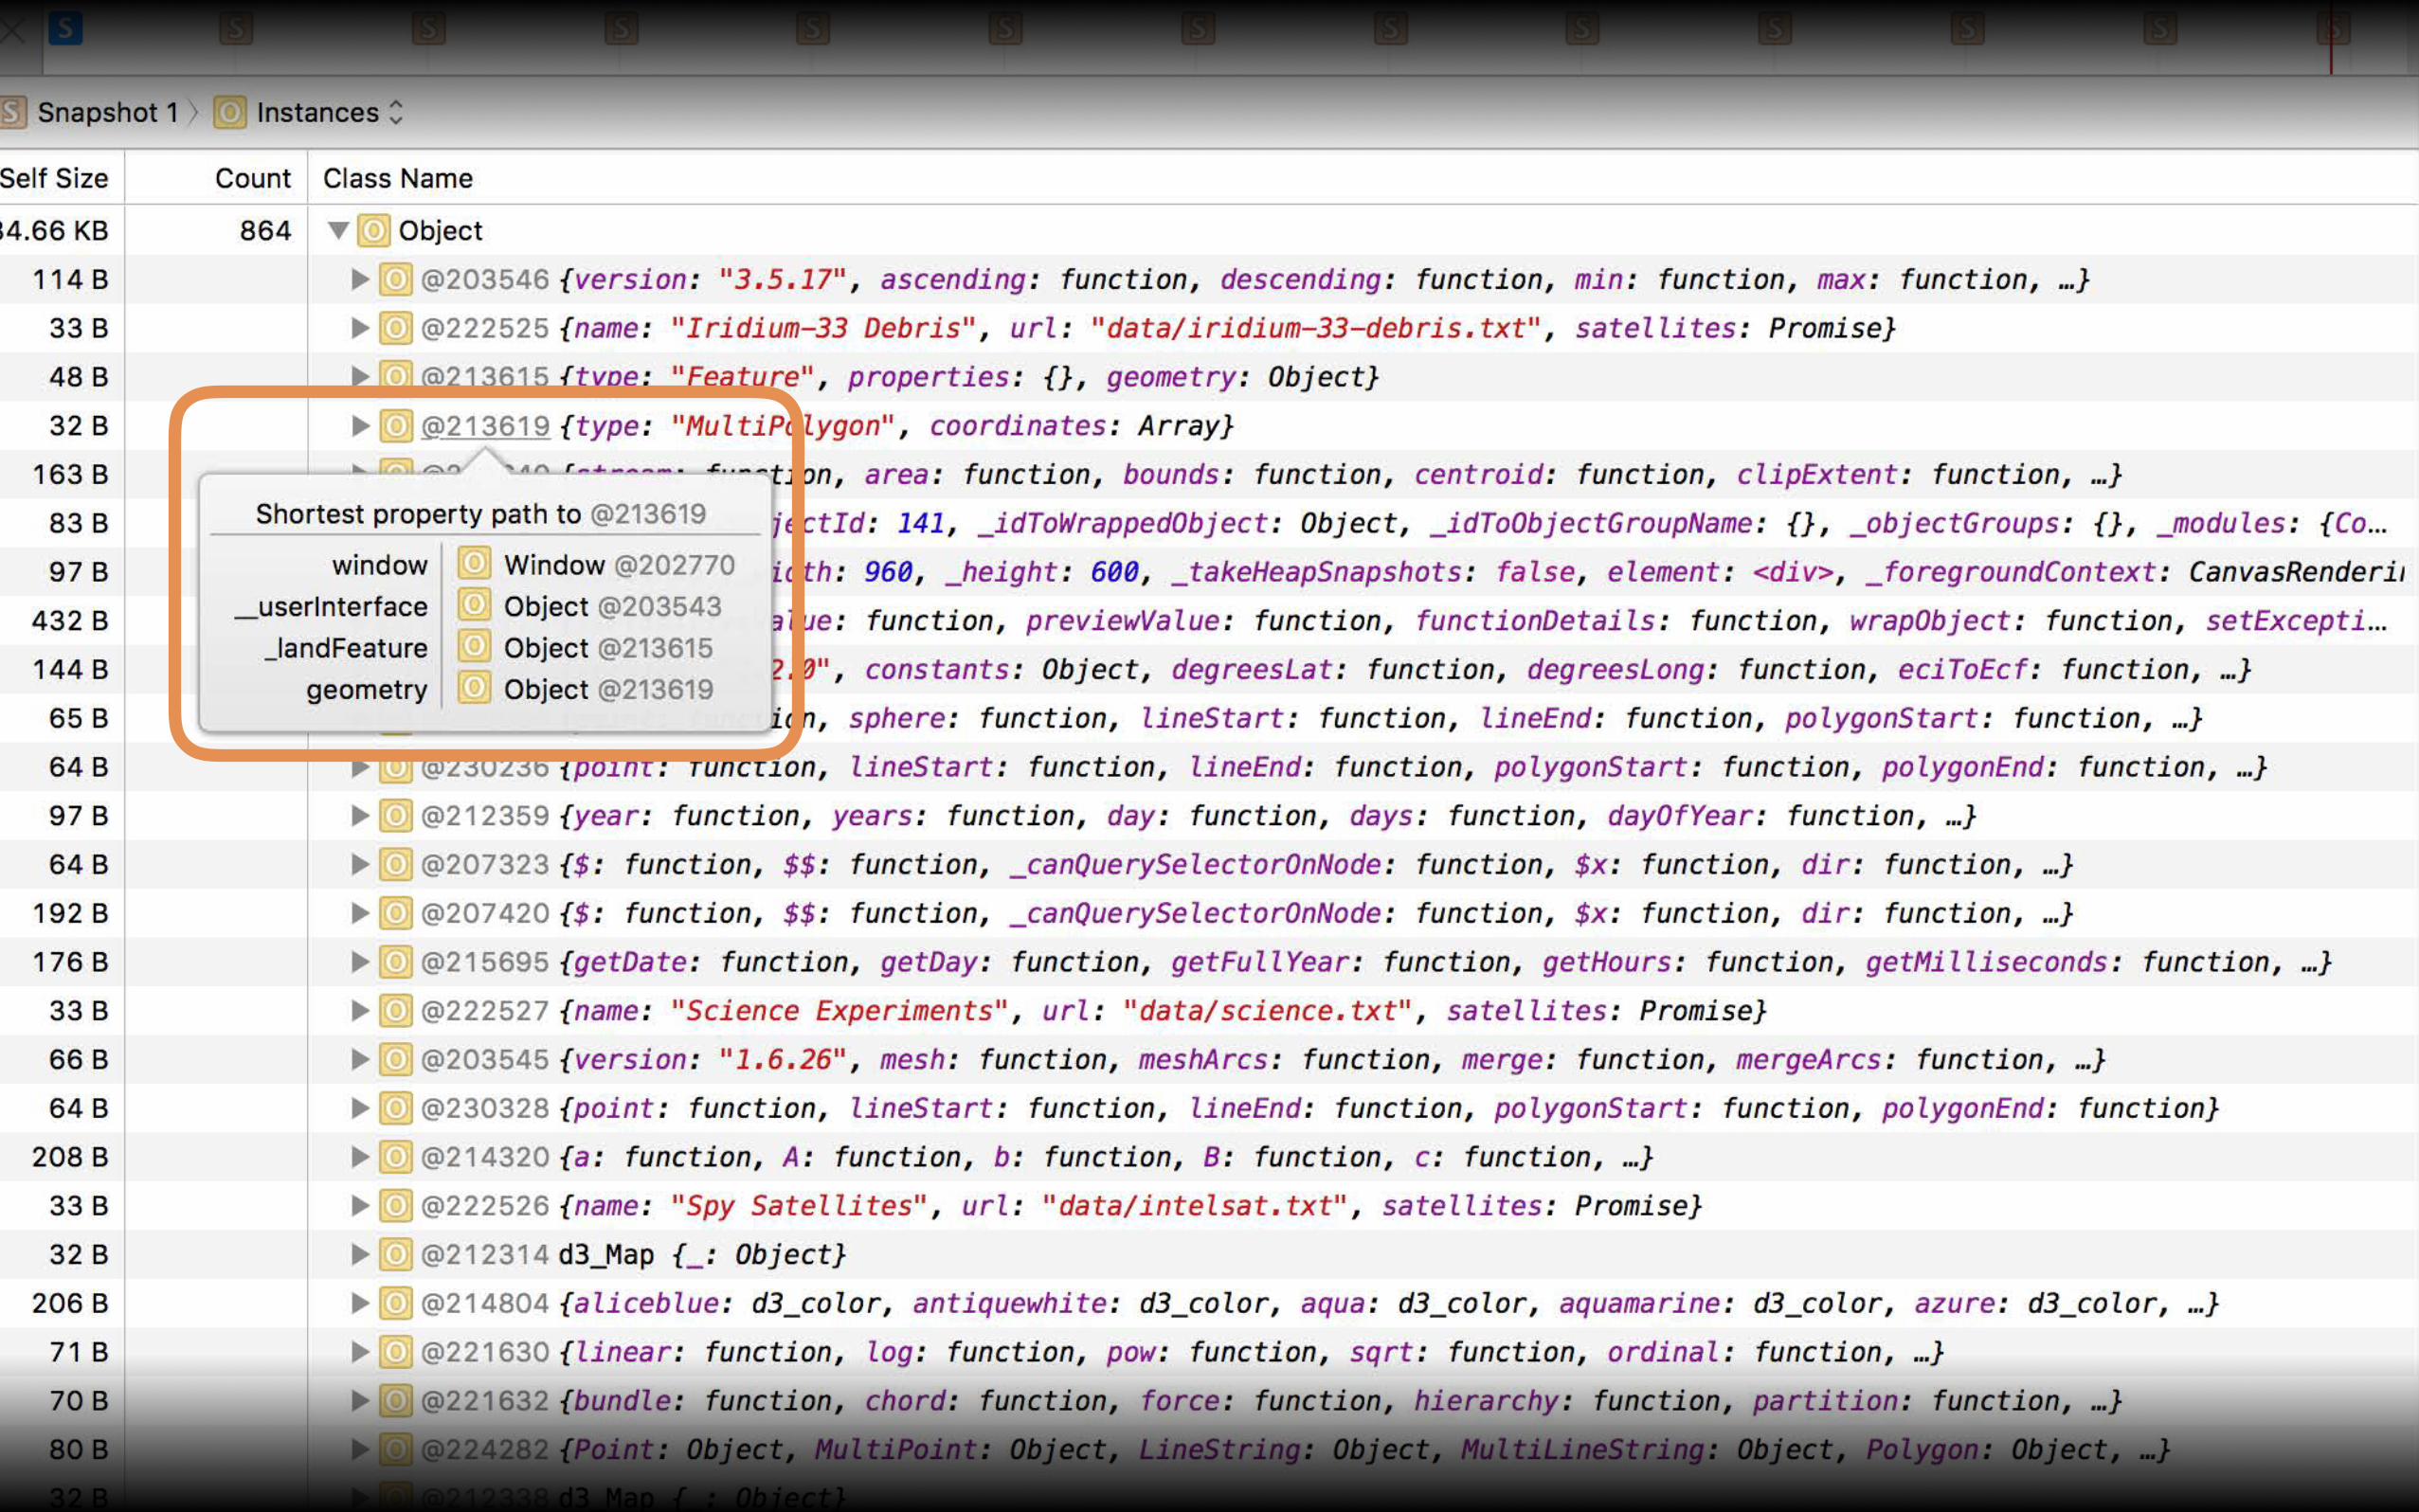
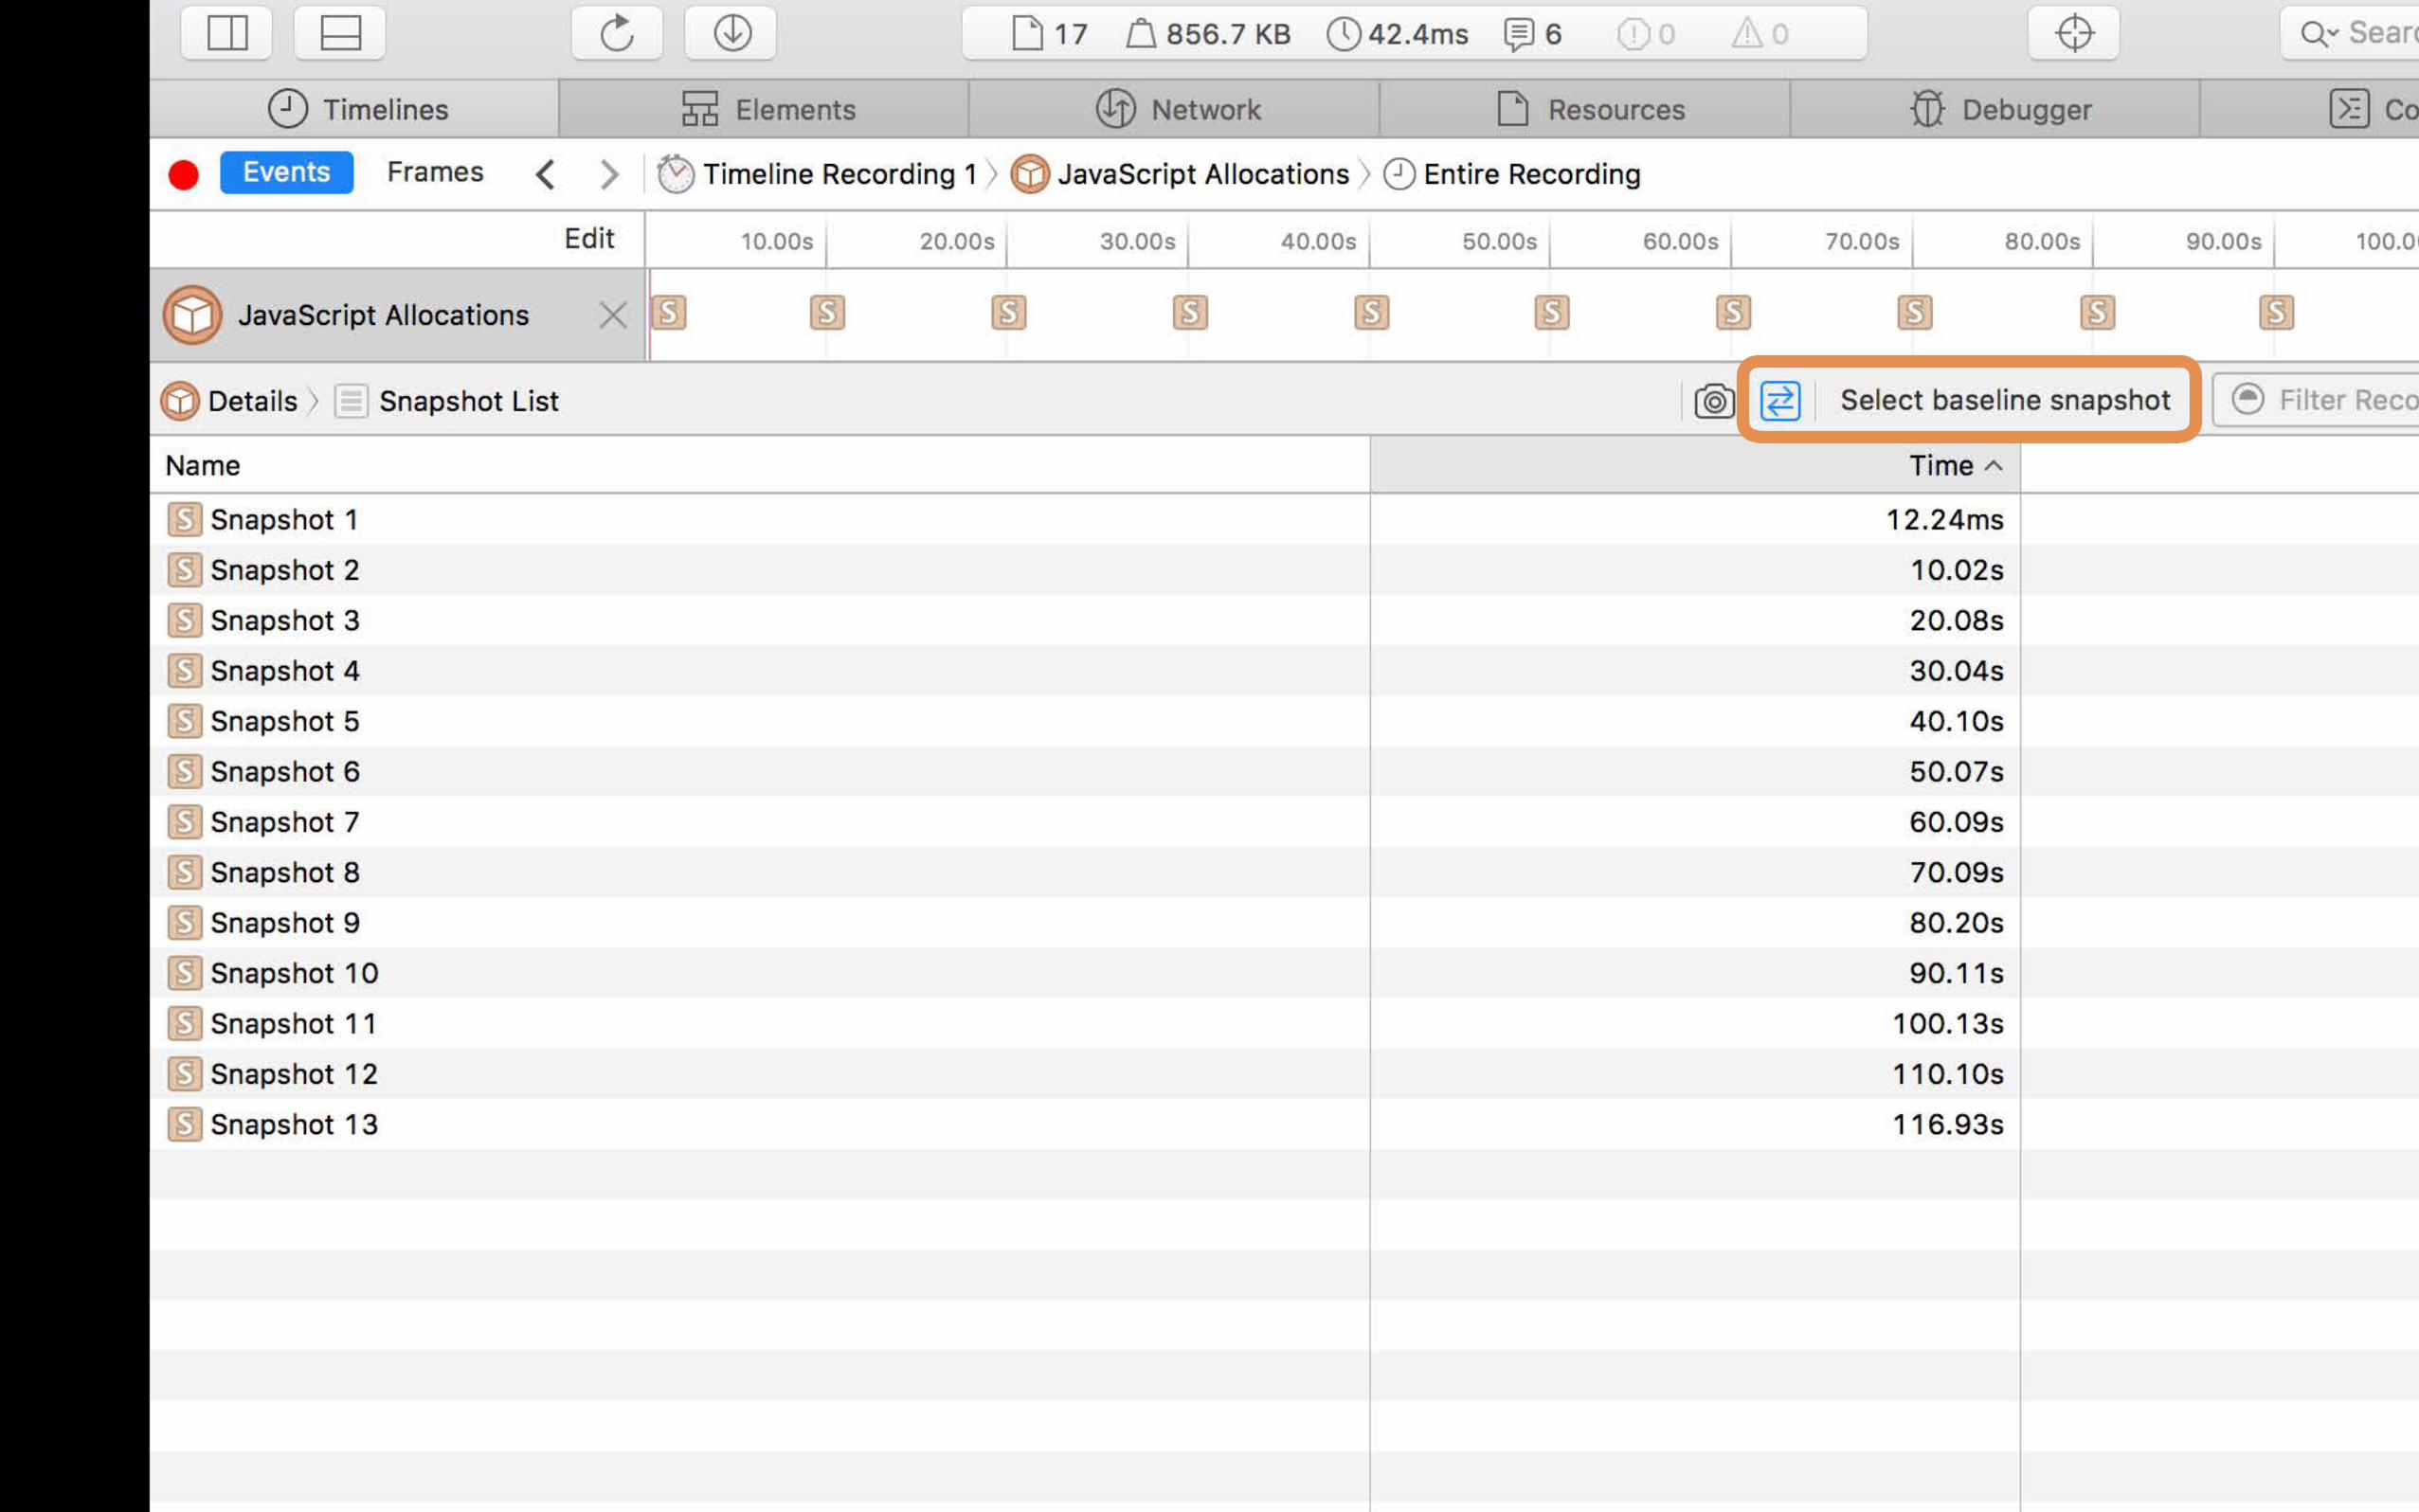
Quickly see memory spikes to investigateTake heap snapshots to explore what keeps objects alive

Memory and JavaScript Allocations timelinesAnalyzing Memory
Quickly see memory spikes to investigateTake heap snapshots to explore what keeps objects aliveDon't leave in console.takeHeapSnapshot()
Memory and JavaScript Allocations timelinesAnalyzing Memory
Quickly see memory spikes to investigateTake heap snapshots to explore what keeps objects aliveDon't leave in console.takeHeapSnapshot()Snapshots can have a performance impact

Connecting Web Inspector
Profiling Javascript
Analyzing Memory

Next Steps
Next Steps
Consider upgrading to WKWebView

Next Steps
Consider upgrading to WKWebViewConnect Web Inspector to your app

Next Steps
Consider upgrading to WKWebViewConnect Web Inspector to your appSave time and deliver great performance

Next Steps
Consider upgrading to WKWebViewConnect Web Inspector to your appSave time and deliver great performanceStay updated on feature development


Web Inspector

NEW

JavaScript Call Trees
Quick Open
Visual Styles Sidebar
Memory Timeline
JavaScript Heap Objects
Sampling Profiler
Compare Heap Snapshots
Tail Call Stacks
Pseudo Elements in DOM Tree
takeHeapSnapshot
NEW


WebKit

WebKit

NEW

Improved IndexedDB
<picture>CSP 2.0
International API
Shadow DOM
WOFF 2.0 100% ES6
WebDriver
CSS Variables Unprefixed CSS Filters
Proper Tail Calls
NEW

WebKit

WebKit.org

Safari

Safari Technology Preview

More Information
https://developer.apple.com/wwdc16/420

Related Sessions
Extending Your App with Safari App Extensions Nob Hill Wednesday 4:00PM
Web Inspector and Modern JavaScript WWDC 2014
Introducing the Modern WebKit API WWDC 2014
What's New in Web Development in WebKit and Safari WWDC 2014
Introducing Safari View Controller WWDC 2015
Using Safari to Deliver and Debug a Responsive Web Design WWDC 2015
Labs
Safari and WebKit Lab Frameworks Lab C Friday 4:30 PM

Related Documents