Stephen Jenner Oslo – 28 th & 29 th September 2017 Managing Benefits Optimizing the Return from Investments A short overview

Welcome message from author
This document is posted to help you gain knowledge. Please leave a comment to let me know what you think about it! Share it to your friends and learn new things together.
Transcript

Stephen Jenner
Oslo – 28th & 29th September 2017
Managing Benefits
Optimizing the Return from Investments
A short overview
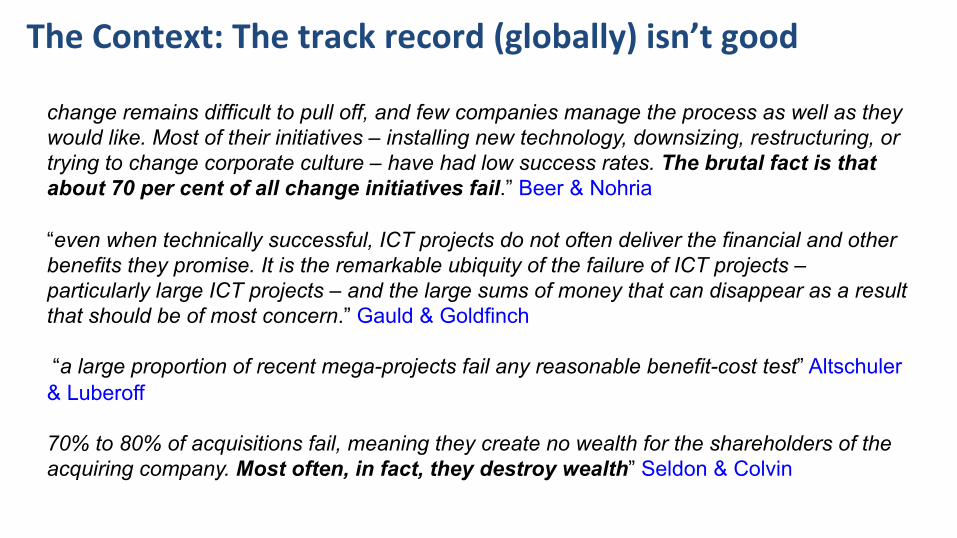
TheContext:Thetrackrecord(globally)isn’tgood
change remains difficult to pull off, and few companies manage the process as well as they would like. Most of their initiatives – installing new technology, downsizing, restructuring, or trying to change corporate culture – have had low success rates. The brutal fact is that about 70 per cent of all change initiatives fail.” Beer & Nohria “even when technically successful, ICT projects do not often deliver the financial and other benefits they promise. It is the remarkable ubiquity of the failure of ICT projects – particularly large ICT projects – and the large sums of money that can disappear as a result that should be of most concern.” Gauld & Goldfinch “a large proportion of recent mega-projects fail any reasonable benefit-cost test” Altschuler & Luberoff 70% to 80% of acquisitions fail, meaning they create no wealth for the shareholders of the acquiring company. Most often, in fact, they destroy wealth” Seldon & Colvin
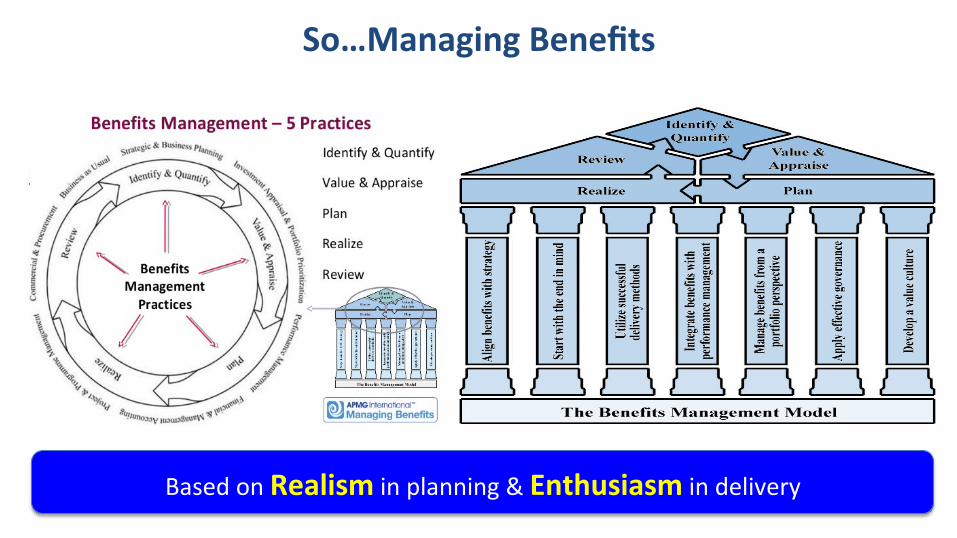
BasedonRealisminplanning&Enthusiasmindelivery
So…ManagingBenefits
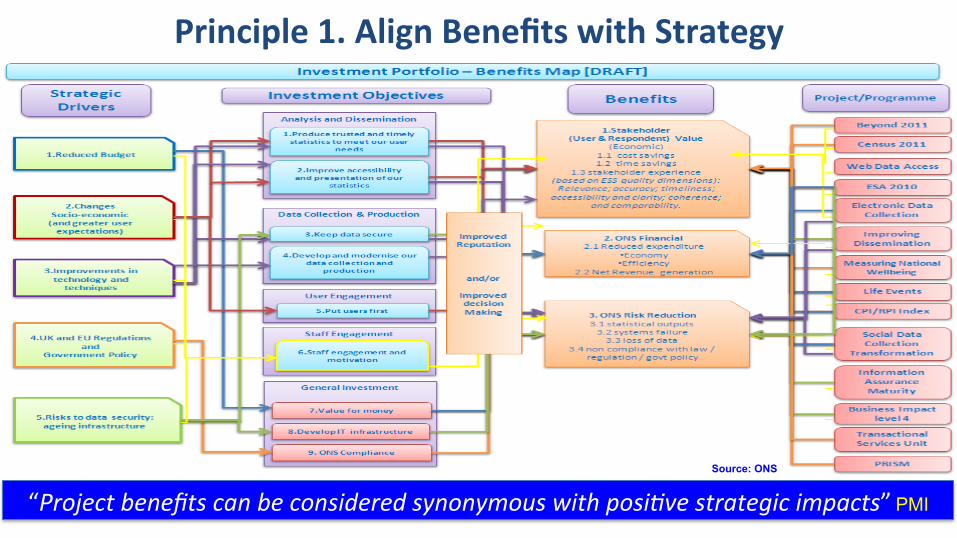
Source: ONS
Principle1.AlignBenefitswithStrategy
“Projectbenefitscanbeconsideredsynonymouswithposi6vestrategicimpacts”PMI
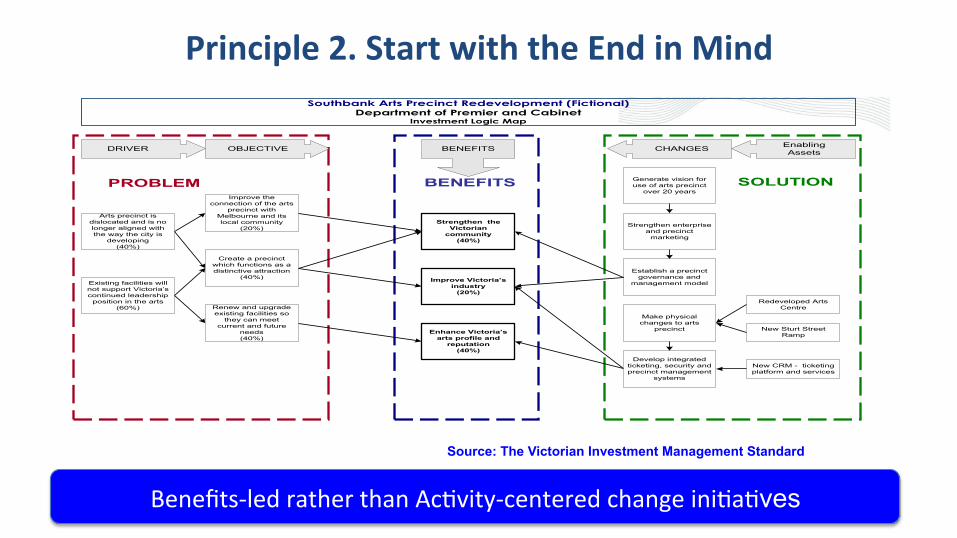
Benefits-ledratherthanAc9vity-centeredchangeini9a9ves
Principle2.StartwiththeEndinMind
BENEFITSPROBLEM SOLUTION
Southbank Arts Precinct Redevelopment (Fictional) Department of Premier and Cabinet
Investment Logic Map
Generate vision for use of arts precinct
over 20 years
Existing facilities will not support Victoria’s continued leadership position in the arts
(60%)
Create a precinct which functions as a distinctive attraction
(40%)
Arts precinct is dislocated and is no longer aligned with the way the city is
developing (40%)
Improve the connection of the arts
precinct with Melbourne and its local community
(20%)
Renew and upgrade existing facilities so
they can meet current and future
needs(40%)
DRIVER EnablingAssetsOBJECTIVE CHANGESBENEFITS
Strengthen enterprise and precinct marketing
Redeveloped Arts Centre
New Sturt Street Ramp
Develop integrated ticketing, security and precinct management
systems
Establish a precinct governance and
management model
Make physical changes to arts
precinct
New CRM - ticketing platform and services
Strengthen the Victorian
community(40%)
Improve Victoria’s industry
(20%)
Enhance Victoria’s arts profile and
reputation (40%)
Source: The Victorian Investment Management Standard

WithmorereliableforecasKng–the‘Howmuch’quesKon
And “the best collective decisions are the product of disagreement and contest, not consensus and compromise.” Surowiecki
• Three point estimating
• Optimism Bias adjustments
• Reference class forecasting
• Challenge

Principle3.UKlizeSuccessfulDeliveryMethods
• Agile • Waterfall • PMBoK • OGC • etc etc
Caveat-Withbenefitsembeddedintheapproach

Principle4.Integratebenefitswiththeperformancemanagementregime–‘booking’thebenefits
Sufiparable:“TrustinGod,buttetheryourcamel.”
Contractsign-offProjectExecutivesign-off: Date:
BenefitOwnersign-off: Date:
BusinessPartnersign-off: Date:
BusinessChangeManagersign-off: Date:
Business Case Development
Measuring & Tracking: Initial Baselining
Project Live Service
Benefits Eligibility Framework
1-Page Summary Benefits Report
CPS Efficiency Plan
DCA Efficiency Plan
HO Efficiency Plan
Measuring & Tracking: Benefits Realisation
Offences Brought To Justice (OBTJ)
Confidence
Victims & Witnesses
Enforcement
Check alignment with BEF e.g. double counting, cost avoidance
If funding approved
Project View of Benefits
Project Benefits Lead and Benefits Realisation Lead agree Efficiency & Effectiveness benefits
Benefit Realisation Leads and Efficiency Planners
agree Efficiency Benefits that contribute to
Departmental Efficiency Plans
Strategic Planners agree Efficiency & Effectiveness Benefits that contribute to
Strategic Targets & priorities
Benefit Realisation Plan: Police
Benefit Realisation Plan: CPS
Benefit Realisation Plan: Courts
Benefits Evidence & Revised Forecast
Benefit Realisation Plan: Corrections
Benefits Contributor
CJIT VMO
Benefits Recipients
Efficiency Planners
Strategic Planners
Financial/Efficiency,Benefits,Valida3on,with,Departmental,
Efficiency,Planners,,
Benefits,Valida3on,with,Departmental,Benefits,
Managers,
Performance/Effec3veness,Benefits,Valida3on,with,Departmental,Strategic,
Planners,,
Source: CJS IT
Source:BristolCityCouncil

FinancialCashableBenefits FinancialNon-CashableBenefits?
“We were survivors, dwellers forever in the cracks of the vast organisational chart. Disperse us, downsize us, squash us,
transfer us, and we will reassemble someday, somewhere, to once again build new layers of redundancy, waste, and glaring
irrelevance.” Lerner
Andbeclearaboutthebenefitsyouarebuying

Benefit Drivers Benefit Classification Measurement Measurement Plan
2013 – June 2016
Operational Cost Savings Effort / Cost Saving
Actual 87,461,000 Baseline 71,246,252
71,246,252
87,461,000
0
20,000,000
40,000,000
60,000,000
80,000,000
100,000,000
78%Target119%Actual
Status
ProjectROI
71,246,252Target
87,461,000Actual
Status
TotalBenefits
Baseline
BusinessUnit:JabelAliCustomsProjectName:AdvancedContainerScanningProjectOverview:EfficientandtroublefreescanningoperaQonoftheimportedandexportedcontainers.TotalInvestment:AED40,000,000
BenefitDriverCumulaQveAnalysis
Actual
2013 2014 2015 2016
20,199,726 20,320,92420,442,849
10,282,753
22,000,00024,200,000
26,620,000
14,641,000
0
5000000
10000000
15000000
20000000
25000000
30000000
BenefitDriverYearly(TargetvsActual)
Year Baseline Actual
BACKTOQUADRANTBACKTODASHBOARD
0
40
80 120
160
200
240
Benefit Achieved
123%
DETAILEDANALYSIS
Principle5.ManagebenefitsfromaPor[olioperspecKve
Source: Dubai Customs
SR2004 CSR07 10 Year TotalQuality of
Benefit Forecast
Scale of Benefits Forecast
Quality ofRealisation
PlanningLikelihood ofRealisation
Confidence Victims and Witnesses OBTJ Enforcement Re-offending Public
protection Q1 03/04 - Q1 06/07 2006/07 2007/08
NSPIS Custody & Case Prep 79.08 249.50 348.06 g AMBER GREEN AMBER AMBER M D D M M TBC Realised Plan ActualPentiP 0.00 0.00 0.00 i 14.06- RED GREEN RED RED M M HD HD M TBC Efficiency Cashable - - - 0.39 0.71 COMPASS CMS (50%) 10.95 25.83 52.75 g 0 GREEN AMBER GREEN AMBER D D HD M M TBC Efficiency Opportunity 6.57 2.69 1.62 26.14 50.11 NWNJ IT tool (WMS) 5.70 12.51 25.02 g GREEN GREEN GREEN AMBER D D D TBC Effectiveness 0.26 0.24 - 0.96 1.21 SOCA 0.61 1.62 3.43 g GREEN GREEN GREEN GREEN M M M TBC Total 6.83 2.93 1.62 27.493 52.03 Libra application (incl Exchange 3a) 19.55 92.67 144.99 i 9.32- GREEN RED AMBER AMBER M D D D M TBC
OASys 79.52 124.24 239.12 g GREEN GREEN GREEN GREEN D M M HD TBCQ1 03/04 - Q1
06/07 2006/07 2007/08NOMIS (70%) 3.70 57.65 164.92 h 2.59 GREEN GREEN GREEN GREEN M M M D D TBC Realised Plan ActualViSOR 0.39 2.46 5.54 g 0.54- AMBER RED RED AMBER D M M M M TBC Efficiency Cashable - - - - - CJSE Release 1a (NSPIS-CMS) 1.63 11.06 17.88 g GREEN GREEN GREEN AMBER D M TBC Efficiency Opportunity 38.78 8.88 7.38 35.50 39.04 CJSE Release 1b (NSPIS - Libra) 0.39 8.98 16.79 i 20.50- RED AMBER AMBER AMBER TBC TBC TBC TBC TBC TBC Effectiveness 0.25 0.39 0.12 1.56 2.82 XHIBIT/CJSE Release 2a&b (Portal) 13.44 17.12 34.85 h 13.71 AMBER RED GREEN AMBER HD D D M TBC Total 39.03 9.27 7.50 37.06 41.86 PROGRESS 1.38 13.25 25.40 i 0.64- GREEN GREEN GREEN GREEN TBC TBC TBC TBC TBC TBC
Secure Email/Emailing Securely 1.49 2.55 4.78 g 0.00 AMBER RED AMBER AMBER M M M M M TBCQ1 03/04 - Q1
06/07 2006/07 2007/08CJSE Release 3a (Libra/DVLA) 0.00 0.01 0.02 g AMBER AMBER AMBER M M Realised Plan ActualCJSE Release 3b (NSPIS/DVLA) 1.10 2.84 6.07 g GREEN GREEN AMBER M M Efficiency Cashable - - - 2.15 17.40 COMPASS infrastructure (50%) 85.95 125.83 252.75 g 0.01 see COMPASS CMS Efficiency Opportunity 4.08 0.53 1.15 4.48 3.21
Libra enabled (Enforcement Initiatives) 13.44 12.88 35.74 i 59.8- see LIBRA application Effectiveness - 0.34 - 2.54 4.42 NOMIS infrastructure (30%) 1.58 24.71 70.68 h 1.11 Total 4.08 0.87 1.15 9.16 25.03 OMNI infrastructure 1.03 3.83 6.48 g 0.00 OMNI cost effectiveness 0.00 9.36 36.37 g 0.00
LINK enabled (ETMP xCJS model) 8.68 15.55 28.49 gQ1 03/04 - Q1
06/07 2006/07 2007/08
Shared Access 5.20 10.40 23.40 i 0.65- Realised Plan ActualEquip direct 16.50 22.00 55.00 g Efficiency Cashable - - - - - Equip enabled (Phoenix) 41.41 179.85 311.00 g Efficiency Opportunity 30.03 5.68 3.26 16.75 22.62
Combined Effectiveness Impact 10.17 31.11 53.49 h 7.95 D D HD M Effectiveness 16.90 5.26 5.15 23.75 23.99 Social Value Benefits 15.78 107.12 249.86 i 41.35- Total 46.93 10.94 8.41 40.50 46.61
418.66 1,164.93 2,212.87 i 121.49- 1,215.13
203.87 Q1 03/04 - Q1
06/07 2006/07 2007/08
2003-04 2003-05 2003-06 2003-07 2003-08Benefits as % of
Cost Realised Plan Actual57.09 90.37 143.99 184.62 202.72 Efficiency Cashable - - - - - 0.53 1.63 5.21 32.71 84.74 Efficiency Opportunity 0.16 0.05 0.046 0.210 0.373
- - - - Effectiveness - - - - - 0.53 1.63 5.21 32.71 84.74 42% Total 0.16 0.050 0.046 0.21 0.37
111.21 194.71 270.55 409.69 521.21 5.50 15.38 38.64 79.35 126.34 - 8.55 10.12 19.22 49.96 Q4 05/06 Q1 06/07
5.50 23.93 48.75 98.57 176.30 34% No. % No. %25.05 58.82 97.87 132.70 170.63 2 2% 9 9%
- 2.05 31.53 68.59 110.45 35 36% 23 24%- 2.05 31.53 68.59 110.45 65% 19 20% 19 20%
154.55 283.61 426.40 512.40 585.28 41 42% 44 46%- 0.30 2.93 12.10 37.12
3.10 6.36 15.04 21.50 28.48 3.10 6.66 17.97 33.60 65.60 11%
Ring Fence actuals from 2003-06 and Delivery Plan RF budget from 2006-08. Full benefits by recipient used. Corrections includes YJB.
Impact Probability Severity
1
2
3
4
Source: BE&RF report Q1 2006/07 Approved by the BWG 10/08/2006
Prog
Direct BenefitsEnabled Benefits
CJS IT Application IRR Ring Fence only 11.4%
NOTE: Benefits shown only include quantified, validated benefits but other enabled benefits have been identified and will be included as further work is undertaken. This includes 1. Projects provisionally
included in the portfolio that are still being scoped i.e. YJB ICT and BR7 2. Projects in the process of bidding for funding i.e. NES 3. Applications
within the exchange or CJO pipeline which run off CJS IT funded infrastructure
Benefit on track/ahead of scheduleBenefit not yet due for realisation
Benefit behind scheduleDifficulty with tracking/measure.
RAG of Benefits in SR2004 Benefits Realisation Plans
Forecast
2006/07 Q1
Variance Q4-Q1
Forecast Benefit Values (£'m)
1. Settlement Letter Conditions/Hurdle rates 2. Root Cause Model 3. Social Value Research 4. Analysis of benefits enabled by CJS IT funded infrastructure
1. Quarterly Benefits Integrity Check 2. Benefits Eligibility Framework
Risk Description
Scale of CJS IT benefits forecast is less than expected
Inf
rast
ruct
ure
Summary of Key Mitigating Actions
Total Police Benefits
TOTAL BENEFITS
CJS IT programme does not adjust to changes in strategic and political priorities
Total 10 year CJS IT Application benefits Ring Fence only
CJS IT Application NPV Ring Fence only (£'m)
Quality of CJS IT benefits forecast is not robust and realisable
Risk Register - CJS IT Benefits Management
Cost Benefit Analysis3
Total Police RF Cost/Budget
Based on Proving Model assessments completed March 2005. These will be refreshed to reflect latest business cases in due course. CEI line is signed off by Strand Board leads.
Total Corrections RF Cost/Budget
1.Biannual portfolio prioritisation, 2. strand board BRPs signed off by strandbaord leads, 3. 6 monthly ministerial approved delivery plan.
CJS IT BENEFITS SCORECARD Q1 2006/07 (Aug 2006)
App
licat
ions
CJS IT ProjectsBenefits Maturity Self Assessment
Forecast
Benefits Rating
2006/07 Q1
YJB Benefits Realisation Plan
Forecast
NOMS Benefits Realisation Plan
Forecast
2006/07 Q1
Strategic Contribution1
2006/07 Q1
Police Benefits Realisation Plan
Forecast
HMCS Benefits Realisation Plan
2006/07 Q1
CPS Benefits Realisation Plan
MC=Mission Critical
see NOMIS application
CJSIT benefits realisation falls below forecast 1. Process Modelling 2. CJO Benefit Realisation Plans approved by OB and BWG 3. Project Benefit Realisation Plans approved by BWG
KEY M= Minimal D=DesirableHD=Highly Desirable
Cumulative Cost Benefit Analysis
Total HMCS Benefits
Direct & Enabled BenefitsTotal CPS BenefitsTotal HMCS RF Cost/BudgetDirect Benefits
Direct BenefitsEnabled BenefitsTotal Corrections Benefits
Enabled Benefits
Total CPS RF Cost/Budget
Benefits to the CJS and Society
Social Value, 14% (-2%)
x-CJS, 9%
Home CJO, 78%(+2%)
Home CJO x-CJS Social Value
Benefits By Type
Efficiency Opportunity64%(+3%)
Efficiency Cashable8% (-1%)
Effectivess28% (-2%)
Efficiency Cashable Efficiency Opportunity Effectiveness
Strategic Alignment
Maturity Assessment
Cost/Benefit AnalysisRisk Assessment
Recipient Benefits
Project Benefits
Source: CJS IT
Isthatthebestwecandofromouraccumulatedinvestmentinchange?
DCObjec)ve BusinessObjec)ve BusinessBenefit Project Outcome EnablersthedesiredendstateDC
setsouttoachievefor
DubaiGovt.
thedesiredendstatea
businessunitsetsoutto
achieve
thebenefittothe
organisa)onoftheend-state
needtobeundertaken
toproduceoutcomes
specificaspects
oftheendstate
usedtofacilitate
projectsandprograms
BUSINESSOBJECTIVES
BUSINESSBENEFITS
Advanced
Container
Scanning
PROJECTImplementa)on
ofX-Ray
machinesthat
hasadvanced
scanning
capabili)esand
theintegrated
solu)ontocheck
thedeclara)on
details.
OUTCOME
ENABLERSDCOBJECTIVES
Advanced
Container
Scanning
machines(beIer
penetra)on,clear
imagesand
capabilityto
deduct
radioac)ve
materials.
BusinessUnit: JabelAliCustoms
ProjectName: AdvancedContainerScanning
ProjectOverview: Efficientandtroublefreescanningopera)onoftheimportedandexportedcontainers
Opera)onalCostSavings
123%
Tohaveanefficientandtroublefree
scanningopera)onoftheimportedand
exported
containersthatpassthroughtheX–
Raymachines&RadioAc)ve
MaterialDetec)on
ScannersinJabelAliPort
Improving
and
facilita)ng
services
RevenueGenera)on CostSavings
RevenueProtec)on CustomerSa)sfac)on
BacktoAlignmentDashboard
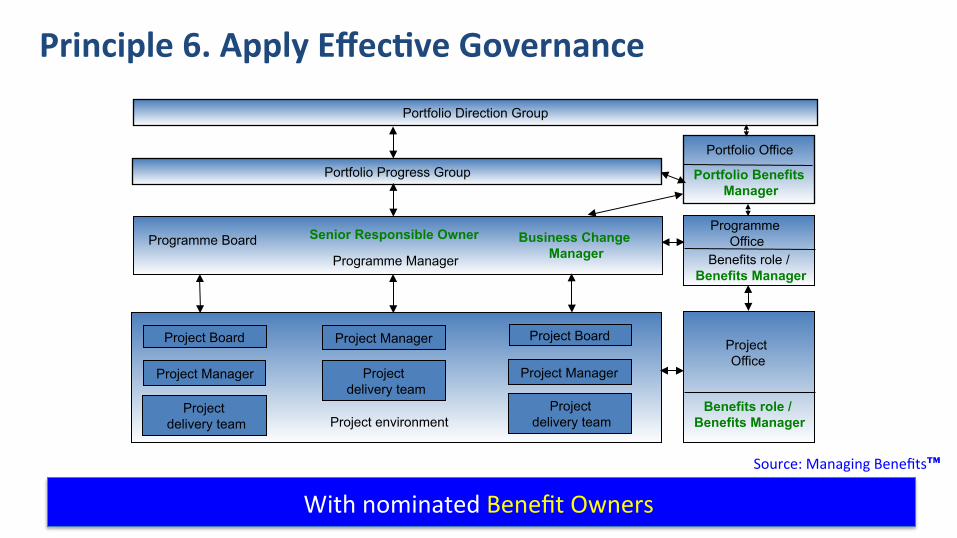
Project Board
Project Manager
Project delivery team
Programme Board Senior Responsible Owner
Programme Manager
Business Change Manager
Portfolio Direction Group
Portfolio Progress Group
Project Office
Programme Office
Project environment
Portfolio Benefits Manager
Benefits role / Benefits Manager
Project Manager
Project delivery team
Project Board
Project Manager
Project delivery team
Portfolio Office
Source:ManagingBenefits™
Benefits role / Benefits Manager
Principle6.ApplyEffecKveGovernance
WithnominatedBenefitOwners
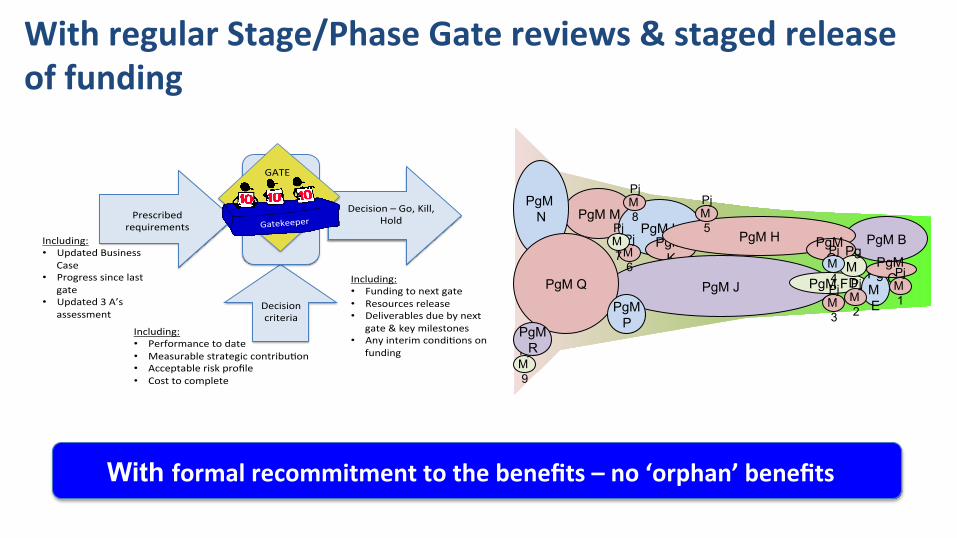
Gatekeeper(
GATE(
Prescribed(requirements(
Decision(criteria(
Decision(–(Go,(Kill,(Hold(
Including:(• Funding(to(next(gate(• Resources(release(• Deliverables(due(by(next(
gate(&(key(milestones(• Any(interim(condiFons(on(
funding(
Including:(• Performance(to(date(• Measurable(strategic(contribuFon(• Acceptable(risk(profile(• Cost(to(complete(
Including:(• Updated(Business(
Case(• Progress(since(last(
gate(• Updated(3(A’s(
assessment(
PgM M
PgM B PgM L
PgM K
PgM J
PgM H PgM G
PgM F PgM E
PgM D
PgM C
PjM 9
PjM 6
PjM 5 Pj
M 7
PjM 3
PjM 2
PjM 1
PjM 4
PjM 8
PgM N
PgM Q
PgM P
PgM R
WithregularStage/PhaseGatereviews&stagedreleaseoffunding
With formalrecommitmenttothebenefits–no‘orphan’benefits
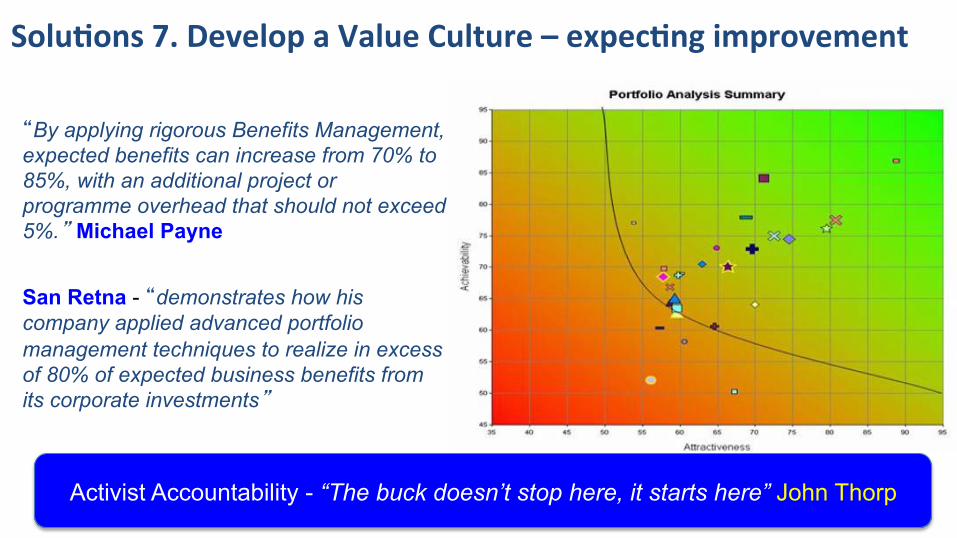
SoluKons7.DevelopaValueCulture–expecKngimprovement
“By applying rigorous Benefits Management, expected benefits can increase from 70% to 85%, with an additional project or programme overhead that should not exceed 5%.” Michael Payne San Retna - “demonstrates how his company applied advanced portfolio management techniques to realize in excess of 80% of expected business benefits from its corporate investments”
Activist Accountability - “The buck doesn’t stop here, it starts here” John Thorp

• An active forward-looking approach
• Including emergent/unplanned benefits
• Mitigating dis-benefits • Measures that engage people
• Learning from experience (and collecting reference class data on performance)
BasedonRealisminplanning&Enthusiasmindelivery
ConKnuingParKcipaKveStakeholderEngagement-lookingbeyondtrackingagainsttarget
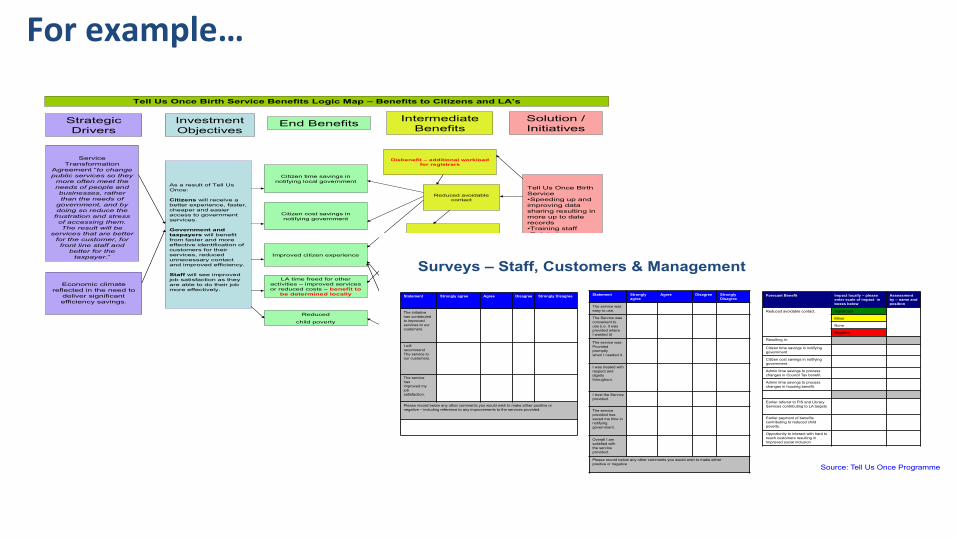
Forexample…
Strategic Drivers
Investment Objectives
Service Transformation
Agreement “to change public services so they
more often meet the needs of people and businesses, rather than the needs of
government, and by doing so reduce the frustration and stress of accessing them. The result will be
services that are better for the customer, for front line staff and
better for the taxpayer.”
Intermediate Benefits
Solution / Initiatives
Economic climate reflected in the need to
deliver significant efficiency savings.
As a result of Tell Us Once:
Citizens will receive a better experience, faster, cheaper and easieraccess to government services.
Government and taxpayers will benefit from faster and moreeffective identification of customers for their services, reducedunnecessary contactand improved efficiency.
Staff will see improved job satisfaction as they are able to do their job more effectively.
End Benefits
Tell Us Once Birth Service Benefits Logic Map – Benefits to Citizens and LA’s
Citizen cost savings in notifying government
Citizen time savings in notifying local government
Improved staff satisfaction
Tell Us Once Birth Service•Speeding up and improving data sharing resulting in more up to date records•Training staff•Related process re-engineering•Marketing the Service
Reduced avoidable contact
Improved citizen experience
LA time freed for other activities – improved services or reduced costs – benefit to
be determined locally
Disbenefit – additional workload for registrars
Admin time savings to LA’s to process changes to
housing and council tax benefit
Earlier referral to FIS and Library Services contributing to LA
targetsReduced
child poverty
Earlier payment of benefits
Surveys – Staff, Customers & Management
Statement Strongly agree Agree Disagree Strongly Disagree
The initiative has contributed to improved services to our customers.
I will recommend The service to our customers.
The service has improved my job satisfaction.
Please record below any other comments you would wish to make either positive or negative – including reference to any improvements to the services provided.
Statement Strongly agree
Agree Disagree Strongly Disagree
The service was easy to use.
The Service was convenient to use (i.e. it was provided where I wanted it)
The service was Provided promptly when I needed it.
I was treated with respect and dignity throughout.
I trust the Service provided.
The service provided has saved me time in notifying government.
Overall I am satisfied with the service provided.
Please record below any other comments you would wish to make either positive or negative
Forecast Benefit Impact locally – please enter scale of impact in boxes below
Assessment by – name and position
Reduced avoidable contact. Significant
Minor
None
Negative
Resulting in:
Citizen time savings in notifying government.
Citizen cost savings in notifying government.
Admin time savings to process changes in Council Tax benefit.
Admin time savings to process changes in housing benefit.
Earlier referral to FIS and Library Services contributing to LA targets
Earlier payment of benefits contributing to reduced child poverty.
Opportunity to interact with hard to reach customers resulting in Improved social inclusion.
Source: Tell Us Once Programme

Related Documents