Optimizing ICU Discharge Decisions with Patient Readmissions Carri W. Chan Division of Decision, Risk and Operations, Columbia Business School [email protected] Vivek F. Farias Sloan School of Management, Massachusetts Institute of Technology [email protected] Nicholas Bambos Departments of Electrical Engineering and Management Science & Engineering, Stanford University [email protected] Gabriel J. Escobar Kaiser Permanente Division of Research, [email protected] This work examines the impact of discharge decisions under uncertainty in a capacity-constrained high risk setting: the intensive care unit (ICU). New arrivals to an ICU are typically very high priority patients and, should the ICU be full upon their arrival, discharging a patient currently residing in the ICU may be required to accommodate a newly admitted patient. Patients so discharged risk physiologic deterioration which might ultimately require readmission; models of these risks are currently unavailable to providers. These readmissions in turn impose an additional load on the capacity-limited ICU resources. We study the impact of several different ICU discharge strategies on patient mortality and total readmis- sion load. We focus on discharge rules that prioritize patients based on some measure of criticality assuming the availability of a model of readmission risk. We use empirical data from over 5000 actual ICU patient flows to calibrate our model. The empirical study suggests that a predictive model of the readmission risks associated with discharge decisions, in tandem with simple index policies of the type proposed can provide very meaningful throughput gains in actual ICUs while at the same time maintaining, or even improving upon, mortality rates. We explicitly provide a discharge policy that accomplishes this. In addition to our empirical work, we conduct a rigorous performance analysis for the family of discharge policies we consider. We show that our policy is optimal in certain regimes, and is otherwise guaranteed to incur readmission related costs no larger than a factor of (ˆ ρ +1) of an optimal discharge strategy, where ˆ ρ is a certain natural measure of system utilization. Key words : Dynamic Programming; Healthcare; Approximation Algorithms 1. Introduction The intensive care unit (ICU) is the designated location for the care of the sickest and most unstable patients in a given hospital. These units are among the most richly staffed in the hospital: for example, in California, licensed ICUs must maintain a minimum nurse-to-patient ratio of one-to- two. Critically ill patients, who may be admitted to a hospital due to multiple illnesses, including 1

Welcome message from author
This document is posted to help you gain knowledge. Please leave a comment to let me know what you think about it! Share it to your friends and learn new things together.
Transcript
Optimizing ICU Discharge Decisions with PatientReadmissions
Carri W. ChanDivision of Decision, Risk and Operations, Columbia Business School [email protected]
Vivek F. FariasSloan School of Management, Massachusetts Institute of Technology [email protected]
Nicholas BambosDepartments of Electrical Engineering and Management Science & Engineering, Stanford University [email protected]
Gabriel J. EscobarKaiser Permanente Division of Research, [email protected]
This work examines the impact of discharge decisions under uncertainty in a capacity-constrained high
risk setting: the intensive care unit (ICU). New arrivals to an ICU are typically very high priority patients
and, should the ICU be full upon their arrival, discharging a patient currently residing in the ICU may be
required to accommodate a newly admitted patient. Patients so discharged risk physiologic deterioration
which might ultimately require readmission; models of these risks are currently unavailable to providers.
These readmissions in turn impose an additional load on the capacity-limited ICU resources.
We study the impact of several different ICU discharge strategies on patient mortality and total readmis-
sion load. We focus on discharge rules that prioritize patients based on some measure of criticality assuming
the availability of a model of readmission risk. We use empirical data from over 5000 actual ICU patient
flows to calibrate our model. The empirical study suggests that a predictive model of the readmission risks
associated with discharge decisions, in tandem with simple index policies of the type proposed can provide
very meaningful throughput gains in actual ICUs while at the same time maintaining, or even improving
upon, mortality rates. We explicitly provide a discharge policy that accomplishes this. In addition to our
empirical work, we conduct a rigorous performance analysis for the family of discharge policies we consider.
We show that our policy is optimal in certain regimes, and is otherwise guaranteed to incur readmission
related costs no larger than a factor of (ρ+ 1) of an optimal discharge strategy, where ρ is a certain natural
measure of system utilization.
Key words : Dynamic Programming; Healthcare; Approximation Algorithms
1. Introduction
The intensive care unit (ICU) is the designated location for the care of the sickest and most unstable
patients in a given hospital. These units are among the most richly staffed in the hospital: for
example, in California, licensed ICUs must maintain a minimum nurse-to-patient ratio of one-to-
two. Critically ill patients, who may be admitted to a hospital due to multiple illnesses, including
1

2
trauma, need urgent admission to the ICU. While it is possible to hold these patients in other areas
(e.g., the emergency department) pending bed availability, this is quite undesirable, since delays in
providing intensive care are associated with worse outcomes (Chalfin et al. 2007). Consequently, in
such situations, clinicians may elect to discharge a patient currently in the ICU to make room for
a more acute patient. For the sake of precision, we will refer to this as a demand-driven discharge.
In theory, the patient selected for such discharge would be one who was sufficiently stable to be
transferred to a less richly staffed setting (such as the Transitional Care Unit (TCU) or Medical
Surgical Floor (Floor)), and, ideally, the term ‘stable’ would be one based on ample clinical data.
In practice, since predictive models of patient dynamics are not readily available, clinicians must
make these transfer decisions based entirely on clinical judgment. It is natural to conjecture that
demand-driven discharges might be associated with costs; namely:
• Patient Health Related Costs: Patients subject to a demand-driven discharge could
potentially face additional risks of physiological deterioration. Such deterioration might ultimately
require readmission. Even worse, readmitted patients tend to require longer stays in the ICU and
have a higher mortality rate than first-time patients (see Snow et al. (1985), Durbin and Kopel
(1993)).
• System Related Costs: Readmitted patients impose an additional load on capacity-limited
ICU resources. Ultimately this hampers access to the ICU for other patients
Thus motivated, the present work examines the potential benefits of a quantitative decision
support system for clinicians when faced with the requirement to identify a patient for discharge
in order to make room for a more acute patient. The hope is that the availability of such a system
could lead to both better patient outcomes and simultaneously increase efficiencies in the use of
scarce ICU resources. More formally, associating a demand-driven discharge with some cost which
depends on the physiological characteristics of the patient discharged, our goal is to ‘optimally’
discharge patients so as minimize total expected costs associated with demand-driven discharges
over time. One example of such a cost may be the increase in mortality risk due to a demand-
driven discharge. As a second example, one might consider the increase in expected readmission
load associated with the increased likelihood of readmission due to a demand-driven discharge. We
will eventually estimate and test several such cost metrics.
Our analysis will consider a stylized model of an actual ICU where the number of ICU beds is
fixed1. Patients arrive to the ICU at random times; patients are categorized into a finite number
1 Since a strict (one-to-two in California) nurse-to-patient ratio must be maintained, it is often the size of the nursingstaff that determines the number of available ICU beds rather than the actual number of physical beds which areavailable.

3
of classes based on their physiological characteristics upon admission. There exist a number of
proprietary classification systems based on a patient’s physiological characteristics. All new arrivals
must be given an ICU bed immediately; they cannot queue up and wait for a bed to become
available. This models the aforementioned fact that new ICU patients are typically extremely high
priority. If no beds are vacant upon the arrival of a new patient, a current patient will have to be
discharged in order to accommodate the newly arriving patient2. The demand-driven discharge of
a patient will incur a cost which depends on that patient’s class; this cost is modeled to reflect the
impact of the demand-driven discharge on the patient as well as the system as described above. Our
goal will be to minimize the expected costs incurred due to demand-driven discharges over some
finite horizon. This is a difficult problem, and our analysis of this stylized model will suggest simple
policies for which we will develop performance guarantees. More interestingly, we will conduct a
detailed simulation study based on real data to examine our recommendations.
1.1. Our Contributions
We make the following key contributions:
• Interpretability: We show that a myopic policy is a potentially good approximation to an
optimal policy. This corresponds to an index policy wherein every patient class is associated with
a class specific index. The index for a given class can be computed from historical patient flow
data in a robust fashion. Depending on the cost metric under consideration, we will demonstrate
that these indices can serve as natural measures for patient criticality that have both clinical as
well as operational merit. The index policy then has an appealing clinical interpretation: when
a patient must be discharged in order to accommodate new patients, one simply discharges an
existing patient of the lowest possible criticality index.
• Robustness: Our index policy is ‘robust’: In particular the indices we compute are oblivious
to patient traffic intensities which are highly variable and difficult to estimate. Rather, they rely
on quantities relevant to specific classes of patients that are typically far simpler to estimate from
data. For the data set under consideration, relative changes of estimated parameters greater than
50% were typically required to induce a change in the associated indices.
• Performance Guarantees and Operational Relevance: We demonstrate via a theoretical
analysis that our index policy is, for a certain class of problems, optimal and in general incurs
total expected cost that is no more than 1+ ρ times that incurred under an optimal discharge rule,
where ρ is a certain natural measure of ICU utilization. We identify a cost metric – the increase
2 We later consider an extension of our model which includes the additional option of blocking new patients.

4
in expected readmission load due to a demand-driven discharge – that in addition to enjoying a
clinical interpretation as a measure of criticality, can be shown to capture a notion of throughput
optimality.
• Empirical Validation: Most importantly, we calibrate our model to empirical data from over
5000 patient flows at a large privately owned partnership of hospitals and identify parameters for
patient dynamics. We consider a variety of cost metrics, including several natural metrics motivated
by existing clinical literature and modifications of these cost metrics such as the operationally
relevant metric alluded to above. We measure the impact of these discharge policies along two
dimensions. First, to understand impact at the individual patient level, we measure mortality rates
under the various policies. Second, to understand system level impact we measure the readmission
load incurred under the various policies. In doing so, we identify a policy that, in addition to
fitting within the ethos of ordering patients by a measure of criticality, has substantive benefits
over other, perhaps more ‘obvious’ policies: Under modest assumptions on patient traffic, it incurs
a 30% reduction in readmission load at no cost to mortality rate.
As such, this study provides a framework for the design of demand-driven discharge policies and
in doing so identifies a policy that allows us to utilize available ICU resources as effectively as
possible while not sacrificing the quality of patient outcomes. At a high level, our analysis suggests
that investments in providing clinicians with more decision support (e.g., severity of illness scores
and the associated risks of physiological deterioration) could translate into tangible benefits both
in terms of improved patient outcomes, increased efficiency, and decreased costs.
1.2. Related Literature
The use of critical care is increasing, which is making already limited resources even more scarce
(Halpern and Pastores 2010). In fact, it was shown that 90% of ICUs will not have the capacity
to provide beds when needed (Green 2003). As such, it is the case that some patients may require
premature discharges in order to accommodate new, more critical patients. In a recent econometric
study (Kc and Terwiesch 2011), these types of patient discharges were shown to be a legitimate
cause of patient readmissions thereby effectively reducing peak ICU capacity due to the additional
load the readmitted patients bring. The empirical data we have analyzed in calibrating our ICU
model corroborates this fact.
There has been a significant body of research in the medical literature which has looked at
the effects of patient readmissions. In Chrusch et al. (2009), high occupancy levels were shown to
increase the rate of readmission and the risk of death. Unfortunately, readmitted patients typically

5
have higher mortality rates and longer hospital lengths-of-stay (see Franklin and Jackson (1983),
Chen et al. (1998), Chalfin (2005), Durbin and Kopel (1993) and related works).
When a new patient arrives to the ICU, either after experiencing some trauma or completing
surgery, he must be admitted. If there are not enough beds available, space must be allocated by
transferring current patients to units with lower levels of staffing and care. In Swenson (1992) and
related works, the authors examine how to allocate ICU beds from a qualitative perspective that is
not based on analysis of patient data but rather on philosophical notions of ‘fairness’. The authors
propose a 5-class ranking system for patients based on the amount of care required by the patient
as well as his risk of complications. Our approach may be seen as a quantitative perspective on
the same problem wherein decisions are motivated by the analysis of relevant quantitative patient
data. To date, the work (particularly in the medical community) on how to determine discharge
decisions has been rather subjective due to the lack of information-rich models which attempt to
capture patient dynamics. Thus, these works (see for instance Bone et al. (1993) and a study by
the American Thoracic Society (1997)) have not considered that discharging a patient from the
ICU in order to accommodate new patients may result in readmission, further increasing demand
for the limited number of beds and ultimately compromising the quality of care for all patients
involved. We not only propose such a model, but also show the efficacy of discharge policies which
utilize this previously unavailable information.
Dobson et al. (2010) consider a setup quite similar to ours but ignore the readmission phe-
nomenon; rather they simply seek to quantify the total expected number of patients discharged in
order accommodate new, more critical patients. To this end, they analyze a policy that chooses to
discharge patients with the shortest remaining service time (which are modeled as deterministic
quantities). As will be seen in Section 5, which presents an empirical performance evaluation using
a real patient flow data-set, a distinct heuristic is desirable when one does account for patient
readmission.
A number of modeling approaches have been used to make capacity, staffing and other tactical
decisions in the healthcare arena (see for instance Huang (1995), Kwak and Lee (1997), and Green
et al. (2003)). Queueing theory has been particularly useful to study the question of necessary
staffing levels in hospitals. As examples of this work, Green et al. (2006) and Yankovic and Green
(2011) consider a number of staffing decisions from a queueing perspective. The goal is to provide
patients with a particular service level (in terms of timeliness, and also nurse-to-patient ratio)
while at the same time addressing issues such as temporal variations in arrival rates of patients
of different types. See also Green (2006) for an overview of the use of OR models for capacity

6
planning in hospitals. Murray et al. (2007) considers different factors such as age, gender, physician
availability and number of visits per patient per year to determine the largest patient panel size
that may be supported by available resources. In Green and Savin (2008), the authors consider how
to reduce delay in primary care settings by varying the number of patients served by the particular
primary care office. When a patient wishes to make an appointment, he may be delayed before
the physician is able to see him. Two significant differences separate the problem we consider from
those considered in the above streams of work: arriving patients to an ICU must receive service
immediately (which thus necessitates discharging current patients). This in turn requires that we
consider individual patient dynamics, and in particular model the impact of discharging a patient
to accommodate new ones on the discharged patient’s likelihood of revisiting the ICU. We can
then make staffing decisions in much the same way as the aforementioned work.
In a related paper on ICU patient flow (Shmueli et al. 2003), the authors examine the affect
of ICU admission strategies on the distribution of ICU bed occupancy. The authors assume it is
possible for patients to wait for an ICU bed, regardless of their criticality. For the specific ICUs we
consider, waiting is highly undesirable (thereby necessitating our modeling decisions that arriving
patients be given a bed immediately). An interesting direction for future work would be to consider
an intermediate scenario, where some patients may be delayed, whereas others must be given a
bed immediately.
Finally, relative to recent work by (Chan and Farias 2009), we note that the present paper
considers a class of models entirely distinct from the ‘depletion problems’ studied there and succeeds
in establishing relative approximation guarantees for a class of models left unaddressed by that past
work. The properties we exploit in our analysis are new and it would be interesting to understand
whether the techniques introduced here have application to the more natural cost-minimization
variants of the queueing problems introduced in Chan and Farias (2009).
The rest of the paper proceeds as follows. Section 2 formally introduces the queueing model and
patient dynamics we study. In Section 3, we analyze the performance of an index policy which
selects patients to discharge in a greedy manner based on their expected costs incurred due to
demand-driven discharges. We explore a scenario where the proposed greedy policy (based on an
information-rich model) is, in fact, optimal. Furthermore, in a more general setting, we show that
the greedy policy is guaranteed to be within a factor of (ρ+ 1) of optimal, where ρ is a measure of
system utilization. In Section 4, we discuss various measures of criticality which constitute clinically
relevant cost metrics. These measures include an important refinement to a criticality measure that
has received some attention in the critical care literature. In Section 5, we discuss the calibration of

7
our model using a proprietary ICU patient flow data-set from a group of private hospitals. Having
calibrated our model, we show in Section 6 that our primary proposal outperforms a number of
benchmarks of interest. We conclude in Section 7.
2. Model
We begin by proposing a stylized model of the patient flow dynamics in a hospital ICU and
account for the fact that discharging a current ICU patient in order to accommodate a new one is
undesirable for the discharged patient and comes at a ‘cost’. At a high level, our model captures
the fact that a newly admitted patient must receive ICU resources and that this requirement in
turn could necessitate the discharge of an existing ICU patient. Such a discharged patient may
suffer physiologic deterioration due to the demand-driven discharge. Since arriving patients cannot
be queued or blocked, the model we consider is distinct from a typical queueing model. Presuming
a measure of cost associated with a demand-driven discharged patient, a natural goal is to find a
patient discharge policy that minimizes this cost.
Preliminaries: We consider time to be discrete and indexed by t ∈ [0, T ]. In each time-slot,
we must determine if a patient must be discharged and, if so, which one. If there are enough
available beds to accommodate all current and arriving patients, discharge of current patients is
not required.
We assume that patients may be classified into one of M classes, each potentially corresponding
to the particular ailment/health condition of the ICU patient. Let m ∈M= {1,2, . . . ,M} denote
the type of a particular patient. Patients from a given class are assumed to have identical statistics
for their initial lengths of stay and identical costs associated with a demand-driven discharge.
Specifically, we assume that the initial length-of-stay for a patient of class m is a geometric random
variable with mean 1/µ0m. If such a patient is discharged prior to completing treatment due to
the arrival of a more acute patient, a cost, φm ≥ 0, is incurred. While the patient length-of-stay
distribution is assumed to be memoryless for the purposes of analysis, our empirical study assumes
log-normal distributions for length-of-stay that are fit to the empirical data (see Section 5). Finally,
in Section 3.3, we discuss an extension to our model which is able to capture a patient’s evolution
and changing condition during his ICU stay by using a ‘phase’-type length-of-stay distribution.
At most one new patient can arrive in each time-slot and an arrival occurs with probability λ.
We define ρ= λminm µ0m
as a measure of the utilization of the ICU: a higher ρ implies a more stressed
ICU while a lower value implies more able bed resources. Notice that this measure does not rely
on the relative arrival intensities of various patient types. We let at,m denote the probability that

8
a newly arriving patient at time t is of type m. These probabilities are deterministic and known a
priori to the optimal discharge policy; the policy we study will require neither knowledge of λ nor
the probabilities at,m.
We assume that the ICU has B beds. If all B beds are full and a new patient arrives, then a
patient must be discharged prior to completing service in order to accommodate the newly arrived
patient. We let xt,m ∈ {0,1 . . . ,B} denote the number of class m patients currently in the ICU at
the beginning of time-slot t and let yt,m ∈ {0,1} be an indicator for the arrival of a type m patient at
the start of the tth epoch. Note that because at most one new patient can arrive in each time-slot,∑M
m=1 yt,m ≤ 1 for all t. A current patient must be discharged if∑M
m=1 xt,m +∑M
m=1 yt,m =B + 1;
we refer to this type of discharge as a demand-driven discharge. The natural departure (or service
completion) of patient type m occurs at the end of the tth time-slot with probability µ0m after any
demand-driven discharge and/or admission occurs.
State and Action Space: The dynamic optimization problem we will propose is conveniently
studied in a ‘state-space’ model. We define our state-space as the set:
S =
{(x, y, t) : x∈ {0,1, . . . ,B}M ,
M∑m=1
xm ≤B,y ∈ {0,1}M ,M∑m=1
ym ≤ 1,0≤ t≤ T
}In particular, the state of the system is completely described by the number of patients of each
type currently in the ICU, the type of the arriving patient at that state if any, and the epoch in
question. We denote by x(s) the projection of s onto its first coordinate and similarly employ the
notation y(s) and t(s). We let the random variable st ∈ S denote the state in the tth epoch. Note
that because the {at,m} process is assumed to be deterministic and given a-priori, the current time
slot t completely specifies the arrival probabilities for each patient class.
For each state s, let A(s)⊂M denote the set of feasible actions that can be taken in time-slot
t(s). For states wherein a demand-driven discharge is required, i.e. states s for which∑
m x(s)m +
y(s)m > B, we have A(s) = {m : x(s)m > 0}. At all other states s, A(s) = {m : x(s)m > 0} ∪ {0}.
Thus, an action A∈A(s) specifies the class of the patient, if any, to be discharged in time-slot t(s);
since only one patient can arrive in each time slot, at most one demand-driven patient discharge
is required to accommodate a new patient. We will henceforth suppress the dependency of the set
of feasible actions, A(s), on s.
Dynamics: Let s′ = S(s,A) denote the random next state encountered upon employing action
A (demand-driven discharge of patient type A) in state s. A random number, Xt(s),m, of class m
patients will complete treatment and depart naturally, where Xt(s),m is a Binomial-(x(s)m+y(s)m−
1{A=m}, µ0m) random variable. LetRt be independent random variables, defined for each t, indicating

9
the type of an arriving patient at the start of the tth epoch. Rt takes values in {1,2, . . . ,M}∪{0};
Rt =m with probability λat,m for m∈ {1,2, . . . ,M} and Rt = 0 with the remaining probability. The
vector denoting arrivals at the next state, Yt(s)+1 is then given by Yt(s)+1,m = 1{Rt(s)+1=m}. Thus,
s′ = S(s,A) is defined as:
x(s′)m = x(s)m + y(s)m−1{A=m}−Xt(s),m,
y(s′)m = Yt(s)+1,m,
t(s′) = t(s) + 1.
Cost Function: The cost incurred for taking action A is defined by a cost function C : S×A→
R+. Such a cost function might capture a number of quality metrics. For instance, the cost function
might reflect the net decrease in quality-adjusted life years (QALYs) as a result of a demand-driven
discharge. Our discussion is able to capture any such cost function. We take C(s,A) = φA for
A∈ {1,2, . . . ,M}, and C(s,0) = 0. In Section 4, we discuss clinically relevant cost metrics.
Objective: Let Π denote the set of feasible discharge policies, π which map the state space S
to the set of feasible actions A. Define the expected total cost-to-go under policy π as:
Jπ(s) =E
T−1∑t′=t(s)
C(st′ , π(st′))|st(s) = s
.We let J∗(s) = minπ∈Π J
π(s) denote the minimum expected total cost-to-go under any policy. We
denote by π∗ a corresponding optimal policy, i.e. π∗(s)∈ arg minπ∈Π Jπ(s).
The optimal cost-to-go function (or value function) J∗ and the optimal discharge policy π∗ can
in principle be computed numerically via dynamic programming: In particular, define the dynamic
programming operator H according to:
(HJ)(s) = minA∈A
E [C(s,A) +J(S(s,A))] . (1)
for all s ∈ S with t(s) ≤ T − 1. J∗ may then be found as the solution to the Bellman equation
HJ = J , with the boundary condition J(s′) = 0 for all s′ with t(s′) = T . The optimal policy π∗
may be found as the greedy minimizer with respect to J∗ in (1). The minimization takes into
consideration the current state s, the distribution of future patient arrivals, as well as the impact
of the current decision on future states. References to an optimal policy in subsequent sections will
refer to precisely this policy. The size of S precludes this straightforward dynamic programming
approach. Moreover, even if optimal solution were possible, the robustness of such an approach and
its implementability remain in question since it relies on detailed patient arrival statistics which
are typically not stationary and difficult to estimate. As such, our goal will be to design simple,
robust heuristics for the load minimization problem at hand.

10
In addition to the above objective, one may also consider the task of finding an average-cost
optimal policy; i.e. the task of finding a stationary policy π (a policy that satisfies π(s) = π(s′) for
all s, s′ with x(s) = x(s′), and y(s) = y(s′)), that solves
κ∗(s) = minπκπ(s)
where κπ(s) = lim supT→∞1TE[∑T−1
t′=t(s)C(st′ , π(st′))∣∣∣st(s) = s
]is the average-cost to go (i.e. the
long run costs incurred due to demand-driven discharges) under policy π.
It is not difficult to see that the Markov chain on S (the projection of S on its x and y coordinates)
induced under any stationary policy π is irreducible, so that in fact, the above problem is solved
simultaneously for all s by a common stationary policy π∗, and κπ(s) = κπ for all s ∈ S and a
stationary policy π. Finally, the ergodic theorem for Markov chains implies (with some abuse of
notation), that
κπ =∑s∈S
νπ(s)C(s,π(s)),
where νπ is the stationary distribution induced by π on S.
3. A Priority Based Policy
This section introduces an index policy for the dynamic optimization problem proposed. Under
such a policy, the patient selected for a demand-driven discharge is simply chosen from a patient
class that would incur the minimal cost. In particular, such a policy states that the patient (class)
πg(s) chosen for discharge satisfies:
πg(s)∈ arg minA∈A(s)
C(s,A) = arg minm∈A(s)
φm. (2)
It is easy to see that the policy specified by (2) has a natural implementation as an ‘index’ policy. It
is interesting to note that implementing such a policy requires data about particular patient classes,
but does not require the estimation of arrival rates of the various classes. This latter information
is highly dynamic and difficult to estimate.
Since the policy we have proposed ignores the effect of future arrivals and the expected length-
of-stay of the current occupants, it is natural to expect such a policy to be sub-optimal. In the
appendix, Example A shows what can go wrong.
In light of the sub-optimality of our proposed priority based policy, the remainder of this section
is devoted to establishing performance guarantees for this policy. In particular, we identify a setting
11
where the greedy policy is, in fact, optimal. More generally we establish that the greedy policy
incurs expected costs that are at most a factor of (ρ+ 1) times the expected costs incurred by
an optimal policy (i.e. the greedy policy is a ‘(ρ+ 1)-approximation’) where ρ= λµ0min
(here µ0min ,
minm µ0m) is a measure of the utilization of the ICU defined in Section 2: a higher ρ implies a more
stressed ICU while a lower value implies more able bed resources. This latter bound is independent
of all other system parameters.
3.1. Greedy Optimality
In this section, we consider a special case of the general model presented in Section 2 for which a
greedy discharge rule is optimal. The proof of this result can be found in the appendix. In particular
we have the following theorem:
Theorem 1. (Greedy Optimality) Assume that for any two patient classes i, j with φi ≤ φj we also
have 1/µ0i ≥ 1/µ0
j . Then, we have that the greedy policy is optimal, i.e.
Jg(s) = J∗(s),∀s∈ S
The above theorem considers problems for which patients with lower cost also have higher
nominal lengths-of-stay. In this case, since eliminating a low cost patient also frees up capacity
that would have otherwise been occupied for a relatively longer time, it is intuitive to expect the
greedy policy to be optimal. However, the assumptions of the theorem are likely to be restrictive
in practice. In the next section, we consider the performance of the greedy policy without any
assumptions on problem primitives.
3.2. A General performance Guarantee
Our objective in this section is to demonstrate that the greedy heuristic incurs expected costs that
are within ρ+ 1 times that incurred by an optimal policy as discussed in Section 2. In particular,
we will show that for any state s ∈ S, Jg(s) ≤ (ρ+ 1)J∗(s), where ρ = λµ0min
is a utilization ratio
defined in Section 2.
To show the desired bound, we begin with a few preliminary results for the optimal value
function J∗. The proofs of these results can be found in the appendix. The first result is a natural
monotonicity result which says that having an ICU with higher occupancy levels is less desirable
that having lower occupancy levels. In particular:
Lemma 1. (Value Function Monotonicity) For all states s, s′ ∈ S satisfying x(s) ≥ x(s′), y(s) =
y(s′), t(s) = t(s′), we have:
J∗(s)≥ J∗(s′).
12
In words, the above Lemma states that all else being equal, it is advantageous to start at a state
with a fewer number of patients occupying the ICU. Now suppose in state s we chose to take the
greedy action as opposed to the optimal action (assuming of course that the two are distinct). It
must be that the former leads to a higher cost state than does the optimal action. The following
result places a bound on this cost increase. In particular, we have:
Lemma 2. (One Step Sub-optimality) For any state s∈ S and α= ρρ+1
,
E[J∗(S(s,πg(s)))]≤ αC(s,π∗(s)) +E[J∗(S(s,π∗(s)))]
In words, Lemma 2 tells us that if we were to deviate from the optimal policy for a single epoch
(say, in state s), the impact on long term costs is bounded by the quantity αC(s,π∗(s)). We now use
this bound on the cost of a single period deviation in an inductive proof to establish performance
loss incurred in using the greedy policy; we show that the greedy heuristic is guaranteed to be
within a factor of ρ+ 1 of optimal, where ρ = λµ0min
is the utilization ratio of the ICU defined in
Section 2.
Theorem 2. For all s∈ S, Jg(s)≤ (ρ+ 1)J∗(s).
Proof: The proof proceeds by induction on the number of time steps that remain in the
horizon, T − t(s). The claim is trivially true if t(s) = T − 1 since both the myopic and optimal
policies coincide in this case. Consider a state s with t(s)< T − 1 and assume the claim true for
all states s′ with t(s′)> t(s).
Now if π∗(s) = πg(s) then the next states encountered in both systems are identically distributed
so that the induction hypothesis immediately yields the result for state s. Consider the case where
π∗(s) 6= πg(s). Defining α= ρρ+1
, we have:
J∗(s) = C(s,π∗(s)) +E[J∗(S(s,π∗(s)))]
≥ (1−α)C(s,π∗(s)) +E[J∗(S(s,πg(s)))]
≥ (1−α)C(s,πg(s)) +E[J∗(S(s,πg(s)))]
≥ (1−α)C(s,πg(s)) +E[(1−α)Jg(S(s,πg(s)))]
= (1−α)Jg(s)
=1
ρ+ 1Jg(s) (3)
The first equality comes from the definition of the optimal policy. The first inequality comes from
Lemma 2. The second inequality comes from the definition of the greedy policy which minimizes

13
single period costs. The third inequality comes from the induction hypothesis. The second equality
comes from the definition of the greedy value function. This concludes the proof. �
Our guarantee on performance loss suggests that in regimes where ICU utilization is low, the
greedy policy is guaranteed to be close to optimal. At some level, this is an intuitive result–low
levels of utilization should imply infrequent demand-driven discharges as there are likely to be
available beds when new patients arrive; Theorem 2 makes this intuition precise by demonstrating
a bound on how performance loss scales with utilization levels. Our guarantees are worst case;
later in this section we will consider a generative family of problems for which the performance
loss is a lot smaller than predicted, even at high utilization levels. Moreover, we will demonstrate
via an empirical study using patient flow data, that the greedy policy is superior to a number of
benchmarks that resemble current practice. Before we continue, we briefly discuss extensions to
the model presented in Section 2 and how the presented results can be applied.
3.3. Patient Evolution during ICU stay
Thus far, we have assumed the distribution for the length-of-stay of each patient is memoryless.
Since the health of a patient will vary over the course of his stay, one may wish to employ a
length-of-stay distribution that does not have a constant hazard rate. We now consider how to
incorporate this more realistic scenario.
For each patient class m, consider a random progression of the state of their health condition.
Let hm ∈ {hm0 , hm1 , . . . , hmnm} denote the set of health condition states patient class m can achieve.
Whenever a new patient of type m arrives, it begins with a health state of hm0 . Assuming that
a patient is in health state hmn in some epoch, the patient departs with probability µ0m(hmn ). If
he does not depart, he evolves to health state hmn+1 with probability γmn and remains in state hmn
with probability 1− γmn . Should a patient in health state hmn be demand-driven discharged, the
cost he introduces is φm(hmn ). The different health condition states and corresponding departure
probabilities enable us to capture the changes (improvement or deterioration) in patient health as
a patient spends time in the ICU. Note that there are no constraints on the relationship between
the µ0m(hmn ) so that the patient does not necessarily improve with time. Indeed, there have been
studies which shows that patients likelihood of departure decreases the longer they have spent in
the hospital (Chalfin 2005).
The state space now needs to be expanded to incorporate the different health states each patient
class can achieve. To do this, we can redefine x(s) to be a 2-dimensional array where xm,n(s)

14
denotes the number of class m patients in health condition state hmn . We consider using the natural
analogue to the greedy policy discussed thus far:
πg(s)∈ arg min(m,n):xm,n(s)>0
φm(hmn )
Now, Lemma 1 can be established exactly as before for this new system, with the understanding
that we will say x(s) ≥ x(s′) iff xm,n(s) ≥ xm,n(s′) for all m,n. Further, the analysis used in the
proof of Lemma 2 also applies identically as in the case of that result to show that for α= ρρ+1
,
E[J∗(S(s, πg(s)))]≤ αC(s,π∗(s)) +E[J∗(S(s,π∗(s)))].
where we now define
ρ=λ
minm,n µ0m(hmn )
.
With these results, the proof of Theorem 2 applies verbatim to yield
Theorem 3. For all s∈ S, J πg(s)≤ (ρ+ 1)J∗(s).
3.4. Patient Diversions
Throughout our discussion we have assumed that all new patients must be given a bed immediately.
In some cases, high occupancy levels in an ICU can lead to congestion in other areas of the
hospitals, such as the Emergency Department (ED), because patients cannot be transferred across
hospitals units. In Allon et al. (2009) and McConnell et al. (2005), it is shown that when ICU
occupancy levels are high, ambulance diversions increase. Because of the inability to move patients
from the ED to ICU, patients are blocked from the ED and ambulances must be diverted to other
hospitals. In de Bruin et al. (2007), the authors examine the case of bed allocation given a maximum
allowable number of patient diversions in the case of cardiac intensive care units. The authors
identify scenarios where achieving the target number of patient diversions is possible, but do not
consider how to make admission and discharge decisions. Ambulance diversion comes at a cost–for
both the hospital and patient. The hospital loses the revenue generated for treatment (McConnell
et al. 2006, Melnick et al. 2004, Merrill and Elixhauser 2005) while delays due to transportation
time may result in worse outcomes for the diverted patient (Schull et al. 2004). On the other hand,
diversions can sometimes alleviate over-crowding (Scheulen et al. 2001).
Typically, diverted ambulance patients are not the ones who require ICU care (Scheulen et al.
2001). However, within a hospital it may still be possible to block new ICU patients admissions,
either by diverting them to another unit (i.e. a Transitional Care Unit or General Floor) within

15
the same hospital or transferring them to an ICU in a different hospital (because of the integrated
nature of the hospital system we study, such intra-hospital transfers do occur). Blocking new
patients may reduce the number of demand-driven discharges. Note that these new patients are
often being transferred from a different hospital unit (Emergency Department, Operation Room,
General Ward, etc.) rather than being brought in by ambulances, which is the case of the extensive
body of literature on ambulance diversions. Given the ability to divert patients, we consider how
to incorporate patient diversions into our model and decision analysis. We extend our model to
allow new ICU patients to be diverted to another hospital ICU or unit of lesser care. Hence, when
an ICU is full the hospital administrator must decide whether to block the new patient or to make
a demand-driven discharge of a current patient in order to admit the new patient.
To formalize the above decision making, we consider the following extension of our model: in a
given state s, we permit an additional action corresponding to diversion which we denote by D;
we let C(s,D) denote the cost associated with a diversion in state s; as per our discussion above,
this cost must capture the increased risks to the patient being diverted in state s (i.e. the arriving
patient in that state) as also potential revenue losses to the hospital. We then consider employing
the following policy; for states s /∈ Sfull, i.e. states where the ICU has available capacity, no action
is necessary. Otherwise, we follow the following diversion/discharge policy:
π(s) =
{πg(s), if C(s,D)≥C(s,πg(s));D, otherwise.
Now, Lemma 1 can be established exactly as before for this new system, and the analysis used in
the proof of Lemma 2 also applies identically as in the case of that result to show that for α= ρρ+1
,
E[J∗(S(s, π(s)))]≤ αC(s,π∗(s)) +E[J∗(S(s,π∗(s)))].
Given these properties, the proof of Theorem 2 applies verbatim to yield
Theorem 4. For all s∈ S, J π(s)≤ (ρ+ 1)J∗(s).
3.5. Comparison to Optimal
This section is devoted to examining the performance loss of the greedy policy via numerical
studies. We compare the greedy and optimal policies for a set of smaller problems for which the
optimal policy is actually computable. In the following section, we examine larger problem instances
calibrated to empirical data and compare the performance of the greedy policy to a number of
benchmark policies.

16
In Section 3.2, we have shown that the greedy performance is an (ρ+1)-approximation algorithm
to optimal. In order to enable computation of the optimal policy, we consider a small scenario
with B = 10 beds, M = 2 patient types and a time horizon of 240 time slots (assuming admission
and discharge decisions are made every 6 minutes, or 10 times an hour, this corresponds to a time
horizon of 24 hours). For each data point, we fix the probability of arrival of each patient type.
We consider 100 different realizations for the nominal length-of-stay and cost of demand-driven
discharge of each patient type which we vary uniformly at random with mean 25 hours and 2.5
units of cost, respectively. For each fixed set of parameters–ai,t, µ0i , and φi–we calculate the optimal
policy using dynamic programming. We compare the average performance of this optimal policy
to the performance of the greedy policy over 100 sample paths.
00.2
0.40.6
0.81
0
0.2
0.4
0.6
0.8
10.995
1
1.005
1.01
1.015
1.02
1.025
1.03
1.035
a1
λ
Jg /J*
Figure 1 Performance of greedy policy compared to optimal for varying arrival rates.
Figure 1 shows the ratio of the greedy performance to the optimal performance (Jg(s)/J∗(s))
for a range of different arrival rates. As from Section 2, the probability of a patient arrival is
given by λ while the probability an arrival is of patient type 1 is given by a1. Values above 1
show the loss in performance due to using the greedy policy. We can see that the greedy policy
performs within 3% of optimal, which is substantially superior to what the bound in Section 3.2
suggests. In fact, for reasonable arrival rates (λ < .05 means 1 patient arrives every 2 hours) the
performance loss of the greedy policy is less than 1% of optimal. These differences are so small

17
they can essentially be ignored due to possible numerical errors. The greedy policy does not require
arrival rate information and is much simpler to compute than optimal. These simulation results
suggest that using the greedy policy results in little performance loss while significantly reducing
the computational complexity. In fact, while the complexity of the greedy policy grows linearly in
the time horizon, T , and logarithmically in the number of patient types (logM), the complexity of
the optimal policy grows exponentially in a number of problem parameters despite only resulting
in slightly higher performance. The simplicity and good performance of the greedy policy, which
simply prioritizes different patient types, makes it desirable for real-world implementation.
4. Clinical Relevance
Our exposition thus far has treated the problem of prioritizing patients for demand-driven dis-
charges as a purely operational problem. In a nutshell, we have shown that if one desires to minimize
some long run cost metric impacted by demand-driven discharge decisions, then a priority rule
that is ‘greedy’ with respect to the cost metric serves as a reasonable and operationally viable
approximation to an optimal policy.
This section considers clinical issues relevant to the problem at hand. In particular, the clinical
viability of a discharge policy is of paramount importance. In particular, what remains to be spec-
ified are clinically relevant cost metrics and priority rules which capture factors physicians would
like to account for in making discharge decisions. Certainly, the general consensus of the medical
community is that patients should be discharged in order of ‘least critical first’ (see, for instance,
Swenson (1992)). However, what determines criticality is left wide open to interpretation and is
highly dependent on the experience and training of an individual physician. In fact, disagreements
on which patient should be discharged arise frequently and in an effort to building a process around
this critical decision, many hospitals are adopting an intensivist-managed system that makes triage
decisions for all patients in the ICU (Franklin et al. 1990, Task Force of the American College of
Critical Care Medicine 1999). While such a process will remain necessarily subjective, there is a
strong desire that the process be informed by quantitatively designed best-practice recommenda-
tions. In this sprit, we consider several policies that fall within the ethos of a priority rule based
on measures of patient criticality that have been broached in the extant medical literature.
Mortality Risk: A natural measure of patient ‘criticality’ is mortality risk. In fact, the commonly
used APACHE and SAPS severity scores are based on mortality predictions for ICU patients
(Zimmerman et al. 2006, Moreno et al. 2005). While it is obvious that patients with high mortality
risk are ‘critical’ and should not be demand-driven discharged, intensivists are likely to find this

18
measure of criticality too crude to be of value in practical scenarios. To be more precise, one
typically needs to be able to distinguish among patients all with relatively low mortality risk but
variedly long and complex recoveries. In addition, a metric based solely on mortality risk will fail
to capture a system-wide view of the ICU and in particular, the impact a discharge decision for
a given patient might have on the ability to provide timely and quality care for other patients.
Specifically, such a metric fails to account for the impact a discharge decision has on ICU congestion
– congestion in the ICU can result in postponing surgeries, delaying admissions, and/or rerouting
patients to other units–all of which are associated with worse outcomes (Metcalfe et al. 1997,
Mitchell et al. 1995, Smith et al. 1995, Chalfin et al. 2007, Renaud et al. 2009, Rincon et al. 2010).
As such, it is ethically important to consider factors related to congestion in making such decisions.
Readmission Risk: A potential refinement on using simply mortality risk as a measure of patient
criticality is accounting for readmission risk. In fact, measures related to readmission risk have been
gaining attention and credibility in the medical community motivated primarily by two factors:
medical outcomes and payment structures. In terms of medical outcomes, readmitted patients have
been shown to be worse off, with higher mortality and longer length-of-stay (Chen et al. 1998,
Durbin and Kopel 1993, Rosenberg and Watts 2000). Recognizing the clinical risks associated with
readmissions, many hospitals are adopting discharge strategies which account for patient readmis-
sions (Franklin and Jackson 1983, Yoon et al. 2004). In terms of monetary incentives, readmissions
can also increase costs by over 25% (Naylor et al. 2004). Acknowledging the detrimental impact
of readmissions on patient outcomes and the extraordinarily high costs associated with the care of
readmitted patients, the Patient Protection and Affordable Care Act (2010) requires Medicare to
begin reducing readmissions in 2013. While physiology-based probabilistic models for assisting ICU
physicians in making discharge decisions are not widely available, there has been recent interest in
developing risk scores to assess readmission risks, similar to what the APACHE and SAPS scores
do for mortality (Gajic et al. 2008). In this spirit, one may consider several concrete metrics:
A Crude Metric: As a concrete measure of readmission risk, one might consider the likelihood
of readmission. One expects that such a measure will be fairly correlated with a measure of
mortality risk. At the same time, such a measure will move towards addressing some of the pitfalls
of using mortality risk alone. That said, such a measure remains somewhat coarse in two regards:
First, it fails to account for the actual impact of the demand-driven discharge decision itself on
readmission risk; since readmissions might arise due to a multitude of other factors, this is crucial.
Second, it fails to account for the diversity in complications that might occur upon a readmission.

19
A Refinement (Our Proposed Policy): We consider a mild refinement to the above measure
of readmission risk: we consider the increase in readmission load, attributable to a demand-driven
discharge. Roughly speaking, we can think of this refinement as accounting not only for readmis-
sions, but in addition, the typical length of stay upon such a readmission. More precisely, let pNm
and 1/µR,Nm be the probability of readmission and expected readmission LOS of patient class m
given he is naturally discharged. Similarly, let pDm and 1/µR,Dm be the probability of readmission
and expected readmission LOS of patient class m given he is demand-driven discharged. By Chen
et al. (1998), we expect to have pNm < pDm and µR,Nm >µR,Dm . Then the increase in readmission load
attributable to the demand-driven discharge is precisely:
∆-Readmission Load =pR,Dm
µR,Dm
− pR,Nm
µR,Nm
We will in the subsequent sections consider a priority rule that measures patient criticality via
the ∆-Readmission Load score. In addition to fitting in with the ethos of a priority rule that
can be interpreted as a criticality measure, we see that this rule is consistent with assuming, in
the notation of the previous Sections, a one period cost-function C(s,A) that corresponds to the
increase in readmission load due to the demand-driven discharge decision. In the appendix, we
show that such a cost metric is also explicitly aligned with the desire to avoid a loss of throughput
due to congestion effects.
Other Measures of Criticality: While we have outlined the two broad criticality measures one
might consider in the medical community, yet other measures have been proposed in the operations
research community. In particular, Dobson et al. (2010) considers prioritizing patients based on
a patients expected length of remaining stay. Unfortunately, this is a fairly difficult quantity to
estimate and as such models to predict this quantity are also unavailable. For completeness, we
will also consider this measure in our empirical investigation.
5. Empirical Data
The goal of this section is to calibrate a model from real data that will permit us to compare
the clinically relevant policies discussed in the preceding section. We analyze patient data from 7
different private hospitals for a total of 5,398 patients who completed at least one ICU visit.
Patient Classes: Our first goal is to classify patients into a small number of groups, each of
which is defined on the basis of physiological variables. There are may ways of doing this, and we
chose a method that is aligned with the current process design philosophy of the hospital system
from which the data for this study was obtained. In particular, we classified patients into 5 different

20
classes based on the Kaiser Permanente Inpatient Risk Adjustment Score (see Escobar et al. (2008))
which is a severity score used to predict the likelihood of death. These severity scores are based
on a number of different factors including age, primary condition (cardiac, pneumonia, GI bleed,
seizure, cancer, etc.), lab results obtained 72 hours prior to hospital admission, chronic ailments
(diabetes, kidney failure, etc.), etc. They are quite similar to the well studied APACHE and SAPS
scoring systems (for instance, the c statistic for this score is in the 0.88 range) with the important
addition that they incorporate additional physiological information obtained for patients in this
particular hospital system within a short time prior to their being admitted to the hospital (that
APACHE or SAPS scores would not assume available). Like scoring rules of this type, the severity
scores we use to classify patients may be interpreted as a mortality risk figure. This severity score is
used in the hospital system we study, while the APACHE and SAPS scores are not available to us.
We quantize these severity scores into one of five different bins of equal size. Table 1 summarizes
the severity scores for the 5 patient classes as well as the percentage of survivors. It is important
to note that we only use these scores as a convenient and clinically interpretable way of classifying
patients. We do not use the severity score of a patient for the purposes of predicting mortality,
length of stay, probability of readmission and so-forth; rather, we directly estimate all of these
factors from data.
Patient Class Range for predicted mortality # data points % survivors
1 [0,.0048) 1089 99.5%2 [.0048,.0148) 1084 97.0%3 [.0148,.039) 1097 94.7%4 [.039,.1025) 1067 91.8%5 [.1025,1) 1061 85.4%
Table 1 Patient Classes
ICU Occupancy Levels: Our data set indicates the utilization of the ICU upon patient
discharge. We define the ‘near capacity’ or ‘full’ state as when the ICU occupancy level is at least
75% of its maximum. If the ICU occupancy is less than 75% of maximum, we say the ICU is in
the ‘low’ state. This characterization is similar to that in Kc and Terwiesch (2011) and acceptable
from a medical perspective.
Sampling Bias: Our study rests on the assumption that the statistics governing a patient’s
length-of-stay in the ICU, the likelihood of their death, the likelihood of their readmission and the
lengths of any subsequent visits depend solely on their health condition as summarized by their
Kaiser Permanente Inpatient Risk Adjustment Score, and whether or not they were discharged
21
from a full ICU. Since we are interested in isolating the impact of demand-driven discharge to
accommodate new patients on patient length-of-stay statistics and the likelihood of readmission, it
is important to check that the distribution of severity scores for patients in the group of patients
discharged from a full ICU is close to that of patients discharged from an ICU in the low state.
To this end, we use the Kolmogorov-Smirnov two-sample test (see Smirnov (1939) and related
references), which is the continuous version of the chi-squared test. For each pair of ICU occupancy
levels (Full versus Low), we compare the empirical distributions of severity using the Kolmogorov-
Smirnov test to see if the samples come from the same distribution. We find that with significance
level of 1%, the samples do come from the same distribution. Hence, we conclude with high prob-
ability, that the ICU occupancy level parameter and the severity scores of data points in our data
set are independently distributed.
To summarize, a data point in our data set can be expressed as a tuple of the form
(S,D, (L1,F1), (L2,F2), . . . , (Lk,Fk)) where S is a severity score, D is an indicator of patient death
during hospital stay, Ln is the patient length-of-stay on his nth visit to the ICU in the episode and
Fn is an indicator for whether the ICU was full upon his nth discharge.
5.1. Estimation
We first estimate the probability of death for patients discharged from a low versus full ICU. We
estimate the nominal probability of death, P(D|Low)m, using the fraction of patients who were
discharged from a low occupancy ICU and died during the same hospital stay.
P(D|Low)m =
∑i 1{Di=1}1{F i1=0}1{Si∈m}∑
i 1{F i1=0}1{Si∈m}.
where {F i1 = 0} is the event that the ICU occupancy level was low upon discharge of patient i from
his first ICU discharge and {Si ∈m} is the event that the severity score of patient i defines him as
class m. Similarly, we can calculate the probability of death when discharged from a full ICU.
P(D|Full)m =
∑i 1{Di=1}1{F i1=1}1{Si∈m}∑
i 1{F i1=1}1{Si∈m}.
Table 2 summarizes the estimated probabilities of death for each patient class along with the 95%
confidence interval for these estimates.
We notice that it is difficult to discern any substantial impact of a demand-driven discharge on
mortality. This is not particularly surprising: while there exist studies which suggest that demand-
driven discharges increase mortality rates (for example (Chrusch et al. 2009)), there are others
which find that mortality risks are not predicted by occupancy levels (Iwashyna et al. 2000).

22
Patient # data P(D|Low) [95% CI] # data P(D|Full) [95% CI]Class points points
1 739 .005 [.000,.010] 350 .003 [.000,.009]2 682 .022 [.011,.033] 402 .017 [.004,.030]3 679 .059 [.041,.077] 418 .043 [.024,.062]4 669 .079 [.059,.099] 398 .088 [.060,.116]5 621 .167 [.138,.196] 440 .116 [.086,.146]
Table 2 Mortality: probability of death when patients naturally depart and when patients are demand-driven
discharged.
Our estimator for the nominal length-of-stay (LOS) for patient type m, is simply the empirical
average
µ(LOS0low)m =
∑iL
i11{F i1=0}1{Si∈m}1{Di=0}∑
i 1{F i1=0}1{Si∈m}1{Di=0}.
where {F i1 = 0} is the event that the ICU occupancy level was low upon discharge of patient i from
his first ICU discharge and {Si ∈m} is the event that the severity score of patient i defines him
as class m. Similarly σ(LOS0low)m is an empirical standard deviation. Note that when calculating
LOS, we exclude patients who died. This is common practice in the medical community because
various factors, such as Do-not-resuscitate orders can skew LOS estimates for patients who die
(Norton et al. 2007, Rapoport et al. 1996).
We also calculate the fraction of these patients who return to the ICU during the same hospital
stay to calculate a nominal probability of readmission, P(R|Low)m. These readmitted patients
relapse due to numerous medical reasons unrelated to being discharged; the discharge is likely to
be a natural departure as there is no need to discharge patients in order to accommodate new ones
when the ICU occupancy level is low and there are available beds. Thus,
P(R|Low)m =
∑i 1{Li2>0}1{F i1=0}1{Si∈m}∑
i 1{F i1=0}1{Si∈m}.
where {Li2 > 0} denotes the event that patient i was readmitted.
Finally, of patients readmitted to the ICU from among those initially discharged from a non-full
ICU, we compute an estimate of their expected length-of-stay upon readmission, according to:
µ(LOSRlow)m =
∑iL
i21{F i1=0}1{Li2>0}1{Si∈m}1{F i2=0}1{Di=0}∑
i 1{F i1=0}1{Li2>0}1{Si∈m}1{F i2=0}1{Di=0}.
where {F i2 = 0} denotes the event that patient i was discharged from a low occupancy ICU upon
his second ICU discharge. Again, we exclude patients who died in this estimation. Notice that
µ(LOSRlow)m is an estimate of patient length-of-stay upon readmission when the readmission is due
23
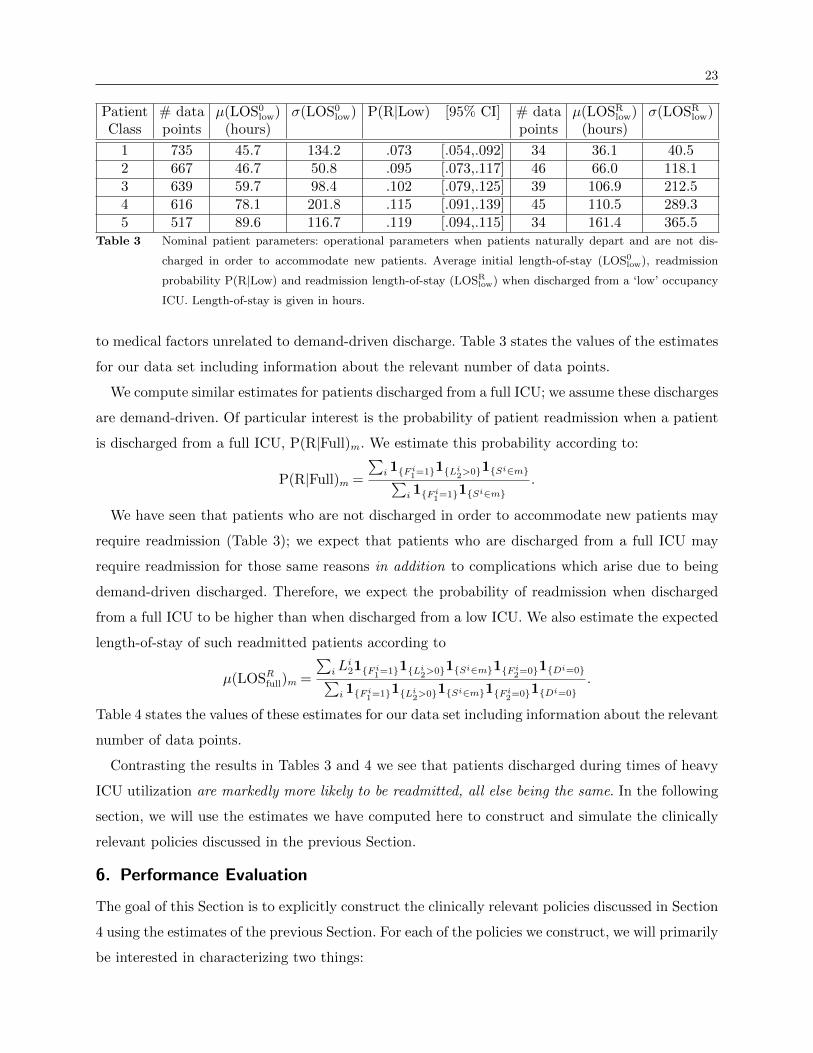
Patient # data µ(LOS0low) σ(LOS0
low) P(R|Low) [95% CI] # data µ(LOSRlow) σ(LOSR
low)Class points (hours) points (hours)
1 735 45.7 134.2 .073 [.054,.092] 34 36.1 40.52 667 46.7 50.8 .095 [.073,.117] 46 66.0 118.13 639 59.7 98.4 .102 [.079,.125] 39 106.9 212.54 616 78.1 201.8 .115 [.091,.139] 45 110.5 289.35 517 89.6 116.7 .119 [.094,.115] 34 161.4 365.5
Table 3 Nominal patient parameters: operational parameters when patients naturally depart and are not dis-
charged in order to accommodate new patients. Average initial length-of-stay (LOS0low), readmission
probability P(R|Low) and readmission length-of-stay (LOSRlow) when discharged from a ‘low’ occupancy
ICU. Length-of-stay is given in hours.
to medical factors unrelated to demand-driven discharge. Table 3 states the values of the estimates
for our data set including information about the relevant number of data points.
We compute similar estimates for patients discharged from a full ICU; we assume these discharges
are demand-driven. Of particular interest is the probability of patient readmission when a patient
is discharged from a full ICU, P(R|Full)m. We estimate this probability according to:
P(R|Full)m =
∑i 1{F i1=1}1{Li2>0}1{Si∈m}∑
i 1{F i1=1}1{Si∈m}.
We have seen that patients who are not discharged in order to accommodate new patients may
require readmission (Table 3); we expect that patients who are discharged from a full ICU may
require readmission for those same reasons in addition to complications which arise due to being
demand-driven discharged. Therefore, we expect the probability of readmission when discharged
from a full ICU to be higher than when discharged from a low ICU. We also estimate the expected
length-of-stay of such readmitted patients according to
µ(LOSRfull)m =
∑iL
i21{F i1=1}1{Li2>0}1{Si∈m}1{F i2=0}1{Di=0}∑
i 1{F i1=1}1{Li2>0}1{Si∈m}1{F i2=0}1{Di=0}.
Table 4 states the values of these estimates for our data set including information about the relevant
number of data points.
Contrasting the results in Tables 3 and 4 we see that patients discharged during times of heavy
ICU utilization are markedly more likely to be readmitted, all else being the same. In the following
section, we will use the estimates we have computed here to construct and simulate the clinically
relevant policies discussed in the previous Section.
6. Performance Evaluation
The goal of this Section is to explicitly construct the clinically relevant policies discussed in Section
4 using the estimates of the previous Section. For each of the policies we construct, we will primarily
be interested in characterizing two things:

24
Patient # data µ(LOS0full) σ(LOS0
full) P(R|Full) [95% CI] # data µ(LOSRfull) σ(LOSR
full)Type points (hours) points (hours)
1 349 54.3 138.9 .086 [.057,.115] 9 61.4 71.82 395 51.7 54.1 .109 [.079,.140] 16 112.0 200.23 400 59.4 79.3 .120 [.089,.151] 17 99.6 86.84 363 62.8 68.1 .136 [.102,.170] 17 175.7 375.15 389 92.7 138.2 .132 [.100,.164] 17 237.1 577.8
Table 4 Demand-driven discharged patient parameters: operational parameters when patients are discharged in
order to accommodate new patients. Average initial length-of-stay (LOS0full), readmission probability
P(R|Full) and readmission length-of-stay (LOSRfull) when discharged from a ‘full’ ICU. Length-of-stay is
given in hours.
Mortality: This is a first order measure of the clinical impact of any demand-driven discharge
practice. Given our discussion in Section 4, one would hope that any of the clinically relevant
discharge policies considered there results in effectively equivalent mortality rates. If this were not
the case, this would be cause to question the clinical viability of the policies.
Measures of Access: Assuming that two given policies possess similar mortality rates, one may
be concerned about finer grained measures of performance. An important issue raised in Section 4
– and indeed a focus of this paper and recent healthcare reform –was that of access. It is crucial
that the demand-driven discharge policies employed ensure equitable and maximal access to ICU
resources while of course, ensuring no sacrifice in terms of mortality rates. In fact, it is entirely
within reason that these two goals are aligned as opposed to being at odds with each other.
We next specify each of the policies discussed qualitatively in Section 4:
Mortality Risk ‘P(D)’: Under this policy, if a demand-driven discharge is called for, one
selects a patient from the class with the smallest probability of death, P(D), of the patients currently
in the ICU. Table 2 calibrates these figures for patients in our data set. This translates to the order
1,2,3,4,5.
Readmission Risk I ‘P(R)’: Under this policy, one selects a patient from the class with
the smallest nominal probability of readmission, P(R), of the patients currently in the ICU. In
particular, given the estimates from our data set reported in Table 3, this translates to the order
1,2,3,4,5.
Readmission Risk II ‘∆-Load’: This policy, which as discussed earlier, is a refinement of
the readmission risk metric above, has been a focal point of our study. We can estimate the increase
in readmission load for a given patient class, m, as the quantity
P(R|Full)mµ(LOSRfull)m−P(R|Low)mµ(LOSRlow)m.
Using the data from Tables 3 and 4, this translates to the priority order 3,1,2,4,5.

25
Remaining Length-of-stay ‘LOS’: Under this policy, one selects a patient from that class
with the smallest remaining length-of-stay. As such this is not a static index rule. In particular,
one needs to compute, for a patient of class m that has been in the ICU for time t, the quantity
E[LOS0low|LOS0
low ≥ t], and prioritize patients in increasing order of this quantity. In our simulations,
we give this policy more power and assume the realization for ICU LOS is known as soon as a
patient begins ICU care. This policy is analyzed in Dobson et al. (2010) albeit for a model that is
agnostic to readmission loads.
Table 6 summarizes the first three policies. It is interesting to note that of the first three policies,
all three policies choose to protect patients of types 4 and 5 from a demand-driven discharge.
These are patients with relatively higher mortality risk, and as such this is a desirable feature.
Interestingly, the ∆-Load policy differs from the first two in how it prioritizes the first three patient
classes which have low mortality risk. This allows for the following interpretation of the ∆-Load
policy – it ensures that patients with high mortality risk are the least likely to be subject to a
demand-driven discharge while carefully prioritizing among patients with low mortality risk to
account not only for the likelihood they would have to be readmitted as a consequence of the
discharge, but also the extent of the care they might require if such a readmission were to occur.
Patient Nominal Nominal ∆-ReadmissionType P(D) P(R) Load (hours)
1 .005 .073 2.652 .022 .095 5.943 .059 .102 1.054 .079 .115 11.195 .167 .119 12.09
Table 5 Estimated Policies
We consider the following simulation setup: We assume a time horizon of 1 week where admission
and discharge decisions are made every 6 minutes, or 10 times within an hour and consider an ICU
with B = 10 beds. While these decisions may in reality occur on a continuous basis, patient transfers
are not instantaneous and the granularity of 6 minutes per hour is fine enough to emulate an
actual ICU. Discharge policy simulations are over 1,000 sample paths each. We use the parameters
estimated in Table 6 for nominal length-of-stay, probability of death, probability of readmission, and
change in expected readmission load. A patient’s nominal length-of-stay is log-normally distributed.
We vary the probability of an arrival, λ between 0 and 0.021 (i.e. between 0 and 5 arrivals on
average every 24 hours). An arrival rate λ= .021 corresponds to 5 patient per day, i.e. a turnover

26
of 1/2 the beds in the ICU each day which is about the highest load seen in the ICU. We use a
uniform traffic mix across patient classes, which is consistent with the empirical data. We note
that in this numerical study, we do not include diversions and disease progression as patient data
required to develop these models is fairly limited. For instance, Gajic et al. (2008) is one of the few
existing works that try to predict readmission risks and it is a static model. We leave such studies
for future research as more patient data becomes available. We now report on the two issues we
set out to examine, namely mortality and patient access.
6.1. Mortality Rates
We compare the number of deaths per week under the various discharge policies. We consider an
arrival rate of 2.5 patients per day, which corresponds to the load an average hospital could expect
to a 10 bed ICU. In column (a) of Table 6 we compare the number of deaths per week using the point
estimates of P(D|Full) and P(D|Low) given in Table 2. We also consider the following robustness
check using the confidence intervals computed for our class specific mortality rate estimates: we
consider that the various probabilities (namely, P(D|Full)m and P(D|Low)m) each take on one of
their upper or lower confidence limits, and consider all the 210 resulting parameter combinations.
We conduct a separate simulation for each of these parameter combinations, and report for each
discharge policy the lowest and highest mortality rates across parameter combinations. The results
are summarized in Table 6. We can see that using both the point estimates, as well as under our
robustness check, all three policies are remarkably similar.
(a) (b) (c)Policy # Deaths Min. # Deaths Max. # Deaths
∆-Readmission Load 1.014 0.751 1.325P(Death) & P(Readmission) 1.004 0.764 1.332Shortest Remaining LOS 1.022 0.740 1.303
Table 6 Weekly Mortality Rate using (a) point estimates (b) the combination over the 95% confidence intervals
with the lowest rate and (c) the combination over the 95% confidence intervals with the highest rate.
We next consider a further robustness check assuming that, in fact, the probability of death
upon being demand-driven discharged is substantially increased (beyond the value estimated in the
data) – we set the probability of death for a demand-driven discharged patient 10%,20%,30%,40%,
and 50% higher than the estimated probability of death for that patient class given in Table 2.
We compare the relative increase (decrease) in the number of deaths compared to the proposed
27
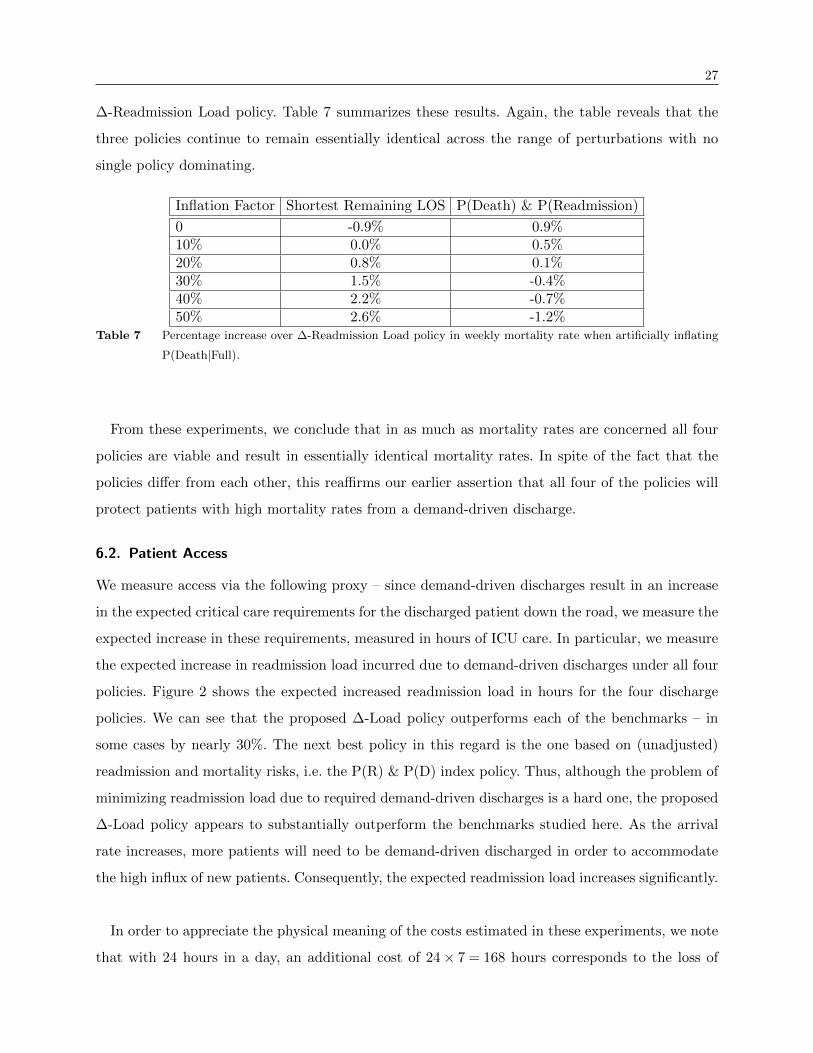
∆-Readmission Load policy. Table 7 summarizes these results. Again, the table reveals that the
three policies continue to remain essentially identical across the range of perturbations with no
single policy dominating.
Inflation Factor Shortest Remaining LOS P(Death) & P(Readmission)
0 -0.9% 0.9%10% 0.0% 0.5%20% 0.8% 0.1%30% 1.5% -0.4%40% 2.2% -0.7%50% 2.6% -1.2%
Table 7 Percentage increase over ∆-Readmission Load policy in weekly mortality rate when artificially inflating
P(Death|Full).
From these experiments, we conclude that in as much as mortality rates are concerned all four
policies are viable and result in essentially identical mortality rates. In spite of the fact that the
policies differ from each other, this reaffirms our earlier assertion that all four of the policies will
protect patients with high mortality rates from a demand-driven discharge.
6.2. Patient Access
We measure access via the following proxy – since demand-driven discharges result in an increase
in the expected critical care requirements for the discharged patient down the road, we measure the
expected increase in these requirements, measured in hours of ICU care. In particular, we measure
the expected increase in readmission load incurred due to demand-driven discharges under all four
policies. Figure 2 shows the expected increased readmission load in hours for the four discharge
policies. We can see that the proposed ∆-Load policy outperforms each of the benchmarks – in
some cases by nearly 30%. The next best policy in this regard is the one based on (unadjusted)
readmission and mortality risks, i.e. the P(R) & P(D) index policy. Thus, although the problem of
minimizing readmission load due to required demand-driven discharges is a hard one, the proposed
∆-Load policy appears to substantially outperform the benchmarks studied here. As the arrival
rate increases, more patients will need to be demand-driven discharged in order to accommodate
the high influx of new patients. Consequently, the expected readmission load increases significantly.
In order to appreciate the physical meaning of the costs estimated in these experiments, we note
that with 24 hours in a day, an additional cost of 24× 7 = 168 hours corresponds to the loss of

28
0 1 2 3 4 5 60
20
40
60
80
100
120
140
160
180
Average # Arrivals/day
Incr
ease
d R
eadm
issi
on L
oad
(hou
rs)/
wee
k
Remaining LOS PolicyP(D) & P(R) Policy∆−Load Policy
Figure 2 Performance of proposed index policy compared to benchmarks for various arrival rates and distribution
across patient types according to the proportions seen in the empirical data.
an entire bed for 1 week since it will be occupied by readmitted patients. What we see is that
for 5 patient arrivals per day, the ∆-Load policy incurs readmission load that is 13.5 hours lower
than the next best policy (the P(D) & P(R) policy) which corresponds to the loss of a single ICU
bed (in a 10 bed ICU) for a little more than half a day per week. Over the course of a year this
corresponds to a free ICU bed for nearly a whole month. The savings relative to the LOS index
policy are higher. Finally, in light of our study on mortality rates, these difference in performance
do not come at the cost of increased mortality.
In conclusion, we have observed the following:
Mortality: All four policies we considered at the outset in Section 4 result in essentially identical
mortality rates. We have verified this fact across multiple ‘robustness’ checks. We attribute this to
an attractive feature common to the first three policies, namely the fact that patients with high
mortality risk are protected from a demand-driven discharge.
Access: In terms of access (or equivalently, increase in ICU load incurred due to demand-driven
discharges) the policies are quite dissimilar. The ∆-Load policy (that has been a focal point in
this paper) provides the greatest access. We attribute this to the fact that the policy carefully
prioritizes among patients with low mortality risk.
As such, we believe that the ∆-Load policy might serve as a useful guide to intensivists priori-
tizing demand-driven discharge decisions among patients medically fit for discharge.
29
7. Conclusion
Faced with the need to accommodate an acute, newly admitted patient, a clinician may select from
among patients currently in the ICU, a relatively ‘stable’ patient for transfer to a less richly staffed
hospital unit. A patient so discharged from the ICU faces risks of physiological deterioration that
may ultimately require readmission to the ICU. This is, of course, not an ideal situation either from
an efficiency standpoint or the standpoint of ideal patient outcomes. The present work studied the
feasibility of developing a decision support tool to aid clinicians in these difficult decisions. We
have attempted to gauge the value of such a support tool using a large patient flow data set and
quantified this value in terms of potential reductions in readmitted patient load.
The model we have developed revolves around simple estimates of the cost associated with a
demand-driven patient discharge. We examine a number of clinically relevant cost metrics including
mortality and readmission risks. We focus on a measure of readmission risk which incorporates the
likelihood of readmission in addition to the complexity of the readmission: change in readmission
load. We estimated our model from actual patient-flow data. Given our model, we developed a
simple index based policy to serve as a decision support tool to a physician making the aforemen-
tioned discharge decisions. Our support tool is, by its structure, easy to implement from a clinical
standpoint, and highly robust to estimation errors. The latter point is well reflected in our empir-
ical study. Our study suggests that implementation of our support tool could result in substantial
reductions in readmitted patient load without sacrificing mortality even under modest assumptions
on patient traffic, at least in the context of the hospital system from which we collected the data for
the study. While the Kaiser Permanente Inpatient Risk Adjustment Score has been shown to have
similar predictive power as the widely used SAPS and APACHE scores (Escobar et al. 2008), the
value of our approach has not been established for these other severity scores. This represents an
interesting avenue for future empirical investigation. It is remarkable that our model demonstrates
benefits despite (from a clinical standpoint) being relatively simple–for example, it does not include
diagnostic or physiologic data available at the time that a patient was discharged.
This work suggests several future potential research directions, including:
1. Developing more complex predictive models of patient dynamics that recognize the evolution
of patients over the course of their stay. We believe that the present study is sufficient motivation
to collect data that would allow us to identify such a model. Such data could be employed to assign
patients a “readiness for discharge” severity score similar in concept to other existing severity of
illness scores. This is also key to practical deployment of a decision support tool.

30
2. It would be interesting to understand the impact of a demand-driven discharge on other
quantities of interest, particularly metrics measuring quality of life impact.
3. Theoretically, we have shown that our index policy is optimal in certain regimes and guaran-
teed to incur readmission loads of no greater that a factor of (ρ+1) of an optimal policy in general.
It would be interesting to understand traffic regimes where this bound could be made tighter –
this is, of course, a somewhat secondary pursuit but nonetheless very interesting from a theoretical
perspective.
4. It would be interesting to initiate a study of ICU admissions so as to move towards a more
holistic view of equitable and optimal allocation of hospital resources.
Appendix
A. Greedy Sub-Optimality
Consider the case with B = 2 beds and a time horizon of T = 2. There are 2 patient types, i∈ {1,2}.
The parameters for each patient type are as follows for some small ε > 0:For i= 1: µ0
1 = 1/2, φ1 = 1For i= 2: µ0
2 = 1, φ2 = 1− ε
Therefore, patient type 1 has nominal expected length-of-stay of 2 and cost of 1. Similarly, patient
type 2 has nominal expected length-of-stay of 1 and cost of 1− ε.
Consider an initial state at t= 0 such that there exists 2 ICU patients: one of each type. Hence,
x0,1 = 1 and x0,2 = 1. Also, a new patient of type 1 arrives at t = 0 and t = 1, i.e. y0,1 = y1,1 = 1
while y0,2 = y1,2 = 0.
At t= 0, there are already 2 patients in the ICU, and a new patient arrives. Therefore, a current
patient must be discharged in order to accommodate the new patient. The greedy policy discharges
patient type 2 at t= 0 because its cost is less than that of patient type 1. This comes at a cost of
1−ε. Now, with this demand-driven discharge and the admission of the new patient there are 2 type
1 patients occupying the ICU. With probability 1/4 neither type 1 patient completes service and
departs by t= 1 and with the second new arrival, a patient must be discharged to accommodate
this new arrival at a cost of 1. With probability 3/4 at least one of the type 1 patients completes
service prior to the second new arrival and no demand-driven discharge is required at t= 1. Hence,
the expected cost of the greedy policy is 1− ε+ 1/4 = 5/4− ε.
On the other hand, the optimal policy recognizes that patient type 2 has a very short length-
of-stay and decides not to discharge this patient at t = 0. Instead the optimal policy discharges
patient type 1 to accommodate the new patient, incurring a cost of 1. Now with this demand-driven
discharge and the admission of the new patient, there is one type 1 patient and one type 2 patient

31
occupying the ICU. At the end of time slot t= 0, the type 2 patient completes service and departs
naturally with probability 1. Regardless of whether the type 1 patient departs naturally, when
the second new arrival comes at t= 1, it can immediately be accommodated without requiring a
demand-driven discharge of a current patient. Hence, the expected cost of the optimal policy is 1.
Taking ε→ 0 we see that J∗(s0)≤ 45Jg(s0) here.
B. A Connection with Throughput
Here we make precise the connection with throughput maximization when the cost metric of
interest is the ∆-Readmission Load associated with a demand-driven discharge. We consider a
stylized model of the ICU which accounts for patient readmissions. Patients who are naturally
discharged require ICU readmission with probability 0. Patients who are demand-driven discharged
are readmitted to the ICU with probability pm and have readmission LOS which is exponentially
distributed with mean 1/µRm. Hence, the cost associated with a demand-driven discharge of patient
type m, is the ∆-Readmission Load:
C(s,m) =pmµRm
Consider an ICU with C beds. We consider the following setup:
1. B beds are reserved for first-time arrivals with C −B , B′ beds reserved for readmissions.
Any reference to ‘state’ will be understood to correspond to the occupants of these B beds and we
will consequently employ the notation in Section 2.
2. The readmission queue is served according to a first-in-first-out discipline.
3. In the event that B beds are occupied by first-time visitors, a new arrival will prompt a
‘demand-driven’ discharge according to a stationary policy π that monitors the state of the B-beds
reserved for first-time arrivals.
Note that readmitted patients cannot be demand-driven discharged. The rationale for this is
natural: Readmitted patients are typically much worse off and have higher mortality rates and
longer lengths-of-stay. This is well established in the medical literature (see Chen et al. (1998),
Durbin and Kopel (1993), Snow et al. (1985) among others). As such, subjecting such patients to
a demand-driven discharge is likely to be highly undesirable from a practitioners perspective. In
addition, the policy that prioritizes patients should a demand-driven discharge be required may
only consider the state of the B beds reserved for first time arrivals; one may dispense with this
restriction, but doing so is beyond our scope here.
Given a vector λ ∈ [0,1]M defined so that λat,m , λm for all m (assuming time homogenous
rates), we will refer to a policy π as stabilizing for λ if, under this policy the readmission queue is

32
stable. More precisely, we require the sequence of waiting times {Wn} experienced by patients in
the readmission queue (a waiting time is defined in the usual sense as the time between entry into
the readmission queue and the time before service begins), has a sub-sequence that converges to a
random variable W that is a.e. finite.
Now, let us denote by the sequence Tn the interarrival time between the nth and (n + 1)st
entry to the readmission queue, and by Sn, the service time required by the nth patient. Assume
moreover that no demand-driven discharges occur in the absence of a need for one, i.e. π(s) = 0 if
s /∈ {(x, y) :∑
m x(s)m+y(s)m =B+1,∑
m y(s)m = 1}, Sfull (Recall again, that s here corresponds
to the state of the B beds reserved for first-time admissions). Then, Tn is simply the time between
the nth and (n + 1)st visit to a state in the set Sfull while Sn is a Geometric (µRπ(sn)) random
variable with probability pπ(sn) (where sn corresponds to the state of the B beds for first-time
arrivals upon the nth discharge) and 0 with the remaining probability. Now, if s0 ∼ νπ, then it is
not hard to see that {Tn, Sn} is a stationary process. The process is also ergodic; a consequence
of the ergodicity of the Markov chain induced by π. A classical result of Loynes (Theorem 8 of
Loynes (1963)) then establishes that the readmission queue is stable if E[T0]>E[S0]/(C−B), and
unstable if E[T0]<E[S0]/(C −B). Now, elementary arguments (see Durrett (1996)) can be used
to show that E[T0] = 1/∑
s∈Sfullνπ(s) and E[S0] =
∑s∈Sfull
νπ(s)C(s,π(s))/∑
s∈Sfullνπ(s). In other
words, we have that the readmission queue is stable if
κπ <C −B,
and unstable if κπ > C − B, so that minimizing κπ maximizes throughput which motivates the
problem that is the focus of our study.
In addition, the following theorem shows that heuristics for the problem of minimizing long run
readmission costs incur a proportionate ‘dilation’ of the set of arrival rate profiles that will result
in stable readmission queues. In particular, let λ be a vector of arrival rates that is in the interior
of the throughput region for our model. By this we understand that there exists a demand-driven
discharge policy π∗λ under which the readmission queue is stable when the arrival rate vector is λ,
and moreover there exists an ε > 0 such that the arrival rate vector λ(1 + ε) can also be stabilized.
Let us denote by π∗αλ a policy minimizing κπ for the arrival rate vector αλ where α∈ (0,1]. Finally,
let παλ be a possibly sub-optimal demand-driven discharge policy for the arrival rate αλ satisfying
κπαλ/κπ∗αλ ≤ 1/α. We have:
Theorem 5. Assuming an arrival rate vector αλ, the readmission queue is stable under the
demand-driven discharge policy παλ.

33
Proof: Let us denote by π∗αλ (respectively π∗λ) a policy minimizing κπ in a system with arrival
rate vector αλ (respectively λ). Now consider the following sub-optimal policy for an arrival rate
αλ: we simulate arrivals of ‘fictitious’ patients, so that the net stream of patients (both actual and
fictitious) has arrival rate λ. To this system we apply policy π∗λ. Now by construction, a discharge
under this policy will correspond to the discharge of an actual patient with probability α; with the
remaining probability, the discharge will be one of a fictitious patient and incur no costs. It thus
follows that this sub-optimal policy incurs a cost of precisely ακπ∗λ . Moreover, since it is sub-optimal
for the arrival rate vector αλ, it must be that
κπ∗αλ ≤ ακπ
∗λ .
It follows that
κπαλ ≤ (1/α)κπ∗αλ ≤ κπ
∗λ .
But given the fact that λ was in the interior of the stability region, it must be (by our earlier
argument that showed κπ∗αλ ≤ ακπ∗λ) that κπ
∗λ < C − B∗, so that κπα < C − B∗, from which the
claim follows. �
We have demonstrated a stationary policy πg satisfying, for a given arrival rate vector λ,
κπg/κπ
∗λ ≤ 1/(1 + ρ) where ρ was a measure of utilization. It follows that should the readmission
queue be unstable under πg, then it will remain unstable for any arrival rate vector that strictly
dominates (1 + ρ)λ under any stationary discharge policy. In other words, the use of the πg policy
will correspond to a dilation of the throughput region by a factor corresponding to the approxi-
mation guarantee we have established.
C. Miscellaneous Technical Proofs
Proof of Theorem 1: We will, without loss, consider states s at which all feasible actions
require the demand-driven discharge of a current patient (who has not yet completed treatment);
i.e.∑
m x(s)m = B and y(s) 6= 0. For the sake of a contradiction, we will assume that under any
optimal policy π∗, π∗(s) /∈ arg minm:x(s)m>0 φm, i.e. the patient selected for the demand-driven
discharge under any optimal policy is not among the set of patient types that minimizes one-period
costs at state s. For notational convenience, we take π∗(s) = j, and i= πg(s)∈ arg minm:x(s)m>0 φm.
Thus, by assumption we have that
J∗(s) =C(s, j) +E [J∗(S(s, j))]<C(s, i) +E [J∗(S(s, i))] . (C1)
Now, let si = S(s, j), and sj = S(s, i). We may assume that x(si)k = x(sj)k∀k 6= i, j. Moreover,
since C(s, i) < C(s, j), we have 1/µ0i ≥ 1/µ0
j so that we may couple sample paths in the system

34
which used the optimal policy in state s (demand-driven discharged patient j) with the system
which used the greedy policy at state s (demand-driven discharged patient i) so that patient i
finishes service and departs in the epoch subsequent to t(s) in the former system only if j finishes
service and departs naturally in that same epoch in the latter system. Thus, in time slot t(s) + 1
we have either that: (i) x(si)i − x(sj)i = 1 and x(sj)j − x(si)j = 0, (ii) x(si)i − x(sj)i = 0 and
x(sj)j − x(si)j = 0 or (iii) x(si)i− x(sj)i = 1 and x(sj)j − x(si)j = 1. In case (i), Lemma 1 implies
that J∗(si)≥ J∗(sj). In case (ii), we clearly have J∗(si) = J∗(sj) since si = sj.
Let us consider case (iii), which says that neither patient i nor j have departed by time slot
t(s) + 1. We couple the systems starting at states si and sj so that they see identical arrivals and
identical service times (departures) for the patients they have in common. Moreover, we couple the
service times of the additional type i patient in the si system and the additional type j patient
in the sj system as follows: If after any required demand-driven discharges in a particular time
step, patient i and j both remain in their respective systems, patient j will complete/depart with
probability µ0j . If patient j departs, patient i will depart in the same time step with probability
µ0i /µ
0j ; if patient j does not complete, then neither will patient i. If only one of i or j are present,
they will complete with probability µ0i and µ0
j respectively.
Now let us consider using the following sub-optimal policy for the system starting at state sj:
we assume that the additional type j patient is in fact a type i patient, and apply the optimal
policy for this transformed state. If at some point the type j patient completes service naturally,
we choose to register this departure with probability µ0i /µ
0j , and with the remaining probability
assume a ‘virtual’ additional type i patient that will complete service in subsequent periods with
probability µ0i . If at some point the discharge policy chooses the additional type j patient (which
it regards as a type i patient) for the demand-driven discharge, we charge ourselves C(s, j) (notice
that this may occur after the actual patient has already departed and correspond to the demand-
driven discharge of the virtual patient), so that the costs incurred here are certainly higher than
under an optimal policy for the sj system. Call this policy π′. We use the optimal policy in the si
system.
Let pi be the probability that the additional type i patient will have to be demand-driven dis-
charged in the si system. Now we have that J∗(si) = C+ piC(s, i) where C is the total readmission
costs incurred for patients excluding the additional type i patient. Notice that under our coupling,
Jπ′(sj) = C+ piC(s, j) = J∗(si)+ pi[C(s, j)−C(s, i)]. Consequently, we have that J∗(sj)−J∗(si)≤
pi(C(s, j)−C(s, i)).

35
Cases (i), (ii), and (iii) together yield E[J∗(S(s, i))− J∗(S(s, j))]≤ C(s, j)−C(s, i) which con-
tradicts (C1) (since C(s, i) 6=C(s, j)) and yields our result. �
Proof of Lemma 1: Consider a coupling of the systems starting at state s and s′ wherein
both systems witness identical sample paths for patient arrivals and identical service times for the
patients they have in common. More precisely, assuming that at time t, the systems are in states st
and s′t respectively, the patients who arrive in both systems are coupled so that y(st) = y(s′t). Let
z(st) and z(s′t) be the patient vectors in both systems after these arrivals and any potential demand-
driven discharges. Then the number of service completions in both systems over the remainder of
the tth epoch are coupled as follows: If z(st)m ≥ z(s′t)m, then the number of patients of type m that
finish service and depart naturally from the s′ system is given by the Binomial-(z(s′t)m, µ0m) random
variable X ′t,m while the number of patients of type m that finish service and depart naturally
from the s system is given by X ′t,m +Zt,m where Zt,m is a Binomial-(z(st)m− z(s′t)m, µ0m) random
variable. A symmetric situation must hold if z(s′t)m ≥ z(st)m.
Now assume that the system starting at s uses an optimal policy whereas the system starting at
state s′ ‘mimics’ the actions of the s system (call this policy π), so that if the s system chooses to
demand-driven discharge a patient of a particular type, the s′ system will also choose to discharge a
patient of that type should such a patient be available, whether or not this demand-driven discharge
is called for (i.e. whether or not a new patient has arrived and there are no available beds). In
the event that the s′ system needs to make a demand-driven patient discharge and the s system
either does not need make a demand-driven discharge or else selects to demand-driven discharge a
patient of a class not available in the s′ system, the s′ system discharges a randomly chosen patient
from among those available. It is easy to see that π is an admissible randomized non-anticipatory
policy: starting at state s′ one adds ‘virtual’ patients so that the total number of patients (real
and virtual) of a given type in the s′ system are identical to the number in the s system. One then
employs an optimal policy, and simulates service completion for virtual patients. We now show
that under our coupling, x(st)≥ x(s′t) for all t.
The proof is based on induction in time. The base case follows from our assumption that x(s)≥
x(s′). We assume that for all t≤ k, x(st)≥ x(s′t) and will show this implies the same is true for
t = k + 1. Let Ak = π∗(sk) and A′k be the patient discharged at time k under the π policy. Note
that A′k,m ≤Ak,m by our definition of π and the induction hypothesis. We have
x(sk+1)m−x(s′k+1)m = [(x(sk)m + y(sk)m−Ak,m)+−Xk,m]−
36
[(x(s′k)m + y(s′k)m−A′k,m)+−X ′k,m]
≥ x(sk)m−x(s′k)m +X ′k,m−Xk,m
= x(sk)m−x(s′k)m−Zk,m≥ 0
The first inequality comes from our coupling and the definition of the two policies. The second
inequality follows from the definition of Zt,m; Zt,m ≤ x(st)m−x(s′t)m.
We may thus establish that for all t(s)≤ t≤ T , At ≥A′t, so that C(st, π∗(st))≥C(s′t, π(s′t)) for
all such t. Taking expectations over the random patient arrivals and departures, we have J∗(s)≥
J π(s′)≥ J∗(s′), which is the result. �
Proof of Lemma 2: Without loss, we assume π∗(s) 6= πg(s) (else, there is nothing to prove).
By definition, we must have x(s)πg(s), x(s)π∗(s) > 0. Let S(s,π∗(s)) be the next state obtained if
one discharged both π∗(s) and πg(s) in state s. In particular, we define S(s,π∗(s)), s according to
x(s)π∗(s) = x(s)π∗(s) + y(s)π∗(s)− 1−Xt(s),π∗(s),
x(s)πg(s) = x(s)πg(s) + y(s)πg(s)− 1−Xt(s),πg(s),
x(s)m = x(s)m + y(s)m−Xt(s),m, m 6= π∗(s), πg(s)
y(s)m = Yt(s)+1,m,
t(s) = t(s) + 1,
where analogous to our earlier description of S(s, a), we define Xt(s),π∗(s) (resp. Xt(s),πg(s)) as a
Binomial (x(s)π∗(s) + y(s)π∗(s)− 1, µ0π8(s)
) (resp. Binomial (x(s)πg(s) + y(s)πg(s)− 1, µ0πg(s))) random
variable. For m 6= π∗(s), πg(s), we define Xt(s),m as a Binomial (x(s)m + y(s)m, µ0m) random vari-
able. Yt(s)+1,m is defined as before for all m. Now, by construction, x(S(s,π∗(s)))≤ x(S(s,π∗(s))),
while y(S(s,π∗(s))) = y(S(s,π∗(s)), so that by Lemma 1, we have that E[J∗(S(s,π∗(s)))] ≤
E[J∗(S(s,π∗(s)))].
Now, let us consider the following sub-optimal policy π′ for the system in which the greedy action
is taken at state s. Define τ = min{T > t > t(s) :∑
m Yt,m = 1}; i.e. τ is the first time after the
current time step t(s) that an arrival occurs (or infinite if no arrival occurs prior to time T ). Then on
the event that x(sτ )π∗(s) = x(s)π∗(s) + yt(s),π∗(s)− 1, π′ simply takes the optimal action for t≥ τ (so
that, in fact π′ coincides with π∗ on this event). On the event that x(sτ )π∗(s) = x(x)π∗(s) +yt(s),π∗(s),
π′(sτ ) = π∗(s), and π′ takes actions according to the optimal policy π∗ for t > τ . The probability
that an eviction occurs under π′ at τ is simply the probability that no patient of type π∗(s) has
departed prior to the next arrival; an event whose probability is at most λ/(λ+ µ0π∗(s)). Observe
moreover that we may couple the systems starting at state S(s,πg(s)) and S(s,π∗(s)) so that under

37
the π′ policy in the former system and the optimal policy in the latter, both state processes agree
on t > τ , and moreover, no eviction will be required at times t≤ τ in the latter system. It follows
that
E[Jπ′(S(s,πg(s))]≤ λ
λ+µ0π∗(s)
C(s,π∗(s)) +E[J∗(S(s,πg(s))].
Since E[J∗(S(s,πg(s))] ≥ E[Jπ′(S(s,πg(s))] and as established earlier, E[J∗(S(s,πg(s))] ≤
E[J∗(S(s,πg(s))], the result follows. �
Acknowledgments
This work was partially supported by The Permanente Medical Group, Inc.; Kaiser Foundation Hospitals,
Inc., and the Sidney Garfield Memorial Fund (grant 115-9518, ”Early detection of impending physiologic
deterioration in hospitalized patients”). This project was approved by the Kaiser Permanente Northern
California Institutional Board for the Protection of Human Subjects. We wish to thank Marla Gardner, John
D. Greene, and Juan Carlos LaGuardia for assistance in preparing study datasets, and to Dr. Philip Madvig
and Mr. Edward Thomas for administrative support and assistance.
References
Allon, G., S. Deo, W. Lin. 2009. Impact of size and occupancy of hospital on the extent of ambulance
diversion: Theory and evidence. Working Paper, Northwestern University, Kellogg Graduate School of
Management .
American Thoracic Society. 1997. Fair allocation of intensive care unit resources. American Journal Respi-
ratory Critical Care Medicine.
Bone, R. C., N. E. McElwee, D. H. Eubanks, E. H. Gluck. 1993. Analysis of indications for intensive care
unit admission. Clinical efficacy assessment project: American College of Physicians. CHEST 104
1806–1811.
Chalfin, D. B. 2005. Length of intensive care unit stay and patient outcome: The long and short of it all.
Critical Care Medicine 33 2119–2120.
Chalfin, D. B., S. Trzeciak, A. Likourezos, B. M. Baumann, R. P. Dellinger. 2007. Impact of delayed transfer of
critically ill patients from the emergency department to the intensive care unit. Critical Care Medicine
35 1477–1483.
Chan, C. W., V. F. Farias. 2009. Stochastic Depletion Problems: Effective Myopic Policies for a class of
Dynamic Optimization Problems. Mathematics of Operations Research 34(2) 333–350.
Chen, L. M., C. M. Martin, S. P. Keenan, W. J. Sibbald. 1998. Patients readmitted to the intensive care unit
during the same hospitalization: clinical features and outcomes. Critical Care Medicine 26 1834–1841.
Chrusch, C. A., K. P. Olafson, P. M. McMillan, D. E. Roberts, P. R. Gray. 2009. High occupancy increases
the risk of early death or readmission after transfer from intensive care. Critical Care Medicine 37
2753–2758.

38
de Bruin, A. M., A. C. van Rossum, M. C. Visser, G. M. Koole. 2007. Modeling the emergency cardiac
in-patient flow: an application of queuing theory. Health Care Management Science 10(2) 125–137.
Dobson, G., H.-H. Lee, E. Pinker. 2010. A Model of ICU Bumping. Operations Research 58 1564–1576.
Durbin, C.G., R.F. Kopel. 1993. A Case-Control Study of Patients Readmitted to the Intensive Care Unit.
Critical Care Medicine 21 1547–1553.
Durrett, R. 1996. Probability: Theory and Examples. Duxbury Press.
Escobar, G. J., J. D. Greene, P. Scheirer, M. N. Gardner, D. Draper, P. Kipnis. 2008. Risk-adjusting hospital
inpatient mortality using automated inpatient, outpatient, and laboratory databases. Medical Care 46
232–239.
Franklin, C., D. Jackson. 1983. Discharge decision-making in a medical ICU: Characteristics of unexpected
readmissions. Critical Care Medicine 11 61–66.
Franklin, C., E. C. Rackow, B. Mamdani, G. Burke, M. H. Weil. 1990. Triage considerations in medical
intensive care. Arch Intern Med 150 1455–1459.
Gajic, O., M. Malinchoc, T. B. Comfere, M. R¿ Harris, A. Achouiti, M. Yilmaz, M. J. Schultz, R. D.
Hubmayr, B. Afessa, J. C. Farmer. 2008. The Stability and Workload Index for transfer score predicts
unplanned intensive care unit patient readmission: Initial development and validation. Crit Care Med
36 676–682.
Green, L. V. 2003. How many hospital beds? Inquiry 39 400–412.
Green, L. V. 2006. Queueing Analysis in Healthcare, chap. Patient Flow: Reducing Delay in Healthcare
Delivery. Springer, New York, N.Y.
Green, L. V., S. Savin. 2008. Reducing delays for medical appointments: A queueing approach. Operations
Research 56 1526–1538.
Green, L. V., S. Savin, B. Wang. 2003. Managing patient service in a diagnostic medical facility. Operations
Research 54 11–25.
Green, L. V., J. Soares, J. F. Giglio, R. A. Green. 2006. Using queuing theory to increase the effectiveness
of emergency department provider staffing. Academic Emergency Medicine 13 61–68.
Halpern, N. A., S. M. Pastores. 2010. Critical care medicine in the United States 2000-2005: An analysis of
bed numbers, occupancy rates, payer mix, and costs. Critical Care Medicine 38 65–71.
Huang, X. A. 1995. A planning model for requirement of emergency beds. Journal of Mathematics Applied
in Medicine Biology 12 345–353.
Iwashyna, T. J., A. A. Kramer, J. M. Kahn. 2000. Intensive Care Unit Occupancy and Patient Outcomes.
Critical Care Medicine 37 1545–1557.
Kc, D., C. Terwiesch. 2011. An Econometric Analysis of Patient Flows in the Cardiac ICU. MSOM to
appear.

39
Kwak, N., C. Lee. 1997. A linear programming model for human resource allocation in a health-care orga-
nization. Journal of Medical Systems 21 129–140.
Loynes, R.M. 1963. The stability of a queue with non-independent interarrival and service times. Proceedings
of the Cambridge Philisophical Society 58 497–530.
McConnell, K. J., C. F. Richards, M. Daya, S. L. Bernell, C. C. Weathers, R. A. Lowe. 2005. Effect of
increased ICU capacity on emergency department length of stay and ambulance diversion. Annals of
Emergency Medicine 45 471–478.
McConnell, K. J., C. F. Richards, M. Daya, C. C. Weathers, R. A. Lowe. 2006. Ambulance diversion and
lost hospital revenues. Annals of Emergency Medicine 48 702–710.
Melnick, G. A., A. C. Nawathe, A. Bamezai, L. Green. 2004. Emergency department capacity and access in
California 1990-2001: An economic analysis. Health Affairs 23.
Merrill, C. T., A. Elixhauser. 2005. Hospitalization in the United States, 2002: HCUP Fact Book No. 6.
Rockville, MD. Agency for Healthcare Research and Quality .
Metcalfe, M. A., A. Sloggett, K. McPherson. 1997. Mortality among appropriately referred patients refused
admission to intensive-care units. Lancet 350 7–11.
Mitchell, I., M. Grounds, D. Bennett. 1995. Intensive care in the ailing UK health care system. Lancet 345
652.
Moreno, R.P., P. G. Metnitz, E. Almeida, B. Jordan, P. Bauer, R.A. Campos, G. Iapichino, D. Edbrooke,
M. Capuzzo, J.R. Le Gall. 2005. SAPS 3–From evaluation of the patient to evaluation of the intensive
care unit. Part 2: Development of a prognostic model for hospital mortality at ICU admission. Intensive
Care Med 31 1345–1355.
Murray, M., M. Davies, B. Boushon. 2007. Panel size: how many patients can one doctor manage? Family
Practice Management 14 44–51.
Naylor, M. D., D. A. Brooten, R. L. Campbell, G. Maislin, K. M. McCauley, J. S. Schwartz. 2004. Transitional
Care of Older Adults Hospitalized with Heart Failure: A Randomized, Controlled Trial. Journal of the
American Geriatrics Society 52(5) 675–684.
Norton, S.A., L.A. Hogan, R.G. Holloway, H. Temkin-Greener, M.J. Buckley, T.E. Quill. 2007. Proactive
palliative care in the medical intensive care unit: effects on length of stay for selected high-risk patients.
Crit Care Med 35 1530–1535.
Patient Protection and Affordable Care Act. 2010. Hospital readmissions reduction program. Sec. 3025.
Rapoport, J., D. Teres, S. Lemeshow. 1996. Resource use implications of do not resuscitate orders for
intensive care unit patients. Am J Respir Crit Care Med 153 185–190.
Renaud, B., A. Santin, E. Coma, N. Camus, D. Van Pelt, J. Hayon, M. Gurgui, E. Roupie, J. Herve, M.J.
Fine, C. Brun-Buisson, J. Labarere. 2009. Association between timing of intensive care unit admission

40
and outcomes for emergency department patients with community-acquired pneumonia. Critical Care
Medicine 37(11) 2867–2874.
Rincon, F., S.A. Mayer, J. Rivolta, J. Stillman, B. Boden-Albala, M.S V. Elkind, R. Marshall, J.Y. Chong.
2010. Impact of Delayed Transfer of Critically Ill Stroke Patients from the Emergency Department to
the Neuro-ICU. Neurocritical Care 13 75–81.
Rosenberg, A. L., C. Watts. 2000. Patients readmitted to ICUs: a systematic review of risk factors and
outcomes. Chest 118 492–502.
Scheulen, J. J., G. Li, G. D. Kelen. 2001. Impact of Ambulance Diversion Policies in Urban, Suburban, and
Rural Areas of Central Maryland. Academic Emergency Medicine 8 1553–2712.
Schull, M. J., M. Vermuelen, G. Slaughter, L. Morrison, P. Daly. 2004. Emergency department crowding and
thrombolysis delays in acute myocardial infarction. Annals of Emergency Medicine 44 577–585.
Shmueli, A., C. L. Sprung, E. H. Kaplan. 2003. Optimizing Admissions to an Intensive Care Unit. Health
Care Management Science 6(3) 131–136.
Smirnov, N. 1939. Estimating the deviation between the empirical distribution functions of two independent
samples. Moscow University Mathematics Bulletin 2 3–16.
Smith, G. B., B. L. Taylor, P. J. McQuillan, E. Nials. 1995. Rationing intensive care. Intensive care provision
varies widely in Britain. BMJ 310 1412–1413.
Snow, N., K.T. Bergin, T.P Horrigan. 1985. Readmission of Patients to the Surgical Intensive Care Unit:
Patient Profiles and Possibilities for Prevention. Critical Care Medicine 13 961–985.
Swenson, M.D. 1992. Scarcity in the Intensive Care Unit: Principles of Justice for Rationing ICU Beds.
American Journal of Medicine 92 552–555.
Task Force of the American College of Critical Care Medicine, Society of Critical Care Medicine. 1999.
Guidelines for intensive care unit admission, discharge, and triage. Crit Care Med 27 633–638.
Yankovic, N., L. Green. 2011. Identifying good nursing levels: A queuing approach. Operations Research 59
942–955.
Yoon, K. B., S. O. Koh, D. W. Han, O. C. Kang. 2004. Discharge decision-making by intensivists on
readmission to the intensive care unit. Yonsei Med J 45 193–198.
Zimmerman, J. E., A. A. Kramer, D.S. McNair, F. M. Malila. 2006. Acute Physiology and Chronic Health
Evaluation (APACHE) IV: hospital mortality assessment for today’s critically ill patients. Crit Care
Med 34 1297–1310.
Related Documents