Optimizing hydrogen production from organic wastewater treatment in batch reactors through experimental and kinetic analysis Yogesh Sharma, Baikun Li* Department of Civil and Environmental Engineering University of Connecticut, Storrs, CT 06269, USA article info Article history: Received 9 June 2009 Accepted 13 June 2009 Available online 5 July 2009 Keywords: Hydrogen production Anaerobic wastewater treatment Chemical oxygen demand pH Specific hydrogen yield Hydrogen production rate abstract Anaerobic hydrogen production from organic wastewater, an emerging biotechnology to generate clean energy resources from wastewater treatment, is critical for environmental and energy sustainability. In this study, hydrogen production, biomass growth and organic substrate degradation were comprehensively examined at different levels of two critical parameters (chemical oxygen demand (COD) and pH). Hydrogen yields had a reverse correlation with COD concentrations. The highest specific hydrogen yield (SHY) of 2.1 mole H 2 /mole glucose was achieved at the lowest COD of 1 g/L and decreased to 0.7 mole H 2 / mole glucose at the highest COD of 20 g/L. The pH of 5.5–6.0 was optimal for hydrogen production with the SHY of 1.6 mole H 2 /mole glucose, whereas the acidic pH (4.5) and neutral pH (6.0–7.0) lowered the hydrogen yields. Under all operational conditions, acetate and butyrate were the main components in the liquid fermentation products. Additionally, a comprehensive kinetic analysis of biomass growth, substrate degradation and hydrogen production was performed. The maximum rates of microbial growth (m m ) and substrate utilization (R su ) were 0.03 g biomass/g biomass/day and 0.25 g glucose/g biomass/day, respectively. The optimum pH for the rate of hydrogen production (R H2 ) and SHY were 5.89 and 5.74 respectively. Based on the kinetic analysis, the highest R H2 and SHY for batch- mode anaerobic hydrogen production systems were projected to be 13.7 mL/h and 2.32 mole H 2 /mole glucose. Published by Elsevier Ltd on behalf of International Association for Hydrogen Energy. 1. Introduction Wastewater contains significant amount of organic substances (i.e. carbohydrates) that can be converted to energy (i.e. methane, hydrogen). Hydrogen is expected to be a substitute for fossil fuel as a clean energy resource, since it only generates water when burning [1]. In the two-phase anaerobic treatment of wastewater, hydrogen is produced in the acidogenesis phase (Reaction (1)), which is much faster and more resistant to environmental shocks than the following methanogenic phase (Reaction (2)). The fermenta- tion liquid products are mainly volatile fatty acids (VFAs) such as acetic acid, propionic acid and butyric acid that are easily biodegradable. Several bacteria species (i.e. Clostridium pas- teurianum) have been found to degrade glucose and produces hydrogen along with acetate and butyrate (Reactions (1) and (3)) [2]. C 6 H 12 O 6 þ 2H 2 O / 2CH 3 COOH þ 4H 2 þ 2CO 2 (1) * Corresponding author. Tel.: 860 486 2339; fax: 860 486 2298 E-mail address: [email protected] (B. Li). Available at www.sciencedirect.com journal homepage: www.elsevier.com/locate/he 0360-3199/$ – see front matter Published by Elsevier Ltd on behalf of International Association for Hydrogen Energy. doi:10.1016/j.ijhydene.2009.06.031 international journal of hydrogen energy 34 (2009) 6171–6180

Welcome message from author
This document is posted to help you gain knowledge. Please leave a comment to let me know what you think about it! Share it to your friends and learn new things together.
Transcript
i n t e r n a t i o n a l j o u r n a l o f h y d r o g e n e n e r g y 3 4 ( 2 0 0 9 ) 6 1 7 1 – 6 1 8 0
Avai lab le a t www.sc iencedi rec t .com
j ourna l homepage : www.e lsev ier . com/ loca te /he
Optimizing hydrogen production from organic wastewatertreatment in batch reactors through experimentaland kinetic analysis
Yogesh Sharma, Baikun Li*
Department of Civil and Environmental Engineering University of Connecticut, Storrs, CT 06269, USA
a r t i c l e i n f o
Article history:
Received 9 June 2009
Accepted 13 June 2009
Available online 5 July 2009
Keywords:
Hydrogen production
Anaerobic wastewater treatment
Chemical oxygen demand
pH
Specific hydrogen yield
Hydrogen production rate
* Corresponding author. Tel.: 860 486 2339; faE-mail address: [email protected]
0360-3199/$ – see front matter Published bydoi:10.1016/j.ijhydene.2009.06.031
a b s t r a c t
Anaerobic hydrogen production from organic wastewater, an emerging biotechnology to
generate clean energy resources from wastewater treatment, is critical for environmental
and energy sustainability. In this study, hydrogen production, biomass growth and organic
substrate degradation were comprehensively examined at different levels of two critical
parameters (chemical oxygen demand (COD) and pH). Hydrogen yields had a reverse
correlation with COD concentrations. The highest specific hydrogen yield (SHY) of 2.1 mole
H2/mole glucose was achieved at the lowest COD of 1 g/L and decreased to 0.7 mole H2/
mole glucose at the highest COD of 20 g/L. The pH of 5.5–6.0 was optimal for hydrogen
production with the SHY of 1.6 mole H2/mole glucose, whereas the acidic pH (4.5) and
neutral pH (6.0–7.0) lowered the hydrogen yields. Under all operational conditions, acetate
and butyrate were the main components in the liquid fermentation products. Additionally,
a comprehensive kinetic analysis of biomass growth, substrate degradation and hydrogen
production was performed. The maximum rates of microbial growth (mm) and substrate
utilization (Rsu) were 0.03 g biomass/g biomass/day and 0.25 g glucose/g biomass/day,
respectively. The optimum pH for the rate of hydrogen production (RH2 ) and SHY were 5.89
and 5.74 respectively. Based on the kinetic analysis, the highest RH2 and SHY for batch-
mode anaerobic hydrogen production systems were projected to be 13.7 mL/h and
2.32 mole H2/mole glucose.
Published by Elsevier Ltd on behalf of International Association for Hydrogen Energy.
1. Introduction following methanogenic phase (Reaction (2)). The fermenta-
Wastewater contains significant amount of organic
substances (i.e. carbohydrates) that can be converted to
energy (i.e. methane, hydrogen). Hydrogen is expected to be
a substitute for fossil fuel as a clean energy resource, since it
only generates water when burning [1]. In the two-phase
anaerobic treatment of wastewater, hydrogen is produced in
the acidogenesis phase (Reaction (1)), which is much faster
and more resistant to environmental shocks than the
x: 860 486 2298(B. Li).Elsevier Ltd on behalf of
tion liquid products are mainly volatile fatty acids (VFAs) such
as acetic acid, propionic acid and butyric acid that are easily
biodegradable. Several bacteria species (i.e. Clostridium pas-
teurianum) have been found to degrade glucose and produces
hydrogen along with acetate and butyrate (Reactions (1) and
(3)) [2].
C6H12O6þ 2H2O / 2CH3COOHþ 4H2þ 2CO2 (1)
International Association for Hydrogen Energy.
Nomenclature
VFAs volatile fatty acids
SHY specific hydrogen yield, mole H2/mole glucose
k maximum specific substrate utilization rate,
g glucose/g biomass/day
X biomass concentration, g/L
S chemical oxygen demand, g/L
Ks half velocity constant, g/L
m specific growth rate constant, g biomass/
g biomass/day
RH2 rate of hydrogen production, mL/h
Rm maximum rate of hydrogen production, mL/h
Rsu rate of substrate utilization, g glucose/
g biomass/day, respectively
K1, K2 protonation and deprotonation equilibrium
constants respectively, mole/L
Ki inhibition constant, g/L
[Hþ] hydrogen ion concentration, mole/L
i n t e r n a t i o n a l j o u r n a l o f h y d r o g e n e n e r g y 3 4 ( 2 0 0 9 ) 6 1 7 1 – 6 1 8 06172
CH3COOH / CO2þCH4 (2)
C6H12O6 / CH3CH2CH2COOHþ 2H2þ 2CO2 (3)
Anaerobic hydrogen production is critical for environ-
mental and energy sustainability. In the past two decades,
tremendous efforts have been put to investigate a variety of
inoculums (i.e. activated sludge, soil, pure cultures) [3–5],
substrates (i.e. wastewater, starch, beet sugar, cellulose) [6–8],
anaerobic fermentation pathways [9,10], and bioreactors (i.e.
anaerobic baffled reactors, upflow reactors, continuous stirred
tank reactors) [11–13].
Currently, there are three problems of hydrogen production
from anaerobic wastewater treatment. First, the experimental
hydrogen production is much lower than the theoretical
values. The theoretical specific hydrogen yield (SHY) is 4 mole
H2/mole glucose when acetate is the sole fermentation product
(Reaction (1)). The yield decreases to 2 mole H2/mole glucose
when butyrate is the sole fermentation product (Reaction (3)).
But the experimental hydrogen yields are only 0.9–2.0 mole H2/
mole glucose [6,14]. Second, the accumulation of acidic
fermentation products in the solution and hydrogen partial
pressure in the headspace is known to inhibit bacterial activi-
ties, suppress fermentation and reduce hydrogen yields
[25–27]. Some engineering parameters (i.e. COD, pH, tempera-
ture, and hydraulic retention time) have been studied indi-
vidually for their effects on hydrogen production [5,9,12]. But
the understanding of the hydrogen production under different
operational conditions is still very limited. Third, there have
been some preliminary kinetic studies of hydrogen production
using pure cultures of Enterobacter sp. and Clostridium sp. in
batch mode [15–24]. A comprehensive kinetic analysis of the
effects of engineering parameters (i.e. COD and pH) on
hydrogen production, substrate utilization and biomass
growth is limited, especially for the mixed cultures (i.e. acti-
vated sludge). In a biochemical process such as anaerobic
hydrogen production, different operational conditions
substantially alter the rates of hydrogen production, substrate
utilization and biomass growth. There is no kinetic study
describing the effects of COD and pH on the rate of hydrogen
production (RH2 , mL/h) and specific hydrogen yield (SHY, mole
H2/mole glucose) using mixed cultures.
There are two-fold objectives of this study to enhance the
understanding of hydrogen production from organic waste-
water treatment. First, two critical operational parameters
(COD and pH) were examined at different levels in batch
systems to determine their effects on hydrogen production
and substrate removal. The quantitative correlations between
hydrogen production and operational parameters were
determined. Second, a comprehensive kinetic analysis,
elucidating the effect of operational parameters on RH2 , SHY,
and substrate removal (Rsu) was performed using Michaelis–
Menton kinetic analysis. The maximum biomass growth rate
(mm) was determined using the Monod kinetic analysis.
2. Material and method
2.1. Batch-mode hydrogen production system setup
Serum bottles (volume: 150 mL) (Wheaton Scientific, Millville,
NJ) were used as batch reactors in this study. The reactors were
filled to 125 mL with a glucose solution as the organic substrate.
An inorganic medium (consisting of per L of water: 2.0 g
NH4HCO3, 1.0 g KH2PO4, 100 mg MgSO4$7H2O, 10 mg NaCl,
10 mg Na2MoO4$2H2O, 10 mg CaCl2$2H2O, 15 mg MnSO4$7H2O,
and 2.78 mg FeCl2) was added to the solution as supplementary
micronutrients for bacteria to grow [6]. The fraction of head-
space (17% of the bottle volume) was designed to reduce the
duration of pressure build-up in the lag period and was consis-
tent with other studies with the similar reactor configuration [6].
The solution was mixed in the serum bottles and then
buffered with 0.05 M 2-(N-morpholino) ethanesulfonic acid
monohydrate (MES; J.T. Baker, Phillipsburg, NJ). The pH of the
solution was adjusted using 1 M KOH. The solution was
sparged with nitrogen for 15 min to remove oxygen
completely. The bottles were then capped with rubber septum
stoppers (Wheaton Scientific, Millville, NJ). The serum bottles
were constantly stirred at 250 rpm. The soil collected from an
organic farm was used as the inocula. Due to the effectiveness
of heat shock treatment in inhibiting methanogens and
selecting for hydrogen-producing bacteria, the soil was heated
shocked at 100 �C for 2 h before being added into the batch
reactors [6,28]. The soil concentration in the batch reactors
was kept at 20 g/L for all tests.
2.2. Operational condition
Two critical operational parameters including COD and pH
were tested individually. COD concentration varies with
wastewater sources (e.g. storm runoff, agricultural waste-
water) and pH varies with acidic fermentation products in
anaerobic systems. All these variations will affect the pop-
ulations and activities of hydrogen-producing bacteria. Five
levels of COD (1–20 g/L) and five levels of pH (4.5–7.0) were
examined with only one parameter being changed under each
i n t e r n a t i o n a l j o u r n a l o f h y d r o g e n e n e r g y 3 4 ( 2 0 0 9 ) 6 1 7 1 – 6 1 8 0 6173
condition, leading to the total eleven operational conditions. A
baseline of COD concentration of 5 g/L and pH of 5.5 was
selected for this study. All tests were conducted at 30 �C.
2.3. Control bottle tests
Since soil contains a variety of organic substances that can be
utilized by anaerobic bacteria, a control test without the
addition of glucose was conducted under each operational
condition in order to identify the contribution of these organic
substances to hydrogen production. The actual hydrogen
volume generated from the degradation of glucose equals the
total hydrogen volume generated in the batch reactors (with
glucose being added) minus the hydrogen volume generated
in the control bottles (without glucose being added).
2.4. Biogas volume measurement
The biogas was collected periodically from the headspace of
the batch reactors [29]. The total volume of biogas was
measured by inserting a glass syringe with a capacity of 20 or
100 mL (Perfektum Syringes; Popper & Sons, Inc., NY) into the
headspace of the batch reactor and allowing biogas to flow
into the syringe against atmospheric pressure. The volume
reading was taken when an equilibrium status was achieved
inside the syringe.
2.5. Analytical methods
The biogas in the headspace was sampled with a gas tight
syringe with a capacity of 50 mL (SGE, Illinois) and analyzed
using a gas chromatograph (Agilent 6890N) equipped with
a packed column and a thermal conductivity detector. The
glucose concentration was measured by performing the
phenol-sulfuric acid assay with a spectrophotometer (Cary 50
Bio; Varian, CA) [30]. The pH of the solution in the batch reac-
tors was measured at the end of each test using an Ag/AgCl
reference electrode (Accumet AP72). The pH of organic soil was
measured according to the standard method [31]. The biomass
concentration was measured using the total solids measure-
ment technique according to the standard method [32].
2.6. Kinetic analysis
To describe the effect of COD concentrations on RH2 , Andrew’s
inhibition model was used (Equation (1)) [15].
R ¼ ðRm � SÞ=�Ks þ Sþ S2=Ki
�(1)
where Rm is the maximum rate of hydrogen production
(mL/h), Ks is the half saturation constant (g/L), Ki is the
inhibition constant (g/L), and S is COD concentration (g/L).
To describe the effect of COD concentrations on SHY, the
Michaelis–Menton kinetic model was employed [33].
SHY ¼ ðSHYm � SÞ=ðKs þ SÞ (2)
where SHYm is the maximum SHY (mole H2/mole glucose), S is
COD concentration (g/L), Ks is half saturation constant (g/L).
To describe the effect of pH on RH2 , SHY and substrate
utilization rate (Rsu), a model of active ionization state was
used (Reaction (4)) [33]. E� represents the active enzyme form,
while E and E2� are inactive enzyme forms that are obtained
by the protonation and deprotonation of E�. The Michaelis pH
function (Equation (3)), derived by determining the fraction of
active enzyme concentration (E�), was used to analyze the
dependence of RH2 on pH [33].
E %�Hþ
HþK1
E� %�Hþ
HþK2
E2� (4)
RH2¼�Rm �
�Hþ����
K1 þ�Hþ�þ�Hþ�2=K2
�(3)
where Rm is maximum RH2(mL/h), K1 and K2 are equilibrium
constants (moles/L) respectively (Reaction (4)), and [Hþ] is
hydrogen ion concentration in the solution (moles/L).
To describe the effect of pH on SHY, the model of active
ionization state was used in formulation of Michaelis–Menton
function (Equation (4)).
SHY ¼�SHYm �
�Hþ����
K1 þ�Hþ�þ�Hþ�2=K2�
(4)
where SHYm is the maximum SHY (mole H2/mole glucose)
To illustrate the effect of pH on Rsu, Equation (5) was used.
Rsu ¼�Rsum �
�Hþ����
K1 þ�Hþ�þ�Hþ�2=K2
�(5)
where Rsum is the maximum Rsu (g glucose/day).
The optimum pH for RH2 , SHY, and Rsu was calculated using
Equation (6) [33].
pH ¼ loghðK1 � K2Þ1=2
i(6)
The Monod kinetic analysis of substrate utilization and
biomass growth were performed in this study. For substrate
utilization kinetics, the Equation (7) was used [34,35].
Rsu ¼ �ðk� X� SÞ=ðKsþ SÞ (7)
where k is maximum Rsu (g substrate/g biomass/day), X is
biomass concentration (mg/L), S is COD in solution (mg/L), and
Ks is half velocity constant (mg/L).
For microbial growth analysis, the Equation (8) was
employed.
m ¼ ðmm � SÞ=ðKsþ SÞ (8)
where mm is maximum specific growth rate (1/day).
All the kinetic analyses were performed using GraphPad
software.
In addition, the regression analyses were performed by the
statistical software MINITAB to illustrate theeffects of different
operational conditions (COD and pH) on hydrogen production.
3. Results and discussion
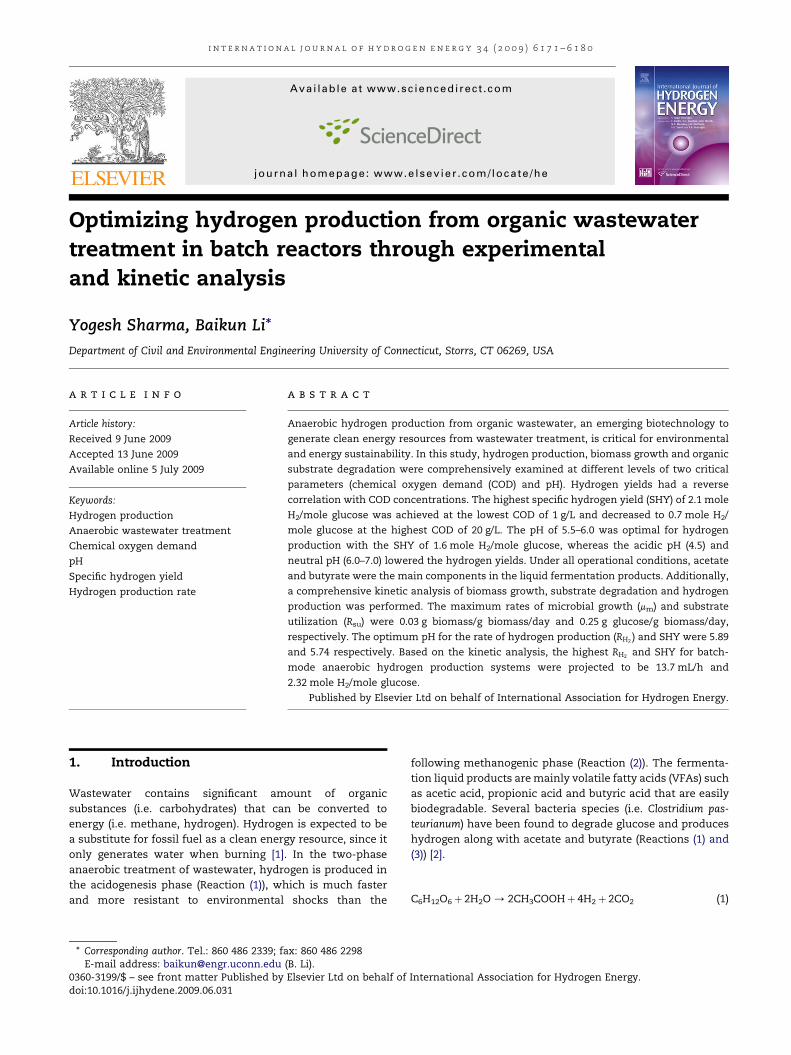
3.1. Effect of substrate concentration (COD) on specifichydrogen yield (SHY)
Substrate concentration is an important parameter in opti-
mizing the hydrogen yields due to its significant effects on
bacterial growth and enzymatic activity [36]. In the control
3
3.5
4
4.5
5
5.5
0 5 10 15 20
COD (g/L)
pH
Initial pH
Final pH
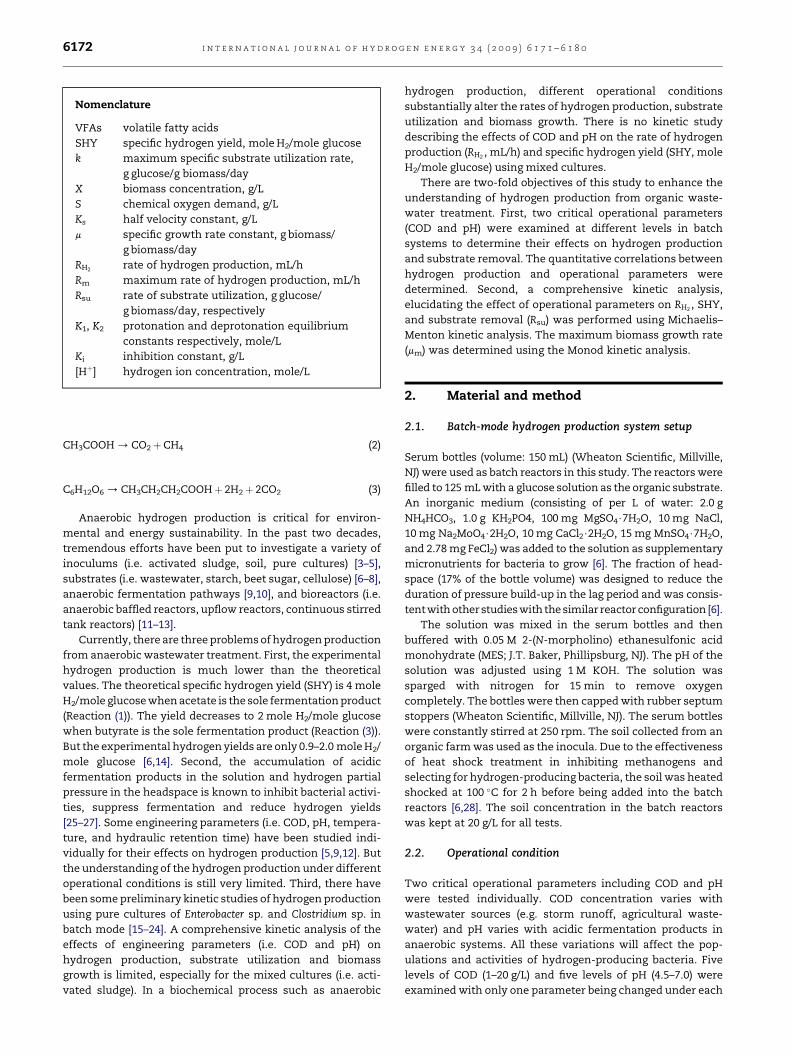
Fig. 2 – The changes of pH at different COD concentrations
before and after batch tests.
i n t e r n a t i o n a l j o u r n a l o f h y d r o g e n e n e r g y 3 4 ( 2 0 0 9 ) 6 1 7 1 – 6 1 8 06174
tests without the addition of glucose, hydrogen production
(w5 mL) was still detected in the batch reactors due to the
degradation of organic substances contained in soil. The
actual specific hydrogen yields (SHY, mole H2/mole glucose)
had a reverse correlation with COD concentrations (Equation
(9)) (Fig. 1). The correlation coefficient (R2) of 0.97 indicates the
high adequacy of correlation. The p-value for the COD effects
was 0.028, supporting the difference of yields at different COD
concentrations at 95% confidence interval.
SHY ¼ 2:380� 0:1601 CODþ 0:003956 COD2 (9)
The SHY values decreased from 2.1 to 0.7 mole H2/mole
glucose and the hydrogen content decreased from 55% to 32%
when the glucose concentration increased from 1 to 20 g/L.
There are three possible reasons for the reverse relationship
between hydrogen production and substrate concentrations.
First, the accumulation of liquid fermentation products at
higher substrate concentrations resulted in the over-acidifi-
cation of bacterial cultures and the inhibition of fermentation
[37]. A lower substrate concentration reduced the accumula-
tion of the acidic fermentation production, and led to higher
specific hydrogen yields. The measurement of volatile fatty
acids (VFAs) showed that 7.3 g/L of total VFAs were detected at
the highest substrate concentration of 20 g/L, while only
0.2 g/L VFAs were detected at the substrate concentration of
1 g/L. Second, the pH of the fermentation solution substan-
tially decreased with higher substrate concentrations. The
initial pH of the solution was set at 5.5 for all substrate
concentrations. The pH dropped sharply to 3.5 at the substrate
concentration of 20 g/L, whereas the pH slightly decreased to
5.4 at the substrate concentration of 1 g/L (Fig. 2). Third, the
total hydrogen production (mole H2) increased at high
substrate concentrations, which led to the high partial pres-
sure of hydrogen in the headspace throughout the batch test
period. The accumulation of hydrogen in the batch reactors
inhibited the fermentation reactions, and thus lowered the
specific hydrogen yields [38].
The SHY values obtained in this study (1.6–2.1 mole H2/
mole glucose) were much higher than the values previously
reported (0.92 mole H2/mole glucose at a COD concentration of
0.6
0.85
1.1
1.35
1.6
1.85
2.1
2.35
0 5 10 15 20 25COD (g/L)
Sp
ecific H
yd
ro
gen
Y
ield
( m
ole
Hyd
ro
gen
/m
ole G
lu
co
se)
0
10
20
30
40
50
60
Hyd
ro
gen
C
on
ten
t (%
)
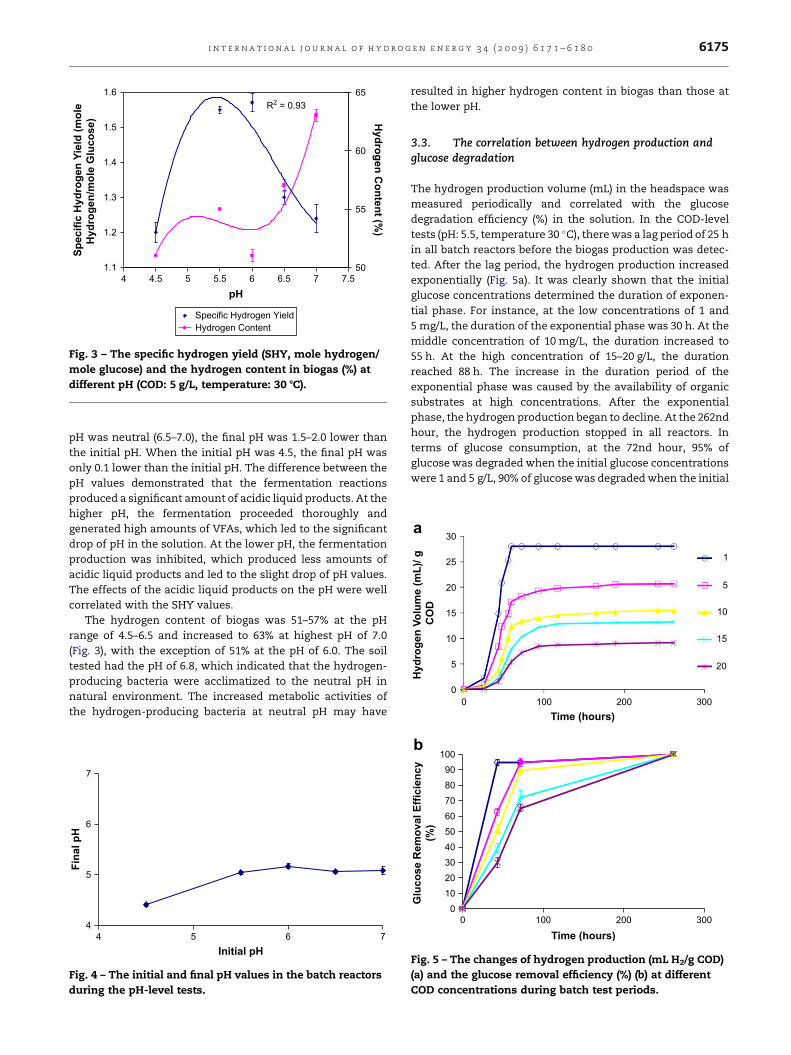
Specific Hydrogen YieldHydrogen Content
R2 = 0.97
Fig. 1 – The specific hydrogen yield (SHY, mole hydrogen/
mole glucose) and the hydrogen content in biogas (%) at
different COD concentrations (pH: 5.5, temperature: 30 8C).
4 g/L) [6]. The higher SHY in this study might be caused by the
higher temperature (30 �C) than their studies (26 �C). It has
been shown that increasing the temperature within meso-
philic range has a positive effect on hydrogen yields.
3.2. Effect of pH on specific hydrogen yield (SHY)
The pH is an important operational parameter for hydrogen
production, since it affects anaerobic metabolic pathways and
the activities of hydrogenase enzymes [39,40]. The SHY values
were the lowest (1.2 mole H2/mole glucose) at the pH of 4.5,
which indicated that the acidic condition inhibited the
fermentation and hydrogen production. The SHY values
substantially increased to 1.55 mole H2/mole glucose at the pH
of 5.5 and 6.0. However, the SHY values decreased to 1.3 and
1.25 at the higher pH of 6.5 and 7.0 (Fig. 3). It had been found
that under the neutral pH condition, a significant amount of
substrates were consumed by bacterial growth other than
hydrogen production [14], which was verified by the higher
biomass concentration at higher pH than at lower pH. This
could explain the lower hydrogen yield at neutral pH. The
correlation between SHY and pH was established by non-
linear regression analysis, yielding a cubic correlation (Equa-
tion (10)). The correlation obtained in this study adequately
described the hydrogen yield as a function of pH with
a correlation coefficient of 0.93 (Fig. 3).
SHY ¼ �29:61þ 15:39 pH� 2:493 pH2 þ 0:1319 pH3 (10)
The low pH has been known to suppress the activity of
hydrogenase [41,42]. A pH of 5.5 has been reported to be ideal
for hydrogen production [14,26], while the hydrogen yield at
6.0 was slightly higher than at the pH of 5.5 in this study.
Because different types of bacterial inoculums such as acti-
vated sludge, soil and pure culture (i.e. Clostridium sp) were
used in these studies, the optimal pH for hydrogen production
changed slightly with bacterial inoculums. Nevertheless, this
study indicated that for the batch reactors inoculated with
soil, a pH of 5.5–6.0 was optimal for hydrogen production.
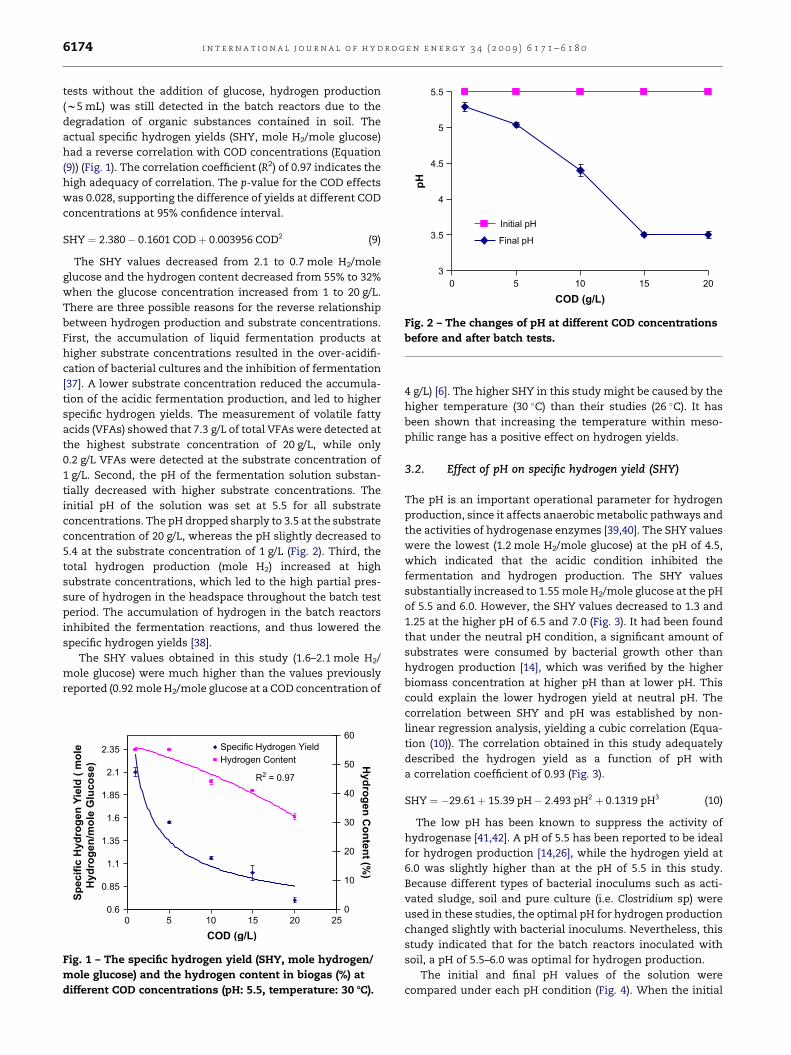
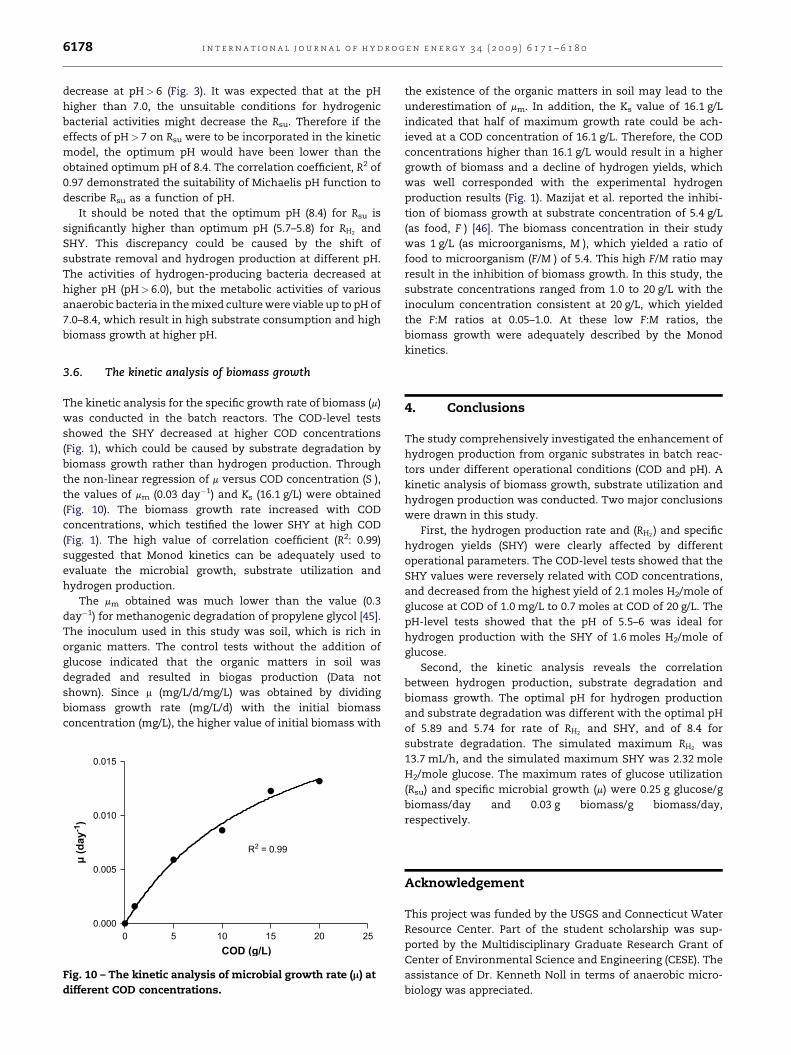
The initial and final pH values of the solution were
compared under each pH condition (Fig. 4). When the initial
1.1
1.2
1.3
1.4
1.5
1.6
4 4.5 5 5.5 6 6.5 7 7.5pH
Sp
ecific H
yd
ro
gen
Y
ield
(m
ole
Hyd
ro
gen
/m
ole G
lu
co
se)
50
55
60
65
Hyd
ro
gen
C
on
ten
t (%
)
R2 = 0.93
Specific Hydrogen YieldHydrogen Content
Fig. 3 – The specific hydrogen yield (SHY, mole hydrogen/
mole glucose) and the hydrogen content in biogas (%) at
different pH (COD: 5 g/L, temperature: 30 8C).
0 100 200 300Time (hours)
0
5
10
15
20
25
30
Hyd
ro
gen
V
olu
me (m
L)/ g
CO
D
1
5
10
15
20
a
i n t e r n a t i o n a l j o u r n a l o f h y d r o g e n e n e r g y 3 4 ( 2 0 0 9 ) 6 1 7 1 – 6 1 8 0 6175
pH was neutral (6.5–7.0), the final pH was 1.5–2.0 lower than
the initial pH. When the initial pH was 4.5, the final pH was
only 0.1 lower than the initial pH. The difference between the
pH values demonstrated that the fermentation reactions
produced a significant amount of acidic liquid products. At the
higher pH, the fermentation proceeded thoroughly and
generated high amounts of VFAs, which led to the significant
drop of pH in the solution. At the lower pH, the fermentation
production was inhibited, which produced less amounts of
acidic liquid products and led to the slight drop of pH values.
The effects of the acidic liquid products on the pH were well
correlated with the SHY values.
The hydrogen content of biogas was 51–57% at the pH
range of 4.5–6.5 and increased to 63% at highest pH of 7.0
(Fig. 3), with the exception of 51% at the pH of 6.0. The soil
tested had the pH of 6.8, which indicated that the hydrogen-
producing bacteria were acclimatized to the neutral pH in
natural environment. The increased metabolic activities of
the hydrogen-producing bacteria at neutral pH may have
4
5
6
7
4 5 6 7Initial pH
Fin
al p
H
Fig. 4 – The initial and final pH values in the batch reactors
during the pH-level tests.
resulted in higher hydrogen content in biogas than those at
the lower pH.
3.3. The correlation between hydrogen production andglucose degradation
The hydrogen production volume (mL) in the headspace was
measured periodically and correlated with the glucose
degradation efficiency (%) in the solution. In the COD-level
tests (pH: 5.5, temperature 30 �C), there was a lag period of 25 h
in all batch reactors before the biogas production was detec-
ted. After the lag period, the hydrogen production increased
exponentially (Fig. 5a). It was clearly shown that the initial
glucose concentrations determined the duration of exponen-
tial phase. For instance, at the low concentrations of 1 and
5 mg/L, the duration of the exponential phase was 30 h. At the
middle concentration of 10 mg/L, the duration increased to
55 h. At the high concentration of 15–20 g/L, the duration
reached 88 h. The increase in the duration period of the
exponential phase was caused by the availability of organic
substrates at high concentrations. After the exponential
phase, the hydrogen production began to decline. At the 262nd
hour, the hydrogen production stopped in all reactors. In
terms of glucose consumption, at the 72nd hour, 95% of
glucose was degraded when the initial glucose concentrations
were 1 and 5 g/L, 90% of glucose was degraded when the initial
0102030405060708090
100
0 100 200 300
Time (hours)
Glu
co
se R
em
oval E
fficien
cy
(%
)
b
Fig. 5 – The changes of hydrogen production (mL H2/g COD)
(a) and the glucose removal efficiency (%) (b) at different
COD concentrations during batch test periods.
i n t e r n a t i o n a l j o u r n a l o f h y d r o g e n e n e r g y 3 4 ( 2 0 0 9 ) 6 1 7 1 – 6 1 8 06176
concentration was 10 g/L, and 70–80% of glucose was degraded
when the initial concentration was 15–20 g/L (Fig. 5b).
Although the glucose removal efficiency decreased at higher
concentrations, the amounts of glucose removed were actu-
ally higher. For example, 0.99–4.75 g/L glucose was removed
when the initial concentrations were 1–5 g/L, whereas 12–14 g/
L glucose was removed when the initial concentrations were
15–20 g/L.
In the pH-level tests (COD: 5 g/L, temperature: 30 �C), the
rate of hydrogen production increased as the pH was
increased from 4.5 to 7.0 (Fig. 6a). The pH of organic soil tested
in this study was 6.8, indicating that the bacteria in the soil
could acclimatize quickly at neutral pH and produce hydrogen
at a faster rate. This quick acclimation at neutral pH resulted
in a shorter duration of exponential phase (22 h) at the pH of
6.0–7.0 than those (30 h) at lower pH of 4.5–5.5. In terms of
glucose degradation, over 97% of glucose was degraded at the
pH of 7.0 after 43 h (Fig. 6b), whereas only 25% of glucose was
degraded at the pH of 4.5 during the same test period. This
clearly indicated that the metabolic activities of bacteria in
soil were faster at neutral pH than at lower pH. After 72 h,
95–99% of glucose was degraded in all reactors. No glucose
was detected at the end of experiment at 262 h.
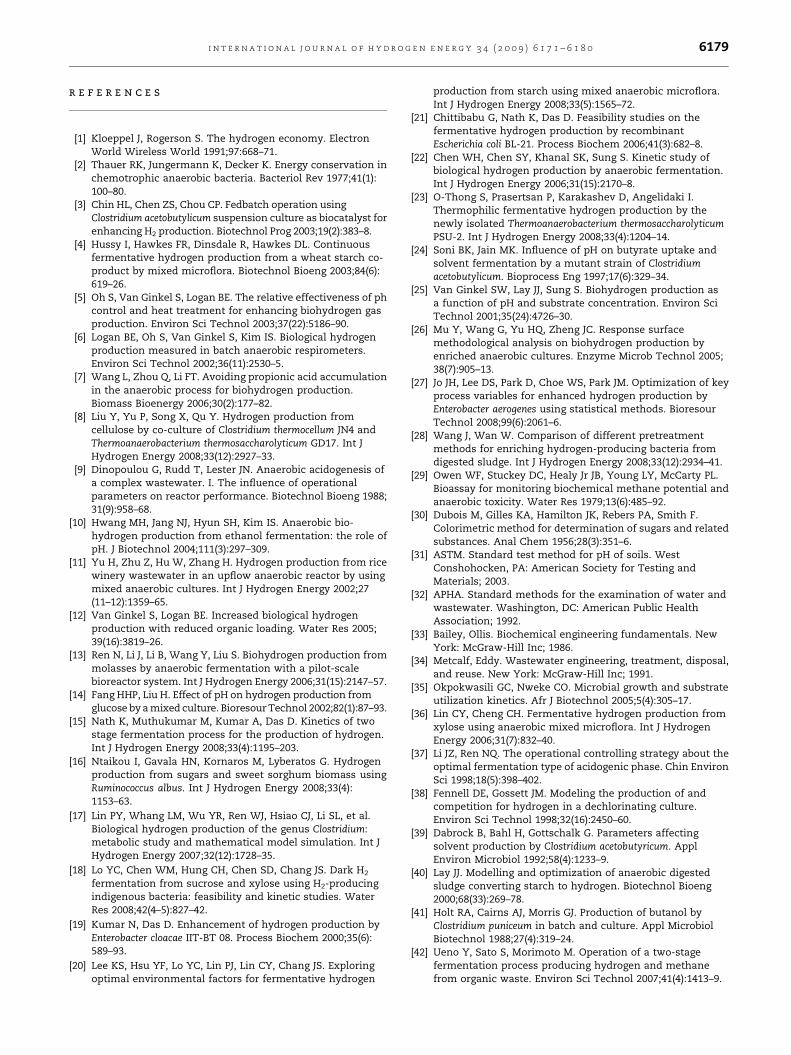
3.4. The kinetic analysis of hydrogen production
In order to improve hydrogen production, it is critical to
determine the effects of operational conditions on hydrogen
production rate (RH2 ) and specific hydrogen yield (SHY). The
0102030405060708090
100
0 100 200 300
Time (hours)
Glu
co
se R
em
oval E
fficien
cy
(%
)
0 100 200 300
Time (hours)
0
5
10
15
20
25
Hyd
ro
gen
V
olu
me (m
L)/ g
CO
D
76.5
65.54.5
a
b
Fig. 6 – The changes of hydrogen production (mL H2/g COD)
(a) and the glucose removal efficiency (%) (b) at different pH
during batch test periods.
kinetic analysis of the effects of COD concentrations on
hydrogen production indicated that RH2 increased at the COD
of 1–5 g/L, but decreased at higher COD of 10–20 g/L (Fig. 7a).
This inhibition of hydrogen production at high COD was
effectively demonstrated by Andrew’s inhibition model
(Equation (1)). The maximum rate of hydrogen production (Rm)
was 13.7 mL/h, which corresponded well to the reported rate
of 15.1 mL/h (with glucose as the substrate and activated
sludge as inoculum, [43]). Increasing the COD within the range
of 5 g/L<COD< 10 g/L would increase the RH2 up to 13.7 mL/h.
Beyond that point, the RH2 would start to decrease due to
substrate inhibition. The Ks and Ki were 12.23 and 3.24 g/L
respectively. A high correlation coefficient of 0.97 suggested
the adequacy of Andrew’s model in describing the inhibitory
effect of COD on hydrogen production.
The experimental results indicated that SHY had a reverse
relationship with COD concentrations, increasing from
0.7 molesH2/mole glucoseat20 g/L to 2.1 molesH2/mole glucose
at 1 g/L (Fig. 1). The SHY was plotted against 1/S according to
Michaelis–Menton kinetics, with the projected maximum SHY
of 2.32 moles H2/mole glucose (Fig. 7b). This demonstrated that
decreasing the COD concentration below the lowest COD tested
(1 g/L) would result in a further increase in SHY reaching
a maximum of 2.32 mole H2/mole glucose. At this point, the SHY
is limited by other operational parameters such as pH,
temperature, stirringspeed aswell asbiologicalpropertiesof the
system. Therefore, the manipulation of COD alone is not
0 5 10 15 20 250
1
2
3
4
COD (g/L)
RH
2 (m
L/h
ou
r)
0.0 0.5 1.0 1.50.0
0.5
1.0
1.5
2.0
2.5
1/COD (L/g)
Sp
ecific H
yd
ro
gen
Y
ield
(m
ole H
2/m
ole g
lu
co
se)
R2 = 0.97
R2 = 0.99
b
a
Fig. 7 – The kinetic analysis of COD effect on hydrogen
production rate (RH2 ) (a) and specific hydrogen yield (SHY)
(b).

i n t e r n a t i o n a l j o u r n a l o f h y d r o g e n e n e r g y 3 4 ( 2 0 0 9 ) 6 1 7 1 – 6 1 8 0 6177
sufficient to achieve theoretical SHY of 4 mole H2/mole glucose.
The transformed Michaelis–Menton kinetic model was found to
be adequate with a correlation coefficient of 0.99.
The effects of pH on RH2 were modeled by Michaelis pH
function (Equation (3)) (Fig. 8a). Through a non-linear regres-
sion of RH2 versus [Hþ], the equilibrium constants K1 and K2
were found to be 4.26� 10�8 and 3.96� 10�5 mole/L, respec-
tively. A high correlation coefficient of 0.85 illustrated the
suitability of Michaelis pH function for analysis of RH2 . Based
on Equation (6), the optimum pH of 5.89 was calculated for RH2 .
This pH value was significantly lower than the reported pH of
6.35 for hydrogen production rate from starch hydrolysate
[44]. This difference in optimum pH can be attributed to use of
pure culture of Enterobacter aerogenes in that study compared
to mixed culture in this study.
The effects of pH on SHY were modeled by Michaelis pH
function (Equation (4)). Through a non-linear regression of
SHY versus [Hþ], the equilibrium constants K1 and K2 were
3.07� 10�8 and 3.5� 10�5 mole/L respectively with a correla-
tion coefficient of 0.78 (Fig. 8b). The optimum pH for SHY was
5.74 (Equation (6)), which was not significantly different than
the optimum pH of 5.89 for RH2 .
3.5. The kinetic analysis of substrate utilization
The kinetic analysis of substrate utilization rate (Rsu) was
performed for different COD concentrations and pH. The Rsu
0.00001 0.00002 0.00003
2.0
2.5
3.0
[H+] (mole/L)
RH
2 (m
L/h
ou
r)
0.00000 0.00001 0.00002 0.00003 0.000041.0
1.2
1.4
1.6
1.8
[H+] (mole/L)
Sp
ecific H
yd
ro
gen
Y
ield
(m
ole H
2/m
ole g
lu
co
se)
R2 = 0.85
R2 = 0.78
b
a
Fig. 8 – The kinetic analysis of pH effect on hydrogen
production rate (RH2 ) (a) and specific hydrogen yield
(SHY) (b).
for different COD concentrations was modeled using the
Monod kinetics (Equation (7)). The Rsu was calculated at each
COD concentration (S ) after 43 h (1.79 days, as shown in
Fig. 5a), at which point the substrate utilization was in the
exponential phase for all COD concentrations. In the next
experimental data point (72 h), the reactor with the COD
concentration of 1 g/L had already entered the stationary
phase (Fig. 5a). To calculate Rsu at different COD concentra-
tions, it was critical to employ the duration period that all the
reactors were in the same phase of substrate degradation
(Exponential Phase, 43 h). Through a non-linear regression
between (Rsu/X ) and S, the values of Ks (8 g/L) and k (0.25 g
glucose/g biomass/day) were determined. The correlation
coefficient R2 was 0.99 (Fig. 9a), suggesting the adequacy of
substrate utilization model in this study.
The Rsu for different pH was modeled using the Michaelis
pH function (Equation (5)) (Fig. 9b). The Rsu was calculated at
each pH value in the exponential phase (43 h). The Rsu
increased with increase in pH from 4.5 to 7.0. A non-linear
regression of Rsu versus [Hþ] yielded the equilibrium
constants K1 and K2 of 1.8� 10�12 and 8.2� 10�6 mole/L
respectively (Equation (5)). Based on Equation (6), an
optimum pH of 8.4 was calculated for Rsu. In this model, the
effect of pH range of 4.5–7.0 on Rsu was simulated. The
experimental results showed that although Rsu increased
with pH within the range of 4.5–7.0, the SHY started to
0.00000 0.00001 0.00002 0.00003 0.000040
2
4
6
[H+] (mole/L)
Rs
u (g
g
lu
co
se/d
ay)
0 5 10 15 20 250.00
0.05
0.10
0.15
0.20
COD (g/L)
Rsu /X
(d
ay
-1)
R2 = 0.99
R2 = 0.97
a
b
Fig. 9 – The kinetic analysis of substrate utilization rate
(Rsu) (a) at different COD concentrations, (b) at different pH.
i n t e r n a t i o n a l j o u r n a l o f h y d r o g e n e n e r g y 3 4 ( 2 0 0 9 ) 6 1 7 1 – 6 1 8 06178
decrease at pH> 6 (Fig. 3). It was expected that at the pH
higher than 7.0, the unsuitable conditions for hydrogenic
bacterial activities might decrease the Rsu. Therefore if the
effects of pH> 7 on Rsu were to be incorporated in the kinetic
model, the optimum pH would have been lower than the
obtained optimum pH of 8.4. The correlation coefficient, R2 of
0.97 demonstrated the suitability of Michaelis pH function to
describe Rsu as a function of pH.
It should be noted that the optimum pH (8.4) for Rsu is
significantly higher than optimum pH (5.7–5.8) for RH2 and
SHY. This discrepancy could be caused by the shift of
substrate removal and hydrogen production at different pH.
The activities of hydrogen-producing bacteria decreased at
higher pH (pH> 6.0), but the metabolic activities of various
anaerobic bacteria in the mixed culture were viable up to pH of
7.0–8.4, which result in high substrate consumption and high
biomass growth at higher pH.
3.6. The kinetic analysis of biomass growth
The kinetic analysis for the specific growth rate of biomass (m)
was conducted in the batch reactors. The COD-level tests
showed the SHY decreased at higher COD concentrations
(Fig. 1), which could be caused by substrate degradation by
biomass growth rather than hydrogen production. Through
the non-linear regression of m versus COD concentration (S ),
the values of mm (0.03 day�1) and Ks (16.1 g/L) were obtained
(Fig. 10). The biomass growth rate increased with COD
concentrations, which testified the lower SHY at high COD
(Fig. 1). The high value of correlation coefficient (R2: 0.99)
suggested that Monod kinetics can be adequately used to
evaluate the microbial growth, substrate utilization and
hydrogen production.
The mm obtained was much lower than the value (0.3
day�1) for methanogenic degradation of propylene glycol [45].
The inoculum used in this study was soil, which is rich in
organic matters. The control tests without the addition of
glucose indicated that the organic matters in soil was
degraded and resulted in biogas production (Data not
shown). Since m (mg/L/d/mg/L) was obtained by dividing
biomass growth rate (mg/L/d) with the initial biomass
concentration (mg/L), the higher value of initial biomass with
0 5 10 15 20 250.000
0.005
0.010
0.015
COD (g/L)
µ (d
ay
-1)
R2 = 0.99
Fig. 10 – The kinetic analysis of microbial growth rate (m) at
different COD concentrations.
the existence of the organic matters in soil may lead to the
underestimation of mm. In addition, the Ks value of 16.1 g/L
indicated that half of maximum growth rate could be ach-
ieved at a COD concentration of 16.1 g/L. Therefore, the COD
concentrations higher than 16.1 g/L would result in a higher
growth of biomass and a decline of hydrogen yields, which
was well corresponded with the experimental hydrogen
production results (Fig. 1). Mazijat et al. reported the inhibi-
tion of biomass growth at substrate concentration of 5.4 g/L
(as food, F ) [46]. The biomass concentration in their study
was 1 g/L (as microorganisms, M ), which yielded a ratio of
food to microorganism (F/M ) of 5.4. This high F/M ratio may
result in the inhibition of biomass growth. In this study, the
substrate concentrations ranged from 1.0 to 20 g/L with the
inoculum concentration consistent at 20 g/L, which yielded
the F:M ratios at 0.05–1.0. At these low F:M ratios, the
biomass growth were adequately described by the Monod
kinetics.
4. Conclusions
The study comprehensively investigated the enhancement of
hydrogen production from organic substrates in batch reac-
tors under different operational conditions (COD and pH). A
kinetic analysis of biomass growth, substrate utilization and
hydrogen production was conducted. Two major conclusions
were drawn in this study.
First, the hydrogen production rate and (RH2 ) and specific
hydrogen yields (SHY) were clearly affected by different
operational parameters. The COD-level tests showed that the
SHY values were reversely related with COD concentrations,
and decreased from the highest yield of 2.1 moles H2/mole of
glucose at COD of 1.0 mg/L to 0.7 moles at COD of 20 g/L. The
pH-level tests showed that the pH of 5.5–6 was ideal for
hydrogen production with the SHY of 1.6 moles H2/mole of
glucose.
Second, the kinetic analysis reveals the correlation
between hydrogen production, substrate degradation and
biomass growth. The optimal pH for hydrogen production
and substrate degradation was different with the optimal pH
of 5.89 and 5.74 for rate of RH2 and SHY, and of 8.4 for
substrate degradation. The simulated maximum RH2 was
13.7 mL/h, and the simulated maximum SHY was 2.32 mole
H2/mole glucose. The maximum rates of glucose utilization
(Rsu) and specific microbial growth (m) were 0.25 g glucose/g
biomass/day and 0.03 g biomass/g biomass/day,
respectively.
Acknowledgement
This project was funded by the USGS and Connecticut Water
Resource Center. Part of the student scholarship was sup-
ported by the Multidisciplinary Graduate Research Grant of
Center of Environmental Science and Engineering (CESE). The
assistance of Dr. Kenneth Noll in terms of anaerobic micro-
biology was appreciated.
i n t e r n a t i o n a l j o u r n a l o f h y d r o g e n e n e r g y 3 4 ( 2 0 0 9 ) 6 1 7 1 – 6 1 8 0 6179
r e f e r e n c e s
[1] Kloeppel J, Rogerson S. The hydrogen economy. ElectronWorld Wireless World 1991;97:668–71.
[2] Thauer RK, Jungermann K, Decker K. Energy conservation inchemotrophic anaerobic bacteria. Bacteriol Rev 1977;41(1):100–80.
[3] Chin HL, Chen ZS, Chou CP. Fedbatch operation usingClostridium acetobutylicum suspension culture as biocatalyst forenhancing H2 production. Biotechnol Prog 2003;19(2):383–8.
[4] Hussy I, Hawkes FR, Dinsdale R, Hawkes DL. Continuousfermentative hydrogen production from a wheat starch co-product by mixed microflora. Biotechnol Bioeng 2003;84(6):619–26.
[5] Oh S, Van Ginkel S, Logan BE. The relative effectiveness of phcontrol and heat treatment for enhancing biohydrogen gasproduction. Environ Sci Technol 2003;37(22):5186–90.
[6] Logan BE, Oh S, Van Ginkel S, Kim IS. Biological hydrogenproduction measured in batch anaerobic respirometers.Environ Sci Technol 2002;36(11):2530–5.
[7] Wang L, Zhou Q, Li FT. Avoiding propionic acid accumulationin the anaerobic process for biohydrogen production.Biomass Bioenergy 2006;30(2):177–82.
[8] Liu Y, Yu P, Song X, Qu Y. Hydrogen production fromcellulose by co-culture of Clostridium thermocellum JN4 andThermoanaerobacterium thermosaccharolyticum GD17. Int JHydrogen Energy 2008;33(12):2927–33.
[9] Dinopoulou G, Rudd T, Lester JN. Anaerobic acidogenesis ofa complex wastewater. I. The influence of operationalparameters on reactor performance. Biotechnol Bioeng 1988;31(9):958–68.
[10] Hwang MH, Jang NJ, Hyun SH, Kim IS. Anaerobic bio-hydrogen production from ethanol fermentation: the role ofpH. J Biotechnol 2004;111(3):297–309.
[11] Yu H, Zhu Z, Hu W, Zhang H. Hydrogen production from ricewinery wastewater in an upflow anaerobic reactor by usingmixed anaerobic cultures. Int J Hydrogen Energy 2002;27(11–12):1359–65.
[12] Van Ginkel S, Logan BE. Increased biological hydrogenproduction with reduced organic loading. Water Res 2005;39(16):3819–26.
[13] Ren N, Li J, Li B, Wang Y, Liu S. Biohydrogen production frommolasses by anaerobic fermentation with a pilot-scalebioreactor system. Int J Hydrogen Energy 2006;31(15):2147–57.
[14] Fang HHP, Liu H. Effect of pH on hydrogen production fromglucose by a mixed culture. Bioresour Technol 2002;82(1):87–93.
[15] Nath K, Muthukumar M, Kumar A, Das D. Kinetics of twostage fermentation process for the production of hydrogen.Int J Hydrogen Energy 2008;33(4):1195–203.
[16] Ntaikou I, Gavala HN, Kornaros M, Lyberatos G. Hydrogenproduction from sugars and sweet sorghum biomass usingRuminococcus albus. Int J Hydrogen Energy 2008;33(4):1153–63.
[17] Lin PY, Whang LM, Wu YR, Ren WJ, Hsiao CJ, Li SL, et al.Biological hydrogen production of the genus Clostridium:metabolic study and mathematical model simulation. Int JHydrogen Energy 2007;32(12):1728–35.
[18] Lo YC, Chen WM, Hung CH, Chen SD, Chang JS. Dark H2
fermentation from sucrose and xylose using H2-producingindigenous bacteria: feasibility and kinetic studies. WaterRes 2008;42(4–5):827–42.
[19] Kumar N, Das D. Enhancement of hydrogen production byEnterobacter cloacae IIT-BT 08. Process Biochem 2000;35(6):589–93.
[20] Lee KS, Hsu YF, Lo YC, Lin PJ, Lin CY, Chang JS. Exploringoptimal environmental factors for fermentative hydrogen
production from starch using mixed anaerobic microflora.Int J Hydrogen Energy 2008;33(5):1565–72.
[21] Chittibabu G, Nath K, Das D. Feasibility studies on thefermentative hydrogen production by recombinantEscherichia coli BL-21. Process Biochem 2006;41(3):682–8.
[22] Chen WH, Chen SY, Khanal SK, Sung S. Kinetic study ofbiological hydrogen production by anaerobic fermentation.Int J Hydrogen Energy 2006;31(15):2170–8.
[23] O-Thong S, Prasertsan P, Karakashev D, Angelidaki I.Thermophilic fermentative hydrogen production by thenewly isolated Thermoanaerobacterium thermosaccharolyticumPSU-2. Int J Hydrogen Energy 2008;33(4):1204–14.
[24] Soni BK, Jain MK. Influence of pH on butyrate uptake andsolvent fermentation by a mutant strain of Clostridiumacetobutylicum. Bioprocess Eng 1997;17(6):329–34.
[25] Van Ginkel SW, Lay JJ, Sung S. Biohydrogen production asa function of pH and substrate concentration. Environ SciTechnol 2001;35(24):4726–30.
[26] Mu Y, Wang G, Yu HQ, Zheng JC. Response surfacemethodological analysis on biohydrogen production byenriched anaerobic cultures. Enzyme Microb Technol 2005;38(7):905–13.
[27] Jo JH, Lee DS, Park D, Choe WS, Park JM. Optimization of keyprocess variables for enhanced hydrogen production byEnterobacter aerogenes using statistical methods. BioresourTechnol 2008;99(6):2061–6.
[28] Wang J, Wan W. Comparison of different pretreatmentmethods for enriching hydrogen-producing bacteria fromdigested sludge. Int J Hydrogen Energy 2008;33(12):2934–41.
[29] Owen WF, Stuckey DC, Healy Jr JB, Young LY, McCarty PL.Bioassay for monitoring biochemical methane potential andanaerobic toxicity. Water Res 1979;13(6):485–92.
[30] Dubois M, Gilles KA, Hamilton JK, Rebers PA, Smith F.Colorimetric method for determination of sugars and relatedsubstances. Anal Chem 1956;28(3):351–6.
[31] ASTM. Standard test method for pH of soils. WestConshohocken, PA: American Society for Testing andMaterials; 2003.
[32] APHA. Standard methods for the examination of water andwastewater. Washington, DC: American Public HealthAssociation; 1992.
[33] Bailey, Ollis. Biochemical engineering fundamentals. NewYork: McGraw-Hill Inc; 1986.
[34] Metcalf, Eddy. Wastewater engineering, treatment, disposal,and reuse. New York: McGraw-Hill Inc; 1991.
[35] Okpokwasili GC, Nweke CO. Microbial growth and substrateutilization kinetics. Afr J Biotechnol 2005;5(4):305–17.
[36] Lin CY, Cheng CH. Fermentative hydrogen production fromxylose using anaerobic mixed microflora. Int J HydrogenEnergy 2006;31(7):832–40.
[37] Li JZ, Ren NQ. The operational controlling strategy about theoptimal fermentation type of acidogenic phase. Chin EnvironSci 1998;18(5):398–402.
[38] Fennell DE, Gossett JM. Modeling the production of andcompetition for hydrogen in a dechlorinating culture.Environ Sci Technol 1998;32(16):2450–60.
[39] Dabrock B, Bahl H, Gottschalk G. Parameters affectingsolvent production by Clostridium acetobutyricum. ApplEnviron Microbiol 1992;58(4):1233–9.
[40] Lay JJ. Modelling and optimization of anaerobic digestedsludge converting starch to hydrogen. Biotechnol Bioeng2000;68(33):269–78.
[41] Holt RA, Cairns AJ, Morris GJ. Production of butanol byClostridium puniceum in batch and culture. Appl MicrobiolBiotechnol 1988;27(4):319–24.
[42] Ueno Y, Sato S, Morimoto M. Operation of a two-stagefermentation process producing hydrogen and methanefrom organic waste. Environ Sci Technol 2007;41(4):1413–9.

i n t e r n a t i o n a l j o u r n a l o f h y d r o g e n e n e r g y 3 4 ( 2 0 0 9 ) 6 1 7 1 – 6 1 8 06180
[43] Wang JL, Wan W. The effect of substrate concentration onbiohydrogen production by using kinetic models. Sci ChinaSer B Chem 2008;51(11):1110–7.
[44] Fabiano B, Perego P. Thermodynamic study and optimizationof hydrogen production by Enterobacter aerogenes. Int JHydrogen Energy 2002;27(2):149–56.
[45] Seok J, Komisar SJ. Sequential kinetic parameter estimationof anaerobic fluidized bed bioreactor using an optimizationtechnique. Biotechnol Lett 2002;24(19):1579–86.
[46] Mazijat A, Mitsunori Y, Mitsunori W, Michimasa N, Jun’ichiro M.Hydrogen gas production from glucose anditsmicrobial kineticsin anaerobic systems. Water Sci Technol 1997;36(6):279–86.
Related Documents