University of Groningen Optimizing gamma-ray spectrometers for UAV-borne surveys with geophysical applications van der Veeke, S; Limburg, J; Koomans, R L; Söderström, M; van der Graaf, E R Published in: Journal of Environmental Radioactivity DOI: 10.1016/j.jenvrad.2021.106717 IMPORTANT NOTE: You are advised to consult the publisher's version (publisher's PDF) if you wish to cite from it. Please check the document version below. Document Version Publisher's PDF, also known as Version of record Publication date: 2021 Link to publication in University of Groningen/UMCG research database Citation for published version (APA): van der Veeke, S., Limburg, J., Koomans, R. L., Söderström, M., & van der Graaf, E. R. (2021). Optimizing gamma-ray spectrometers for UAV-borne surveys with geophysical applications. Journal of Environmental Radioactivity, 237, [106717]. https://doi.org/10.1016/j.jenvrad.2021.106717 Copyright Other than for strictly personal use, it is not permitted to download or to forward/distribute the text or part of it without the consent of the author(s) and/or copyright holder(s), unless the work is under an open content license (like Creative Commons). The publication may also be distributed here under the terms of Article 25fa of the Dutch Copyright Act, indicated by the “Taverne” license. More information can be found on the University of Groningen website: https://www.rug.nl/library/open-access/self-archiving-pure/taverne- amendment. Take-down policy If you believe that this document breaches copyright please contact us providing details, and we will remove access to the work immediately and investigate your claim. Downloaded from the University of Groningen/UMCG research database (Pure): http://www.rug.nl/research/portal. For technical reasons the number of authors shown on this cover page is limited to 10 maximum. Download date: 13-07-2022

Welcome message from author
This document is posted to help you gain knowledge. Please leave a comment to let me know what you think about it! Share it to your friends and learn new things together.
Transcript

University of Groningen
Optimizing gamma-ray spectrometers for UAV-borne surveys with geophysical applicationsvan der Veeke, S; Limburg, J; Koomans, R L; Söderström, M; van der Graaf, E R
Published in:Journal of Environmental Radioactivity
DOI:10.1016/j.jenvrad.2021.106717
IMPORTANT NOTE: You are advised to consult the publisher's version (publisher's PDF) if you wish to cite fromit. Please check the document version below.
Document VersionPublisher's PDF, also known as Version of record
Publication date:2021
Link to publication in University of Groningen/UMCG research database
Citation for published version (APA):van der Veeke, S., Limburg, J., Koomans, R. L., Söderström, M., & van der Graaf, E. R. (2021). Optimizinggamma-ray spectrometers for UAV-borne surveys with geophysical applications. Journal of EnvironmentalRadioactivity, 237, [106717]. https://doi.org/10.1016/j.jenvrad.2021.106717
CopyrightOther than for strictly personal use, it is not permitted to download or to forward/distribute the text or part of it without the consent of theauthor(s) and/or copyright holder(s), unless the work is under an open content license (like Creative Commons).
The publication may also be distributed here under the terms of Article 25fa of the Dutch Copyright Act, indicated by the “Taverne” license.More information can be found on the University of Groningen website: https://www.rug.nl/library/open-access/self-archiving-pure/taverne-amendment.
Take-down policyIf you believe that this document breaches copyright please contact us providing details, and we will remove access to the work immediatelyand investigate your claim.
Downloaded from the University of Groningen/UMCG research database (Pure): http://www.rug.nl/research/portal. For technical reasons thenumber of authors shown on this cover page is limited to 10 maximum.
Download date: 13-07-2022
Journal of Environmental Radioactivity 237 (2021) 106717
Available online 19 August 20210265-931X/© 2021 The Author(s). Published by Elsevier Ltd. This is an open access article under the CC BY license (http://creativecommons.org/licenses/by/4.0/).
Optimizing gamma-ray spectrometers for UAV-borne surveys with geophysical applications
S. van der Veeke a,b,*, J. Limburg b, R.L. Koomans b, M. Soderstrom c, E.R. van der Graaf a
a Department of Radiation Oncology, University Medical Centre Groningen, University of Groningen, Hanzeplein 1, 9713 GZ, Groningen, the Netherlands b Medusa Radiometrics Groningen, Skagerrak 26, 9723 JR, Groningen, the Netherlands c Department of Soil and Environment, Swedish University of Agricultural Sciences, Box 234, SE-532 23, Skara, Sweden
A R T I C L E I N F O
Keywords: Airborne gamma-ray spectrometry (GRS) Unmanned aerial vehicles (UAVs) Variogram Kriging Full spectrum analysis (FSA) Radiation footprint
A B S T R A C T
Heavy duty unmanned aerial vehicles (UAVs) have made it possible to fly with large gamma-ray spectrometers that weigh several kilograms. Moreover, they can be purchased at an affordable price. These large UAV-borne gamma-ray detection systems are used to map the naturally occurring radionuclides 40K, 238U, 232Th. Such platforms have the advantage that they can be deployed over terrain that is difficult to access, while still maintaining a high spatial resolution. In contrast to UAV-borne radioactive pollution studies, the naturally occurring radionuclides have a much lower activity and therefore require longer integration time, slower flying speed or a larger detector, in order to effectively determine the spatial radionuclide distribution. Therefore, the question arises: what is the minimum practical detector size required to successfully map 40K, 238U and 232Th concentrations from UAV platforms.
In this study an agricultural field has been mapped with three different scintillator-based gamma-ray spec-trometers: a 2000 ml, 1000 ml, and 350 ml detector. They were mounted together on the same UAV. At a flying height of 20 m and a speed of 5.6 m s− 1 the field was mapped. The various aerial measurements were compared to each other and to the ground-based measurements. The field had a low spatial variation in the 40K concen-tration (relative standard deviation (RSD) = 9%) and a larger variation for 238U and 232Th concentrations (RSD = 24% and 31% respectively).
Radionuclide concentrations have been extracted from the survey data by Full Spectrum Analysis (FSA). Uncertainties and variances of the radionuclides have been determined by using two methods. Firstly, they are calculated directly from the FSA output and secondly they are extracted from a variogram. The latter in-corporates spatial variation and was shown to provide a lower uncertainty. When using small detectors, the former approach could lead to the conclusion that the uncertainty is larger than the variance, while the vario-gram approach does capture the spatial variation.
All three detectors were able to characterize the spatial distribution of the 232Th concentration. It is shown that the 232Th concentration is a good predictor of the sand and clay fraction of the topsoil in the field. By comparing the UAV-borne measurements to the ground-based measurements it is found that UAV-borne measurements at 20 m height are less sensitive to extreme values than ground-based measurements and they have the tendency to shift to the mean concentration of the area.
The results of this study can be used to optimize the detector volume, survey height, and survey speed to maintain an acceptable accuracy for gamma-ray studies with small UAV-borne detectors.
1. Introduction
Unmanned aerial vehicles (UAVs) have made it possible to use
gamma-ray spectrometers in unmanned air-borne operations that have geophysical applications. The capacity to lift a payload in the order of kilograms is a prerequisite for these gamma-ray measurements because
* Corresponding author. Department of Radiation Oncology, University Medical Centre Groningen, University of Groningen, Hanzeplein 1, 9713 GZ, Groningen, the Netherlands.
E-mail addresses: [email protected], [email protected] (S. van der Veeke), [email protected] (J. Limburg), [email protected] (R.L. Koomans), [email protected] (M. Soderstrom), [email protected] (E.R. van der Graaf).
Contents lists available at ScienceDirect
Journal of Environmental Radioactivity
journal homepage: www.elsevier.com/locate/jenvrad
https://doi.org/10.1016/j.jenvrad.2021.106717 Received 5 May 2021; Received in revised form 15 July 2021; Accepted 5 August 2021

Journal of Environmental Radioactivity 237 (2021) 106717
2
these spectrometers rely on volume and weight to capture sufficient radiation in the detector (Nicolet and Erdi-Krausz, 2003). Off the shelf high capacity UAVs have been produced for some time now and one of the advantages of using them is that they are cost-effective.
Gamma-ray surveys are being used to estimate erosion (Tyler et al., 2001), to map mine tailings (Koomans et al., 2014), in precision agri-culture (Egmond et al., 2018; Piikki et al., 2015; Soderstrom et al., 2016), to characterize sediments (Anjos et al., 2007; de Meijer, 1998) and to map contamination of heavy metals or organic micro-compounds in sediments and soils (Soderstrom and Eriksson, 2013; van der Graaf et al., 2007) to name just a few.
Depending on the required resolution and the area to map, mea-surements are ground-based, usually by an off-road vehicle, or airborne, by a helicopter or aeroplane. When an area has to be mapped with a high spatial resolution, ground-based surveys are the preferred choice because the detector is close to the surface and has a small footprint. Airborne measurements are used when a large area has to be mapped, but have the inherent drawback that there will be a loss in resolution because of the flying height and speed. However, airborne measure-ments do have a number of advantages over ground-based measure-ments, since it is possible to access wet, rocky, dangerous and densely vegetated terrain.
UAV-borne gamma-ray measurements combine the advantages of both the ground-based and the airborne measurements. UAVs can fly over terrain that is not accessible by a ground-based vehicle while remaining close to the soil and they can capture radiometric data with high spatial resolution. Furthermore, the UAVs can be used in (radio-active) polluted areas that would otherwise pose a health risk to the operators. Recent publications show examples of these applications by mapping the 137Cs concentration as a result from the Fukushima Dai-Ichi nuclear power plant disaster (Martin et al., 2016; Mochizuki et al., 2017; Sanada and Torii, 2015; Tang et al., 2016). Another study located lost radioactive sources (Gong et al., 2019). The UAV-based radiometric survey technique is moving away from the proof of concept stage and has become routine application. Advanced algorithms are being devel-oped for inversion problems and hotspot identification (Zhang et al., 2018). Recently, it has been suggested as a technique to monitor radioactive materials in industrial plants (Aleotti et al., 2019). Reme-diation operations are generally executed in areas with a relatively high count rate due to the radioactive pollution, and therefore these opera-tions use relatively small scintillation detectors (which can be carried by UAVs).
The use of gamma-ray spectrometers in geophysical applications is significantly different from radioactive pollution mapping because, in general, the spectrometer has to determine the concentrations of the naturally occurring radionuclides 40K, 238U and 232Th from the much lower flux of gamma-rays the soil emits. Despite this limitation, the new possibilities of UAV-borne radiometric surveys have been recognized and various studies have been done to pioneer this new field. Promising results have been obtained in the characterizations of legacy uranium and iron mines (MacFarlane et al., 2014; Martin et al., 2015; Pirttijarvi and Oy, 2016; Salek et al., 2018).
However, a common denominator of all UAV-borne studies in recent literature is the use of relatively small scintillation detectors (<210 ml) and their focus on applications with high count rates, for example when locating radioactive sources, or mapping highly radioactive areas.
The present study has been initiated to provide information on the influence of detector volume on the accuracy of the measurement that can be achieved with a gamma-ray spectrometer used on a UAV for mapping natural soils. Because of the weight restriction that is associ-ated with UAV gamma-ray studies, this led to the main research question addressed in this article: what is the minimum practical detector size, while still providing accurate spatial information on the radionuclide distribution of natural soils.
The stochastic nature of radioactive decay introduces an uncertainty related to the number of detected counts, which again is related to the
detector volume. In order to answer the main question of this study two approaches are used. First, the physics approach, by calculating the un-certainty per measurement point, based on the number of measured counts and the data processing method. Second, the geology approach, by looking at the spatial variation of the measured concentrations.
In order to make comparisons between detector volumes, this study compares data collected on the ground to data from three CsI scintilla-tion detectors with different volumes. The detectors were mounted simultaneously on a UAV to map the radionuclide concentrations of an agricultural field. The radionuclide concentrations were extracted by using Full Spectrum Analysis (FSA) with height corrections (van der Veeke et al., 2021). Because the detectors have collected data simulta-neously, differences in the resulting radionuclide concentrations can only be caused by differences in detector characteristics. Previous comparisons between ground-based and airborne measurements have been used as a reference to construct a comparison methodology (Kock and Samuelsson, 2011).
The physics approach, to determine if spatial variation in the radio-nuclide concentration is recorded, entails calculating the uncertainty in each measurement point and calculating statistical properties of the dataset, such as the mean value and the variance of the radionuclide concentrations. If the measurement is sufficiently precise to capture spatial variation, these parameters can also be represented in a vario-gram. A variogram is commonly used to characterize the spatial auto-correlation of the measured radionuclide concentrations (Viscarra Rossel et al., 2014). The variogram shows the semivariance as a function of the separation distance between point measurements and thus char-acterizes the uncertainty of points measured close together, and it shows the variance of the whole dataset.
Points measured close together in a gamma-ray survey are correlated due to their overlapping footprint (van der Veeke et al., 2021), and due to the inherent geological connection between neighboring locations. Therefore, kriging interpolation is used to resample the measurement to include the spatial information that the surrounding data points provide (Burrough et al., 2015). This geostatistical interpolation technique, to estimate the likely value at the resampled positions, can only be applied if a proper variogram is constructed from which a weighting function can be determined. The geologist’s approach entails comparing the resulting interpolated radionuclide distribution at each spatial position for the different detector volumes.
The information presented in this paper is relevant for the design of UAV-based radiometric operations that map the naturally occurring radionuclides (40K, 238U and 232Th). Most important for these surveys is a well-motivated balance between the size of the gamma-ray spec-trometer and the accuracy of the measured activity concentration. Characterizing the differences between detector volumes will help choosing the optimum detector for the intended application.
The aim of the study is to compare the outcome in radionuclide concentrations, that result from measuring with various sizes of gamma- ray spectrometers mounted under a UAV, to the radionuclide concen-trations measured on the ground. This research should contribute to drafting the first version of a ‘guidelines for UAV-borne radioelement mapping’.
2. Materials and methods
2.1. Material
2.1.1. UAV A commercially available APID One UAV (Fig. 1) manufactured by
MainBase (Linkoping, Sweden) was used. This platform is designed in the shape of a helicopter and uses standard petrol to power the engines. The APID One has a rotor diameter of 3.3 m, empty weight of 130 kg and a maximum take-off weight of 210 kg. With a payload of 25 kg the UAV can fly up to 4 h continuously. The UAV can fly with wind speeds up to 15 m s− 1 (Beaufort 7) and during rainy weather.
S. van der Veeke et al.

Journal of Environmental Radioactivity 237 (2021) 106717
3
Fig. 1. Photograph of the APID One UAV carrying three gamma-ray spectrometers.
Fig. 2. Location of the test field (hatched) at the Bjertorp farm in southwest Sweden. Clay (fraction <0.002 mm) and sand content (fraction 0.06–2 mm) in already available topsoil samples are shown. The background map is a generalization of the Quaternary map from Geological Survey of Sweden (SGU, Uppsala, Sweden) showing large scale distribution of deposits (original scale 1:50000). Stippled areas are agricultural fields.
S. van der Veeke et al.

Journal of Environmental Radioactivity 237 (2021) 106717
4
2.1.2. Gamma-ray spectrometers Three gamma-ray spectrometers developed by Medusa Radiometrics
(Medusa Radiometrics BV, 2020) have been used. The MS-2000 Agri detector (12 kg), the MS-1000 Drone-borne detector (7 kg) and the MS-350 Ultralight drone detector (2.2 kg). These systems contain a 2000 ml CsI(Na), 1000 ml CsI(Tl) and a 350 ml CsI(Tl) scintillation crystal, respectively. Lidar, GPS and a barometer were connected to the measurement system to accurately determine the position and height of the measurements.
2.1.3. Test site The survey was carried out at the Bjertorp farm that is managed by
Lantmannen, the Swedish Farmers’ Co-operative. This is a farm located about 100 km northeast of Gothenburg, Sweden (58.248◦ N; 13.128◦ E) (Fig. 2). The total 880 ha area of the farm is used for crop production and agricultural research. One field with known and considerable spatial variability in soil texture was selected for this study. This field was judged to be suitable for carrying out UAV flights since there were no high obstacles such as trees in the field. The test field has a rectangular shape with dimensions of 400 m by 800 m (hatched area of Fig. 2). The field provided data collected by the UAV- and tractor-borne surveys. The area is in a transition zone between postglacial fine sand in the north and northwest (with very high sand content in the topsoil (70–80%), and relatively clayey sediments in the south (>35% clay; <10% sand), but with local variation (Fig. 2). At the time of the survey (May 7–8, 2019) the field was covered by winter wheat (Triticum aestivum L.) not higher than 20 cm (approximately growth stage DC31-32 (Zadoks et al., 1974)).
2.2. Survey
2.2.1. Ground-based measurements The MS-2000 CsI(Na) spectrometer and GPS were mounted at the
back of a tractor and placed at 80 cm above the ground (Fig. 3).The tractor mapped the test field by driving at an average speed of 2.7 m s− 1
(9.7 km h− 1), using a line spacing of 24 m and recording spectra at a rate of 0.33 Hz, providing a measurement point along the line each 8.1 m. The ground measurements were made on the May 8, 2019. The tem-peratures during the measurement were between 5 and 9 ◦C. The average precipitation in the week prior to the measurement was <1 mm per day, and there was no rain during, and in the 24 h before the measurement.
2.2.2. Airborne measurements The three detectors, MS-2000, MS-1000 and the MS-350, were
mounted under the APID One UAV in a custom designed container that places the detectors at a distance below the platform (Fig. 4). Sus-pending the detector under the UAV provided a clear ground view and thus minimized shielding of radiation coming from below. The center of the crystals were spaced 0.2 m apart, and taking the diameter of the crystals into account, this results in a clear field of view of ~100 m when flying at 20 m. Each detector contains a microprocessor and on-board storage space, so that each spectrometer independently records and stores its data.
The UAV mapped the test field by flying at a height of 20 m and at a speed of 5.6 m s− 1 (20 km h− 1. It used a line spacing of 25 m and recording spectra at a rate of 0.33 Hz, providing a measurement point along the line each 16.8 m. The UAV measurements were made on the May 7, 2019.
In general, the survey speed is a compromise between the available survey time, the survey area and the required accuracy of the results. The uncertainty is inversely related to the number of measured counts per spatial position. The number of detected counts is directly propor-tional to the detector volume. With the typical volumes of gamma-ray detectors used in geophysical surveys, a detector that has twice the volume but is moving at twice the speed, will give similar results. The survey speed in this research has been chosen to study the differences in uncertainty between the detector volumes, and is not optimized to give the best results for the smallest detector.
2.3. Full spectrum analysis and Monte-Carlo simulations
Spectra that are recorded by a gamma-ray spectrometer in e.g. soil mapping applications consist of a combination of gamma radiation emitted in the decay of the naturally occurring nuclides 40K, 238U and 232Th (and sometimes 137Cs), and their radioactive daughter nuclides. In order to extract radionuclide concentrations from the measured spectra, there are two common analysis approaches: i) the windows methods (Nicolet and Erdi-Krausz, 2003), which focuses on specific energy win-dows in which dominant features of each radionuclide are present, and ii) the Full Spectrum Analysis (FSA) approach, which fits the measured spectra with calibrated standard spectra that represent the response of the detector to a pure source of 40K, 238U or 232Th (Hendriks et al., 2001). The latter approach thus uses the whole spectrum to determine
Fig. 3. Mounting of the gamma-ray spectrometer at the back of a tractor. During the survey the detector was lifted to 80 cm above the ground.
S. van der Veeke et al.

Journal of Environmental Radioactivity 237 (2021) 106717
5
the nuclide concentrations. Radioactive decay is an inherent stochastic process. The total num-
ber of detected events (counts) during a certain time interval is Poisson distributed and is proportional to the activity of the source. The statis-tical uncertainty in the concentration due to the stochastic character of decay is proportional to the square root of the number of detected counts. In the case of gamma-ray measurements this means that the uncertainties in the activities decrease with the square root of the number of counts present in the analysis interval.
FSA is the preferred method for analysing data from spectral surveys with relatively small detectors. This is because FSA uses almost the complete spectrum and therefore has more counts and spectrum
structure present in the analysis interval compared to the windows method, that only uses the counts present in the three windows. As a result, when using FSA and correctly specified detectors, it is possible to have up to three times fewer counts present in the spectrum and achieve the same accuracy as when using the windows method (Hendriks et al., 2001).
The key parameters in FSA are the aforementioned standard spectra, which represent the response of the detector if it would measure a pure source of 40K, 238U or 232Th in a geometry equal to the actual mea-surement. These standard spectra are normalized to 1 Bq kg− 1 and they are used to derive the activity concentrations of the measured spectra. The concentrations are the number of times each standard spectrum
Fig. 4. Close-up photos of the mounting of the three spectrometers under the UAV (a). The Gamma-ray spectrometers were mounted on a plate (b) that is suspended under the UAV (c).
Fig. 5. Schematic representation of the full spectrum analysis approach in which the standard spectra for 40K, 238U and 232Th are fitted to the spectrum.
S. van der Veeke et al.
Journal of Environmental Radioactivity 237 (2021) 106717
6
occurs in the combination of standard spectra that best fit the measured spectrum (Fig. 5). The standard spectra used in this study are derived by doing Monte-Carlo simulation (MCNP 6.2 (Goorley et al., 2013), F8 tally and post simulation gaussian broadening). The standard spectra are validated by using the Stonehenge calibration facility, located at Medusa Radiometrics in Groningen (Tijs et al., 2016; Van der Graaf et al., 2011). To properly model the response at the UAV flying heights, the approach described in van der Veeke et al. (2021) has been used.
This previous reference not only describes the practical imple-mentation of the Monte-Carlo model, but also predicts the origin of ra-diation as a function of measurement height. The size of the footprint on the ground increases with measurement height. This effect has the implication that the resolution from the air and ground differ. The limitation in resolution is described by the footprint in van der Veeke et al. (2021).
2.3.1. Spectral data processing For each of the four datasets (one tractor-based; three UAV-based)
collected in this study, the radionuclide concentrations have been extracted with FSA by using the commercially available Gamman® spectral analysis software (Medusa Radiometrics, 2020). No cosmic or radon corrections where applied. The resulting radionuclide concen-trations and summed spectra were exported for further analysis.
2.4. Variogram and kriging
The spatial distribution of 40K, 238U and 232Th resulting from the spectral analysis have been used to calculate three detrended semi-variograms for each dataset. A semivariogram is used in geostatistics to describe the (dis)similarity in observed values between spatial positions of a dataset (Burrough et al., 2015). This semivariogram is fitted by a function which represents the weight factors used for kriging interpo-lation of the data. Kriging interpolation has been developed for inter-polation of mining data where a relatively low amount of samples was taken to predict the spatial distribution of analysis data (Cressie, 1990). In this research, however, it is used to include spatial information embedded in neighboring points to redistribute the data. For a semi-variogram that describes spatial radiometric data of the agricultural field in this research, a spherical model with a nugget was an appro-priate choice of function to fit (Burgess and Webster, 1980).
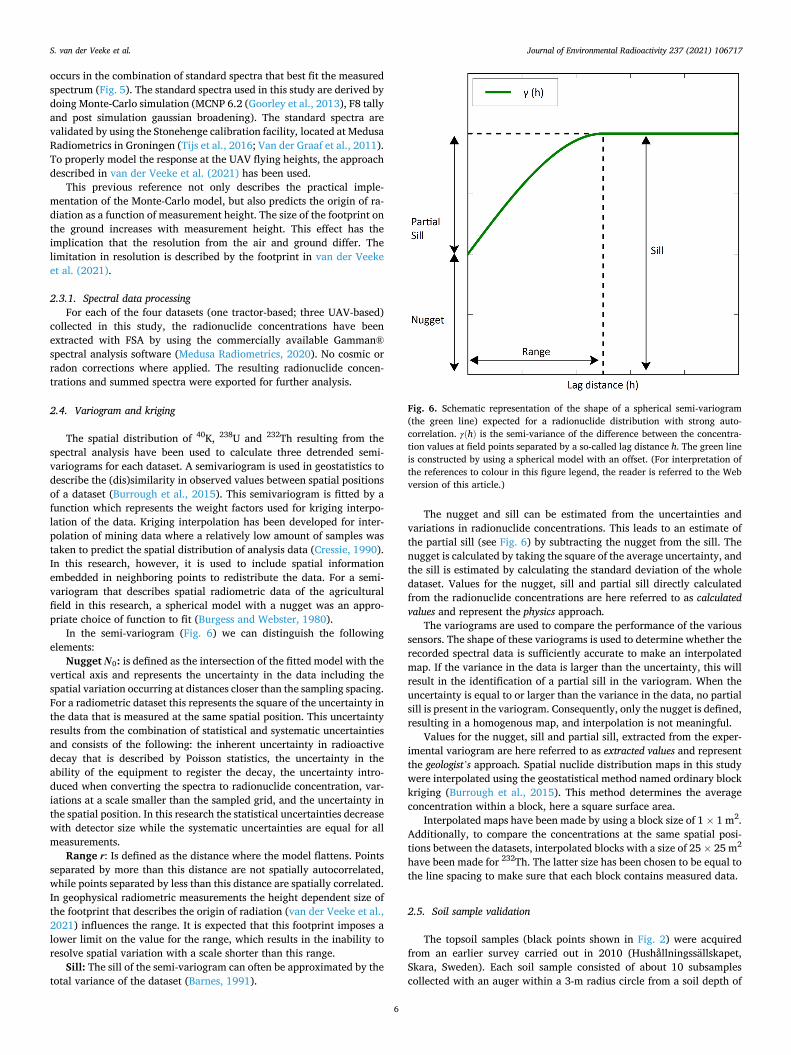
In the semi-variogram (Fig. 6) we can distinguish the following elements:
Nugget N0: is defined as the intersection of the fitted model with the vertical axis and represents the uncertainty in the data including the spatial variation occurring at distances closer than the sampling spacing. For a radiometric dataset this represents the square of the uncertainty in the data that is measured at the same spatial position. This uncertainty results from the combination of statistical and systematic uncertainties and consists of the following: the inherent uncertainty in radioactive decay that is described by Poisson statistics, the uncertainty in the ability of the equipment to register the decay, the uncertainty intro-duced when converting the spectra to radionuclide concentration, var-iations at a scale smaller than the sampled grid, and the uncertainty in the spatial position. In this research the statistical uncertainties decrease with detector size while the systematic uncertainties are equal for all measurements.
Range r: Is defined as the distance where the model flattens. Points separated by more than this distance are not spatially autocorrelated, while points separated by less than this distance are spatially correlated. In geophysical radiometric measurements the height dependent size of the footprint that describes the origin of radiation (van der Veeke et al., 2021) influences the range. It is expected that this footprint imposes a lower limit on the value for the range, which results in the inability to resolve spatial variation with a scale shorter than this range.
Sill: The sill of the semi-variogram can often be approximated by the total variance of the dataset (Barnes, 1991).
The nugget and sill can be estimated from the uncertainties and variations in radionuclide concentrations. This leads to an estimate of the partial sill (see Fig. 6) by subtracting the nugget from the sill. The nugget is calculated by taking the square of the average uncertainty, and the sill is estimated by calculating the standard deviation of the whole dataset. Values for the nugget, sill and partial sill directly calculated from the radionuclide concentrations are here referred to as calculated values and represent the physics approach.
The variograms are used to compare the performance of the various sensors. The shape of these variograms is used to determine whether the recorded spectral data is sufficiently accurate to make an interpolated map. If the variance in the data is larger than the uncertainty, this will result in the identification of a partial sill in the variogram. When the uncertainty is equal to or larger than the variance in the data, no partial sill is present in the variogram. Consequently, only the nugget is defined, resulting in a homogenous map, and interpolation is not meaningful.
Values for the nugget, sill and partial sill, extracted from the exper-imental variogram are here referred to as extracted values and represent the geologist’s approach. Spatial nuclide distribution maps in this study were interpolated using the geostatistical method named ordinary block kriging (Burrough et al., 2015). This method determines the average concentration within a block, here a square surface area.
Interpolated maps have been made by using a block size of 1 × 1 m2. Additionally, to compare the concentrations at the same spatial posi-tions between the datasets, interpolated blocks with a size of 25 × 25 m2
have been made for 232Th. The latter size has been chosen to be equal to the line spacing to make sure that each block contains measured data.
2.5. Soil sample validation
The topsoil samples (black points shown in Fig. 2) were acquired from an earlier survey carried out in 2010 (Hushållningssallskapet, Skara, Sweden). Each soil sample consisted of about 10 subsamples collected with an auger within a 3-m radius circle from a soil depth of
Fig. 6. Schematic representation of the shape of a spherical semi-variogram (the green line) expected for a radionuclide distribution with strong auto- correlation. γ(h) is the semi-variance of the difference between the concentra-tion values at field points separated by a so-called lag distance h. The green line is constructed by using a spherical model with an offset. (For interpretation of the references to colour in this figure legend, the reader is referred to the Web version of this article.)
S. van der Veeke et al.

Journal of Environmental Radioactivity 237 (2021) 106717
7
0–20 cm. The sampling locations were positioned with a Trimble GPS using a network-RTK service (Lantmateriet, Gavle, Sweden; ≈2 cm po-sitional accuracy). The samples were air-dried at 35–40 ◦C, milled and sieved through a 2-mm mesh. Clay content (fraction <0.002 mm) and sand content (fraction 0.06–2 mm) were analyzed by a sedimentation method (ISO 11277; Gee and Bauder, 1986).
3. Results
3.1. General results and ground-based maps
Fig. 7 shows spatial activity concentration maps for 40K, 238U- and 232Th-series resulting from the survey and kriging interpolation. The average concentration and standard deviation of all the measurements are directly calculated from the FSA output and are listed in Table 1. All concentrations resulting from the airborne measurements agree within 1σ with the ground-based measurements. The 40K and 238U maps for the MS-350 have been omitted because the uncertainty in the data is larger than the variance and thus a homogenous concentration for the whole field was found. Fig. 8c, f, i, l shows the histograms of the data used to calculate the values listed in Table 1.
40K has a very different concentration range than 238U and 232Th. Comparing the spatial variation of these radionuclides to each other, the maps have been plotted with concentration limits that extend to ± 2σ of the average value of the ground-based measurements. The largest spatial variation is found in the thorium concentration (Fig. 7c). For the po-tassium concentration, most spatial variation lies within 1σ (Fig. 7a). Uranium exhibits a similar, but less pronounced spatial variation (Fig. 7b) than thorium. This is further substantiated by the relative standard deviations of the three radionuclides (Table 1). Potassium and thorium represent the two extreme situations encountered in spatial radionuclide mapping: a homogenous and heterogenous field. Because uranium is similar, but less extreme than thorium, the subsequent sec-tions omit the uranium data from the discussion.
3.2. Variograms
Fig. 8 shows the variograms for the 40K (red) and 232Th (blue) for the four datasets derived by the method described in section 2.4. Detrending is necessary for thorium because of the presence of a northwest- southeast gradient in the field (Figs. 2 and 7). The coloured circles in Fig. 8 represent the calculated semivariances as a function of lag dis-tance. The black line is the spherical function fitted to the data by chi- squared minimization when using the calculated values as an initial guess (Table 2 in brackets). The initial range has been estimated by a visual inspection of the variogram data. Table 2 shows the extracted values for the nugget sill and range, taken from the spherical fit in the variogram and the calculated values are based on the data in Table 1.
3.2.1. General variogram results The ranges for potassium are in all measurements shorter than for
thorium when comparing the values per detector. All ranges are larger than the 95% footprint radius, indicating a scale of spatial variability that is larger than the footprint size. Because the spatial variability is larger than the footprint, even at 20 m, the same spatial variation in the field can be captured by both the ground-based and airborne measurements.
3.2.2. Calculated values vs variogram values The variograms shown in Fig. 8 are inspected and compared to the
typical spherical variogram structure presented in section 2.4 and shown in Fig. 6. The presence of this structure allows for the extraction of the nugget and sill, which are shown in Table 2. Only the variogram for potassium collected with the MS-350 detector (Fig. 8j) does not show this spherical structure. This is an indication that for this dataset the error (nugget) is larger than the variation (sill). Consequently, only the
nugget can be determined from this variogram. For all other variograms the nugget and partial sill can be determined. The values for the nugget and sill extracted from the variogram are compared to the square of the average error and the standard deviation, respectively, which are calculated from all the datasets without taking the spatial component into account (section 2.4).
Potassium: For both the nugget and the sill, the extracted and calculated values are very similar and only show small differences (<10%).
Thorium: With the exception of the nugget in the MS-2000gnd measurement, the estimated values for the nugget and sill are exclu-sively lower than the calculated values. For the nugget this difference becomes relatively more pronounced for decreasing detector size, whereas for the sill this difference becomes relatively less pronounced with decreasing detector size. Using the extracted values as the true values, the difference in the nugget varies between − 12% for the MS- 2000gnd down to − 55% for the MS-350air. The sill varies between 48% for the MS-2000gnd to 10% for the MS-350air.
3.3. Detector – detector comparison
Fig. 9a–c shows the comparison of the interpolated 232Th concen-trations recorded on the ground versus the concentrations recorded from the air. 232Th has been chosen because, based on Fig. 7, this is the radionuclide that has the largest spatial concentration variations and based on Fig. 8, this is for the MS-350air the only radionuclide for which a weighting function can be defined that result in a non-homogenous kriging interpolated map.
The identity lines (the 1:1 lines) have been added to each plot in Fig. 9, and by comparing the concentrations measured in the air-to the ground-based measurements (a-c), it can be seen that:
1. For all plotted datasets there is a larger number of points above the identity line than below, indicating that the measurements from the air result in a higher concentration than those from the ground.
2. This effect is stronger for low concentrations (<30 Bq kg− 1) than for high concentrations.
No fit (y = bx) on the data is shown in these figures (Fig. 9a–c) because the footprint when measuring at 20 m is significantly larger than measuring at 80 cm (van der Veeke et al., 2021) and because of these different measurement geometries, no strict equality is expected. Additionally, differences in the absolute value can be caused by soil moisture variations, or by calibration uncertainty. During the two measurement days, no significant amount of moisture was added to the soil (rainfall or irrigation) and temperature did not cause significant evaporation over this time period. Therefore, moisture is not considered to be of influence in this comparison. All detectors have been calibrated using the same procedure, using a Monte-Carlo model to predict the shape of the spectrum and a calibration measurement to verify the de-tector response (Tijs et al., 2016; Van der Graaf et al., 2011). However, these calibrations assume a perfectly flat surface with no vertical geo-metric elements (such as trees and ditches). This assumption is not completely valid at the edges of the field. This effect would be stronger for the measurements at height than the ground-based measurements and is the manifestation of a different footprint.
Fig. 9d–e shows a comparison of the 232Th concentrations from the MS-1000air and the MS-350air to the MS-2000air. A linear fit is added to the graph because all three measurements in the comparison measure the same footprint and thus it is expected that this will result in the same radionuclide concentrations at each spatial position. A fit of the function y = bx fit through the points shows a slope close to unity for both plots, which is an indication of good agreement between the concentrations measured in the air by the various detectors. Furthermore, the points are distributed on both sides of the identity lines, indicating no bias for one of the detectors.
S. van der Veeke et al.

Journal of Environmental Radioactivity 237 (2021) 106717
8
Fig. 7. Spatial distributions of 40K (a, d, g), 238U (b, e, h) and 232Th (c, f, i, j) resulting from mapping the target area with the three detectors at two different heights (80 cm (ground) and 20 m (air)). Maps have been made by using block kriging with the weighting functions shown in Fig. 8. For comparison the concentration scales have been fixed to the range of ± 2σ of the average value of the dataset as recorded by the ground-based measurement.
S. van der Veeke et al.

Journal of Environmental Radioactivity 237 (2021) 106717
9
3.4. Validation of clay and sand content
Fig. 10 shows the 232Th concentrations as a function of the clay and sand content of the soil samples (section 2.5) as measured in the various detector/height combinations. It is observed that there is a good cor-relation between the 232Th concentration in the ground-based mea-surement and the clay/sand content of the soil samples taken at the same spatial position (R2 = 0.92, 0.97 respectively). This correlation is pre-viously shown to exists for ground-based radiometric measurements (Van Der Klooster et al., 2011; Wijngaarden and Venema, 2002) The same correlation, but less pronounced, holds for the radionuclide con-centrations recorded from the air. Consistent with the deviations in Fig. 9a–c this is expected since the plots show a comparison between the sampled ground-based concentrations (point measurements) and the UAV-borne concentrations (surface measurements).
4. Discussion
The objective of this study is to determine the minimum practical detector size of a UAV-borne gamma-ray spectrometer, that will still providing accurate spatial information on the radionuclide distribution of 40K, 238U and 232Th. A tractor-borne survey with a 2000 ml CsI gamma-ray spectrometer is compared to the results from three different detector sizes, used simultaneously in a UAV-borne survey (2000 ml, 1000 ml and 350 ml CsI detectors). Full Spectrum Analysis (FSA) is used to extract radionuclide concentrations from the measured spectra. Var-iograms are calculated and used in kriging interpolation to calculate the spatial variation of the radionuclides. From these variograms the un-certainty per point and the variance of the test field are estimated and compared to the same parameters extracted directly from the FSA re-sults. Thereafter, the interpolated UAV-borne measurements are compared to both each other and to ground-based measurements, made with the same 2000 ml spectrometer to characterize the spatial accu-racy. And finally, the correlation between the clay and sand concen-trations in the soil versus the measured 232Th concentration is assessed for the various surveys.
4.1. Ground-based maps
Fig. 7 shows the spatial variation in 40K, 238U and 232Th concentra-tion for the agricultural field at the Bjertorp farm test area. The ground- based measurements have been analyzed by using the validated pro-tocols described in (Van der Graaf et al., 2011) and the resulting con-centrations are assumed to represent the ground truth. The UAV-borne
measurements have been analyzed by using the same protocols in combination with the spectral height corrections for the UAV range (van der Veeke et al., 2021). The radionuclide distributions have been plotted on a scale of ±2σ of the average ground-based concentration which clearly shows that there is significantly more relative variation in the 238U and 232Th concentrations distribution than in the 40K distribution. To characterize the spatial differences for this field, a survey has to be conducted in which the uncertainty (nugget) is smaller than the varia-tion (sill) of the field. In this study, this prerequisite is met for all measurements except for the 40K and 238U concentrations measured by the MS-350air and therefore these datasets cannot produce valid spatial distribution maps.
All maps that result from kriging interpolation show very similar spatial concentration structures throughout the field, where the largest short scale variation is present in the soil measurements. Fig. 10 shows that 232Th values for all detectors can be used up to a high degree of confidence to predict the clay and sand concentrations of the area, and thus all spectrometers and measurement geometries used in this study can be used to construct high resolution spatial maps of the soil composition.
4.2. Physics versus geology approach
Average values of radionuclide concentration are listed in Table 1 for the four datasets which are calculated from the data presented in the histograms shown in Fig. 8c, f, i, l. The listed average radionuclide concentrations agree within the 1σ uncertainty for the four detectors. As expected, the uncertainty and variations increase with decreasing de-tector size. This table shows that when the spatial component is not taken into account, the four datasets are in agreement with each other, which means that for this purpose the smallest 350 ml detector will be adequate to characterize the mean value area.
The variograms that include a spatial component for all measure-ments are shown in Fig. 8. An overview of the comparison of the calculated values to the variogram extracted values is listed in Table 2. From this table it can be observed that the values estimated directly from the FSA output match the values extracted from the variograms for 40K within 8%. The 232Th estimates all differ more than 10% from the values extracted from the variograms, and this difference becomes larger with decreasing detector size. These results show that the physics approach, that looks at the uncertainty and variance in the whole dataset, provides a good prediction of the spatial uncertainty and variance if the surveyed area is homogeneous, as is the case for 40K. When there is significant spatial variation in radionuclide concentration, as is the case for 232Th, this physics approach overestimates the uncertainty and variance.
Based on this physics approach a certain uncertainty is expected in the dataset. However, for all UAV-borne 232Th datasets in this research, it is demonstrated that the recorded radionuclide concentrations in a variogram show a lower uncertainty. This allows a weighting function to be established that results in an interpolated map which accurately describes the spatial variation throughout the field. The erroneous estimation of the physics approach would have led to the conclusion that the MS-350air
232Th measurements cannot be used to construct a spatial variation map. Table 2 lists the nugget as 510 and the sill as 430, meaning that the uncertainty is larger than the variance of the dataset and therefore, based on these numbers, all the variation would fall within this uncertainty, although the detrended variogram does show spatial correlation (Fig. 8k). The interpolated map (Fig. 7j) clearly shows the same structures as mapped with the other sensors (Fig. 7c, f, i). This is an example where the physics approach would have led to a different conclusion than the geology approach. Therefore, inspection of the (detrended) variogram during the survey would provide valuable information.
Modern spectrometers such as the ones used in this study (Medusa Radiometrics BV, 2020) contain an algorithm that does a real time analysis of the measured spectra, which, in theory, can produce
Table 1 Overview of the radionuclide activity concentrations extracted from the four measurements. The 1σ uncertainty has been calculated by taking the average of the uncertainties for the individual concentrations as reported by FSA. The standard deviation of the entire dataset is listed in Bq kg− 1 units and in the brackets as the relative standard deviation (RSD).
Average Concentration 1σ uncertainty StdDev ((RSD))
(Bq kg− 1) (Bq kg− 1) (Bq kg− 1) MS-2000gnd
40K 690 51 62 (9%) 238U 41 6.7 9.8 (24%) 232Th 32 4.7 10 (31%)
MS-2000air 40K 754 64 73 (10%) 238U 49 8.8 11 (23%) 232Th 36 6.0 10 (27%)
MS-1000air 40K 733 92 96 (13%) 238U 48 14 15 (30%) 232Th 36 10 11 (31%)
MS-350air 40K 770 180 170 (22%) 238U 43 31 28 (65%) 232Th 37 23 21 (55%)
S. van der Veeke et al.

Journal of Environmental Radioactivity 237 (2021) 106717
10
variograms during the measurement. This allows the operator to directly assess the results and, if necessary, adjust the survey by either flying lower and slower if the results are not sufficient, or flying higher and faster if the results are better than required for the survey.
4.3. Loss of short scale concentration variations
Fig. 9 shows a plot of the 232Th concentration measured from the air as a function of the concentration measured on the ground, when the
spectral data has been redistributed by using kriging interpolation. Fig. 9a–c shows a small structural overestimation of the concentration measured at 20 m compared to the concentration measured on the ground (12–16%), which is also observed in the average values for 232Th in Table 1. Fig. 9d–e shows a comparison between the measurements made at 20 m, showing good agreement and thus indicating that all three detectors in the air measure the same spatially distributed con-centrations, albeit more widely spread with the smallest sensor (Fig. 8c, f, i, l).
Fig. 8. Collection of variograms and showing the spatial correlation for 40K and 232Th and the associated histograms. The dotted points in the variograms represent the calculated semi-variances for potassium (red dots) and thorium (blue dots) and have units of (Bq kg− 1)2. The four rows represent (from top to bottom) data from the MS-2000gnd, MS-2000air, MS-1000air, and MS-350air, respectively. The black line in the variograms represent the fitted spherical weighting function and the brown background represents the footprints of the origin of radiation of 65%, 95% and 99% from dark to light, respectively (van der Veeke et al., 2021). For a measurement height of 80 cm these footprints have a radius of 2, 14 and 67 m and for 20 m these have radii of 39, 143 and 342 m. The histograms show the variation in the dataset for the four measurements. (For interpretation of the references to colour in this figure legend, the reader is referred to the Web version of this article.)
S. van der Veeke et al.

Journal of Environmental Radioactivity 237 (2021) 106717
11
This structural overestimation is hypothesized to be an underesti-mation of the soil concentrations. The calibration files that are used to extract the radionuclide concentrations assume a clear field of view for the detectors. This geometry is met for the UAV-borne detectors where they are mounted under the UAV, but in the case of the tractor mea-surements there is a small shielding effect due to the tires of the vehicle. Not correcting for this shielding effect, as is the case in this research, results in slightly lower radionuclide concentrations reported by the radionuclide analysis algorithm. This effect explains the structural overestimation, and it predicts that this effect is stronger for low con-centrations. When the detector is at the position of a cold spot, the shielding causes a stronger relative reduction of signal (counts from the surrounding hotter area are missed) than when the detector is above a hot spot (counts from the surrounding colder area are missed).
Ground-based measurements have a different footprint compared to measurements made with a UAV. At 80 cm the estimated 65% footprint is 2 m while this same amount of radiation originates from a footprint of 39 m at a measurement height of 20 m (van der Veeke et al., 2021). Measuring at the exact same spatial location, results in the same
measured concentrations when the average concentration in the volume of both footprints is equal.
It is expected that measurements from a higher altitude report radionuclide concentrations toward the mean value of the spatial dis-tribution. In case of an area with a locally elevated (hot spot) or reduced (cold spot) concentration which has a spatial size that is around 10 m in diameter, a measurement at 80 cm would include datapoints that solely capture the concentration of this local anomaly, and it should be possible to identify the boundaries of this anomaly. However, if this point would be measured from 20 m height, the detector always mea-sures a contribution of the surrounding radionuclide concentrations. Thus, the measurements at a larger elevation measure concentrations towards the mean value of the distribution.
The shift towards the mean value would imply that the UAV-borne measurements as plotted against the ground-based measurements in Fig. 9a–c would lie on a line with a slope <1. Indeed, when fitting the data Fig. 9a–c with a linear relation y = a + bx we find slopes of 0.86, 0.80 and 0.76 for the MS-2000, MS-1000 and MS-350 respectively.
Additionally, the shift towards the mean can be observed in Fig. 9 for
Table 2 Overview of the values for the nugget, partial sill and range extracted from fitting the variogram in Fig. 8 with an exponential function. The numbers in () brackets represent the calculated values (section 2.3.1). Calculated values have been marked with a * if the difference with respect to the extracted values is more than 10%.
Potassium Thorium
Nugget N0
Sill Range r
Nugget N0
Sill Range r
MS-2000gnd 2640 (2610) 3620 (3820) 140 25 (22*) 67 (99*) 210
MS-2000air 4240 (4150) 5180 (5360) 160 30 (36*) 64 (95*) 200
MS-1000 air 8415 (8450) 9170 (9190) 210 73 (95*) 100 (130*) 240
MS-350 air 29800 (31800) – – 330 (510*) 390 (430*) 140
Fig. 9. Comparison between detectors and survey geometries for the 232Th concentrations resulting from kriging interpolation when using a block size of 25 m Top (a–c): comparison between the concentrations measured from the air (20 m) on the y-axis to the ground-based concentrations (80 cm) on the x-axis. Bottom (d–e): comparison of the concentrations detected from the air with the MS-2000 concentrations on the x-axis and the MS-1000 (d) and MS-350 (e) on the y-axis.
S. van der Veeke et al.

Journal of Environmental Radioactivity 237 (2021) 106717
12
the low concentrations (<30 Bq kg− 1). The points plotted in this part of the graphs lie almost exclusively above the identity line. At the high end of the graph this distribution shifts towards the identity line, although the majority does not shift below the line. The absence of this shift below the identity line at high concentrations is hypothesized to be due to the absence of sufficiently pronounced hot spots in this field. This leads to the conclusion that the impact on the absolute concentrations of the shift to the mean value effect remains to be studied. Such a study should take the effects of different footprints into account due to the difference in measurement height, and possibly come up with a prediction of this effect.
The presented results are specific to the radionuclide variation that was found in the agricultural field when measuring at 20 m height at a speed of 5.6 m s− 1 while using CsI detectors that recorded spectra at an interval of 0.33 Hz. These results contribute to drafting the ‘guidelines for UAV-borne radioelement mapping’ at some point in the future. A full discussion of the various choices and requirements of such a generalized approach of a UAV-borne survey is out of the scope of the present research. The ‘guidelines for UAV-borne radioelement mapping’ should contain a generalized approach in choosing the appropriate measure-ment parameters for a survey, among which the detector volume, measurement height and speed. The guidelines should also include a discussion on the detector material and the detector cost, which will influence the chosen detector volume. The choice for the survey pa-rameters should be motivated by the required accuracy of the measurement.
5. Conclusions
In brief, the first question that comes up when choosing a detector for of a UAV-borne gamma-ray study is: “what is the minimum gamma-ray spectrometer size required to successfully map 40K, 238U and 232Th concen-trations?”. An appropriate choice results in collecting sufficient counts per unit of time to characterize the spatial radionuclide distribution when using practical flying speeds. This research has characterized the
differences in radionuclide concentrations that result from measuring with various sizes of gamma-ray spectrometers under a UAV. The results are compared to the radionuclide concentrations measured from the ground.
The physics approach would be to estimate the count rate of the measurement which results in an average uncertainty per measurement point. The typical geology approach is to interpolate the data and look at resulting maps which represent the spatial radionuclide distribution. This approach interpolates the individual data points and uses infor-mation embedded in neighboring points to estimate the spatial varia-tion. Using a variogram to assess the radionuclide data combines both these requirements in a single graph.
When dealing with significant spatial variation in the radionuclide concentration, a variogram is a better tool to estimate the uncertainty and variance (nugget and sill, respectively) than calculating these directly from the concentrations reported by full spectrum analysis. This study shows the case where the physics approach reports an uncertainty that is larger than the variance, which erroneously would lead to the conclusion that the used detector cannot be used to measure spatial variation. However, the geology approach shows that the sensor can perform better than expected and spatial variation can be mapped. Consequently, both approaches lead to different conclusions: the physics approach concludes that the sensor measures a homogenous field whereas the geology approach shows spatial radionuclide variation.
In the gamma-ray spectrometers typically used in geophysical mea-surements, the uncertainty depends on the number of collected counts in the measurement time interval. This count rate depends on the crystal volume, measurement height and measurement speed. All these pa-rameters can be optimized to fulfill the requirements of the survey that typically aims to capture a spatial variation within a certain accuracy. Using solely the physics approach to determine the detector re-quirements for a survey can lead to overspecification of the detector. This research has shown that the physics approach shows the worst case scenario and the actual measurements have a better uncertainty when the variogram is used for interpolation. A spectrometer that allows the
Fig. 10. Thorium concentration as a function of the percentage of clay and sand content at selected spatial positions in the field. The soil sample analysis procedure is described in section 2.5.
S. van der Veeke et al.

Journal of Environmental Radioactivity 237 (2021) 106717
13
inspection of the survey results in real-time would allow the operator to assess the results during the survey. If necessary, the survey parameters such as the flying height or speed can be adjusted to decrease the un-certainty in the resulting radionuclide concentrations. This will lead to a more efficient and more cost effective radionuclide mapping, which will be better suited for the survey requirements.
Measurements at increasing detector height have the tendency to shift towards the mean value of the distribution due to the increase of the footprint with measurement height. This has consequences for the interpretation of the results, in particular for the identification of hot and cold spots and their absolute radionuclide concentrations or when comparing soil samples to field measurements. Because of this effect, radionuclide concentration maps that result from airborne surveys do not necessarily map the same distribution as ground-based surveys. It is concluded that flying higher results in less sensitivity to extreme values and less spatial structure in the resulting radionuclide maps. Therefore, the required spatial resolution specifies the maximum flying height. Additionally, because of this sensitivity effect, the correlation between soil samples and mapped radionuclide concentrations is weaker.
Finally, it is shown in this study that for an agricultural field that has a relative spatial variation of 9% for 40K, a 350 ml scintillation detector at a flying height and speed of 20 m and of 5.6 m s− 1 can predict the average value, but does not collect sufficient counts at a 0.33 Hz sam-pling rate to characterize the spatial radionuclide concentration of the field. However, the same data can predict both the average concentra-tion as well as the spatial variation for 232Th, which has 31% relative spatial variation. A 1 l scintillation detector, or a bigger one, with the same survey parameters collects sufficient information to spatially characterize the radionuclide distribution for 40K and 232Th in this particular survey. It is shown that the spatial radionuclide information of 232Th can be used up to a high degree of confidence to predict the clay and sand concentrations of the measured area. This case study and its detector sizes can be used in the design of the survey parameters for UAV-borne surveys.
Declaration of competing interest
The authors declare the following financial interests/personal re-lationships which may be considered as potential competing interests: The author S. van der Veeke is employed by Medusa Radiometrics and sponsored with an ERDF grant from the European Union. The author declares no conflict of interest. The founding sponsors had no role in the design of the study; in the collection, analyses, or interpretation of data; in the writing of the manuscript; or in the decision to publish the results.
Acknowledgements
The research work is part of a larger project subsidised by the Eu-ropean Regional Development Fund (ERDF 2014–2020). The field work was carried out within a project financed by Vinnova (proj. no. 2016–04248). We wish to thank Bjertorp Farm, Sweden for letting us use the premises, equipment for field work, and soil analyses of the test field. Henrik Stadig at the Rural Economy and Agricultural Societies, Skara, Sweden carried out the ground-based measurements. Furthermore, we would like to thank MainBase for providing the APID One UAV together with a team of operators. Special thanks to Hannes Nilsson, Fredrik Barring, Anton Hemling, Mikael Eriksson and Wiktor Hildh for the operation of the UAV.
References
Aleotti, J., Micconi, G., Caselli, S., Benassi, G., Zambelli, N., Bettelli, M., Calestani, D., Zappettini, A., 2019. Haptic teleoperation of UAV Equipped with gamma-ray spectrometer for detection and identification of radio-active materials in industrial plants. In: Tolio, T., Copani, G., Terkaj, W. (Eds.), Factories of the Future: the Italian Flagship Initiative. Springer International Publishing, Cham, pp. 197–214. https:// doi.org/10.1007/978-3-319-94358-9_9.
Anjos, R.M., Veiga, R., Carvalho, C., Macario, K.D., Gomes, P.R.S., 2007. Geological provenance of Quaternary deposits from the southeastern Brazilian coast. Nucl. Phys., A 787, 642–647. https://doi.org/10.1016/j.nuclphysa.2006.12.075.
Barnes, R.J., 1991. The variogram sill and the sample variance. Math. Geol. 23, 673–678. https://doi.org/10.1007/BF02065813.
Burgess, T.M., Webster, R., 1980. Optimal interpolation and isarithmic mapping of soil properties: I the semi-variogram and punctual kriging. J. Soil Sci. 31, 315–331.
Burrough, P.A., McDonnell, R.A., Lloyd, C.D., 2015. Principles of Geographical Information Systems. Oxford university press.
Cressie, N., 1990. The origins of kriging. Math. Geol. 22, 239–252. https://doi.org/ 10.1007/BF00889887.
Egmond, F.M. Van, Veeke, S. Van Der, Knotters, M., Koomans, R.L., Limburg, J., 2018. Mapping soil texture with a gamma-ray spectrometer : comparison between UAV and proximal measurements and traditional sampling. WOt-technical report 137, 58p.
Gee, G.W., Bauder, J.W., 1986. Particle-size analysis. In: Klute, A. (Ed.), Methods of Soil Analysis. Part 1. Physical and Mineralogical Methods. Soil Science Society of America, Madison, WI, USA, pp. 383–411.
Gong, P., Tang, X. Bin, Huang, X., Wang, P., Wen, L.S., Zhu, X.X., Zhou, C., 2019. Locating lost radioactive sources using a UAV radiation monitoring system. Appl. Radiat. Isot. 150, 1–13. https://doi.org/10.1016/j.apradiso.2019.04.037.
Goorley, J.T., James, M.R., Booth, T.E., Brown, F.B., Bull, J.S., Cox, L.J., Durkee, J.W., Elson, J.S., Fensin, M.L., Forster, R.A., Hendricks, J.S., Hughes, H.G., Johns, R.C., Kiedrowski, B.C., Mashnik, S.G., McKinney, G.W., Pelowitz, D.B., Prael, R.E., Sweezy, J.E., Waters, L.S., Wilcox, T.A., Zukaitis, A., 2013. MCNP6 User’s Manual. LA-CP-13-00634. Los Alamos National Laboratory.
Hendriks, P.H.G.M., Limburg, J., De Meijer, R.J., 2001. Full-spectrum analysis of natural gamma-ray spectra. J. Environ. Radioact. 53, 365–380.
Kock, P., Samuelsson, C., 2011. Comparison of airborne and terrestrial gamma spectrometry measurements - evaluation of three areas in southern Sweden. J. Environ. Radioact. 102, 605–613. https://doi.org/10.1016/j. jenvrad.2011.03.010.
Koomans, R.L., van der Wal, P., Kamsma, T.P.J., 2014. A geophysical technique for the verification and quantification of zinc slag in roads. In: Near Surface 2009 - 15th EAGE European Meeting of Environmental and Engineering Geophysics. https://doi. org/10.3997/2214-4609.20147047.
MacFarlane, J.W., Payton, O.D., Keatley, A.C., Scott, G.P.T., Pullin, H., Crane, R.A., Smilion, M., Popescu, I., Curlea, V., Scott, T.B., 2014. Lightweight aerial vehicles for monitoring, assessment and mapping of radiation anomalies. J. Environ. Radioact. https://doi.org/10.1016/j.jenvrad.2014.05.008.
Martin, P.G., Payton, O.D., Fardoulis, J.S., Richards, D.A., Scott, T.B., 2015. The use of unmanned aerial systems for the mapping of legacy uranium mines. J. Environ. Radioact. https://doi.org/10.1016/j.jenvrad.2015.02.004.
Martin, P.G., Payton, O.D., Fardoulis, J.S., Richards, D.A., Yamashiki, Y., Scott, T.B., 2016. Low altitude unmanned aerial vehicle for characterising remediation effectiveness following the FDNPP accident. J. Environ. Radioact. 151 https://doi. org/10.1016/j.jenvrad.2015.09.007.
Medusa Radiometrics, 2020. Gamman. Medusa Radiometrics BV, 2020. http://medusa-radiometrics.com accessed 12.9.19. Meijer, R. De, 1998. Heavy minerals: from Edelstein to Einstein. J. Geochem. Explor.
81–103. Mochizuki, S., Kataoka, J., Tagawa, L., Iwamoto, Y., Okochi, H., Katsumi, N., Kinno, S.,
Arimoto, M., Maruhashi, T., Fujieda, K., Kurihara, T., Ohsuka, S., 2017. First Demonstration of Aerial Gamma-Ray Imaging Using Drone for Prompt Radiation Survey in Fukushima.
Nicolet, J.P., Erdi-Krausz, G., 2003. Guidelines for radioelement mapping using gamma ray spectrometry data, 179. International Atomic Energy Agency doi.org/IEAE- TECDOC-1363.
Piikki, K., Wetterlind, J., Soderstrom, M., Stenberg, B., 2015. Three-dimensional digital soil mapping of agricultural fields by integration of multiple proximal sensor data obtained from different sensing methods. Precis. Agric. 16, 29–45. https://doi.org/ 10.1007/s11119-014-9381-6.
Pirttijarvi, M., Oy, R., 2016. Radai’s UAV Based Radiometric Measurements at Rautuvaara Mine in Kolari. Radai Survey Report. www.radai.fi.
Salek, O., Matolín, M., Gryc, L., 2018. Mapping of radiation anomalies using UAV mini- airborne gamma-ray spectrometry. J. Environ. Radioact. 182, 101–107. https://doi. org/10.1016/j.jenvrad.2017.11.033.
Sanada, Y., Torii, T., 2015. Aerial radiation monitoring around the Fukushima Dai-ichi nuclear power plant using an unmanned helicopter. J. Environ. Radioact. 139, 294–299. https://doi.org/10.1016/j.jenvrad.2014.06.027.
Soderstrom, M., Eriksson, J., 2013. Gamma-ray spectrometry and geological maps as tools for cadmium risk assessment in arable soils. Geoderma 192, 323–334. https:// doi.org/10.1016/j.geoderma.2012.07.014.
Soderstrom, M., Sohlenius, G., Rodhe, L., Piikki, K., 2016. Adaptation of regional digital soil mapping for precision agriculture. Precis. Agric. 17, 588–607. https://doi.org/ 10.1007/s11119-016-9439-8.
Tang, X. Bin, Meng, J., Wang, P., Cao, Y., Huang, X., Wen, L.S., Chen, D., 2016. Efficiency calibration and minimum detectable activity concentration of a real-time UAV airborne sensor system with two gamma spectrometers. Appl. Radiat. Isot. 110, 100–108. https://doi.org/10.1016/j.apradiso.2016.01.008.
Tijs, M., Koomans, R., Limburg, H., 2016. Towards a global network of gamma-ray detector calibration facilities. Explor. Geophys. 47, 302–307. https://doi.org/ 10.1071/EG16016.
Tyler, A.N., Davidson, D.A., Grieve, I.C., 2001. In Situ Radiometric Mapping of Soil Erosion and Field-Moist Bulk Density on Cultuvated Fields, pp. 88–96. https://doi. org/10.1079/SUM200059.
S. van der Veeke et al.
Journal of Environmental Radioactivity 237 (2021) 106717
14
van der Graaf, E.R., Koomans, R.L., Limburg, J., de Vries, K., 2007. In situ radiometric mapping as a proxy of sediment contamination: assessment of the underlying geochemical and -physical principles. Appl. Radiat. Isot. https://doi.org/10.1016/j. apradiso.2006.11.004.
Van der Graaf, E.R., Limburg, J., Koomans, R.L., Tijs, M., 2011. Monte Carlo based calibration of scintillation detectors for laboratory and in situ gamma ray measurements. J. Environ. Radioact. 102, 270–282. https://doi.org/10.1016/j. jenvrad.2010.12.001.
Van Der Klooster, E., Van Egmond, F.M., Sonneveld, M.P.W., 2011. Mapping soil clay contents in Dutch marine districts using gamma-ray spectrometry. Eur. J. Soil Sci. 62, 743–753. https://doi.org/10.1111/j.1365-2389.2011.01381.x.
van der Veeke, S., Limburg, J., Koomans, R.L., Soderstrom, M., de Waal, S.N., van der Graaf, E.R., 2021. Footprint and height corrections for UAV-borne gamma-ray
spectrometry studies. J. Environ. Radioact. 231, 106545. https://doi.org/10.1016/j. jenvrad.2021.106545.
Viscarra Rossel, R.A., Webster, R., Kidd, D., 2014. Mapping gamma radiation and its uncertainty from weathering products in a Tasmanian landscape with a proximal sensor and random forest kriging. Earth Surf. Process. Landforms 39, 735–748. https://doi.org/10.1002/esp.3476.
Wijngaarden, M. Van, Venema, L., 2002. Radiometric sand–mud characterisation in the Rhine–Meuse estuary: Part A. Fingerprinting. Geomorphology 43, 87–101.
Zadoks, J.C., Chang, T.T., Konzak, C.F., 1974. A decimal code for the growth stages of cereals. Weed Res. 14, 415–421. https://doi.org/10.1111/j.1365-3180.1974. tb01084.x.
Zhang, S., Liu, R., Zhao, T., 2018. Mapping radiation distribution on ground based on the measurement using an unmanned aerial vehicle. J. Environ. Radioact. 193–194, 44–56. https://doi.org/10.1016/j.jenvrad.2018.08.016.
S. van der Veeke et al.
Related Documents