J. Sep. Sci. 2006, 29, 2265 – 2283 G. Iriarte et al. 2265 Gorka Iriarte 1 Nerea Ferreirós 1 Izaskun Ibarrondo 1 Rosa Maria Alonso 1 Miren Itxaso Maguregi 2 Lorena Gonzalez 1 Rosa Maria JimØnez 1 1 Kimika Analitikoaren Saila, Zientzia eta Teknologia Fakultatea, Euskal Herriko Unibertsitatea/UPV, Bilbo, Basque Country, Spain 2 Pintura Saila, Arte Ederretako Fakultatea, Euskal Herriko Unibertsitatea/UPV, Bilbo, Basque Country, Spain Original Paper Optimization via experimental design of an SPE-HPLC-UV-fluorescence method for the determination of valsartan and its metabolite in human plasma samples A chemometric approach was applied for the optimization of the extraction and separation of the antihypertensive drug valsartan and its metabolite valeryl-4- hydroxy-valsartan from human plasma samples. Due to the high number of experi- mental and response variables to be studied, fractional factorial design (FFD) and central composite design (CCD) were used to optimize the HPLC-UV-fluorescence method. First, the significant variables were chosen with the help of FFD; then, a CCD was run to obtain the optimal values for the significant variables. The meas- ured responses were the corrected areas of the two analytes and the resolution between the chromatographic peaks. Separation of valsartan, its metabolite valeryl- 4-hydroxy-valsartan and candesartan M1, used as internal standard, was made using an Atlantis dC18 100 mm63.9 mm id, 100 ĸ, 3 lm chromatographic column. The mobile phase was run in gradient elution mode and consisted of ACN with 0.025% TFA and a 5 mM phosphate buffer with 0.025% TFA at pH 2.5. The initial percentage of ACN was 32% with a stepness of 4.5%/min to reach the 50%. A flow rate of 1.30 mL/min was applied throughout the chromatographic run, and the column temperature was kept to 40 l 0.28C. In the SPE procedure, experimental design was also used in order at achieve a maximum recovery percentage and extracts free from plasma interferences. The extraction procedure for spiked human plasma samples was carried out using C8 cartridges, phosphate buffer (pH 2, 60 mM) as con- ditioning agent, a washing step with methanol-phosphate buffer (40 : 60 v/v), a drying step of 8 min, and diethyl ether as eluent. The SPE-HPLC-UV-fluorescence method developed allowed the separation and quantitation of valsartan and its metabolite from human plasma samples with an adequate resolution and a total analysis time of 1 h. Keywords: Experimental design / Human plasma / SPE-HPLC / Valeryl-4-hydroxy-valsartan / Valsar- tan / Received: February 21, 2006; revised: May 26, 2006; accepted: May 26, 2006 DOI 10.1002/jssc.200600093 1 Introduction Valsartan ((S)-N-valeryl-N-[29-(1H-tetrazol-5-yl) biphenyl-4- yl)-methyl]-valine) is an orally active specific angiotensin II receptor antagonist (ARA II) used as antihypertensive drug [1 – 3]. The compound has been shown to inhibit angiotensin II induced vasoconstriction in preclinical species by reducing systolic and diastolic blood pressure at peak effect after a given dose in clinical patients [4]. ARA II are currently being administered for the treat- ment of hypertension and are safe and effective agents for the treatment of hypertension and heart failure, either alone, or together with diuretics [5, 6], angioten- sin-converting enzyme (ACE) inhibitors [7 – 14], beta- blockers [15 – 17], or calcium channel blockers [18 – 19]. Because of this, they have been proposed as an alterna- tive to the more traditional ACE inhibitors [20]. Valsartan is affected by first-pass metabolism. The Valsar- tan parent compound is rapidly converted (20% of the initial dose) in its main metabolite valeryl-4-hydroxy-val- Correspondence: Professor Rosa Maria Alonso, Analytical Chem- istry, University of Basque Country, Barrio de Sarriena, s/n, P.O. Box 644, 48080 Bilbo, Leioa, Vizcaya, 48940, Spain E-mail: [email protected] Fax: +34-94-601-3500 Abbreviations: ARA II, angiotensin II receptor antagonist; CCD, central composite design; FFD, fractional factorial design; MLR, multiple linear regression; OVAT, one variable at a time; PLS-2, partial least squares regression model i 2006 WILEY-VCH Verlag GmbH & Co. KGaA, Weinheim www.jss-journal.com

Welcome message from author
This document is posted to help you gain knowledge. Please leave a comment to let me know what you think about it! Share it to your friends and learn new things together.
Transcript

J. Sep. Sci. 2006, 29, 2265 –2283 G. Iriarte et al. 2265
Gorka Iriarte1
Nerea Ferreir�s1
Izaskun Ibarrondo1
Rosa Maria Alonso1
Miren Itxaso Maguregi2
Lorena Gonzalez1
Rosa Maria Jim�nez1
1Kimika Analitikoaren Saila,Zientzia eta TeknologiaFakultatea, Euskal HerrikoUnibertsitatea/UPV, Bilbo,Basque Country, Spain
2Pintura Saila, Arte EderretakoFakultatea, Euskal HerrikoUnibertsitatea/UPV, Bilbo,Basque Country, Spain
Original Paper
Optimization via experimental design of anSPE-HPLC-UV-fluorescence method for thedetermination of valsartan and its metabolitein human plasma samples
A chemometric approach was applied for the optimization of the extraction andseparation of the antihypertensive drug valsartan and its metabolite valeryl-4-hydroxy-valsartan from human plasma samples. Due to the high number of experi-mental and response variables to be studied, fractional factorial design (FFD) andcentral composite design (CCD) were used to optimize the HPLC-UV-fluorescencemethod. First, the significant variables were chosen with the help of FFD; then, aCCD was run to obtain the optimal values for the significant variables. The meas-ured responses were the corrected areas of the two analytes and the resolutionbetween the chromatographic peaks. Separation of valsartan, its metabolite valeryl-4-hydroxy-valsartan and candesartan M1, used as internal standard, was made usingan Atlantis dC18 100 mm63.9 mm id, 100 �, 3 lm chromatographic column. Themobile phase was run in gradient elution mode and consisted of ACN with 0.025%TFA and a 5 mM phosphate buffer with 0.025% TFA at pH 2.5. The initial percentageof ACN was 32% with a stepness of 4.5%/min to reach the 50%. A flow rate of1.30 mL/min was applied throughout the chromatographic run, and the columntemperature was kept to 40 l 0.28C. In the SPE procedure, experimental design wasalso used in order at achieve a maximum recovery percentage and extracts freefrom plasma interferences. The extraction procedure for spiked human plasmasamples was carried out using C8 cartridges, phosphate buffer (pH 2, 60 mM) as con-ditioning agent, a washing step with methanol-phosphate buffer (40 :60 v/v), adrying step of 8 min, and diethyl ether as eluent. The SPE-HPLC-UV-fluorescencemethod developed allowed the separation and quantitation of valsartan and itsmetabolite from human plasma samples with an adequate resolution and a totalanalysis time of 1 h.
Keywords: Experimental design / Human plasma / SPE-HPLC / Valeryl-4-hydroxy-valsartan / Valsar-tan /
Received: February 21, 2006; revised: May 26, 2006; accepted: May 26, 2006
DOI 10.1002/jssc.200600093
1 Introduction
Valsartan ((S)-N-valeryl-N-[29-(1H-tetrazol-5-yl) biphenyl-4-yl)-methyl]-valine) is an orally active specific angiotensinII receptor antagonist (ARA II) used as antihypertensivedrug [1–3]. The compound has been shown to inhibit
angiotensin II induced vasoconstriction in preclinicalspecies by reducing systolic and diastolic blood pressureat peak effect after a given dose in clinical patients [4].ARA II are currently being administered for the treat-ment of hypertension and are safe and effective agentsfor the treatment of hypertension and heart failure,either alone, or together with diuretics [5, 6], angioten-sin-converting enzyme (ACE) inhibitors [7–14], beta-blockers [15–17], or calcium channel blockers [18–19].Because of this, they have been proposed as an alterna-tive to the more traditional ACE inhibitors [20].
Valsartan is affected by first-pass metabolism. The Valsar-tan parent compound is rapidly converted (20% of theinitial dose) in its main metabolite valeryl-4-hydroxy-val-
Correspondence: Professor Rosa Maria Alonso, Analytical Chem-istry, University of Basque Country, Barrio de Sarriena, s/n, P.O.Box 644, 48080 Bilbo, Leioa, Vizcaya, 48940, SpainE-mail: [email protected]: +34-94-601-3500
Abbreviations: ARA II, angiotensin II receptor antagonist; CCD,central composite design; FFD, fractional factorial design; MLR,multiple linear regression; OVAT, one variable at a time; PLS-2,partial least squares regression model
i 2006 WILEY-VCH Verlag GmbH & Co. KGaA, Weinheim www.jss-journal.com

2266 G. Iriarte et al. J. Sep. Sci. 2006, 29, 2265 –2283
sartan via oxidation of the C4 of the pentamide function[21] as shown in Scheme 1.
Due to this metabolism, we will find valsartan and itsmetabolite in human plasma. Therefore, it was desirableto develop a simple and fast procedure that could beapplied to the simultaneous determination of both com-pounds.
The existence of several fluorescent and chromophorefunctional groups in the molecular structure of the ARAII compounds such as biphenyl tetrazole, imidazole, andbenzimidazole [22, 23] makes possible the developmentof photometric and fluorimetric methods for the deter-mination of these compounds in biological fluids.
The determination methods reported for valsartan(alone, simultaneously with other ARA II or in combina-tion with diuretics, usually with hydrochlorothiazideHCTZ) in biological fluids are mainly HPLC methods withphotometric [24, 25] and fluorimetric [1, 26–35] detec-tion. GC coupled with MS [36] and fluorimetry [37] havealso been reported. No studies regarding simultaneousdetermination of valsartan and its metabolite have beenfound. Only Waldmeier et al. [21] have examined thepharmacokinetics and the pharmacodynamics of bothcompounds.
Today, it is generally accepted that the use of experimen-tal design affords the most convenient way to deal withthe optimization of processes since the traditional step-by-step approach involves a large number of indepen-dent runs. However, using chemometrical approaches,each parameter can be examined and optimized in a pre-defined range by constructing a series of experimentswhere the values for several parameters are changed atthe same time [38–43].
Several chemometric approaches have been applied tooptimize chromatographic and electrophoretic systemsfor the determination of drugs in biological fluids [44–47].
In this paper, the plasma sample treatment procedure aswell as the chromatographic method for the simulta-neous determination of the antihypertensive drug valsar-tan and its metabolite in human plasma samples havebeen optimized by means of experimental design.
2 Experimental
2.1 Instrumentation
The chromatographic system consisted of two WatersModel 510 HPLC pumps: a Waters Model 717 Plus Auto-sampler, a Waters 490E programmable multiwavelengthdetector, and a Waters 474 scanning fluorescence detec-tor (Milford, MA, USA). Chromatograms were recorded bymeans of a computer and were treated with the aid ofthe software Millenium 32 Chromatography Managerfrom Waters.
A Waters Atlantis dC18, 100 mm63.9 mm id, 100 �,3 lm column was used to perform the separation. It wasthermostated at 40 l 0.28C in a column oven controlledby a Waters Temperature Control Module. Previous tothe analytical column, a 10 lm Waters lBondapak C18guard column was placed to prevent column degrada-tion.
pH of solutions was measured with a Crison GLP 22 pH-meter (Barcelona, Spain) using a Crison glass-combinedelectrode model 5209 with a reference system Ag/AgCland electrolyte KCl 3 M saturated AgCl.
Plasma samples were centrifuged at constant tempera-ture (48C) in an Eppendorf (Hamburg, Germany) model5804R centrifuge, previous to the clean-up procedure.The SPE cartridges were placed in a vacuum manifoldfrom Supelco (Bellefonte, PA, USA) coupled to a vacuumpump from Millipore (Bedford, MA, USA). Extractedplasma samples were evaporated to dryness under anitrogen stream using a Zymark Turbovap evaporator LV(Barcelona, Spain).
The data analysis of the results (chemometricapproaches, study of the regression models, etc.) was per-formed using The Unscrambler software v9.2 (Oslo, Nor-way; www.camo.com).
2.2 Materials and reagents
Valsartan ((S)-N-valeryl-N-[29-(1H-tetrazol-5-yl) biphenyl-4-yl)-methyl]-valine) and its metabolite, valeryl-4-hydroxy-valsartan (N-(4-hydroxy-1-oxopentyl)-N-[[29-(1H-tetrazol-5-yl)[1,19-biphenyl]-4-yl]methyl]-L-valine), were kindly sup-plied by Novartis Pharma AG (Basel, Switzerland). Cande-sartan M1 (2-ethoxy-1-[[29-(1H-tetrazol-5-yl)biphenyl-4-yl]methyl]-1H-benzimidazole-7-carboxylic acid) used asinternal standard was provided by Astra Zeneca R&D(M�ndal, Sweden).
Different HPLC-grade solvents were used: ACN andmethanol were obtained from Scharlab (Barcelona,Spain); THF, chloroform, n-hexane, ethyl acetate, anddiethyl ether were supplied by Carlo Erba (Milan, Italy);and 2-propanol was obtained from Panreac (Barcelona,Spain). Dichloromethane, analytical grade quality, waspurchased from Panreac. Sodium dihydrogen phosphate,
i 2006 WILEY-VCH Verlag GmbH & Co. KGaA, Weinheim www.jss-journal.com
Scheme 1.

J. Sep. Sci. 2006, 29, 2265 –2283 Optimization of valsartan and its metabolite in plasma 2267
sodium acetate, and trisodium citrate were supplied byMerck (Darmstadt, Germany) and Sigma (St. Louis, USA)and were of pro-analysis quality. Reagent grade TFA,phosphoric acid, and acetic acid were purchased fromCarlo Erba.
Purified water from a Milli-Q Element A10 Milliporewater system was used in the preparation of the follow-ing buffer solutions: H3PO4/KH2PO4 (pH 2 and 3),CH3COOH/CH3COONa (pH 4 and 5), citric acid/citrate(pH = 6), KH2PO4/K2HPO4 (pH 7 and 8). The pH wasadjusted to the desired value by using volumes of 1 MHCl and KOH solutions.
The clean-up procedure was performed using SPE car-tridges: C2, C8, C18, CH, Ph, CN (100 mg bed packing,1 mL volume capacity) from Varian (Harbour City, CA,USA). Extracted plasma samples were evaporated to dry-ness under a nitrogen stream, and their filtration wasperformed with polyvinylidene fluoride (PVDF) (u= 13 mm), hydrophobic and hydrophilic PTFE (u = 4, 13,and 13 mm, respectively), and nylon filters (u = 4 and13 mm) obtained from Millipore; hydrophobic PTFE(u = 13 mm), nylon (u = 4 and 13 mm), and hydrophilicpolypropylene (u = 13 mm) filters supplied by PALL (AnnArbor, MD, USA); glass fiber filters (u = 13 mm) pur-chased from Schleicher&Sch�ll (Dassel, Germany); andhydrophilic cellulose filters (u = 4 mm) obtained fromSartorius (Goettingen, Germany).
2.3 Preparation of standard solutions and spikedplasma samples
Stock solutions (107 and 186 lg/mL) of valsartan and itsmetabolite valeryl-4-hydroxy-valsartan were prepared in100% methanol by weight. A 99.26 lg/mL stock solutionof candesartan M1 (Scheme 2) used as internal standard,was also prepared in 100% methanol. These solutionswere diluted with methanol to produce 20 lg/mL work-ing solutions. All solutions were stored at 88C, protectedfrom light.
For the chromatographic optimization, a 1 lg/mL solu-tion of each drug was prepared. For SPE studies, blankplasma samples were daily spiked to a final concentra-tion of 1.1 lg/mL in valsartan and in its metabolite and1.2 lg/mL in candesartan M1.
2.4 Chromatographic conditions
The mobile phase consisted of a mixture of ACN with0.025% TFA and phosphate buffer (5 mM, pH = 2.5) with0.025% TFA and was delivered in gradient mode at a flowrate of 1.30 mL/min. The gradient used is shown in Table1. Before use, the mobile phase was filtered through a0.45 lm type HVLP Durapore membrane filter from Milli-pore and degassed in an ultrasonic bath. The samplevolume injected into the chromatographic system was20 lL, and the chromatographic separation was perform-ed at 40 l 0.28C. The eluent was monitored with a fluores-cence detector at 234 and 378 nm excitation and emis-sion wavelengths, respectively, and at 234 nm using aphotometric detector.
2.5 Plasma sample collection
Drug-free control human plasma was purchased fromthe Blood Bank of Galdakao Hospital (Bizkaia, BasqueCountry) and collected in polypropylene tubes to be fro-zen at –208C until analysis.
Venous blood samples were extracted from hypertensivepatients under treatment with valsartan; they wereimmediately transferred into heparinized tubes (con-taining tripotassium EDTA) and gently mixed. Blood sam-ples were centrifuged at 3500 rpm for 10 min under con-trolled temperature (48C) to avoid either decompositionor biological activity. The plasma supernatant was care-fully separated from blood cells and collected in polypro-pylene tubes to be frozen at –208C until analysis.
Only a single sample was obtained from each patient at apeak time interval (around 2 h after the intake, timeinterval which is supposed to include maximum plasmaconcentration levels for valsartan and a considerableamount of its metabolite).
2.6 Extraction procedure for plasma samples
One milliliter aliquots of blank plasma samples werespiked with the working solutions of valsartan, valeryl-4-hydroxy-valsartan, and IS to achieve 1.1 lg/mL concentra-tion for both analytes and 1.2 lg/mL for the IS; 1 mL of0.5 M phosphoric acid was added to all samples, followedby brief vortex mixing and centrifuged for 5 min at
i 2006 WILEY-VCH Verlag GmbH & Co. KGaA, Weinheim www.jss-journal.com
Scheme 2.
Table 1. Gradient elution conditions
Time(min)
ACN0.025% TFA
Phosphate buffer0.025% TFA
Flow rate(mL/min)
0 32 68 1.304 50 50 1.309 50 50 1.309.5 32 68 1.30
14 32 68 1.30

2268 G. Iriarte et al. J. Sep. Sci. 2006, 29, 2265 –2283
10 000 rpm in a high speed centrifuge refrigerated at48C.
The C8 SPE cartridges were conditioned with 2 mL ofmethanol, followed by 1 mL of phosphate buffer (60 mM,pH 2). The plasma samples were manually applied to thecartridges and washed with 1 mL methanol–phosphatebuffer solution (40 :60 v/v), followed by an 8 min dryingperiod at high vacuum. Before elution, 0.2 mL of 10% v/vethyleneglycol solution in methanol was added to thetest tubes to prevent adsorption processes of these ARA II[28, 48]. Finally, the compounds were eluted with 0.5 mLof diethyl ether.
The eluent was evaporated to dryness under a nitrogenstream at 608C. The residue was reconstituted with100 lL of mobile phase, vortex mixed, filtered with aPALL GH-Polypro (GHP) Acrodisc minispike outlet syringefilter (u = 13 mm, 0.45 lm, GHP hydrophilic polypropy-lene membrane) and transferred to autosampler vials.Twenty microliter aliquots were injected onto the HPLCsystem for analysis.
2.7 Efficiency and repeatability of the extractionprocedure
The repeatability and efficiency of the extraction proce-dure were determined by extracting replicates of spikedplasma samples (n = 6).
The extraction efficiency, expressed in terms of recoverypercentage, was estimated by comparing the chromato-graphic peak areas obtained for the compounds inspiked plasma samples with those of the reference sam-ples. To prepare these reference samples, blank plasmasamples were extracted and previous to the evaporationstep, spiked with the same drug concentration levels.Corrected peak areas were considered for all calculations(peak area ratios of valsartan and its metabolite againstinternal standard).
The repeatability of the extraction was expressed as per-centage of RSD.
2.8 Selectivity of the extraction procedure
Selectivity of the assay was established with six indepen-dent sources of blank plasma samples by comparing thechromatograms obtained from these plasma sampleswithout and with the addition of low concentrations ofthe studied compounds (150 ng/mL for valsartan and itsmetabolite and 650 ng/mL for the IS). The chromato-grams were visually inspected for possible interferingchromatographic peaks from plasma endogenous sub-stances.
3 Results and discussion
3.1 Optimization of the chromatographicseparation
The large number of variables to be considered in theHPLC separation would imply an extremely complicatedexperimental design. Therefore, in order to reduce thenumber of experiments, some of these variables werestudied by means of traditional methodology “one vari-able at a time” (OVAT) and were fixed prior to the use ofexperimental design. These variables were the analyticalcolumn, the organic modifier in the mobile phase, theelution mode, the internal standard, and the detectionwavelengths (excitation and emission).
In a second step, two different experimental designswere applied: a fractional factorial design (FFD) to evalu-ate which of the considered variables were significantfactors, and a central composite design (CCD) to optimizethese factors in the previously selected experimentaldomain. To define this domain, the experiments usingOVAT methodology were taken into account.
For all the experiments carried out during the chromato-graphic optimization, a 1 lg/mL standard solution wasprepared, containing valsartan, its metabolite and cande-sartan M1 (IS).
3.1.1 OVAT methodology
In order to choose the optimal detection wavelengths,several excitation and emission spectra were collectedfor valsartan, its metabolite and the internal standard atdifferent pH values. All compounds were fluorescentonly at pH values lower than 5.0, thus below their pKa
values: 4.90 l 0.09 for valsartan and 3.9 l 0.1 for cande-sartan M1 [49]. Excitation and emission at 254 and378 nm, respectively, were chosen as wavelengths sincethey provided the maximum relative fluorescent inten-sity; 254 nm was also chosen for the photometric detec-tion.
The performance of seven analytical columns waschecked by running different mobile phases, containingmethanol, ACN, or mixtures of both organic modifiers inisocratic mode. The analytical columns tested were:lBondapak C18 300 mm63.9 mm id, 125 �, 10 lm;Supelcolsil ABZ+Plus 250 mm64.6 mm id, 100 �, 5 lm;Nova-Pak Silica 150 mm63.9 mm id, 60 �, 4 lm; Nova-Pak CN HP 150 mm63.9 mm id, 60 �, 4 lm; AtlantisdC18 100 mm63.9 mm id, 100 �, 3 lm; Nova-Pak C18150 mm63.9 mm id, 60 �, 4 lm and Nova-Pak C8150 mm63.9 mm id, 60 �, 4 lm. The organic modifierpercentages ranged from 20 to 50% and the pH from 2 to4. The flow rate and the temperature of the column werefixed at 1 mL/min and 308C.
i 2006 WILEY-VCH Verlag GmbH & Co. KGaA, Weinheim www.jss-journal.com

J. Sep. Sci. 2006, 29, 2265 –2283 Optimization of valsartan and its metabolite in plasma 2269
ACN was chosen as organic modifier since it providedsharper and higher chromatographic peaks than theones obtained by using methanol or mixtures of both. Byusing ACN, we obtained better resolution. The analyticalcolumn which offered the best chromatographic peakshapes and resolution, using ACN as organic modifier,was Atlantis dC18.
Since the metabolite exhibited a slight peak tail in allchromatographic conditions, a TFA percentage wasadded to the mobile phase in order to optimize the peakshapes [21, 50].
The use of an isocratic elution mode did not allow theoptimum resolution between the studied drugs: IS andplasma endogenous compounds. Due to this fact, a gradi-ent elution mode was used. Nevertheless, the isocraticconditions tested were of great help in setting the gradi-ent elution conditions.
The last step in the OVAT methodology was the selectionof the internal standard. For quantitative determinationof any drug belonging to the ARA II family, any othercompound from the same family is normally used as theinternal standard. In this case, candesartan M1 was cho-sen as internal standard since the rest of the compoundstested either gave rise to chromatographic peaks whichoverlapped with the metabolite or eluted at too highretention times.
3.1.2 Screening phase: FFD
The experiments needed to complete a whole factorialdesign were reduced by introducing a confounding andrunning the so-called FFD. The variables considered inthe FFD for valsartan and its metabolite were the flowrate (A), the temperature of the column (B), the pH of themobile phase (C), the percentage of TFA in the mobilephase (D), the initial composition of mobile phase (E),and the stepness of ACN during the gradient elutionmode (F). The defined response variables were the cor-rected area (analyte area/internal standard area) and theresolution between the chromatographic peaks (Rs). Aminimum resolution of 1 was considered taking intoaccount the quantitative aim of this work. Two responseswere defined as Rs(IS – M1), Rs(Vals – IS) as:
R2 ¼ 2ðt2 � t1Þðw2 þ w1Þ
ð1Þ
where t1 and t2 represent retention times of peaks 1 and 2and w1 and w2 represent widths of peaks 1 and 2, respec-tively.
The FFD is able to identify the influence of each param-eter as well as first-order interactions between factors.FFD involves 2k – p experiments, where k is the number offactors studied and p accounts for the degree of fraction-ality of the FFD (p a k) [41].
In this case, in order to perform a lower number ofexperiments (26 – 2), two factors were confused with theother factors as follows:
ACN% at the beginning of the gradient(E) = flow (A)6temperature (B)6pH (C)
Stepness (F) = temperature (B)6pH (C)6TFA%in the mobile phase (D)
A two level FFD involving 16 runs was carried out. Allexperiments were performed in random order to avoidsystematic errors. Furthermore, two replicates of the cen-tral point were run corresponding to the center of theexperimental domain to test the model linearity and toobtain an estimation of experimental variance. Matrixfor the experimental domain in which every factor wasevaluated in the FFD is shown in Table 2.
Limit values for the flow rate of the mobile phase wereset to the usual working parameters. In order to avoiddamage to the column, the highest value for the tem-perature of the column was fixed at 508C. Based on thefluorescent properties of valsartan, its metabolite andthe internal standard, pH values were fixed below 5 andabove 2 in order to prevent column degradation. TFA per-centages added to organic and aqueous phases were simi-lar to those found in [21, 50].
As mentioned before, the use of gradient elution modewas necessary to perform the optimization. In order tosimplify the number of variables corresponding to thegradient, the duration of gradient stepness was fixed to4 min. The initial composition of organic modifier per-centage, one of the theoretically most influential factors,was varied in order to get stronger or weaker mobilephases. Some experiments previously carried out aidedto fix the interval between 20 and 40% of ACN. The linearstepness was varied from 1 to 6 ACN%/min.
The data analysis of the results was performed using TheUnscrambler program. This program defines theresponses as a function of the considered variables (xi) byusing analysis of variance. The treatment of these dataand the analysis of variance gave rise to the resultsshown in Table 3, in which the significant variables andinteractions are qualitatively collected, considering a sig-nificance level of 95% (if p value a0.05, the effect isregarded to be significant).
According to the results obtained from this model, onlythe initial percentage of the organic modifier in themobile phase and the interaction between the ACN per-centage and the gradient stepness were significant andaffected the valsartan's corrected area, while no variableaffected the metabolite's corrected area. Resolutionbetween chromatographic peaks was significantlyaffected by most of the considered variables.
i 2006 WILEY-VCH Verlag GmbH & Co. KGaA, Weinheim www.jss-journal.com

2270 G. Iriarte et al. J. Sep. Sci. 2006, 29, 2265 –2283
It was decided to run a more complex experimentaldesign to exhaustively set the influence of these factorson experimental response (CCD). For this purpose, it wasnecessary to reduce the number of factors to be consid-ered [38]. Since the column temperature and the TFA%showed a negligible effect on the shape of chromato-
graphic peaks, we decided to fix these two factors in the0 level used in the FFD (T = 408C, TFA% = 0.025%), thussimplifying the experimental design.
3.1.3 Optimization phase: CCD
A CCD was built using the remaining four variables: flowrate of the mobile phase (A), pH value (B), initial ACN%(C), and gradient stepness (D).
A CCD consists of a full factorial design plus an orthogo-nal star design. This CCD involved 24 runs plus threereplicates of the central point. The design matrix for theexperiments is given in Table 4. The high number of runstogether with the time needed for experimental proce-dure made it impossible to carry out a whole sequence inthe same day, so it was decided to divide the experimentsinto 3 days.
Fortunately, the CCD consists of two main sets of experi-ments: cube and star samples. These two groups have themathematical property of contributing to the estimationof a quadratic model independently from each other. Asa consequence, if some of the experimental conditionsvary slightly between the first group and the second one,it will not change the computed effects [38]. As a result ofthe long sequence, cube experiments were performed onthe first day; star experiments on the second day; and onthe third day, those experiments that by previous testswere anticipated incoherent or too long. All experimentswere performed in random order, and every day a repli-cate of the central point was carried out.
i 2006 WILEY-VCH Verlag GmbH & Co. KGaA, Weinheim www.jss-journal.com
Table 2. Variables (A, B, C, D, E, and F) and responses (corrected areas and resolutions) from the 26–2 proposed FFD for theoptimization of the chromatographic system HPLC-UV-fluorescence for the separation of valsartan, valeryl-4-hydroxy-valsartanand the internal standard candesartan M1 in standard solutions
Experi-ment
Flow(mL/min)(A)
T(8C)(B)
pH(C)
%TFA(D)
%ACN(E)
Stepness(during4 min) (F)
CorrectedareaVals-M1
Correctedarea Vals
Rs(IS-Vals.M1) Rs(Vals-IS)
1 0.8 30 2.00 0 20 1 1.24 8.71610 – 3 8.00 12.002 1.3 30 2.00 0 40 1 1.26 1.69 1.20 4.113 0.8 50 2.00 0 40 6 1.07 1.48 1.15 3.124 1.3 50 2.00 0 20 6 1.16 1.56 1.22 2.945 0.8 30 4.00 0 40 6 1.31 1.68 1.06 2.846 1.3 30 4.00 0 20 6 1.29 1.47 1.56 2.027 0.8 50 4.00 0 20 1 1.91 2.25 2.92 6.398 1.3 50 4.00 0 40 1 1.33 1.69 0.96 2.579 0.8 30 2.00 0.050 20 6 1.08 1.43 1.09 3.62
10 1.3 30 2.00 0.050 40 6 1.20 1.60 1.07 3.3911 0.8 50 2.00 0.050 40 1 1.22 1.62 1.09 3.9712 1.3 50 2.00 0.050 20 1 1.28 2.79610 – 2 6.00 10.0013 0.8 30 4.00 0.050 40 1 1.13 1.49 1.84 3.6814 1.3 30 4.00 0.050 20 1 1.27 1.80610 – 2 7.00 11.0015 0.8 50 4.00 0.050 20 6 0.99 1.32 1.69 2.5716 1.3 50 4.00 0.050 40 6 1.10 1.45 1.62 2.7817 1.05 40 3.00 0.025 30 3.5 1.10 1.44 2.17 3.2118 1.05 40 3.00 0.025 30 3.5 1.18 1.54 2.09 3.27
Table 3. Significance of the variables over the definedresponses by using analysis of variance (considering a sig-nificance level of 95%) in the 26 – 2 proposed FFD for the opti-mization of the chromatographic system HPLC-UV-fluores-cence to separate valsartan, valeryl-4-hydroxy-valsartan,and IS in stock solutions
Effects overview significance testing method: CenterVariable Corrected
areaVals-M1
CorrectedareaValsartan
Rs(IS-Vals-M1) Rs(Vals-IS)
Flow (A) NS NS NS NSTemperature (B) NS NS – –pH (C) NS NS NS –%TFA (D) NS NS + +%ACN (E) NS + – –Gradientstepness (F)
NS NS – –
AB = CE NS NS + +AC = BE NS NS + +AD = EF NS – ++ ++AE = BC = DF NS NS NS NSAF = DE NS NS NS -BD = CF NS NS + +BF = CD NS NS + +
(NS): nonsignificant; (+): positive influence; ( – ): negativeinfluence; (++/ – ): grade of influence.

J. Sep. Sci. 2006, 29, 2265 –2283 Optimization of valsartan and its metabolite in plasma 2271
With the aim to delimit the analysis time in which theseparation should be achieved, it was advisable to addtwo other variables to the previously defined responsevariables (corrected areas and resolution between thechromatographic peaks): minimum and maximum anal-ysis time. Thus, in order to get the equations for thesetwo new responses, the retention times from all the firstand last chromatographic peaks of the experiments runin the CCD were taken into account.
Upon the basis of the obtained responses, The Unscram-bler defined a multiple linear regression MLR model foreach response. The analysis of variance applied to theseMLR models showed lack of fit of experimental data, andtherefore a new model was built. Due to the complexityof the system (four variables and six responses), the mul-tivariate data analysis computer program defined a par-tial least squares regression model (PLS-2).
As a result, the fit to the regression (percentage of var-iance explained) improved with PLS-2, as shown in Table5.
In order to study the influence of the variables on theanswers in PLS-2, the regression coefficients were stud-ied. If a regression coefficient for a variable is larger than
0.2 in absolute value, the effect of the variable is mostprobably significant [38]. The regression coefficientswhich affected the two corrected areas were originatedby pH (B), ACN% (C), and stepness (D) as variables and CD,BB, CC, and DD as interactions.
Thus, taking these influences into account, the responsesurface of each corrected area was analyzed (Fig. 1).Different maxima values were obtained and although allof them could be considered valid, only those providingretention time maxima below 10 min were taken intoaccount.
In that way, satisfactory results were obtained for thechromatographic separation when the composition ofthe mobile phase was A:B (A: ACN + 0.025% TFA; B: 5 mMphosphate buffer pH = 2.5 + 0.025% TFA), and the gradi-ent elution mode started at an initial percentage of ACNof 32% and reached 50% in 4 min. Then, this mobilephase was kept constant for 5 min. The flow rate was1.30 mL/min during all the chromatographic runs. Inthese conditions (collected in Table 1), valeryl-4-hydroxy-valsartan, candesartan M1 and valsartan chromato-graphic peaks eluted in the isocratic elution zone, as itcan be seen in Fig. 2.
i 2006 WILEY-VCH Verlag GmbH & Co. KGaA, Weinheim www.jss-journal.com
Table 4. Variables (A, B, C, and D) and responses (corrected areas, resolutions, and retention times) obtained from the CCDused for optimization of the chromatographic system HPLC-UV-fluorescence to separate valsartan, valeryl-4-hydroxy-valsartan,and IS in standard solutions
Experiment Flow(mL/min)(A)
pH(B)
%ACN(C)
Stepness(during4 min) (D)
CorrectedareaVals-M1
CorrectedareaVals
Rs(IS-Vals.M1) Rs(Vals-IS) tr(MIN)
(min)tr(MAX)
(min)
1.*L:A-a 0.675 3.00 30.0 3.750 1.02 1.63 2.37 3.46 9.08 15.722.*H:A-a 1.425 3.00 30.0 3.750 1.05 1.68 2.74 3.20 4.80 8.863.*L:B-a 1.050 1.50 30.0 3.750 0.47 1.43 0.31 6.08 6.23 11.234.*H:B-a 1.050 4.50 30.0 3.750 0.86 1.64 3.44 3.67 5.01 10.795.*L:C-a 1.050 3.00 15.0 3.750 1.12 1.72 4.65 7.94 13.52 45.996.*H:C-a 1.050 3.00 45.0 3.750 0.97 1.62 1.48 2.54 2.14 5.267.*L:D-a 1.050 3.00 30.0 2.9802 N 10 – 7 L 0 1.14 1.79 4.24 7.62 6.93 39.238.*H:D-a 1.050 3.00 30.0 7.500 1.02 1.61 2.17 2.14 5.92 8.439. Cube001a 0.800 2.00 20.0 1.250 1.48 1.95 4.33 14.19 25.67 161.0010.Cube002a 1.300 2.00 20.0 1.250 1.44 1.88 4.01 14.07 16.61 97.2511.Cube003a 0.800 4.00 20.0 1.250 1.28 1.77 8.12 11.68 23.49 140.6512.Cube004a 1.300 4.00 20.0 1.250 1.25 1.67 7.28 11.67 14.94 86.9013.Cube005a 0.800 2.00 40.0 1.250 1.20 1.89 1.42 5.41 3.54 10.0614.Cube006a 1.300 2.00 40.0 1.250 1.16 1.86 1.30 4.82 2.24 6.5815.Cube007a 0.800 4.00 40.0 1.250 1.06 1.64 2.20 4.22 3.57 10.1516.Cube008a 1.300 4.00 40.0 1.250 1.04 1.65 2.05 3.98 2.24 6.5817.Cube009a 0.800 2.00 20.0 6.250 1.13 1.82 1.39 4.17 10.21 15.1018.Cube010a 1.300 2.00 20.0 6.250 1.15 1.84 1.35 3.65 7.21 10.3719.Cube011a 0.800 4.00 20.0 6.250 1.01 1.62 1.94 2.86 10.05 14.8920.Cube012a 1.300 4.00 20.0 6.250 1.04 1.67 2.09 2.88 7.17 10.3521.Cube013a 0.800 2.00 40.0 6.250 1.16 1.84 1.32 4.06 3.54 8.2822.Cube014a 1.300 2.00 40.0 6.250 1.17 1.89 1.41 4.29 2.28 5.6523.Cube015a 0.800 4.00 40.0 6.250 1.04 1.62 2.41 2.90 3.59 8.3624.Cube016a 1.300 4.00 40.0 6.250 1.06 1.69 2.77 3.95 2.23 5.6025.Cent-a 1.050 3.00 30.0 3.750 1.03 1.63 2.57 3.44 6.20 11.0526.Cent-b 1.050 3.00 30.0 3.750 1.03 1.64 2.56 3.34 6.29 11.1727.Cent-c 1.050 3.00 30.0 3.750 1.03 1.64 2.60 3.45 6.28 11.13

2272 G. Iriarte et al. J. Sep. Sci. 2006, 29, 2265 –2283
The developed method has proved to be rugged underlight variations in the composition of the mobile phasesuch as buffer concentration, pH, and percentage of TFA.Slight variations in the chromatographic conditionshave not shown significant variances in the chromato-grams obtained.
3.2 Extraction procedure: Experimental design
The most used extraction techniques for the determina-tion of ARA II compounds in biological samples areliquid –liquid extraction (LLE) [51, 52] and SPE [28, 37,52–55].
The optimization of the extraction procedure was car-ried out following the same experimental design metho-dology as the one used for the optimization of the chro-matographic separation.
The variables studied were as follows: pretreatment ofplasma samples, the extraction cartridge, the conveni-ence of using surfactant, the pH of sample application,the elution liquid composition, the washing liquid, andthe type of membrane used to filter the plasma extracts.
Taking into account that the SPE procedure is influencedby many parameters, but generally, the measuredresponse is always one (the corrected area or the recov-ery), the OVAT optimization methodology together withthe use of experimental design was decided. A four factorconsidering FFD enabled the selection of critical factorson response. Response surface modeling from the three-factor considering CCD design allowed the selection ofthe optimal analysis conditions for the clean-up proce-dure for valsartan and its metabolite in human plasmasamples.
Throughout the SPE optimization, before the extractionprocess, all plasma samples were spiked with 1.1 lg/mLof valsartan metabolite and 1.1 lg/mL of valsartan. Inorder to avoid variances coming from the chromato-
graphic method, once extracted all samples were spikedwith 1.2 lg/mL of IS, previous to the evaporation process.
3.2.1 OVAT methodology
In order to define the SPE procedure, different RP car-tridges (CH, C2, C8, C18, CN, and Ph) were tested. Thehighest recoveries were obtained by using CH, C18, andC8 cartridges. CH and C18 cartridges despite providingthe highest recoveries did not give extracts sufficientlyfree of endogenous compounds, therefore C8 cartridgeswere used.
The effect of sample pH was clearly stated with all the sol-vents and packings. Samples were applied at different pHvalues, ranging from 2 to 5. In all cases, stronger ioniza-tion of the analytes at pH A5 induced important losses(recovery a50%) due to their weak interactions with nopolar cartridges. In addition to this, these pH values weresimultaneously tested in the protein precipitation asshown in Table 6. The recoveries were higher when pro-teins were precipitated with 0.5 M phosphoric acid.
Despite the slightly higher recoveries obtained whensample application was made at pH 4, pH 2 was usedthroughout the extraction procedure since cleanerplasma extracts were obtained together with acceptablerecovery percentages (higher than 85%).
ACN provided the best recoveries of all the assayed elu-tion solvents: methanol, ACN, chloroform, 2-propanol,THF, ethyl acetate, dichloromethane, diethyl ether, andn-hexane. Nevertheless, selectivity was preferred toextraction efficiency and diethyl ether showed a higherselectivity giving cleaner extracts.
In order to improve the recoveries obtained with diethylether, addition of low methanol percentages on the elu-tion liquid was tested.
Different mixtures of methanol–phosphate buffer solu-tions (50 mM, pH 2) were tested as washing solutions
i 2006 WILEY-VCH Verlag GmbH & Co. KGaA, Weinheim www.jss-journal.com
Table 5. Treatment of the responses obtained from the CCD by two different multivariate calibration methods: MLR and PLS-2.Both models collect for each response the obtained regression coefficient and multiple correlation coefficients (MLR) as well asthe error of model (root mean square of calibration, RMSEC)
Response MLR PLS-2 Y-Explaineda):%71(1PC),%19 (2PC) (PC = 3)
Regressioncoefficient (R2)
Multiple correlationcoefficient
Regressioncoefficient (R2)
RMSEC
Corrected area Vals. –M1 0.707 0.841 0.952 0.041Corrected area Vals 0.635 0.797 0.950 0.033Rs(IS-Vals.M1) 0.955 0.977 0.962 0.466Rs(Vals-IS) 0.994 0.988 0.986 0.577tr(MIN) 0.950 0.975 0.971 1.486tr(MAX) 0.931 0.965 0.960 11.713
a) Results obtained after recalculation of the model. 9 and 11 experiments were not taken into account, since they were recog-nized as outliers.

J. Sep. Sci. 2006, 29, 2265 –2283 Optimization of valsartan and its metabolite in plasma 2273
i 2006 WILEY-VCH Verlag GmbH & Co. KGaA, Weinheim www.jss-journal.com
Figure 1. Response surfaces for the most important functions, obtained from CCD: (a) corrected area of valeryl-4-hydroxy-val-sartan and (b) corrected area of valsartan. These two response surfaces are defined by the pH (B) and the initial composition ofACN (C), while the flow (A) and the gradient stepness (D) are fixed at 1.3 and 4.5 mL/min, respectively.

2274 G. Iriarte et al. J. Sep. Sci. 2006, 29, 2265 –2283
i 2006 WILEY-VCH Verlag GmbH & Co. KGaA, Weinheim www.jss-journal.com
Figure 2. Chromatograms corresponding to a mixture of valeryl-4-hydroxy-valsartan (450 ng/mL), valsartan (1000 ng/mL), andcandesartan M1 (IS, 650 ng/mL) prepared in methanol. (a) Fluorescence and (b) UV. Chromatographic conditions as describedin Section 2.4.

J. Sep. Sci. 2006, 29, 2265 –2283 Optimization of valsartan and its metabolite in plasma 2275
(Fig. 3). The washing solution methanol–50 mM phos-phate buffer solution, pH 2, 40 :60 v/v, was chosen and itwas valid for both analytes, yielding a chromatogramfree of interferences.
The use of ethyleneglycol as surfactant to prevent adsorp-tion of ARA II compounds (mainly candesartan cilexetyl)on the tube walls has been reported by several authors[28, 48]. In this work, the convenience of using 0.2 mL of10% v/v ethyleneglycol in methanol as surfactant was
studied. This surfactant induced slightly higher recov-eries for the internal standard as well as for valsartan.
Filtering the sample constituted the last step in the sam-ple treatment. An exhaustive study for the evaluation ofthe filter type to be used previous to injection on thechromatographic system was carried out. Different typesof membranes (PVDF, hydrophobic and hydrophilicPTFE, nylon, hydrophilic cellulose, hydrophilic polypro-pylene, and glass fiber) with several diameters (u = 4 and13 mm) were assayed obtaining the recoveries shown inTable 7.
Filters of diameter 4 mm were discarded due to satura-tion problems and sample losses. Hydrophobic andhydrophilic PTFE, hydrophilic polypropylene and nylonmembranes provided acceptable recoveries. Universalhydrophilic polypropylene membrane was chosen basedon the most favorable recovery/price relation.
3.2.2 Screening phase: FFD
The experimental variables considered in the FFD for theextraction of valsartan, its metabolite and the internalstandard candesartan M1 from human plasma sampleswere as follows: buffer solution concentration (A), dryingtime (B), elution liquid volume, (C) and methanol percen-tage added to the diethyl ether elution solution (D). Inthis case, the main effect estimated for the D factor(methanol percentage added to the elution solution) wasconfused with the interaction effect for the other threevariables as shown in the following relation:
MeOH% added to the elution liquid (D) =CBuffer(A)6drying time (B)6volume of elution liquid (C)
Since it was predictable that the D factor would not sig-nificantly affect the other variables. A two level FFDinvolving eight runs and two replicates of the centralpoint was carried out. All experiments were performedin random order to avoid systematic errors. The pro-posed experiments for FFD are shown in Table 8.
In order to obtain an adequate extraction procedure, andconsidering that the chromatographic method had beenpreviously optimized, the response variables measuredwere the corrected areas for both analytes.
The buffer solution concentration ranged from 5 to50 mM according to the most commonly used values.The drying time was varied between 0 and 10 min, toavoid too long extraction times. The elution solventvolume varied between 0.5 and 2 mL. The methanol per-centage added to the elution solvent varied from 0 to40%.
As mentioned above, the analysis of the experimentalresults was accomplished by means of The Unscramblerprogram. Among other features, this program allows thelinear regression analysis of data, including two factor
i 2006 WILEY-VCH Verlag GmbH & Co. KGaA, Weinheim www.jss-journal.com
Table 6. Effect of sample pH and protein precipitant pH onthe recovery percentage of SPE
ProteinprecipitantpH
Cartridgecondition-ing pH
Recovery(%) Val-sartan-M1
% RSD Recovery(%) Val-sartan
% RSD
1.2 2 86.27 3.12 90.40 1.362 2 55.52 1.02 40.25 7.561.2 3 88.33 11.81 85.69 11.153 3 58.30 0.80 40.00 0.021.2 4 96.92 0.37 93.20 2.874 4 53.19 7.23 27.92 13.351.2 5 8.17 26.30 79.56 3.205 5 1.01 21.23 9.08 9.02
Figure 3. Elution profiles (methanol–phosphate buffer,50 mM pH 2) for human plasma samples spiked with bothanalytes: (a) valeryl-4-hydroxy-valsartan and (b) valsartan.

2276 G. Iriarte et al. J. Sep. Sci. 2006, 29, 2265 –2283
interactions, and gives the ANOVA of the regressionmodel and the response surface. The treatment of thesedata and the analysis of variance gaves rise to the resultscollected in Table 9. The significant variables and interac-tions are qualitatively given considering a significancelevel of 95% (if p value a0.05, the effect is regarded to besignificant).
These results allowed us to conclude that, apparently, novariable influenced the recovery of the extraction ofvaleryl-4-hydroxy-valsartan. Nevertheless, it was observedthat buffer concentration, drying time, as well as certaininteractions between variables affected the recovery ofvalsartan.
With the purpose of studying the influence of these fac-tors more exhaustively, it was decided to run a CCD. In
order to reduce the number of factors to consider in thisdesign, it was decided to add no methanol to the elutionsolution, since it was observed that even small percen-tages of methanol induced the coelution of several inter-ferent endogenous compounds.
3.2.3 Optimization phase: CCD
The information obtained from the FFD was used tobuild a CCD. The experimental variables considered inthe CCD were as follows: buffer solution concentration(A), drying time (B), and elution liquid volume (C).
This CCD involved 14 runs plus four replicates of the cen-tral point, all of them randomized and carried out on thesame day. The design matrix for the experiments is givenin Table 10. The response variables were measured by thecorrected areas for both analytes.
i 2006 WILEY-VCH Verlag GmbH & Co. KGaA, Weinheim www.jss-journal.com
Table 7. Mean recoveries obtained with different types of membrane syringe filters (u = 13 mm)
Filter Filtrationarea and
Hold-upvolume
Type ofmembrane
Recovery (%)
u = 13 mm pore size Vals-M1: %RSD Vals: %RSD
Millipore:Ref: SLHV 013 NL
0.65 cm2
0.45 lma25 lL PVDF 64.64 7.38 48.80 8.27
Millipore:Ref: SLCR 013 NL
0.65 cm2
0.45 lma25 lL Hydrophilic PTFE 91.50 4.95 79.02 8.32
Millipore:Ref: SLFH R04 NL
0.65 cm2
0.45lma25 lL Hydrophobic PTFE 82.82 1.46 66.90 1.22
PALL:Ref: S4553.
1.00 cm2
0.45 lma14 lL Hydrophobic PTFE 86.35 2.84 66.30 8.43
Millipore:Ref: SLHN 013 NL
0.65 cm2
0.45 lma25 lL Nylon 79.63 9.07 69.72 2.06
PALL:Ref: S4551.
1.00 cm2
0.45 lma14 lL Nylon 86.71 8.35 46.85 8.12
Schleicher&Schuell:Ref: 463030
cm2
0.45lma10 lL Glass fiber 78.10 6.70 62.30 15.26
PALL:Ref: S4556.
1.00 cm2
0.45 lma14 lL Hydrophilic
polypropylene85.60 1.87 72.02 4.27
Table 8. Variables (A, B, C, and D) and responses (cor-rected areas) from the 24 – 1 proposed FFD for the optimiza-tion of the SPE procedure of valsartan and valeryl-4-hydroxy-valsartan from human plasma
Exp Bufferconc.(mM)(A)
Dryingtime(min)(B)
Elutionsol.volume(mL) (C)
MeOH%added(D)
Correc-tedareaVals.M1
Correc-ted areaVals
1 5 0 0.5 0 0.80 0.632 50 0 0.5 40 0.85 0.663 5 10 0.5 40 0.92 0.764 50 10 0.5 0 0.84 0.735 5 0 2 40 0.82 0.626 50 0 2 0 0.88 0.707 5 10 2 0 0.90 0.748 50 10 2 40 0.90 0.749 27.5 5 1.25 20 0.89 0.75
10 27.5 5 1.25 20 0.91 0.74
Table 9. Significance of the variables over the definedresponses by using analysis of variance (considering a sig-nificance level of 95%) in the 24–2 proposed FFD for the opti-mization of the SPE procedure of valsartan, valeryl-4-hydroxy-valsartan from human plasma
Effects overview Significance testing method: centerVariable Corrected
area Vals-M1Correctedarea Valsartan
Buffer conc. (A) NS +Drying time (B) NS ++Elution sol. volume (C) NS NSMeOH% added (D) NS NSAB = CD NS –AC = BD NS +AD = BC NS NS
(NS): Nonsignificant; (+): positive influence; ( – ): negativeinfluence; (++/ – ): grade of influence.
J. Sep. Sci. 2006, 29, 2265 –2283 Optimization of valsartan and its metabolite in plasma 2277
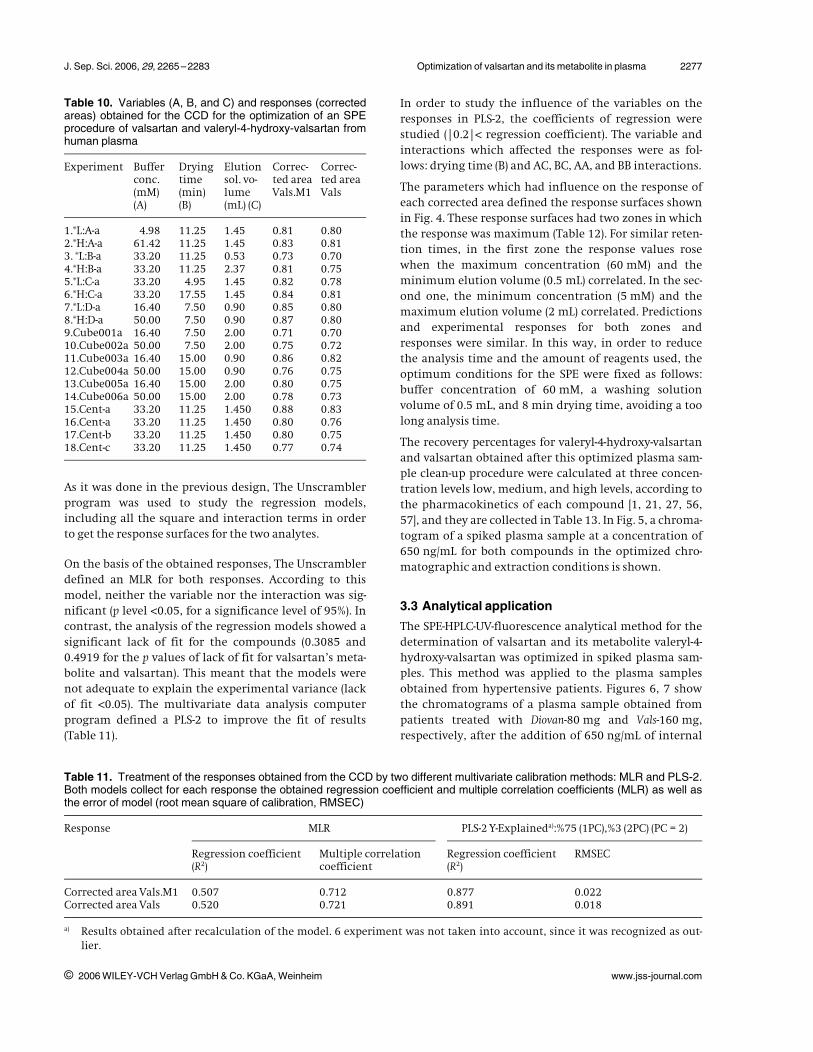
As it was done in the previous design, The Unscramblerprogram was used to study the regression models,including all the square and interaction terms in orderto get the response surfaces for the two analytes.
On the basis of the obtained responses, The Unscramblerdefined an MLR for both responses. According to thismodel, neither the variable nor the interaction was sig-nificant (p level a0.05, for a significance level of 95%). Incontrast, the analysis of the regression models showed asignificant lack of fit for the compounds (0.3085 and0.4919 for the p values of lack of fit for valsartan’s meta-bolite and valsartan). This meant that the models werenot adequate to explain the experimental variance (lackof fit a0.05). The multivariate data analysis computerprogram defined a PLS-2 to improve the fit of results(Table 11).
In order to study the influence of the variables on theresponses in PLS-2, the coefficients of regression werestudied (|0.2|a regression coefficient). The variable andinteractions which affected the responses were as fol-lows: drying time (B) and AC, BC, AA, and BB interactions.
The parameters which had influence on the response ofeach corrected area defined the response surfaces shownin Fig. 4. These response surfaces had two zones in whichthe response was maximum (Table 12). For similar reten-tion times, in the first zone the response values rosewhen the maximum concentration (60 mM) and theminimum elution volume (0.5 mL) correlated. In the sec-ond one, the minimum concentration (5 mM) and themaximum elution volume (2 mL) correlated. Predictionsand experimental responses for both zones andresponses were similar. In this way, in order to reducethe analysis time and the amount of reagents used, theoptimum conditions for the SPE were fixed as follows:buffer concentration of 60 mM, a washing solutionvolume of 0.5 mL, and 8 min drying time, avoiding a toolong analysis time.
The recovery percentages for valeryl-4-hydroxy-valsartanand valsartan obtained after this optimized plasma sam-ple clean-up procedure were calculated at three concen-tration levels low, medium, and high levels, according tothe pharmacokinetics of each compound [1, 21, 27, 56,57], and they are collected in Table 13. In Fig. 5, a chroma-togram of a spiked plasma sample at a concentration of650 ng/mL for both compounds in the optimized chro-matographic and extraction conditions is shown.
3.3 Analytical application
The SPE-HPLC-UV-fluorescence analytical method for thedetermination of valsartan and its metabolite valeryl-4-hydroxy-valsartan was optimized in spiked plasma sam-ples. This method was applied to the plasma samplesobtained from hypertensive patients. Figures 6, 7 showthe chromatograms of a plasma sample obtained frompatients treated with Diovan-80 mg and Vals-160 mg,respectively, after the addition of 650 ng/mL of internal
i 2006 WILEY-VCH Verlag GmbH & Co. KGaA, Weinheim www.jss-journal.com
Table 10. Variables (A, B, and C) and responses (correctedareas) obtained for the CCD for the optimization of an SPEprocedure of valsartan and valeryl-4-hydroxy-valsartan fromhuman plasma
Experiment Bufferconc.(mM)(A)
Dryingtime(min)(B)
Elutionsol. vo-lume(mL) (C)
Correc-ted areaVals.M1
Correc-ted areaVals
1.*L:A-a 4.98 11.25 1.45 0.81 0.802.*H:A-a 61.42 11.25 1.45 0.83 0.813. *L:B-a 33.20 11.25 0.53 0.73 0.704.*H:B-a 33.20 11.25 2.37 0.81 0.755.*L:C-a 33.20 4.95 1.45 0.82 0.786.*H:C-a 33.20 17.55 1.45 0.84 0.817.*L:D-a 16.40 7.50 0.90 0.85 0.808.*H:D-a 50.00 7.50 0.90 0.87 0.809.Cube001a 16.40 7.50 2.00 0.71 0.7010.Cube002a 50.00 7.50 2.00 0.75 0.7211.Cube003a 16.40 15.00 0.90 0.86 0.8212.Cube004a 50.00 15.00 0.90 0.76 0.7513.Cube005a 16.40 15.00 2.00 0.80 0.7514.Cube006a 50.00 15.00 2.00 0.78 0.7315.Cent-a 33.20 11.25 1.450 0.88 0.8316.Cent-a 33.20 11.25 1.450 0.80 0.7617.Cent-b 33.20 11.25 1.450 0.80 0.7518.Cent-c 33.20 11.25 1.450 0.77 0.74
Table 11. Treatment of the responses obtained from the CCD by two different multivariate calibration methods: MLR and PLS-2.Both models collect for each response the obtained regression coefficient and multiple correlation coefficients (MLR) as well asthe error of model (root mean square of calibration, RMSEC)
Response MLR PLS-2 Y-Explaineda):%75 (1PC),%3 (2PC) (PC = 2)
Regression coefficient(R2)
Multiple correlationcoefficient
Regression coefficient(R2)
RMSEC
Corrected area Vals.M1 0.507 0.712 0.877 0.022Corrected area Vals 0.520 0.721 0.891 0.018
a) Results obtained after recalculation of the model. 6 experiment was not taken into account, since it was recognized as out-lier.

2278 G. Iriarte et al. J. Sep. Sci. 2006, 29, 2265 –2283
i 2006 WILEY-VCH Verlag GmbH & Co. KGaA, Weinheim www.jss-journal.com
Figure 4. Response surfaces for the most important functions, obtained from CCD: (a) corrected area of valeryl-4-hydroxy-val-sartan and (b) corrected area of valsartan. These two response surfaces are defined by the drying time (B) and the elutionvolume (C), while the buffer concentration (A) is fixed at 60 mM.

J. Sep. Sci. 2006, 29, 2265 –2283 Optimization of valsartan and its metabolite in plasma 2279
standard. It can be observed that the extract of plasmasample was free of interferences from endogenous com-pounds.
4 Concluding remarksThe optimization using experimental design strategiesallowed an efficient development of the extraction
method and the chromatographic separation, showingthat a correct use of an appropriate experimental designis of considerable benefit in setting up the experimentalconditions. Furthermore, the chemometric approachallowed us to reduce the number of experiments needed
i 2006 WILEY-VCH Verlag GmbH & Co. KGaA, Weinheim www.jss-journal.com
Figure 5. Chromatograms obtained with fluorescence detection corresponding to a blank plasma extracted sample and a spikedplasma sample with valeryl-4-hydroxy-valsartan (450 ng/mL), valsartan (1000 ng/mL), and candesartan M1 (IS, 650 ng/mL) inthe optimized SPE and chromatographic conditions as described in Sections 2.4 and 2.6.
Table 12. Predictions and experimental responses for bothzones of maximum response proposed by PLS-2 multivari-ate regression model for the optimization of an SPE proce-dure of valsartan and valeryl-4-hydroxy-valsartan fromhuman plasma
Theoretical values (variables) Theoretical responses
Bufferconc.(mM) (A)
Dryingtime(min) (B)
Elution sol.volume(mL) (C)
Correctedareas(Vals-M1)
Correctedareas(Vals)
60 8.30 0.52 0.940 0.8644.97 9.97 2.37 0.942 0.896
Experimental values (variables) Experimental responses
60 8 0.5n
0.0160.010
1.7491.291
5 10 2n
0.0450.039
5.0534.819
Table 13. Recovery percentages obtained at three concen-tration levels for valeryl-4-hydroxy-valsartan and valsartanafter the optimized SPE procedure. The extracted plasmasamples were spiked with 650 ng/mL of IS after the SPE(n = 6 replicates)
Valsartana)
Concentration(lg/L)
Recovery(%)
Standarddeviation
%RSD
100 98.0 1.6 1.61000 109.1 0.7 0.63000 106.7 0.3 0.3
Valsartan-M1a)
Concentration(lg/L)
Recovery(%)
Standarddeviation
%RSD
100 94.6 2.9 3.1450 108.9 1.5 1.4
1000 108.8 1.3 1.2
a) IS concentration = 650 lg/L.

2280 G. Iriarte et al. J. Sep. Sci. 2006, 29, 2265 –2283
i 2006 WILEY-VCH Verlag GmbH & Co. KGaA, Weinheim www.jss-journal.com
Figure 6. Chromatograms of plasma sample extracts obtained from a hypertensive patient 2 h 30 min after the intake of Diovan-80 mg in the optimized SPE and chromatographic conditions as described in Sections 2.4 and 2.6. Internal standard: candesar-tan M1 650 ng/mL. (a) Fluorescence and (b) UV.

J. Sep. Sci. 2006, 29, 2265 –2283 Optimization of valsartan and its metabolite in plasma 2281
i 2006 WILEY-VCH Verlag GmbH & Co. KGaA, Weinheim www.jss-journal.com
Figure 7. Chromatograms of plasma sample extracts obtained from a hypertensive patient 2 h 30 min after the intake of Vals-160 mg in the optimized SPE and chromatographic conditions as described in Sections 2.4 and 2.6. Internal standard: candesar-tan M1 650 ng/mL. (a) Fluorescence and (b) UV.

2282 G. Iriarte et al. J. Sep. Sci. 2006, 29, 2265 –2283
to optimize this analytical method, saving time as well asreagents and solvents.
Due to an intense metabolic transformation of valsartanin the liver, plasma concentrations for valsartan andmainly for its metabolite become low (lg/L) once theinterval of maximum plasma concentration (tmax) wassurpassed and until the ingestion of the next dose. There-fore, in the development of bioanalytical methods fortheir determination not only a sensitive analyticalmethod has to be performed, but also an extraction pro-cedure which yields high recovery percentages isrequired.
The optimized SPE method provides good recoveries andlow values of RSD which makes it reliable for the quanti-fication of both compounds in plasma samples.
The proposed analytical method SPE-HPLC-UV-fluores-cence has been shown to be adequate for the separationand determination of valsartan and its metabolite inplasma samples obtained from patients under cardiovas-cular treatment.
The authors thank the University of Basque Country and the Min-istry of Science and Technology for financial support (UPV00171.310-E-14796/2002; UPV 01591.310-1539/2003; BQU 2002-03098) and the pharmaceutical companies for the kind supply ofARA II and Dr. N. Etxebarria (University of Basque Country) forhis help with experimental design. G. Iriarte Saenz de Ojer thanksthe University of Basque Country for his predoctoral grant, andN. Ferreir�s Bouzas of the Ministry of Education and Science forthe FPU grant. The authors also thank Mertxe Saenz de Ojer forher help in supplying blood samples from patients under cardio-vascular treatment.
5 References[1] Flesch, G., Muller, P. H., Lloyd, P., Eur. J. Clin. Pharmacol.
1997, 52, 115 –120.
[2] Criscione, L., Bradley, W., Buhlmayer, P., Whitebread,S., et al., Cardio vasc. Drug Rev. 1995, 13, 230 –250.
[3] Oparil, S., Dyke, S., Harris, F., Kief, J., et al., Clin. Ther.1996, 18, 797 –810.
[4] Markham, A., Goa, K. L., Drugs 1997, 54, 299 –311.
[5] Young, C. H., Zhang, K., Poret, A. W., Am. J. Health-Syst.Pharm. 2005, 62, 2381 –2385.
[6] Fuenfstueck, R., Hempel, R.-D., Ansari, A., Weidinger,G., Klebs, S., Adv. Ther. 2005, 22, 263 –277.
[7] Rossing, K., Jacobsen, P. K., Hansen, B. V., Carstensen, B.,Parving, H.-H., Diabetes Care 2003, 26, 150 –155.
[8] Nakao, N., Yoshimura, A., Morita, M., Kayano, T., Ideura,T., Lancet 2003, 361, 117 –124.
[9] McMurray, J. J. V., �stergren, J., Swedberg, K., Granger,C. B., et al., Lancet 2003, 362, 767 –771.
[10] Russo, D., Minutolo, R., Pisani, A., Esposito, R., et al., Am.J. Kidney Dis. 2001, 38, 18 –25.
[11] Struckman, D., Rivey, M., Michael, P., Ann. Pharmacother.2001, 35, 242 –248.
[12] Kuriyama, S., Tomonari, H., Abe, A., Imasawa, T., Hos-oya, T., Nephron 2000, 86, 529 –530.
[13] Campbell, R., Sangalli, F., Perticucci, E., Aros, C., et al.,Kidney Int. 2003, 63, 1094–1103.
[14] Hebert, L. A., Falkenhain, M., Nohman, N., Cosio, F. G.,O'Dorisio, T. M., Am. J. Nephrol. 1999, 19, 1–6.
[15] Latini, R., Masson, S., Staszewsky, L., Maggioni, A. P.,Expert Opin. Pharmacother. 2004, 5, 181 –193.
[16] Young, J. B., Dunlap, M. F., Pfeffer, M. A., Probstfield, J.L., et al., Circulation 2004, 110, 2618–2626.
[17] Alcocer, L., Fernandez-Bonetti, P., Campos, E., Ruiz, R.O., et al., Int. J. Clin. Pract. 2004, 145(Suppl.), 35 –39.
[18] Andreadis, E. A., Tsourous, G. I., Marakomichelakis, G.E., Katsanou, P. M., et al., J. Hum. Hypertens. 2005, 19, 491 –496.
[19] Okura, T., Higaki, J., Ketsuatsu 2005, 12, 1060 –1064.
[20] Vachiery, J. L., Rev. Med. Bruxelles 2003, 24, A249 –A252.
[21] Waldmeier, F., Flesch, G., M�ller, P., Winkler, T., et al.,Xenobiotica 1997, 27, 59–71.
[22] Eicher, T., Hauptmann, S., The Chemistry of Heterocycles:Structure, Reactions, Synthesis and Applications, GeorgThieme Verlag, Sttutgart 1995.
[23] Guibault, G. G., Practical Fluorescence, Marcel Dekker,New York 1990.
[24] Zhang, J., Chen, S., Gu, T., Lu, X., Hu, Y., Shanghai DierYike Daxue Xuebao 2004, 24, 133 –135, 142.
[25] Gonzalez, L., Alonso, R. M., Jimenez, R. M., Chromatogra-phia 2000, 52, 735 –740.
[26] Macek, J., Kl�ma, J., Pt�cek, P., J. Chromatogr. B 2006, 832,169 –172.
[27] Daneshtalab, N., Lewanczuk, R. Z., Jamali, F., J. Clin. Phar-macol. 2004, 44, 245 –252.
[28] Gonzalez, L., Lopez, J. A., Alonso, R. M., Jimenez, R. M., J.Chromatogr. A 2002, 949, 49 –60.
[29] Daneshtalab, N., Lewanczuk, R. Z., Jamali, F., J. Chroma-togr. B 2002, 766, 345 –349.
[30] S�chaud, R., Graf, P., Bigler, H., Gruendi, E., et al., Int. J.Clin. Pharmacol. Ther. 2002, 40, 35 –40.
[31] Xu, Y., Cao, W., Lin, X., Ling, S., Zhongguo Yaolixue Tongbao2002, 18, 586 –588.
[32] Li, Y., Zhao, Z., Chen, X., Wang, J., et al., Yaowu Fenxi Zazhi2000, 20, 404 –406.
[33] Schmidt, E. K., Antonin, K.-H., Flesch, G., Racine-Poon,A., Eur. J. Clin. Pharmacol. 1998, 53, 451 –458.
[34] Sioufi, A., Marfil, F., Godbillon, J., J. Liq. Chromatogr.1994, 17, 2179–2186.
[35] Brunner, L. A., Powell, M. L., Degen, P., Flesch, G., Lab.Robotics Automat. 1994, 6, 171 –179.
[36] Maurer, H. H., Kraemer, T., Arlt, J. W., Ther. Drug Monit.1998, 20, 706 –713.
[37] Cagigal, E., Gonzalez, L., Alonso, R. M., Jimenez, R. M.,Talanta 2001, 54, 1121 –1133.
[38] Esbensen, K. H., Multivariate Data in Analysis in Practice,Camo, Denmark 2001.
i 2006 WILEY-VCH Verlag GmbH & Co. KGaA, Weinheim www.jss-journal.com

J. Sep. Sci. 2006, 29, 2265 –2283 Optimization of valsartan and its metabolite in plasma 2283
[39] Bayne, C. K., Rubin, I. B., Practical Experimental Designs andOptimization Methods for Chemists, VCH, Wenheim 1986.
[40] Morgan, E., Chemometrics-Experimental Design, Wiley, Chi-chester 1991.
[41] Preu, M., Petz, M., J. Chromatogr. A 1999, 840, 81 –91.
[42] Box, G. E. P., Hunter, W. G., Hunter, J. S., Statistics forExperiments An Introduction to Design, Data Analysis andModel Building, John Wiley & Sons, New York 1978.
[43] Goupy, J., Methods for Experimental Design, Principles andApplications for Physicists and Chemists, Elsevier, Amster-dam 1992.
[44] Siouffi, A. M., Phan-Tan-Luu, R., J. Chromatogr. A 2000,892, 75–106.
[45] Shan, Y., Seidel-Morgenstern, A., J. Chromatogr. A 2005,1093, 47 –58.
[46] Cutroneo, P., Beljean, M., Phan-Tan-Luu, R., Siouffi, A.M., J. Pharm. Biomed. 2006, 41, 333 –340.
[47] Gonzalez, L., Akesolo, U., Jimenez, R. M., Alonso, R. M.,Electrophoresis 2002, 23, 223 –229.
[48] Miyabayashi, T., Okuda, T., Motohashi, M., Izawa, K.,Yashiki, T., J. Chromatogr. B 1996, 677, 123 –132.
[49] Cagigal, E., Gonzalez, L., Alonso, R. M., Jimenez, R. M., J.Pharm. Biomed. 2001, 26, 477 –486.
[50] Snyder, L. R., Glajch, J., Kirkland, J. J., Practical HPLCMethod Development, John Wiley & Sons, New York 1989.
[51] Dos Ramos, F. G., J. Chromatogr. A 2000, 888, 69 –83.
[52] Stenhoff, H., Lagerstr�m, P. O., Andersen, C., J. Chroma-togr. B 1999, 731, 411 –417.
[53] Lundberg, D. E., Jr., Person, R. C., Knox, S., Cyronak, M.J., J. Chromatogr. B 1998, 707, 328 –333.
[54] Yeung, P. K. F., Jamieson, A., Smith, G. J., Fice, D., Pollak,P. T., Int. J. Pharm. 2000, 204, 17 –22.
[55] Torrealday, N., Gonzalez, L., Alonso, R. M., Jimenez, R.M., Ortiz Lastra, E., J. Pharm. Biomed. 2003, 32, 847 –857.
[56] Muller, P., Flesch, G., de Gasparo, M., Gasparini, M.,Howald, H., Eur. J. Clin. Pharmacol. 1997, 52, 441 –449.
[57] Sioufi, A., Marfil, F., Jaouen, A., Cardot, J. M. et al., Bio-pharm. Drug Dispos. 1998, 19, 237 –244.
i 2006 WILEY-VCH Verlag GmbH & Co. KGaA, Weinheim www.jss-journal.com
Related Documents