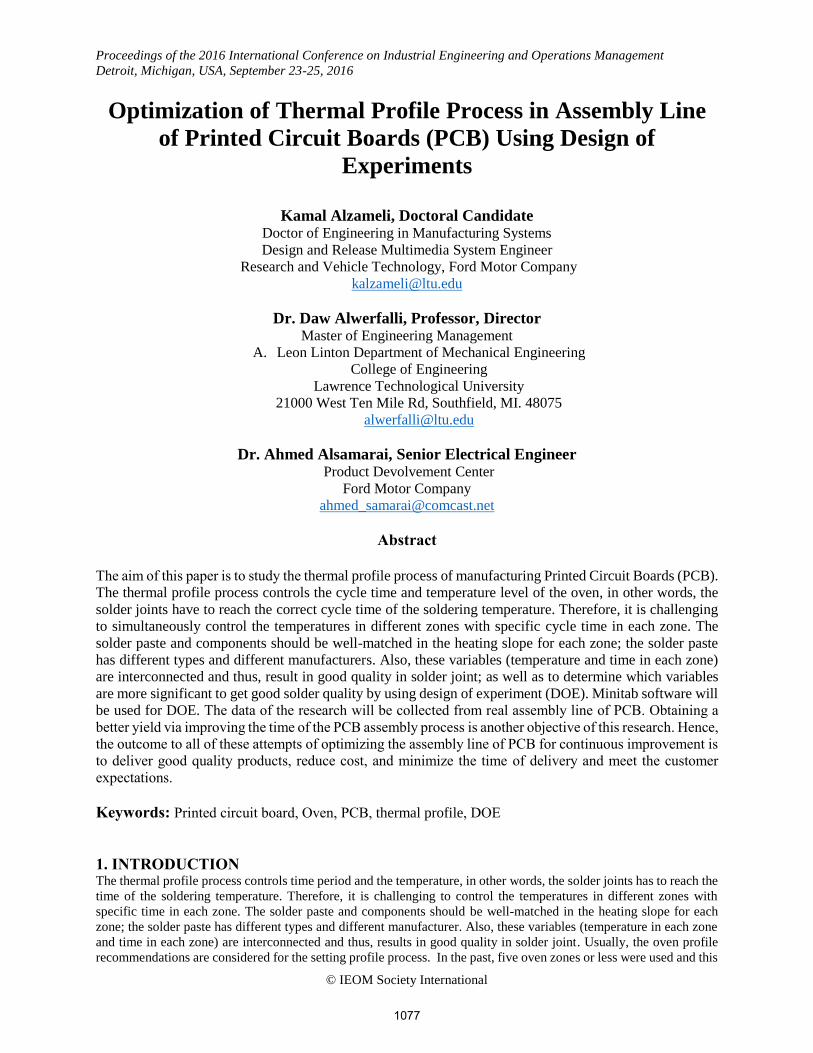
Proceedings of the 2016 International Conference on Industrial Engineering and Operations Management Detroit, Michigan, USA, September 23-25, 2016 © IEOM Society International Optimization of Thermal Profile Process in Assembly Line of Printed Circuit Boards (PCB) Using Design of Experiments Kamal Alzameli, Doctoral Candidate Doctor of Engineering in Manufacturing Systems Design and Release Multimedia System Engineer Research and Vehicle Technology, Ford Motor Company [email protected] Dr. Daw Alwerfalli, Professor, Director Master of Engineering Management A. Leon Linton Department of Mechanical Engineering College of Engineering Lawrence Technological University 21000 West Ten Mile Rd, Southfield, MI. 48075 [email protected] Dr. Ahmed Alsamarai, Senior Electrical Engineer Product Devolvement Center Ford Motor Company [email protected] LE OPEN ACCESS Abstract The aim of this paper is to study the thermal profile process of manufacturing Printed Circuit Boards (PCB). The thermal profile process controls the cycle time and temperature level of the oven, in other words, the solder joints have to reach the correct cycle time of the soldering temperature. Therefore, it is challenging to simultaneously control the temperatures in different zones with specific cycle time in each zone. The solder paste and components should be well-matched in the heating slope for each zone; the solder paste has different types and different manufacturers. Also, these variables (temperature and time in each zone) are interconnected and thus, result in good quality in solder joint; as well as to determine which variables are more significant to get good solder quality by using design of experiment (DOE). Minitab software will be used for DOE. The data of the research will be collected from real assembly line of PCB. Obtaining a better yield via improving the time of the PCB assembly process is another objective of this research. Hence, the outcome to all of these attempts of optimizing the assembly line of PCB for continuous improvement is to deliver good quality products, reduce cost, and minimize the time of delivery and meet the customer expectations. Keywords: Printed circuit board, Oven, PCB, thermal profile, DOE 1. INTRODUCTION The thermal profile process controls time period and the temperature, in other words, the solder joints has to reach the time of the soldering temperature. Therefore, it is challenging to control the temperatures in different zones with specific time in each zone. The solder paste and components should be well-matched in the heating slope for each zone; the solder paste has different types and different manufacturer. Also, these variables (temperature in each zone and time in each zone) are interconnected and thus, results in good quality in solder joint. Usually, the oven profile recommendations are considered for the setting profile process. In the past, five oven zones or less were used and this 1077

Welcome message from author
This document is posted to help you gain knowledge. Please leave a comment to let me know what you think about it! Share it to your friends and learn new things together.
Transcript
Proceedings of the 2016 International Conference on Industrial Engineering and Operations Management
Detroit, Michigan, USA, September 23-25, 2016
© IEOM Society International
Optimization of Thermal Profile Process in Assembly Line
of Printed Circuit Boards (PCB) Using Design of
Experiments
Kamal Alzameli, Doctoral Candidate
Doctor of Engineering in Manufacturing Systems
Design and Release Multimedia System Engineer
Research and Vehicle Technology, Ford Motor Company
Dr. Daw Alwerfalli, Professor, Director Master of Engineering Management
A. Leon Linton Department of Mechanical Engineering
College of Engineering
Lawrence Technological University
21000 West Ten Mile Rd, Southfield, MI. 48075
Dr. Ahmed Alsamarai, Senior Electrical Engineer Product Devolvement Center
Ford Motor Company
LE OPEN ACCESS
Abstract
The aim of this paper is to study the thermal profile process of manufacturing Printed Circuit Boards (PCB).
The thermal profile process controls the cycle time and temperature level of the oven, in other words, the
solder joints have to reach the correct cycle time of the soldering temperature. Therefore, it is challenging
to simultaneously control the temperatures in different zones with specific cycle time in each zone. The
solder paste and components should be well-matched in the heating slope for each zone; the solder paste
has different types and different manufacturers. Also, these variables (temperature and time in each zone)
are interconnected and thus, result in good quality in solder joint; as well as to determine which variables
are more significant to get good solder quality by using design of experiment (DOE). Minitab software will
be used for DOE. The data of the research will be collected from real assembly line of PCB. Obtaining a
better yield via improving the time of the PCB assembly process is another objective of this research. Hence,
the outcome to all of these attempts of optimizing the assembly line of PCB for continuous improvement is
to deliver good quality products, reduce cost, and minimize the time of delivery and meet the customer
expectations.
Keywords: Printed circuit board, Oven, PCB, thermal profile, DOE
1. INTRODUCTION The thermal profile process controls time period and the temperature, in other words, the solder joints has to reach the
time of the soldering temperature. Therefore, it is challenging to control the temperatures in different zones with
specific time in each zone. The solder paste and components should be well-matched in the heating slope for each
zone; the solder paste has different types and different manufacturer. Also, these variables (temperature in each zone
and time in each zone) are interconnected and thus, results in good quality in solder joint. Usually, the oven profile
recommendations are considered for the setting profile process. In the past, five oven zones or less were used and this
1077

Proceedings of the 2016 International Conference on Industrial Engineering and Operations Management
Detroit, Michigan, USA, September 23-25, 2016
© IEOM Society International
is hard to control the temperature, the more zones in the oven the better control of the temperature. The sizes of the
oven zones (length) studied will be performed on 13 zones. Typical zones of the oven temperatures are preheat, pre-
flow (or soak/ dry out), reflow, and cooling zone as shown in the figure below. So, thermal profile is a significant
element of the oven process in order to continue improvement to the PCB assembly line. Figure 1 shows the typical
oven temperature zones (profile):
Figure 1. Typical Oven temperature zones
2. PURPOSE OF THE STUDY The purpose of the profile study and the optimization are to avoid presumptions or the engineering estimate on the
initial temperature zone set, time and speed setting, reduce changeover times, reduce production downtime energy
saved for the oven. As a result, obtaining high quality with low defect of the solder joint. Verdi [6] indicated some
problems that occur because of the profile setting, figure 2 describes them.
Figure 2. Thermal profile issues [6]
The purpose of the design of experiment is to minimize the iterations of the experiments, and then define the significant
factors that affect the outcome and quality of the circuit board. After significant factors are defined, analysis for
variables is performed to come up with good optimization for these variables. Three level designs have been selected
to have a more occurred curvature temperature response. The three level designs are usually used if the variables are
quantitative (nonlinear) while the two levels are used when there is a linear relationship. Figure 3 describes the actual
profile that runs for the oven on local PCB local company, which is not very close to the recommendation profile
setting.
0
50
100
150
200
250
300
Preheat Soak Reflow CoolingTime
T (C°)
1078

Proceedings of the 2016 International Conference on Industrial Engineering and Operations Management
Detroit, Michigan, USA, September 23-25, 2016
© IEOM Society International
Figure 3. Oven temperature zones
3. THERMAL PROFILE OPTIMIZATION LITERATURE SURVEY Tsai, Mapa and Vancha [1, 2] approached similar methods using Design of Experiment (DOE) to solve for reflow
soldering problems. Tsai studied the optimization of the thermal parameters of reflow soldering process using various
three alternative approaches (traditional response surface methodology (RS), nonlinear programming (NLP), and a
hybrid AI technique). The three alternative methods were used to model and solve the thermal parameters optimization
problems for the reflow soldering process in PCB. The reflow soldering process is usually nonlinear and includes
various performance characteristics. Thus, the thermal reflow profile was the method used to regulate the process
parameters and control the effects of heating on the board assembly. Tsai used an experimental design using eight
factor levels (input) for the reflow thermal profiling and is presented by eleven responses (output). As a result, all
three methods provided a decent soldering performance. However, among the three alternative methods used, the
hybrid AI technique was better at formulating nonlinear mapping and solving optimization problems, and also
provided better optimization performance.
Similarly, Mapa and Vancha created a Design of Experiment (DOE) model to examine the factors that affect heat
losses at high and low levels. Their goal is to expose the factors that have a major role in heat loss while making design
developments to increase the productivity of the ovens. While Tsai used eight factors for his experiment, Mapa and
Vancha used four process variables that contribute to heat losses which are flap design, speed of the conveyor belt,
blower speed and insulation. The DOE methodology helped designers find major factors and connections between
the factors at the levels tested in the experiment. Using the Statistical Analysis software (SAS) statistical software, the
flap design and the blower speed were the most important factors contributing to heat loss in ovens. While Tsai, Mapa
and Vancha focused on the thermal profile, Flaig [3] introduced a new classification of variables in design of
experiments. Controllable or uncontrollable are the two classification of factors used in experiment design, but these
classification of input variables may not always be successful in displaying the “observed structure” of some
experiments. Since some factors that are classified as controllable are really semi-controllable, Flaig adds semi-
controllable input variables into the overall process model structure. He used the three process input variables to model
for the production environment. The semi-controllable input variable helps with better process performance and also
helps a practitioner to make an adequate model for estimating the mean response and response variance through
designed experiments.
Despite that fact Tsai, Mapa, and Flaig [1, 2, 3] used Design of Experiment in their study, Gong [4] used a different
method. He used the FEM simulation model to optimize reflow soldering temperature profile. Decreasing the
maximum thermal stress shows an important development on the reliability of solder joints; therefore, the temperature
distribution along with stress distribution of a particular BGA contained electronic assembly during reflow was
simulated. In order to decrease the maximum thermal stress in the whole assembly, Gong studied some basic reflow
parameters including the highest reflow temperature, dwell time above liquids, soak times, ramp rate, and conveyor
speed. As a result of the simulation model used, the maximum thermal stress can be reduced via the optimization of
the above mentioned reflow profile parameters.
020406080100120140160180200220240260280
Tem
p (
C°)
Oven temperature (profile)
Time
1079

Proceedings of the 2016 International Conference on Industrial Engineering and Operations Management
Detroit, Michigan, USA, September 23-25, 2016
© IEOM Society International
Similar to Tsai, Mapa, and Flaig, Ming-Hung [5] studied optimization temperature profile of reflow oven to obtain
robust soldering quality. He used 4 factors for this purpose (peak temperature, reflow time, cooling slope and soak
time). All factors included three levels. Ming used Tahuch’s 𝐿9(34) orthogonal array.
Jin, and Hong Wan [7, 8] performed a study for optimization of reflow soldering process and determine heat factors.
They determined the significant problem of how to adjust the heating zone in the profile to ensure reflow for all solder
joints. The main purpose of their research is to achieve high quality and reliability of solder joints. They determined
the following variables that effect the process and product quality of the solder joints and described on Figure 4.
1- PCB
A- PCP thickness
B- PCB number
C- PCB type
D- PCB size
E- PCB Materials and structure
2- Oven
A- Cooling capacity
B- Heat transfer capacity
C- Total heating length
D- Total heating zone number
3- Target profile
A- Upper limit of heating rate
B- Upper limit of cooling rate
C- Upper heat factor
D- Lower heat factor
E- Conveyor speed
Jin define the heating factor as:
𝑄ŋ = ∫ (𝑇(𝑡) − 𝑇𝑚)𝑑𝑡𝑡2
𝑡1 (1)
Where:
𝑇𝑚 = melting point of solder alloy
𝑡1, 𝑡2 = Time of reaching𝑇𝑚, and of falling back below 𝑇𝑚 respectively,
Figure 4: heating factor on reflow profile [7]
4. METHODOLOGY Figure 5 shows the overall methodology steps for optimization of assembly line of printed circuit board process for
design of experiment using Minitab software. Box-Behnken designs will be used with 3 levels per factor, which also
let the model curvature in the response. It is useful for understanding the region of the response surface and how
changes in the variables will affect the response. Also, it will help to fine the variables that need for optimize response.
Box-Behnken is useful if the operating zone of the process is known (specification). Therefore, the design will be in
safe operating zone and also the Box-Behnken ensures that not all the factors will be set to the high level at the same
time. With seven factors, Box-Behnken could run in one or two blocks. This method used is due to the limit access to
the oven at the company to verify the result that come from DOE and confirm that the selections of the most significate
variables are correct.
1080

Proceedings of the 2016 International Conference on Industrial Engineering and Operations Management
Detroit, Michigan, USA, September 23-25, 2016
© IEOM Society International
Figure 5. Overall methodology steps for optimization
4.1 VARIABLE OF THERMAL PROFILE Variables selected for this study are based on the literature review and discussion with technical matter expert in the
PCB companies. Conveyor speed and time are related to each other and that’s why one of them has been selected, if
the speed increases then the time should be shorter and contrariwise; the slope of each zone should be considered as
well. Length conveyor 20ft- in cm (609.6). Time = length/speed of conveyor, 609.6cm/104.5 cm/min= 5.83min (0.448
Sec in each zone of the 13 zones). 13 zones on the oven (length) divided into zones of oven temperature, for example
the first 3 zones could be considered one zone of the oven temperatures (preheat zone) and same thing for the
remaining zones will be part of the (pre-flow, reflow, and cooling zones). Four temperature zones will be set
individually, so consider these four different variables. Also, Copper Thickness is considered as one of the other
independent variable. Last, PCB mass differential is one of the variables (itself) that depend on many factors. Mass
differential calculation could be used CAD Gerber file and the BOM as Tsung [1] used in his research, or different
method could be used and that will be determined during collecting the info for this variable. Mass differential and
heat transfer into the PCB depend on several variables as Baehr [9] explain it in this book.
Optimization of assembly
line of printed circuit board
process
Overall performance
Evaluation (end) System
Determine the variables for
design of experiments
Initial analysis of most
thermal profile variables
Select the variables that
will be run on the DOE
Determine the DOE method that will
be used
Evaluate the regression model
Perform the test for each experiment on the actual thermal
profile on assembly line
1081

Proceedings of the 2016 International Conference on Industrial Engineering and Operations Management
Detroit, Michigan, USA, September 23-25, 2016
© IEOM Society International
Where:
𝑄 = 𝑚𝐶𝑝∆𝑇 (2)
Where Q = heat transfer
m = Mass
𝐶𝑝 = Specific heat
∆𝑇 = Time interval
𝑚 ∗ 𝐶𝑝 = Thermal mass
The PCB’s manufacturing company use serval types of printed circuit board size obtained by taking the average of
each of the three types of component density per panel where 332.5, 457 and 890 representative by 1, 2 and 3
accordingly as shown on table 1 on the comp size. The copper thickness of the three types used as well as ½ oz, 1 oz
and 2 oz; representative by three different levels consequently as shown on table 2. Also, the remaining heat zone
temperatures and speed of conveyor described in Table 2.
Table 1. Factors level
Variable
level
Comp
size
Conveyor
speed
cm/min
Preheat
Temp
C°
Soak
Temp
C°
Reflow
Temp
C°
Cooling
Temp
C°
Copper
Thickness
mm
X1 X2 X3 X4 X5 X6 X7
1 1 80 155 145 215 70 0.018
2 2 85 165 215 245 75 0.036
3 3 90 175 180 275 80 0.071
List of the variables
1- PCB Size - (PCBS)
2- Conveyor Speed (cm/min)- CS
3- Preheat Zone Temp C° (PZT)
4- Soak Zone Temp C° (SZT)
5- Reflow Zone Temp C° (RZT)
6- Cooling Zone Temp C° (CZT)
7- PCB Copper Thickness mm (PCBCT)
Table 2 is the matrix possible combination of the seven variables that will be verified.
Table 2. DOE variables combination PCBS CS PZT SZT RZT CZT PCBCT
0 0 0 -1 -1 -1 0
0 0 0 1 -1 -1 0
0 0 0 -1 1 -1 0
0 0 0 1 1 -1 0
0 0 0 -1 -1 1 0
0 0 0 1 -1 1 0
0 0 0 -1 1 1 0
0 0 0 1 1 1 0
-1 0 0 0 0 -1 -1
1 0 0 0 0 -1 -1
-1 0 0 0 0 1 -1
1 0 0 0 0 1 -1
-1 0 0 0 0 -1 1
1082

Proceedings of the 2016 International Conference on Industrial Engineering and Operations Management
Detroit, Michigan, USA, September 23-25, 2016
© IEOM Society International
1 0 0 0 0 -1 1
-1 0 0 0 0 1 1
1 0 0 0 0 1 1
0 -1 0 0 -1 0 -1
0 1 0 0 -1 0 -1
0 -1 0 0 1 0 -1
0 1 0 0 1 0 -1
0 -1 0 0 -1 0 1
0 1 0 0 -1 0 1
0 -1 0 0 1 0 1
0 1 0 0 1 0 1
-1 -1 0 -1 0 0 0
1 -1 0 -1 0 0 0
-1 1 0 -1 0 0 0
1 1 0 -1 0 0 0
-1 -1 0 1 0 0 0
1 -1 0 1 0 0 0
-1 1 0 1 0 0 0
PCBS CS PZT SZT RZT CZT PCBCT
1 1 0 1 0 0 0
0 0 -1 -1 0 0 -1
0 0 1 -1 0 0 -1
0 0 -1 1 0 0 -1
0 0 1 1 0 0 -1
0 0 -1 -1 0 0 1
0 0 1 -1 0 0 1
0 0 -1 1 0 0 1
0 0 1 1 0 0 1
-1 0 -1 0 -1 0 0
1 0 -1 0 -1 0 0
-1 0 1 0 -1 0 0
1 0 1 0 -1 0 0
-1 0 -1 0 1 0 0
1 0 -1 0 1 0 0
-1 0 1 0 1 0 0
1 0 1 0 1 0 0
0 -1 -1 0 0 -1 0
0 1 -1 0 0 -1 0
0 -1 1 0 0 -1 0
0 1 1 0 0 -1 0
0 -1 -1 0 0 1 0
1083

Proceedings of the 2016 International Conference on Industrial Engineering and Operations Management
Detroit, Michigan, USA, September 23-25, 2016
© IEOM Society International
0 1 -1 0 0 1 0
0 -1 1 0 0 1 0
0 1 1 0 0 1 0
0 0 0 0 0 0 0
0 0 0 0 0 0 0
0 0 0 0 0 0 0
0 0 0 0 0 0 0
0 0 0 0 0 0 0
0 0 0 0 0 0 0
4.2 RESULT AND ANALYSIS DOE results of the thermocouple compared to the recommended profile and Regression model are used to understand
the behavior of the variables and the relationship among the variables. Table 3 shows the average test results of the
all combination that gets run for thermocouple, and comparing it to the recommended specifications. Based on that
test temperature of the oven zone, it can be adjusted considering the quality of the solder joint.
Table 3. Profile test result
Response
Preheat slope
(C/min)
Soak slope
(C/min)
Ramp-up slope
(C/min)
Cooling slope (-C /
min)
Result of the thermocouple Ave 0.60 1.58 0.59 -1.66
Specifications 0.72 1.44 0.67 -2.82
In addition, table 4 shows current temperature values based on the copper thickness and board size (density of the
components) and recommended adjusted values based on recommended specification and technical specialist. Figure
6 shows the current run compared to the recommended values; where series 1is the recommended graph and series 2-
4 are three experiments. From the graph, there is obvious observation on the soak zone area where the temperature
slightly goes down before it rises to the next temperature zone (reflow zone). Figure 7 shows the graph after the
adjustment and how close to the suggested specifications.
Table 4. Recommended adjusted temperature
Copper thickness 0.071
Board size
3 1 2 Time (s) Temp ( C )
0 28 25 25 25
100 110 85 85 80
180 225 155 175 155
225 255 180 180 180
280 100 275 275 245
360 50 75 75 70
Recommended Adjusted Temperature
0 28 25 25 25
100 110 90 95 100
180 225 200 205 210
225 255 250 250 250
280 100 100 95 95
360 50 60 65 60
1084

Proceedings of the 2016 International Conference on Industrial Engineering and Operations Management
Detroit, Michigan, USA, September 23-25, 2016
© IEOM Society International
Figure 6. Temperature values before adjustment
Figure 7. Temperature values after adjustment
4.2.1 REGRESSION MODEL Due to the complexity of models, only two models were selected based on the most effected variables which are
response soak slope and response reflow slope as shown in the below two equations where variables ( 𝑥1 … 𝑥7 )
defined on table 1 respectively.
Response Soak Slope = 127.022+ 0.43 𝑥1 -0.82 𝑥2 +0.003𝑥3 + 0.003𝑥4 -2.45(E-04)𝑥5 +0.013 𝑥6 -11 𝑥7 - 0.0001 𝑥1 𝑥2 +2.5 (E-05) 𝑥1 𝑥3 + 4.05 (E-05) 𝑥1 𝑥4 + 2.8 (E-06) 𝑥1 𝑥5 + 5.0 (E-05) 𝑥1 𝑥6 – 18.5 𝑥1 𝑥7 - 4.0(E-
06) 𝑥2 𝑥3 + 1.53 (E-06) 𝑥2 𝑥4 + 3.33 (E-07) 𝑥2 𝑥5 + 1.6 (E-04) 𝑥2 𝑥6 -0.11 𝑥2 𝑥7 -6.12 (E-08) 𝑥3 𝑥4 - 2.78 (E-
08) 𝑥3 𝑥5 – 4.0 (E-06) 𝑥3 𝑥6 -1.43957 (E-15) 𝑥3 𝑥7 -1.003 (E-08) 𝑥4 𝑥5 - 0.083 𝑥4 𝑥7 + 0.001 𝑥5 𝑥7 -0.008 𝑥6 𝑥7 -
0.002 𝑥12+ 7.6(E-05) 𝑥2
2+ 4.4 (E-07) 𝑥32 + 6.14 (E-09) 𝑥5
2+ 1.3 (E-05) 𝑥62 + 55761.4 𝑥7
2
Response Reflow slope = 183 + 1.09 𝑥1 -0.064 𝑥2 +0.003𝑥3 + 0.001𝑥4 +0.0003 𝑥5 +0.035 𝑥6- 2159.8 𝑥7 - 0.0001 𝑥1 𝑥2 -1.25 (E-05) 𝑥1 𝑥3 -7.33270(E-06) 𝑥1 𝑥4 + 2.8 (E-06) 𝑥1 𝑥5 + 5.0 (E-05) 𝑥1 𝑥6 – 28.78 𝑥1 𝑥7 – 1.0(E-
06) 𝑥2 𝑥3 + 1.43 (E-06) 𝑥2 𝑥4 – 5.56 (E-07) 𝑥2 𝑥5 + 4.0 (E-04) 𝑥2 𝑥6 -0.21 𝑥2 𝑥7 +1.02 (E-08) 𝑥3 𝑥4 +1.39 (E-
08) 𝑥3 𝑥5 – 1.0 (E-06) 𝑥3 𝑥6 – 9.3 (E-16) 𝑥3 𝑥7 -3.37 (E-08) 𝑥4 𝑥5 - 0.036 𝑥4 𝑥7 -9.05013(E-04) 𝑥5 𝑥7 -0.1 𝑥6 𝑥7 -
0.0013 𝑥12 – 5.5(E-05) 𝑥2
2- 6.5 (E-07) 𝑥32 + 1.3 (E-09) 𝑥5
2- 3.43 (E-05) 𝑥62 + 27711.9 𝑥7
2
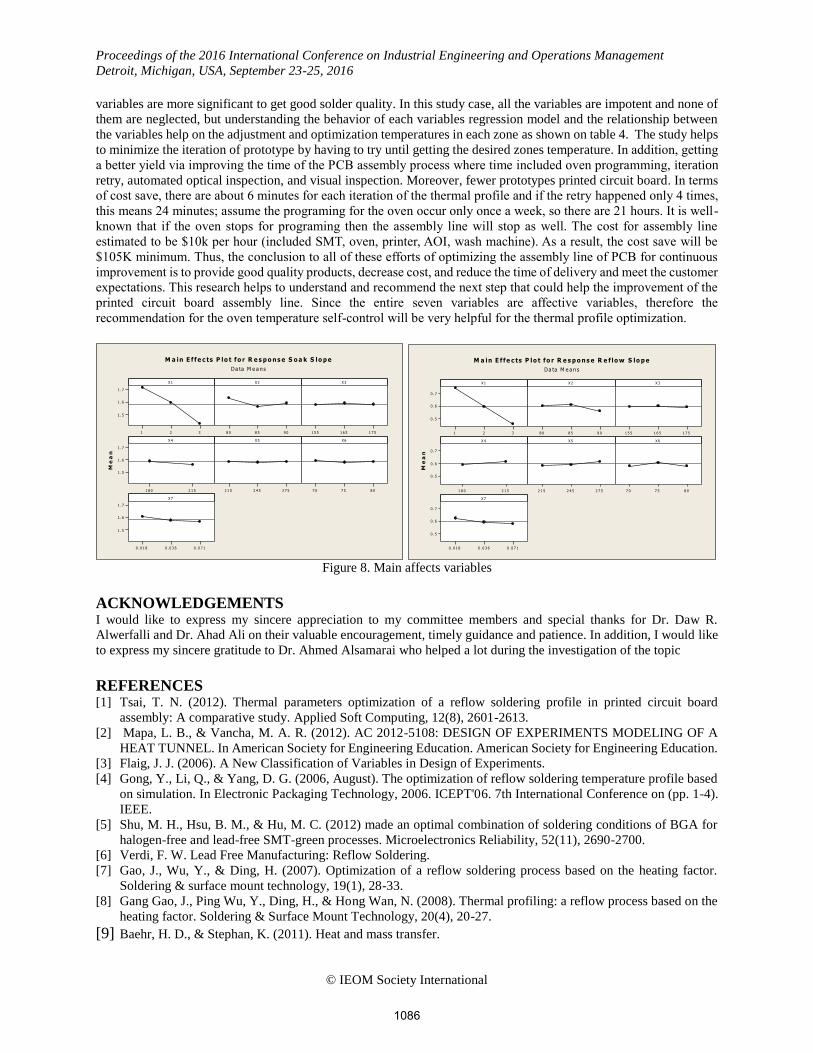
4.2.2 MAIN EFFECTS VARIABLES The main effect variables for each response will be independent for each output and as shown on figure 8, the most
effective variables on the soak zone temperatures are the component size, conveyor of speed as well as the copper
thickness, noted that other variables are not neglected. Similarly, with reflow zone temperatures, none of the seven
variables can be neglected but there are some variables that have the most effect on the reflow temperature response.
These variables are the component size (or density components) where more density of components require more
period of time into the reflow zone, likewise soak and reflow zone are also effective variables as shown on figure 8:
5. CONCLUSION Studying the thermal profile process of manufacturing Printed Circuit Boards (PCB) is to control the cycle time and
temperature level of the oven using Box-Behnken designs. The quality of the solder joints is very critical to the lifetime
of the PCB and the performance of the PCB. In this study of the local company of assembly line determined which
0
50
100
150
200
250
300
0 100 200 300 400
Tem
per
atu
re i
n C
°
Time in Sec
Series1
Series2
Series3
Series4
0
50
100
150
200
250
300
0 100 200 300 400
Tem
per
atu
re i
n C
°
Time in Sec
Series1
Series2
Series3
Series4
1085
Proceedings of the 2016 International Conference on Industrial Engineering and Operations Management
Detroit, Michigan, USA, September 23-25, 2016
© IEOM Society International
variables are more significant to get good solder quality. In this study case, all the variables are impotent and none of
them are neglected, but understanding the behavior of each variables regression model and the relationship between
the variables help on the adjustment and optimization temperatures in each zone as shown on table 4. The study helps
to minimize the iteration of prototype by having to try until getting the desired zones temperature. In addition, getting
a better yield via improving the time of the PCB assembly process where time included oven programming, iteration
retry, automated optical inspection, and visual inspection. Moreover, fewer prototypes printed circuit board. In terms
of cost save, there are about 6 minutes for each iteration of the thermal profile and if the retry happened only 4 times,
this means 24 minutes; assume the programing for the oven occur only once a week, so there are 21 hours. It is well-
known that if the oven stops for programing then the assembly line will stop as well. The cost for assembly line
estimated to be $10k per hour (included SMT, oven, printer, AOI, wash machine). As a result, the cost save will be
$105K minimum. Thus, the conclusion to all of these efforts of optimizing the assembly line of PCB for continuous
improvement is to provide good quality products, decrease cost, and reduce the time of delivery and meet the customer
expectations. This research helps to understand and recommend the next step that could help the improvement of the
printed circuit board assembly line. Since the entire seven variables are affective variables, therefore the
recommendation for the oven temperature self-control will be very helpful for the thermal profile optimization.
321
1 .7
1 . 6
1 . 5
9 08 58 0 1 7 51 6 51 5 5
2 1 51 8 0
1 .7
1 . 6
1 . 5
2 7 52 4 52 1 5 8 07 57 0
0 .0 7 10 .0 3 60 .0 1 8
1 .7
1 . 6
1 . 5
X 1
Me
an
X 2 X 3
X 4 X 5 X 6
X 7
M a in E f f e c ts P lo t f o r R e s p o n s e S o a k S lo p e
Da ta M e a n s
321
0 .7
0 . 6
0 . 5
9 08 58 0 1 7 51 6 51 5 5
2 1 51 8 0
0 .7
0 . 6
0 . 5
2 7 52 4 52 1 5 8 07 57 0
0 .0 7 10 .0 3 60 .0 1 8
0 .7
0 . 6
0 . 5
X 1
Me
an
X 2 X 3
X 4 X 5 X 6
X 7
M a in E f f e c ts P lo t f o r R e s p o n s e R e f lo w S lo p e
Da ta M e a n s
Figure 8. Main affects variables
ACKNOWLEDGEMENTS I would like to express my sincere appreciation to my committee members and special thanks for Dr. Daw R.
Alwerfalli and Dr. Ahad Ali on their valuable encouragement, timely guidance and patience. In addition, I would like
to express my sincere gratitude to Dr. Ahmed Alsamarai who helped a lot during the investigation of the topic
REFERENCES [1] Tsai, T. N. (2012). Thermal parameters optimization of a reflow soldering profile in printed circuit board
assembly: A comparative study. Applied Soft Computing, 12(8), 2601-2613.
[2] Mapa, L. B., & Vancha, M. A. R. (2012). AC 2012-5108: DESIGN OF EXPERIMENTS MODELING OF A
HEAT TUNNEL. In American Society for Engineering Education. American Society for Engineering Education.
[3] Flaig, J. J. (2006). A New Classification of Variables in Design of Experiments.
[4] Gong, Y., Li, Q., & Yang, D. G. (2006, August). The optimization of reflow soldering temperature profile based
on simulation. In Electronic Packaging Technology, 2006. ICEPT'06. 7th International Conference on (pp. 1-4).
IEEE.
[5] Shu, M. H., Hsu, B. M., & Hu, M. C. (2012) made an optimal combination of soldering conditions of BGA for
halogen-free and lead-free SMT-green processes. Microelectronics Reliability, 52(11), 2690-2700.
[6] Verdi, F. W. Lead Free Manufacturing: Reflow Soldering.
[7] Gao, J., Wu, Y., & Ding, H. (2007). Optimization of a reflow soldering process based on the heating factor.
Soldering & surface mount technology, 19(1), 28-33.
[8] Gang Gao, J., Ping Wu, Y., Ding, H., & Hong Wan, N. (2008). Thermal profiling: a reflow process based on the
heating factor. Soldering & Surface Mount Technology, 20(4), 20-27.
[9] Baehr, H. D., & Stephan, K. (2011). Heat and mass transfer.
1086
Related Documents