International Scholarly Research Network ISRN Nanomaterials Volume 2012, Article ID 909647, 13 pages doi:10.5402/2012/909647 Research Article Optimization of the Synthesis of Nanostructured Tungsten-Molybdenum Bimetallic Oxide H. Hassan, 1 T. Zaki, 1 S. Mikhail, 1 A. Kandil, 2 and A. Farag 2 1 Petroleum Refining Division, Department of Catalysis, Egyptian Petroleum Research Institute, Cairo 11727, Egypt 2 Department of Chemistry, Faculty of Science, Helwan University, Helwan 11421, Egypt Correspondence should be addressed to H. Hassan, [email protected] Received 16 May 2012; Accepted 10 June 2012 Academic Editors: R. Azimirad, C. Li, and F. Miao Copyright © 2012 H. Hassan et al. This is an open access article distributed under the Creative Commons Attribution License, which permits unrestricted use, distribution, and reproduction in any medium, provided the original work is properly cited. Mo 0.5 W 0.5 O 3 nanoparticles were prepared through the Pechini process and were characterized using X-ray diffraction (XRD), transmission electron microscopy (TEM), FT-IR spectrometer, and differential thermal analysis (TG-DSC) analyses. The polyesterification reaction, as the starting step, has a profound influence on the dispersion of the resulting nanoparticles. The molar ratios CA : TM = 2 and EG : CA = 1.5 are favorable for the preparation of Mo 0.5 W 0.5 O 3 nanoparticles having average particles size ranging from 2 to 9 nm. Meanwhile, the molar ratios CA : TM = 4 and EG : CA = 0.19 are favorable for the preparation of Mo 0.5 W 0.5 O 3 nanoparticles having an average particles size ranging from 11 to 29 nm. For the calcination step, increased calcination time (eight hours) at 500 ◦ C is advantageous for allowing the monometallic phases enough time to transform into the desired bimetallic Mo 0.5 W 0.5 O 3 phase. 1. Introduction Molybdenum trioxide (MoO 3 ) and tungsten trioxide (WO 3 ) are well-known metal oxides with similar physical and chemical properties. They show n-type semiconducting properties related to the presence of lattice defects, mainly oxygen defects [1, 2], and they have been extensively studied for their potential applicability in gas sensing devices [3, 4] and catalysis [5, 6]. Additionally, due to the unique activity of trioxides of W and Mo in nonstoichiometric forms, they have been extensively studied as electrochemical materials [7]. The Mo x W l−x O 3 system exhibits “displacive” or “recon- structive” phase transitions induced by hydrogen intercala- tion and temperature, respectively, leading to rearrangement in the local electronic and atomic structures [8]. Polycrys- talline Mo x W l−x O 3 (x = 0.1, 0.2, 0.3, 0.5, 0.7, and 0.9) solid solutions were obtained by high-temperature synthesis [9]. With the progress in nanotechnology, nanoparticles have attracted increasing attention to their unique properties [10]. One of the recently investigated methods for the simple preparation of nano-oxide composites that include molybdenum or tungsten atoms is the Pechini method [11, 12]. However, research into the catalytic activity of molybdenum-tungsten bimetallic oxides is rare despite their promising gas sensing potential [13, 14]. In this work, the synthesis of molybdenum-tungsten oxide nanoparticles is presented. The procedure includes the formation of composites containing both molybdenum or tungsten atoms in a 1 : 1 ratio using the polymeric method. The influence of citric acid and ethylene glycol concentrations, as well as total metal molar ratios, on the properties of the final products was studied. In addition, the effect of the sequence of the synthetic steps (i.e., polymerization and chelation) was explored. Furthermore, the impacts of the temperature and time of calcination were examined. 2. Experimental For most of the prepared samples, aqueous ethylene glycol (EG) solutions of different concentrations were added to an aqueous solution of citric acid (CA) for polymerization under constant stirring and at 60 ◦ C for 1 h. Second, the polyester was heated to 80 ◦ C with stirring, and then 500 mL of a TM solution (1 : 1 Mo : W metal ratio of ammonium

Welcome message from author
This document is posted to help you gain knowledge. Please leave a comment to let me know what you think about it! Share it to your friends and learn new things together.
Transcript
International Scholarly Research NetworkISRN NanomaterialsVolume 2012, Article ID 909647, 13 pagesdoi:10.5402/2012/909647
Research Article
Optimization of the Synthesis of NanostructuredTungsten-Molybdenum Bimetallic Oxide
H. Hassan,1 T. Zaki,1 S. Mikhail,1 A. Kandil,2 and A. Farag2
1 Petroleum Refining Division, Department of Catalysis, Egyptian Petroleum Research Institute, Cairo 11727, Egypt2 Department of Chemistry, Faculty of Science, Helwan University, Helwan 11421, Egypt
Correspondence should be addressed to H. Hassan, [email protected]
Received 16 May 2012; Accepted 10 June 2012
Academic Editors: R. Azimirad, C. Li, and F. Miao
Copyright © 2012 H. Hassan et al. This is an open access article distributed under the Creative Commons Attribution License,which permits unrestricted use, distribution, and reproduction in any medium, provided the original work is properly cited.
Mo0.5W0.5O3 nanoparticles were prepared through the Pechini process and were characterized using X-ray diffraction (XRD),transmission electron microscopy (TEM), FT-IR spectrometer, and differential thermal analysis (TG-DSC) analyses. Thepolyesterification reaction, as the starting step, has a profound influence on the dispersion of the resulting nanoparticles. Themolar ratios CA : TM= 2 and EG : CA= 1.5 are favorable for the preparation of Mo0.5W0.5O3 nanoparticles having average particlessize ranging from 2 to 9 nm. Meanwhile, the molar ratios CA : TM= 4 and EG : CA= 0.19 are favorable for the preparationof Mo0.5W0.5O3 nanoparticles having an average particles size ranging from 11 to 29 nm. For the calcination step, increasedcalcination time (eight hours) at 500◦C is advantageous for allowing the monometallic phases enough time to transform intothe desired bimetallic Mo0.5W0.5O3 phase.
1. Introduction
Molybdenum trioxide (MoO3) and tungsten trioxide (WO3)are well-known metal oxides with similar physical andchemical properties. They show n-type semiconductingproperties related to the presence of lattice defects, mainlyoxygen defects [1, 2], and they have been extensively studiedfor their potential applicability in gas sensing devices [3, 4]and catalysis [5, 6]. Additionally, due to the unique activity oftrioxides of W and Mo in nonstoichiometric forms, they havebeen extensively studied as electrochemical materials [7].
The MoxWl−xO3 system exhibits “displacive” or “recon-structive” phase transitions induced by hydrogen intercala-tion and temperature, respectively, leading to rearrangementin the local electronic and atomic structures [8]. Polycrys-talline MoxWl−xO3 (x = 0.1, 0.2, 0.3, 0.5, 0.7, and 0.9) solidsolutions were obtained by high-temperature synthesis [9].
With the progress in nanotechnology, nanoparticles haveattracted increasing attention to their unique properties[10]. One of the recently investigated methods for thesimple preparation of nano-oxide composites that includemolybdenum or tungsten atoms is the Pechini method[11, 12]. However, research into the catalytic activity of
molybdenum-tungsten bimetallic oxides is rare despite theirpromising gas sensing potential [13, 14].
In this work, the synthesis of molybdenum-tungstenoxide nanoparticles is presented. The procedure includesthe formation of composites containing both molybdenumor tungsten atoms in a 1 : 1 ratio using the polymericmethod. The influence of citric acid and ethylene glycolconcentrations, as well as total metal molar ratios, on theproperties of the final products was studied. In addition,the effect of the sequence of the synthetic steps (i.e.,polymerization and chelation) was explored. Furthermore,the impacts of the temperature and time of calcination wereexamined.
2. Experimental
For most of the prepared samples, aqueous ethylene glycol(EG) solutions of different concentrations were added toan aqueous solution of citric acid (CA) for polymerizationunder constant stirring and at 60◦C for 1 h. Second, thepolyester was heated to 80◦C with stirring, and then 500 mLof a TM solution (1 : 1 Mo : W metal ratio of ammonium
2 ISRN Nanomaterials
heptamolybdate and ammonium metatungstate precursors)was added and stirred for an additional hour. Accordingly,molybdic and tungstic acids were created, and the pHof the medium decreased to 1.4. In the third step, thesolutions were slowly heated to 140◦C until the water wascompletely removed (∼2.5 hours). The gels obtained weredried at 150◦C overnight in an electrical furnace to yieldsolid resins. The resulting resins were ground in an agatemortar and subjected to a pyrolysis process at 450◦C for 4 hin glazed alumina crucibles. Finally, the pyrolyzed productwas subjected to calcination at 500◦C for 4 h in the presenceof purified air. The MoWO3 samples were named MWRC-RE (RC is CA : TM, and RE is EG : CA) corresponding to theratios used.
To understand the influence of the sequence of thepreparation steps, MW2–1.5 was also prepared in the reversefashion (i.e., the TM solution was added to the CA solutionat 60◦C first, and then, the EG solution was added at 80◦C).This sample was named RMW2–1.5.
To study the role of the calcination step on the final char-acteristics of the produced bimetallic oxides, two factors wereinvestigated. The first factor was the calcination temperature,and the second was the calcination duration.
The molybdenum-tungsten samples selected for thermaltreatment temperature evaluation were named MWRC-RE(T) (RC is CA : TM, RE is EG : CA and T is calcination tem-perature) corresponding to the preparation and treatmentconditions used. At relatively high calcination temperatures,that is, 750, 850, and 950◦C, a physically separated needledsample was collected in addition to the ordinary finalpowder product, and the separated samples were codedMWRC-RE(S750), MWRC-RE(S850), and MWRC-RE(S950),respectively.
The bimetallic oxide samples subjected to differentcalcination times were labeled MWRC-RE (8) and MWRC-RE (12), which referred to calcination for eight and twelvehours, respectively. The sample calcined for four hours wasnamed MWRC-RE.
The evolution of the samples was followed by X-raypowder diffraction (XRD) on a Bruker AXS D8 Advanceequipped with Ni-filtered copper Kα1 radiation (λ =1.5404 A) in the range 2θ = 20–80◦. Transmission electronmicroscopy images were recorded on a JEOL-1400 TEMat 120 kV. FTIR spectra were recorded using an FT-IRspectrometer, model 960M000 g, ATI Mattson Infinity Series.Differential thermal analysis was recorded on a Labsys TG-DSC16 apparatus manufactured by Setaram Instrumenta-tion. The sample was ground to 20 mesh, and α-aluminawas used as an inert reference material. The experimentswere carried out at a heating rate of 10◦C/min in an argonatmosphere.
3. Results and Discussion
3.1. The Role of Reactant Molar Ratios
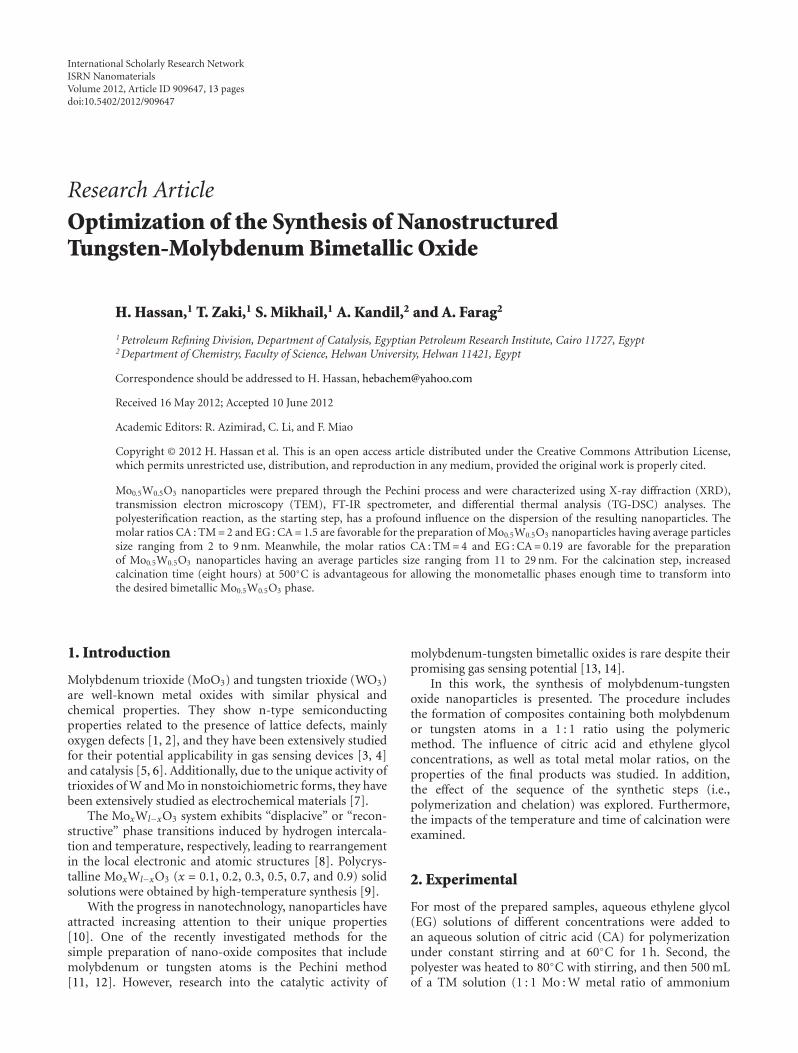
3.1.1. Influence of EG Molar Ratio. Figure 1 presents theXRD patterns of MoW oxides samples with increasing EG
molar fractions and a constant CA : TM molar ratio. TheXRD patterns show one main phase, which is Mo0.5W0.5O3
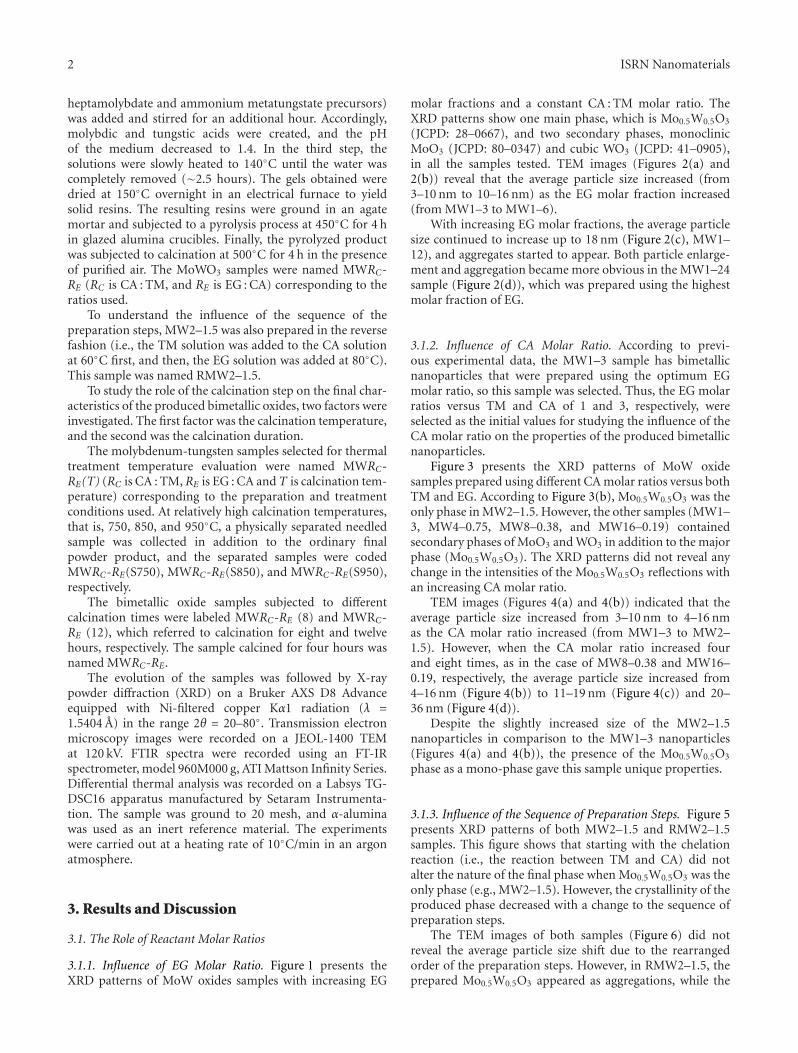
(JCPD: 28–0667), and two secondary phases, monoclinicMoO3 (JCPD: 80–0347) and cubic WO3 (JCPD: 41–0905),in all the samples tested. TEM images (Figures 2(a) and2(b)) reveal that the average particle size increased (from3–10 nm to 10–16 nm) as the EG molar fraction increased(from MW1–3 to MW1–6).
With increasing EG molar fractions, the average particlesize continued to increase up to 18 nm (Figure 2(c), MW1–12), and aggregates started to appear. Both particle enlarge-ment and aggregation became more obvious in the MW1–24sample (Figure 2(d)), which was prepared using the highestmolar fraction of EG.
3.1.2. Influence of CA Molar Ratio. According to previ-ous experimental data, the MW1–3 sample has bimetallicnanoparticles that were prepared using the optimum EGmolar ratio, so this sample was selected. Thus, the EG molarratios versus TM and CA of 1 and 3, respectively, wereselected as the initial values for studying the influence of theCA molar ratio on the properties of the produced bimetallicnanoparticles.
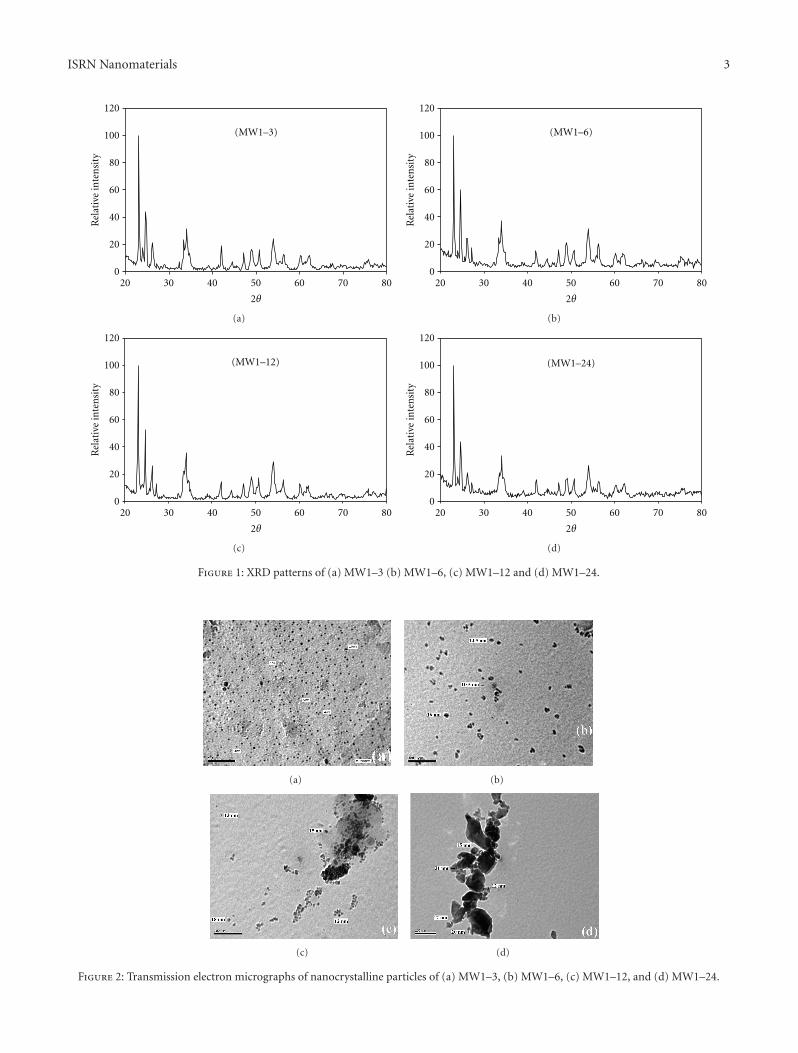
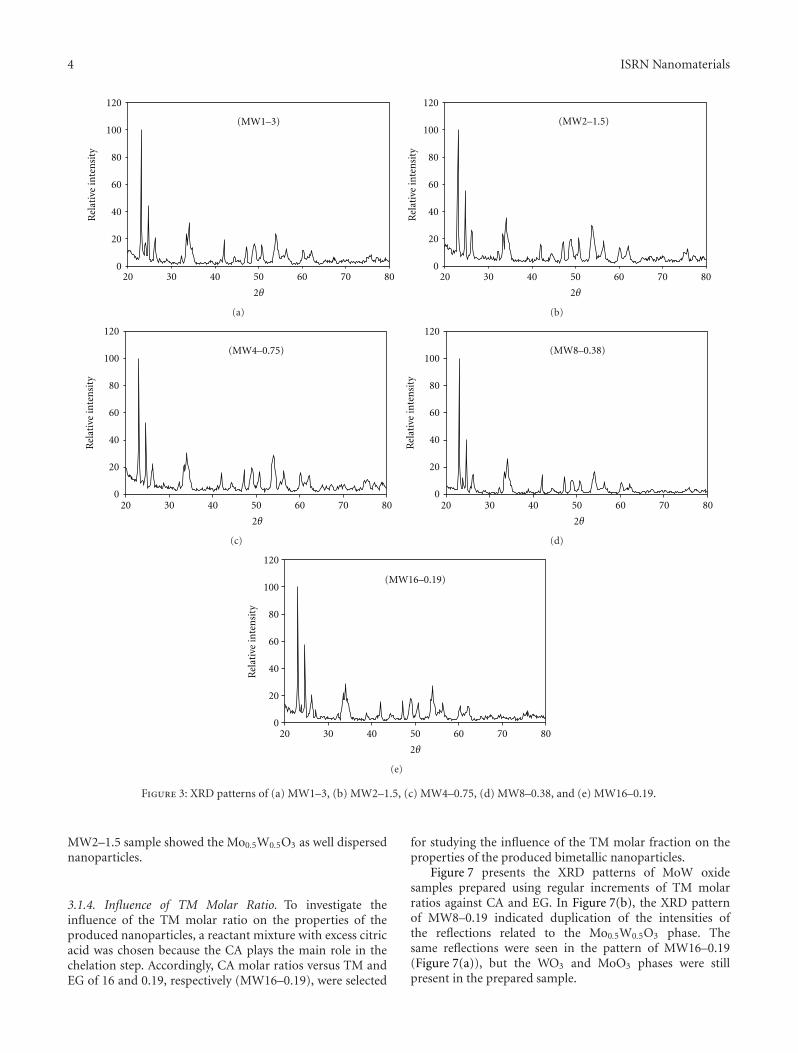
Figure 3 presents the XRD patterns of MoW oxidesamples prepared using different CA molar ratios versus bothTM and EG. According to Figure 3(b), Mo0.5W0.5O3 was theonly phase in MW2–1.5. However, the other samples (MW1–3, MW4–0.75, MW8–0.38, and MW16–0.19) containedsecondary phases of MoO3 and WO3 in addition to the majorphase (Mo0.5W0.5O3). The XRD patterns did not reveal anychange in the intensities of the Mo0.5W0.5O3 reflections withan increasing CA molar ratio.
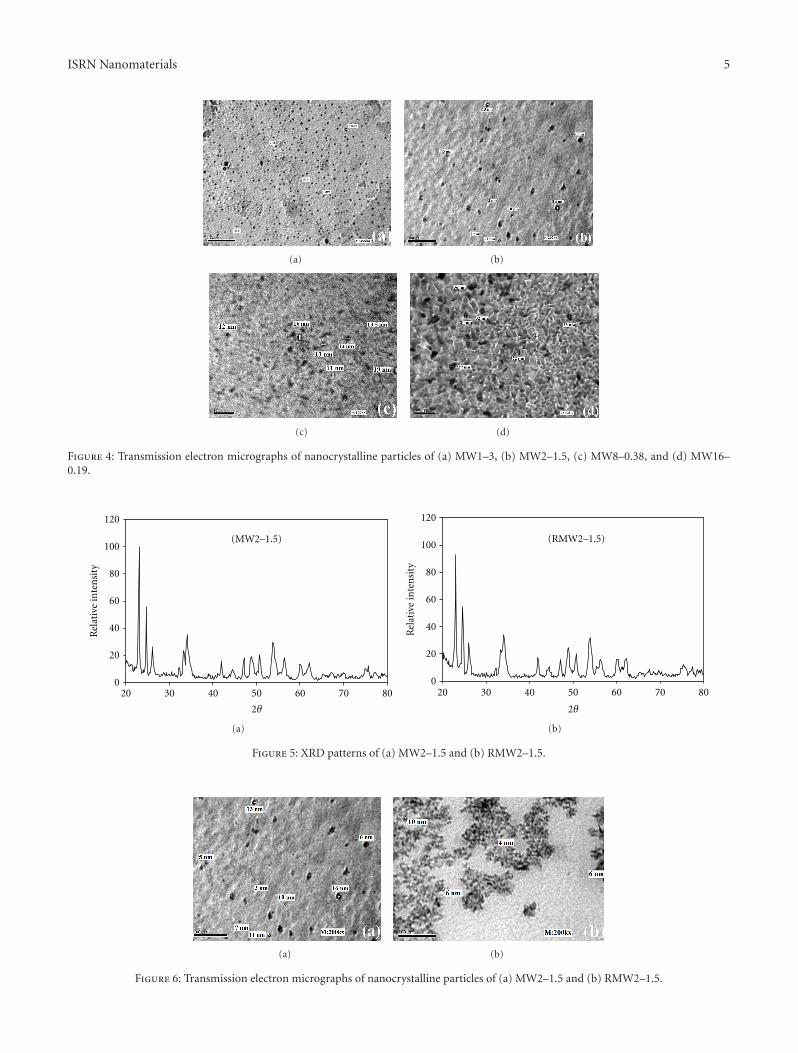
TEM images (Figures 4(a) and 4(b)) indicated that theaverage particle size increased from 3–10 nm to 4–16 nmas the CA molar ratio increased (from MW1–3 to MW2–1.5). However, when the CA molar ratio increased fourand eight times, as in the case of MW8–0.38 and MW16–0.19, respectively, the average particle size increased from4–16 nm (Figure 4(b)) to 11–19 nm (Figure 4(c)) and 20–36 nm (Figure 4(d)).
Despite the slightly increased size of the MW2–1.5nanoparticles in comparison to the MW1–3 nanoparticles(Figures 4(a) and 4(b)), the presence of the Mo0.5W0.5O3
phase as a mono-phase gave this sample unique properties.
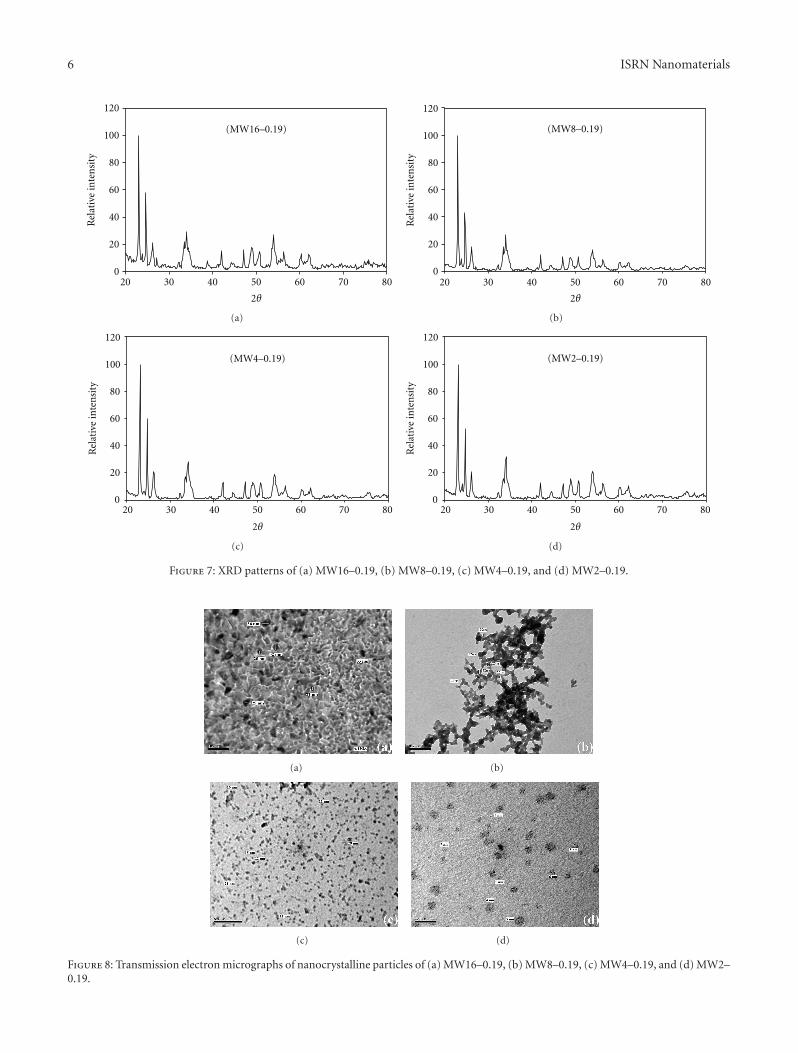
3.1.3. Influence of the Sequence of Preparation Steps. Figure 5presents XRD patterns of both MW2–1.5 and RMW2–1.5samples. This figure shows that starting with the chelationreaction (i.e., the reaction between TM and CA) did notalter the nature of the final phase when Mo0.5W0.5O3 was theonly phase (e.g., MW2–1.5). However, the crystallinity of theproduced phase decreased with a change to the sequence ofpreparation steps.
The TEM images of both samples (Figure 6) did notreveal the average particle size shift due to the rearrangedorder of the preparation steps. However, in RMW2–1.5, theprepared Mo0.5W0.5O3 appeared as aggregations, while the
ISRN Nanomaterials 3
0
20
40
60
80
100
120
20 30 40 50 60 70 80
Rel
ativ
e in
ten
sity
2θ
(MW1–3)
(a)
0
20
40
60
80
100
120
20 30 40 50 60 70 80
Rel
ativ
e in
ten
sity
2θ
(MW1–6)
(b)
0
20
40
60
80
100
120
20 30 40 50 60 70 80
Rel
ativ
e in
ten
sity
2θ
(MW1–12)
(c)
0
20
40
60
80
100
120
20 30 40 50 60 70 80
Rel
ativ
e in
ten
sity
2θ
(MW1–24)
(d)
Figure 1: XRD patterns of (a) MW1–3 (b) MW1–6, (c) MW1–12 and (d) MW1–24.
(a) (b)
(c) (d)
Figure 2: Transmission electron micrographs of nanocrystalline particles of (a) MW1–3, (b) MW1–6, (c) MW1–12, and (d) MW1–24.
4 ISRN Nanomaterials
0
20
40
60
80
100
120
20 30 40 50 60 70 80
Rel
ativ
e in
ten
sity
2θ
(MW1–3)
(a)
0
20
40
60
80
100
120
20 30 40 50 60 70 80
Rel
ativ
e in
ten
sity
2θ
(MW2–1.5)
(b)
0
20
40
60
80
100
120
20 30 40 50 60 70 80
Rel
ativ
e in
ten
sity
2θ
(MW4–0.75)
(c)
0
20
40
60
80
100
120
20 30 40 50 60 70 80
Rel
ativ
e in
ten
sity
2θ
(MW8–0.38)
(d)
0
20
40
60
80
100
120
20 30 40 50 60 70 80
Rel
ativ
e in
ten
sity
2θ
(MW16–0.19)
(e)
Figure 3: XRD patterns of (a) MW1–3, (b) MW2–1.5, (c) MW4–0.75, (d) MW8–0.38, and (e) MW16–0.19.
MW2–1.5 sample showed the Mo0.5W0.5O3 as well dispersednanoparticles.
3.1.4. Influence of TM Molar Ratio. To investigate theinfluence of the TM molar ratio on the properties of theproduced nanoparticles, a reactant mixture with excess citricacid was chosen because the CA plays the main role in thechelation step. Accordingly, CA molar ratios versus TM andEG of 16 and 0.19, respectively (MW16–0.19), were selected
for studying the influence of the TM molar fraction on theproperties of the produced bimetallic nanoparticles.
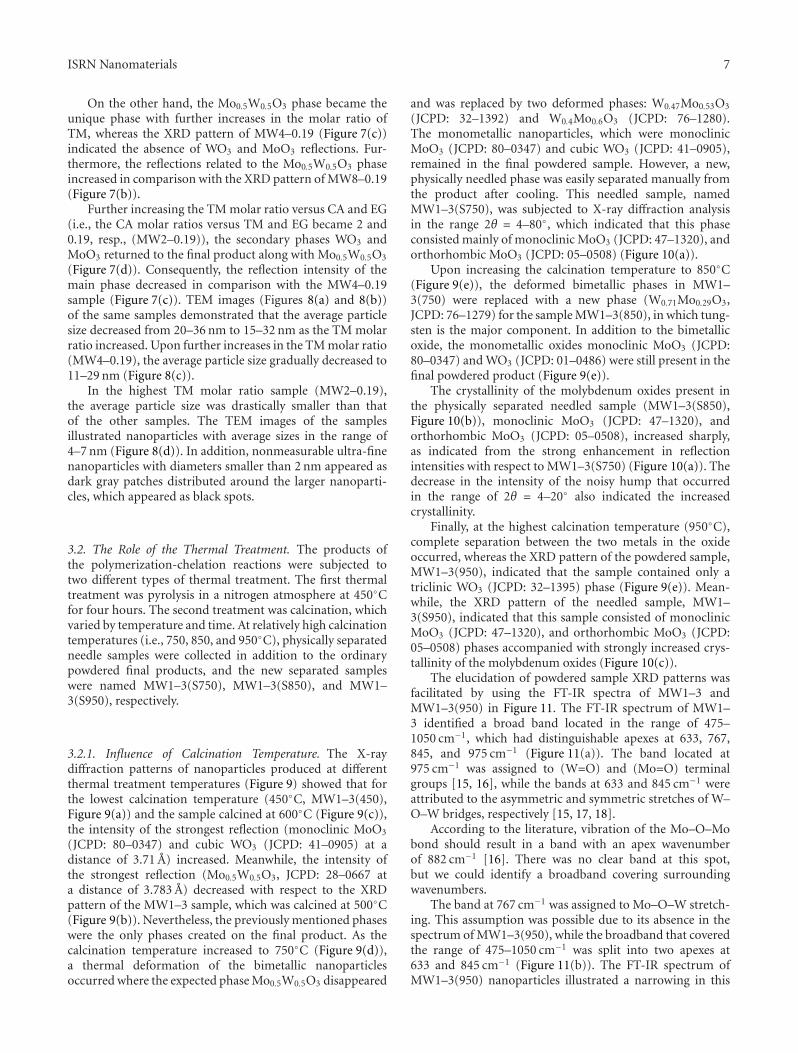
Figure 7 presents the XRD patterns of MoW oxidesamples prepared using regular increments of TM molarratios against CA and EG. In Figure 7(b), the XRD patternof MW8–0.19 indicated duplication of the intensities ofthe reflections related to the Mo0.5W0.5O3 phase. Thesame reflections were seen in the pattern of MW16–0.19(Figure 7(a)), but the WO3 and MoO3 phases were stillpresent in the prepared sample.
ISRN Nanomaterials 5
(a) (b)
(c) (d)
Figure 4: Transmission electron micrographs of nanocrystalline particles of (a) MW1–3, (b) MW2–1.5, (c) MW8–0.38, and (d) MW16–0.19.
0
20
40
60
80
100
120
20 30 40 50 60 70 80
Rel
ativ
e in
ten
sity
2θ
(MW2–1.5)
(a)
0
20
40
60
80
100
120
20 30 40 50 60 70 80
Rel
ativ
e in
ten
sity
2θ
(RMW2–1.5)
(b)
Figure 5: XRD patterns of (a) MW2–1.5 and (b) RMW2–1.5.
(a) (b)
Figure 6: Transmission electron micrographs of nanocrystalline particles of (a) MW2–1.5 and (b) RMW2–1.5.
6 ISRN Nanomaterials
0
20
40
60
80
100
120
20 30 40 50 60 70 80
Rel
ativ
e in
ten
sity
2θ
(MW16–0.19)
(a)
0
20
40
60
80
100
120
20 30 40 50 60 70 80
Rel
ativ
e in
ten
sity
2θ
(MW8–0.19)
(b)
0
20
40
60
80
100
120
20 30 40 50 60 70 80
Rel
ativ
e in
ten
sity
2θ
(MW4–0.19)
(c)
0
20
40
60
80
100
120
20 30 40 50 60 70 80
Rel
ativ
e in
ten
sity
2θ
(MW2–0.19)
(d)
Figure 7: XRD patterns of (a) MW16–0.19, (b) MW8–0.19, (c) MW4–0.19, and (d) MW2–0.19.
(a) (b)
(c) (d)
Figure 8: Transmission electron micrographs of nanocrystalline particles of (a) MW16–0.19, (b) MW8–0.19, (c) MW4–0.19, and (d) MW2–0.19.
ISRN Nanomaterials 7
On the other hand, the Mo0.5W0.5O3 phase became theunique phase with further increases in the molar ratio ofTM, whereas the XRD pattern of MW4–0.19 (Figure 7(c))indicated the absence of WO3 and MoO3 reflections. Fur-thermore, the reflections related to the Mo0.5W0.5O3 phaseincreased in comparison with the XRD pattern of MW8–0.19(Figure 7(b)).
Further increasing the TM molar ratio versus CA and EG(i.e., the CA molar ratios versus TM and EG became 2 and0.19, resp., (MW2–0.19)), the secondary phases WO3 andMoO3 returned to the final product along with Mo0.5W0.5O3
(Figure 7(d)). Consequently, the reflection intensity of themain phase decreased in comparison with the MW4–0.19sample (Figure 7(c)). TEM images (Figures 8(a) and 8(b))of the same samples demonstrated that the average particlesize decreased from 20–36 nm to 15–32 nm as the TM molarratio increased. Upon further increases in the TM molar ratio(MW4–0.19), the average particle size gradually decreased to11–29 nm (Figure 8(c)).
In the highest TM molar ratio sample (MW2–0.19),the average particle size was drastically smaller than thatof the other samples. The TEM images of the samplesillustrated nanoparticles with average sizes in the range of4–7 nm (Figure 8(d)). In addition, nonmeasurable ultra-finenanoparticles with diameters smaller than 2 nm appeared asdark gray patches distributed around the larger nanoparti-cles, which appeared as black spots.
3.2. The Role of the Thermal Treatment. The products ofthe polymerization-chelation reactions were subjected totwo different types of thermal treatment. The first thermaltreatment was pyrolysis in a nitrogen atmosphere at 450◦Cfor four hours. The second treatment was calcination, whichvaried by temperature and time. At relatively high calcinationtemperatures (i.e., 750, 850, and 950◦C), physically separatedneedle samples were collected in addition to the ordinarypowdered final products, and the new separated sampleswere named MW1–3(S750), MW1–3(S850), and MW1–3(S950), respectively.
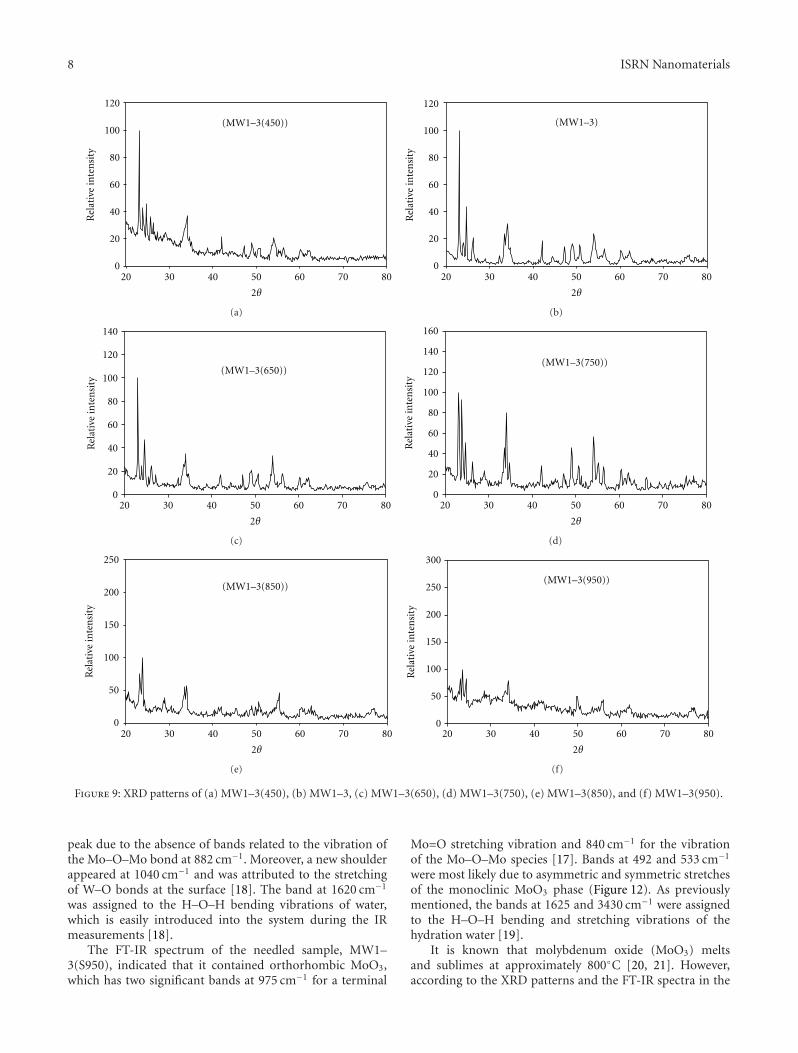
3.2.1. Influence of Calcination Temperature. The X-raydiffraction patterns of nanoparticles produced at differentthermal treatment temperatures (Figure 9) showed that forthe lowest calcination temperature (450◦C, MW1–3(450),Figure 9(a)) and the sample calcined at 600◦C (Figure 9(c)),the intensity of the strongest reflection (monoclinic MoO3
(JCPD: 80–0347) and cubic WO3 (JCPD: 41–0905) at adistance of 3.71 A) increased. Meanwhile, the intensity ofthe strongest reflection (Mo0.5W0.5O3, JCPD: 28–0667 ata distance of 3.783 A) decreased with respect to the XRDpattern of the MW1–3 sample, which was calcined at 500◦C(Figure 9(b)). Nevertheless, the previously mentioned phaseswere the only phases created on the final product. As thecalcination temperature increased to 750◦C (Figure 9(d)),a thermal deformation of the bimetallic nanoparticlesoccurred where the expected phase Mo0.5W0.5O3 disappeared
and was replaced by two deformed phases: W0.47Mo0.53O3
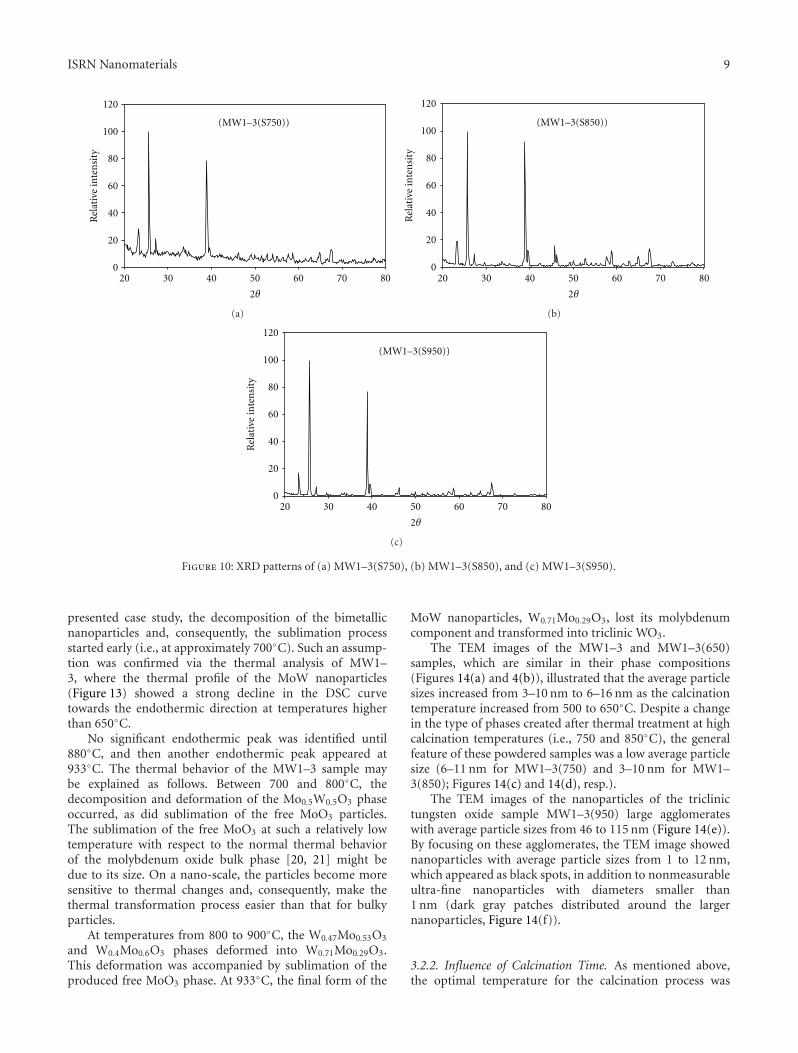
(JCPD: 32–1392) and W0.4Mo0.6O3 (JCPD: 76–1280).The monometallic nanoparticles, which were monoclinicMoO3 (JCPD: 80–0347) and cubic WO3 (JCPD: 41–0905),remained in the final powdered sample. However, a new,physically needled phase was easily separated manually fromthe product after cooling. This needled sample, namedMW1–3(S750), was subjected to X-ray diffraction analysisin the range 2θ = 4–80◦, which indicated that this phaseconsisted mainly of monoclinic MoO3 (JCPD: 47–1320), andorthorhombic MoO3 (JCPD: 05–0508) (Figure 10(a)).
Upon increasing the calcination temperature to 850◦C(Figure 9(e)), the deformed bimetallic phases in MW1–3(750) were replaced with a new phase (W0.71Mo0.29O3,JCPD: 76–1279) for the sample MW1–3(850), in which tung-sten is the major component. In addition to the bimetallicoxide, the monometallic oxides monoclinic MoO3 (JCPD:80–0347) and WO3 (JCPD: 01–0486) were still present in thefinal powdered product (Figure 9(e)).
The crystallinity of the molybdenum oxides present inthe physically separated needled sample (MW1–3(S850),Figure 10(b)), monoclinic MoO3 (JCPD: 47–1320), andorthorhombic MoO3 (JCPD: 05–0508), increased sharply,as indicated from the strong enhancement in reflectionintensities with respect to MW1–3(S750) (Figure 10(a)). Thedecrease in the intensity of the noisy hump that occurredin the range of 2θ = 4–20◦ also indicated the increasedcrystallinity.
Finally, at the highest calcination temperature (950◦C),complete separation between the two metals in the oxideoccurred, whereas the XRD pattern of the powdered sample,MW1–3(950), indicated that the sample contained only atriclinic WO3 (JCPD: 32–1395) phase (Figure 9(e)). Mean-while, the XRD pattern of the needled sample, MW1–3(S950), indicated that this sample consisted of monoclinicMoO3 (JCPD: 47–1320), and orthorhombic MoO3 (JCPD:05–0508) phases accompanied with strongly increased crys-tallinity of the molybdenum oxides (Figure 10(c)).
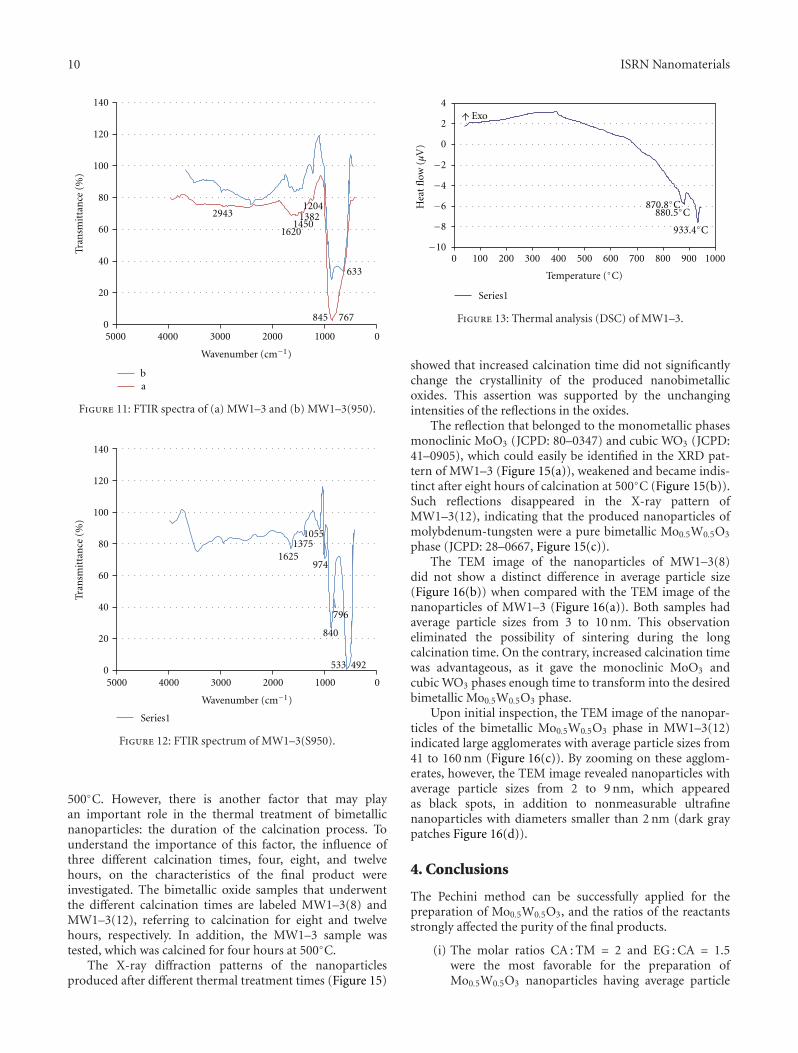
The elucidation of powdered sample XRD patterns wasfacilitated by using the FT-IR spectra of MW1–3 andMW1–3(950) in Figure 11. The FT-IR spectrum of MW1–3 identified a broad band located in the range of 475–1050 cm−1, which had distinguishable apexes at 633, 767,845, and 975 cm−1 (Figure 11(a)). The band located at975 cm−1 was assigned to (W=O) and (Mo=O) terminalgroups [15, 16], while the bands at 633 and 845 cm−1 wereattributed to the asymmetric and symmetric stretches of W–O–W bridges, respectively [15, 17, 18].
According to the literature, vibration of the Mo–O–Mobond should result in a band with an apex wavenumberof 882 cm−1 [16]. There was no clear band at this spot,but we could identify a broadband covering surroundingwavenumbers.
The band at 767 cm−1 was assigned to Mo–O–W stretch-ing. This assumption was possible due to its absence in thespectrum of MW1–3(950), while the broadband that coveredthe range of 475–1050 cm−1 was split into two apexes at633 and 845 cm−1 (Figure 11(b)). The FT-IR spectrum ofMW1–3(950) nanoparticles illustrated a narrowing in this
8 ISRN Nanomaterials
0
20
40
60
80
100
120
20 30 40 50 60 70 80
Rel
ativ
e in
ten
sity
2θ
(MW1–3(450))
(a)
0
20
40
60
80
100
120
20 30 40 50 60 70 80
Rel
ativ
e in
ten
sity
2θ
(MW1–3)
(b)
0
20
40
60
80
100
120
140
20 30 40 50 60 70 80
Rel
ativ
e in
ten
sity
2θ
(MW1–3(650))
(c)
0
20
40
60
80
100
120
140
160
20 30 40 50 60 70 80
Rel
ativ
e in
ten
sity
2θ
(MW1–3(750))
(d)
0
50
100
150
200
250
20 30 40 50 60 70 80
Rel
ativ
e in
ten
sity
2θ
(MW1–3(850))
(e)
0
50
100
150
200
250
300
20 30 40 50 60 70 80
Rel
ativ
e in
ten
sity
2θ
(MW1–3(950))
(f)
Figure 9: XRD patterns of (a) MW1–3(450), (b) MW1–3, (c) MW1–3(650), (d) MW1–3(750), (e) MW1–3(850), and (f) MW1–3(950).
peak due to the absence of bands related to the vibration ofthe Mo–O–Mo bond at 882 cm−1. Moreover, a new shoulderappeared at 1040 cm−1 and was attributed to the stretchingof W–O bonds at the surface [18]. The band at 1620 cm−1
was assigned to the H–O–H bending vibrations of water,which is easily introduced into the system during the IRmeasurements [18].
The FT-IR spectrum of the needled sample, MW1–3(S950), indicated that it contained orthorhombic MoO3,which has two significant bands at 975 cm−1 for a terminal
Mo=O stretching vibration and 840 cm−1 for the vibrationof the Mo–O–Mo species [17]. Bands at 492 and 533 cm−1
were most likely due to asymmetric and symmetric stretchesof the monoclinic MoO3 phase (Figure 12). As previouslymentioned, the bands at 1625 and 3430 cm−1 were assignedto the H–O–H bending and stretching vibrations of thehydration water [19].
It is known that molybdenum oxide (MoO3) meltsand sublimes at approximately 800◦C [20, 21]. However,according to the XRD patterns and the FT-IR spectra in the
ISRN Nanomaterials 9
0
20
40
60
80
100
120
20 30 40 50 60 70 80
(MW1–3(S750))
Rel
ativ
e in
ten
sity
2θ
(a)
0
20
40
60
80
100
120
20 30 40 50 60 70 80
(MW1–3(S850))
Rel
ativ
e in
ten
sity
2θ
(b)
0
20
40
60
80
100
120
20 30 40 50 60 70 80
(MW1–3(S950))
Rel
ativ
e in
ten
sity
2θ
(c)
Figure 10: XRD patterns of (a) MW1–3(S750), (b) MW1–3(S850), and (c) MW1–3(S950).
presented case study, the decomposition of the bimetallicnanoparticles and, consequently, the sublimation processstarted early (i.e., at approximately 700◦C). Such an assump-tion was confirmed via the thermal analysis of MW1–3, where the thermal profile of the MoW nanoparticles(Figure 13) showed a strong decline in the DSC curvetowards the endothermic direction at temperatures higherthan 650◦C.
No significant endothermic peak was identified until880◦C, and then another endothermic peak appeared at933◦C. The thermal behavior of the MW1–3 sample maybe explained as follows. Between 700 and 800◦C, thedecomposition and deformation of the Mo0.5W0.5O3 phaseoccurred, as did sublimation of the free MoO3 particles.The sublimation of the free MoO3 at such a relatively lowtemperature with respect to the normal thermal behaviorof the molybdenum oxide bulk phase [20, 21] might bedue to its size. On a nano-scale, the particles become moresensitive to thermal changes and, consequently, make thethermal transformation process easier than that for bulkyparticles.
At temperatures from 800 to 900◦C, the W0.47Mo0.53O3
and W0.4Mo0.6O3 phases deformed into W0.71Mo0.29O3.This deformation was accompanied by sublimation of theproduced free MoO3 phase. At 933◦C, the final form of the
MoW nanoparticles, W0.71Mo0.29O3, lost its molybdenumcomponent and transformed into triclinic WO3.
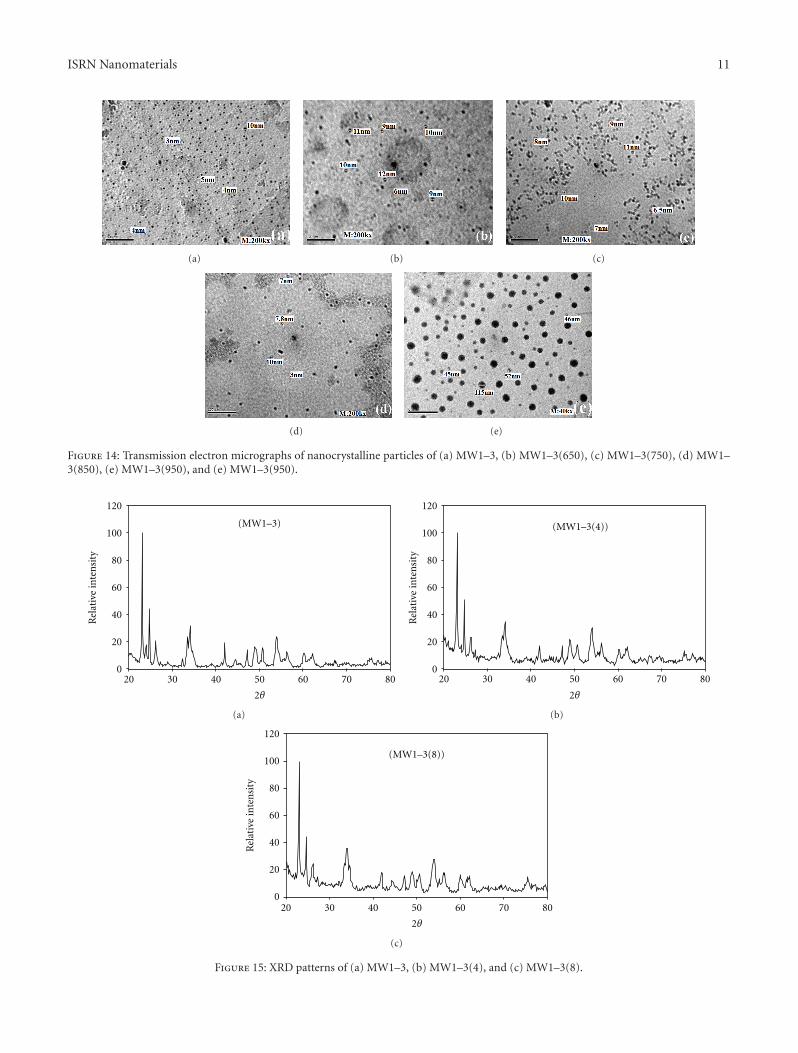
The TEM images of the MW1–3 and MW1–3(650)samples, which are similar in their phase compositions(Figures 14(a) and 4(b)), illustrated that the average particlesizes increased from 3–10 nm to 6–16 nm as the calcinationtemperature increased from 500 to 650◦C. Despite a changein the type of phases created after thermal treatment at highcalcination temperatures (i.e., 750 and 850◦C), the generalfeature of these powdered samples was a low average particlesize (6–11 nm for MW1–3(750) and 3–10 nm for MW1–3(850); Figures 14(c) and 14(d), resp.).
The TEM images of the nanoparticles of the triclinictungsten oxide sample MW1–3(950) large agglomerateswith average particle sizes from 46 to 115 nm (Figure 14(e)).By focusing on these agglomerates, the TEM image showednanoparticles with average particle sizes from 1 to 12 nm,which appeared as black spots, in addition to nonmeasurableultra-fine nanoparticles with diameters smaller than1 nm (dark gray patches distributed around the largernanoparticles, Figure 14(f)).
3.2.2. Influence of Calcination Time. As mentioned above,the optimal temperature for the calcination process was
10 ISRN Nanomaterials
0
20
40
60
80
100
120
140
010002000300040005000
ba
Wavenumber (cm−1)
Tran
smit
tan
ce (
%)
2943
16201450
13821204
633
845 767
Figure 11: FTIR spectra of (a) MW1–3 and (b) MW1–3(950).
0
20
40
60
80
100
120
140
010002000300040005000
Series1
Wavenumber (cm−1)
Tran
smit
tan
ce (
%)
16251375
1055
974
840
796
533 492
Figure 12: FTIR spectrum of MW1–3(S950).
500◦C. However, there is another factor that may playan important role in the thermal treatment of bimetallicnanoparticles: the duration of the calcination process. Tounderstand the importance of this factor, the influence ofthree different calcination times, four, eight, and twelvehours, on the characteristics of the final product wereinvestigated. The bimetallic oxide samples that underwentthe different calcination times are labeled MW1–3(8) andMW1–3(12), referring to calcination for eight and twelvehours, respectively. In addition, the MW1–3 sample wastested, which was calcined for four hours at 500◦C.
The X-ray diffraction patterns of the nanoparticlesproduced after different thermal treatment times (Figure 15)
0
2
4
0 100 200 300 400 500 600 700 800 900 1000
Series1
−10
−8
−6
−4
−2
933.4◦C
880.5◦C870.8◦C
Temperature (◦C)
Exo
Hea
t fl
ow (μ
V)
Figure 13: Thermal analysis (DSC) of MW1–3.
showed that increased calcination time did not significantlychange the crystallinity of the produced nanobimetallicoxides. This assertion was supported by the unchangingintensities of the reflections in the oxides.
The reflection that belonged to the monometallic phasesmonoclinic MoO3 (JCPD: 80–0347) and cubic WO3 (JCPD:41–0905), which could easily be identified in the XRD pat-tern of MW1–3 (Figure 15(a)), weakened and became indis-tinct after eight hours of calcination at 500◦C (Figure 15(b)).Such reflections disappeared in the X-ray pattern ofMW1–3(12), indicating that the produced nanoparticles ofmolybdenum-tungsten were a pure bimetallic Mo0.5W0.5O3
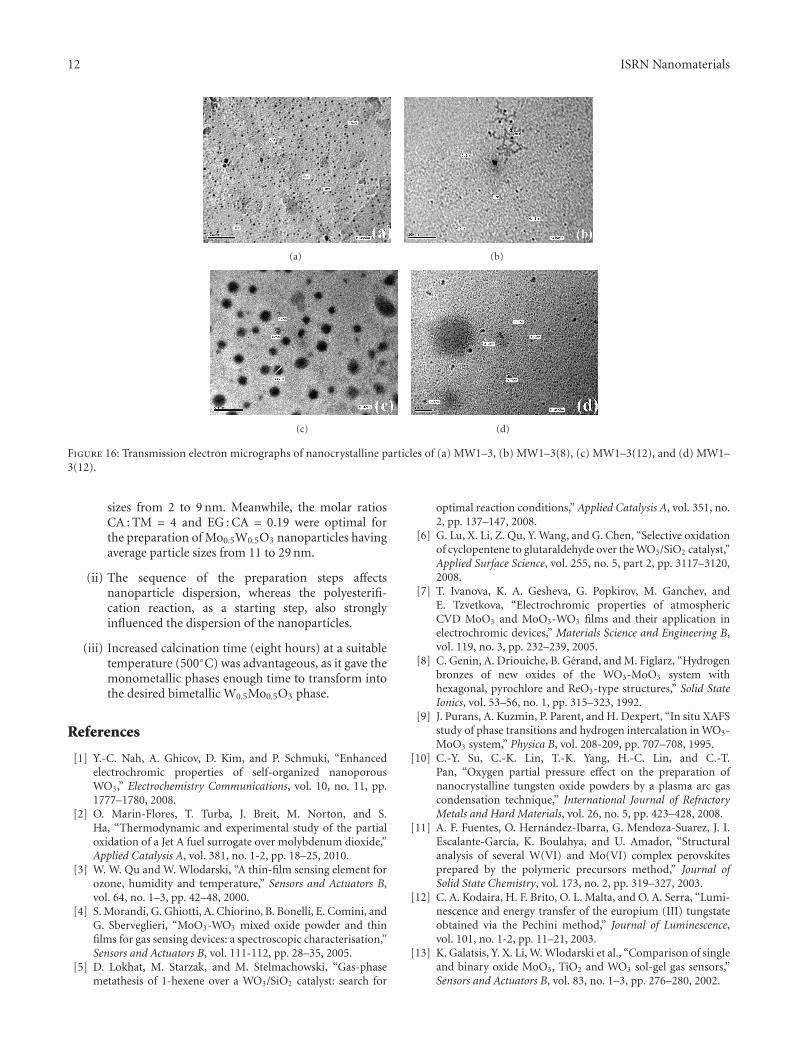
phase (JCPD: 28–0667, Figure 15(c)).The TEM image of the nanoparticles of MW1–3(8)
did not show a distinct difference in average particle size(Figure 16(b)) when compared with the TEM image of thenanoparticles of MW1–3 (Figure 16(a)). Both samples hadaverage particle sizes from 3 to 10 nm. This observationeliminated the possibility of sintering during the longcalcination time. On the contrary, increased calcination timewas advantageous, as it gave the monoclinic MoO3 andcubic WO3 phases enough time to transform into the desiredbimetallic Mo0.5W0.5O3 phase.
Upon initial inspection, the TEM image of the nanopar-ticles of the bimetallic Mo0.5W0.5O3 phase in MW1–3(12)indicated large agglomerates with average particle sizes from41 to 160 nm (Figure 16(c)). By zooming on these agglom-erates, however, the TEM image revealed nanoparticles withaverage particle sizes from 2 to 9 nm, which appearedas black spots, in addition to nonmeasurable ultrafinenanoparticles with diameters smaller than 2 nm (dark graypatches Figure 16(d)).
4. Conclusions
The Pechini method can be successfully applied for thepreparation of Mo0.5W0.5O3, and the ratios of the reactantsstrongly affected the purity of the final products.
(i) The molar ratios CA : TM = 2 and EG : CA = 1.5were the most favorable for the preparation ofMo0.5W0.5O3 nanoparticles having average particle
ISRN Nanomaterials 11
(a) (b) (c)
(d) (e)
Figure 14: Transmission electron micrographs of nanocrystalline particles of (a) MW1–3, (b) MW1–3(650), (c) MW1–3(750), (d) MW1–3(850), (e) MW1–3(950), and (e) MW1–3(950).
0
20
40
60
80
100
120
20 30 40 50 60 70 80
Rel
ativ
e in
ten
sity
2θ
(MW1–3)
(a)
0
20
40
60
80
100
120
20 30 40 50 60 70 80
Rel
ativ
e in
ten
sity
2θ
(MW1–3(4))
(b)
0
20
40
60
80
100
120
20 30 40 50 60 70 80
Rel
ativ
e in
ten
sity
2θ
(MW1–3(8))
(c)
Figure 15: XRD patterns of (a) MW1–3, (b) MW1–3(4), and (c) MW1–3(8).
12 ISRN Nanomaterials
(a) (b)
(c) (d)
Figure 16: Transmission electron micrographs of nanocrystalline particles of (a) MW1–3, (b) MW1–3(8), (c) MW1–3(12), and (d) MW1–3(12).
sizes from 2 to 9 nm. Meanwhile, the molar ratiosCA : TM = 4 and EG : CA = 0.19 were optimal forthe preparation of Mo0.5W0.5O3 nanoparticles havingaverage particle sizes from 11 to 29 nm.
(ii) The sequence of the preparation steps affectsnanoparticle dispersion, whereas the polyesterifi-cation reaction, as a starting step, also stronglyinfluenced the dispersion of the nanoparticles.
(iii) Increased calcination time (eight hours) at a suitabletemperature (500◦C) was advantageous, as it gave themonometallic phases enough time to transform intothe desired bimetallic W0.5Mo0.5O3 phase.
References
[1] Y.-C. Nah, A. Ghicov, D. Kim, and P. Schmuki, “Enhancedelectrochromic properties of self-organized nanoporousWO3,” Electrochemistry Communications, vol. 10, no. 11, pp.1777–1780, 2008.
[2] O. Marin-Flores, T. Turba, J. Breit, M. Norton, and S.Ha, “Thermodynamic and experimental study of the partialoxidation of a Jet A fuel surrogate over molybdenum dioxide,”Applied Catalysis A, vol. 381, no. 1-2, pp. 18–25, 2010.
[3] W. W. Qu and W. Wlodarski, “A thin-film sensing element forozone, humidity and temperature,” Sensors and Actuators B,vol. 64, no. 1–3, pp. 42–48, 2000.
[4] S. Morandi, G. Ghiotti, A. Chiorino, B. Bonelli, E. Comini, andG. Sberveglieri, “MoO3-WO3 mixed oxide powder and thinfilms for gas sensing devices: a spectroscopic characterisation,”Sensors and Actuators B, vol. 111-112, pp. 28–35, 2005.
[5] D. Lokhat, M. Starzak, and M. Stelmachowski, “Gas-phasemetathesis of 1-hexene over a WO3/SiO2 catalyst: search for
optimal reaction conditions,” Applied Catalysis A, vol. 351, no.2, pp. 137–147, 2008.
[6] G. Lu, X. Li, Z. Qu, Y. Wang, and G. Chen, “Selective oxidationof cyclopentene to glutaraldehyde over the WO3/SiO2 catalyst,”Applied Surface Science, vol. 255, no. 5, part 2, pp. 3117–3120,2008.
[7] T. Ivanova, K. A. Gesheva, G. Popkirov, M. Ganchev, andE. Tzvetkova, “Electrochromic properties of atmosphericCVD MoO3 and MoO3-WO3 films and their application inelectrochromic devices,” Materials Science and Engineering B,vol. 119, no. 3, pp. 232–239, 2005.
[8] C. Genin, A. Driouiche, B. Gerand, and M. Figlarz, “Hydrogenbronzes of new oxides of the WO3-MoO3 system withhexagonal, pyrochlore and ReO3-type structures,” Solid StateIonics, vol. 53–56, no. 1, pp. 315–323, 1992.
[9] J. Purans, A. Kuzmin, P. Parent, and H. Dexpert, “In situ XAFSstudy of phase transitions and hydrogen intercalation in WO3-MoO3 system,” Physica B, vol. 208-209, pp. 707–708, 1995.
[10] C.-Y. Su, C.-K. Lin, T.-K. Yang, H.-C. Lin, and C.-T.Pan, “Oxygen partial pressure effect on the preparation ofnanocrystalline tungsten oxide powders by a plasma arc gascondensation technique,” International Journal of RefractoryMetals and Hard Materials, vol. 26, no. 5, pp. 423–428, 2008.
[11] A. F. Fuentes, O. Hernandez-Ibarra, G. Mendoza-Suarez, J. I.Escalante-Garcıa, K. Boulahya, and U. Amador, “Structuralanalysis of several W(VI) and Mo(VI) complex perovskitesprepared by the polymeric precursors method,” Journal ofSolid State Chemistry, vol. 173, no. 2, pp. 319–327, 2003.
[12] C. A. Kodaira, H. F. Brito, O. L. Malta, and O. A. Serra, “Lumi-nescence and energy transfer of the europium (III) tungstateobtained via the Pechini method,” Journal of Luminescence,vol. 101, no. 1-2, pp. 11–21, 2003.
[13] K. Galatsis, Y. X. Li, W. Wlodarski et al., “Comparison of singleand binary oxide MoO3, TiO2 and WO3 sol-gel gas sensors,”Sensors and Actuators B, vol. 83, no. 1–3, pp. 276–280, 2002.
ISRN Nanomaterials 13
[14] C. Malagu, M. C. Carotta, S. Morandi et al., “Surface barriermodulation and diffuse reflectance spectroscopy of MoO3-WO3 thick films,” Sensors and Actuators B, vol. 118, no. 1-2,pp. 94–97, 2006.
[15] W. Zhu, H. Li, X. He, Q. Zhang, H. Shu, and Y. Yan, “Synthesisof adipic acid catalyzed by surfactant-type peroxotungstatesand peroxomolybdates,” Catalysis Communications, vol. 9, no.4, pp. 551–555, 2008.
[16] A. Sarkar, S. Pramanik, A. Achariya, and P. Pramanik, “A novelsol-gel synthesis of mesoporous ZrO2-MoO3/WO3 mixedoxides,” Microporous and Mesoporous Materials, vol. 115, no.3, pp. 426–431, 2008.
[17] V. P. Tolstoy, I. V. Chernyshova, and V. A. Skryshevsky,Handbook of Infrared Spectroscopy of Ultrathin Films, JohnWiley & Sons, Hoboken, NJ, USA, 2003.
[18] J. Yu, L. Qi, B. Cheng, and X. Zhao, “Effect of calcination tem-peratures on microstructures and photocatalytic activity oftungsten trioxide hollow microspheres,” Journal of HazardousMaterials, vol. 160, no. 2-3, pp. 621–628, 2008.
[19] S. Wang, C. An, Y. Zhang, Z. Zhang, and Y. Qian, “Ethanoth-ermal reduction to MoO2 microspheres via modified Pechinimethod,” Journal of Crystal Growth, vol. 293, no. 1, pp. 209–215, 2006.
[20] H. G. El-Shobaky, M. Mokhtar, and A. S. Ahmed, “Effectof MgO-doping on solid-solid interactions in MoO3/Al2O3
system,” Thermochimica Acta, vol. 327, no. 1-2, pp. 39–46,1999.
[21] W. M. Shaheen, “Thermal solid-solid interaction and catalyticproperties of CuO/Al2O3 system treated with ZnO andMoO3,” Thermochimica Acta, vol. 385, no. 1-2, pp. 105–116,2002.
Related Documents