Optimization of the Novel Bisulヲte Steeping Method by Response Surface Methodology for Natural Starch Synthesis From Oil Palm Trunk Biomass Zaber Ahmed School of Civil Engineering, University Sains Malaysia Mohd Suィan Yusoff ( suィ[email protected] ) School of Civil Engineering, Engineering Campus, Universiti Sains Malaysia, 14300 Nibong Tebal, Penang, Malaysia Nurul Hana Mokhtar Kamal School of Civil Engineering, University Sains Malaysia Hamidi Abdul Aziz Professor, School o Civil Engineering, University Sains Malaysia Research Keywords: oil palm trunk biomass, response surface methodology, Central composite design, bisulヲte steeping, Scanning electron microscopy, X-ray diffraction Posted Date: September 4th, 2020 DOI: https://doi.org/10.21203/rs.3.rs-61539/v1 License: This work is licensed under a Creative Commons Attribution 4.0 International License. Read Full License

Welcome message from author
This document is posted to help you gain knowledge. Please leave a comment to let me know what you think about it! Share it to your friends and learn new things together.
Transcript
Optimization of the Novel Bisul�te Steeping Methodby Response Surface Methodology for NaturalStarch Synthesis From Oil Palm Trunk BiomassZaber Ahmed
School of Civil Engineering, University Sains MalaysiaMohd Su�an Yusoff ( su�[email protected] )
School of Civil Engineering, Engineering Campus, Universiti Sains Malaysia, 14300 Nibong Tebal,Penang, MalaysiaNurul Hana Mokhtar Kamal
School of Civil Engineering, University Sains MalaysiaHamidi Abdul Aziz
Professor, School o Civil Engineering, University Sains Malaysia
Research
Keywords: oil palm trunk biomass, response surface methodology, Central composite design, bisul�testeeping, Scanning electron microscopy, X-ray diffraction
Posted Date: September 4th, 2020
DOI: https://doi.org/10.21203/rs.3.rs-61539/v1
License: This work is licensed under a Creative Commons Attribution 4.0 International License. Read Full License
1
Optimization of the Novel Bisulfite Steeping Method by Response
Surface Methodology for Natural Starch Synthesis from Oil Palm
Trunk Biomass
Zaber Ahmed1, *Mohd Suffian Yusoff1, Mokhtar Kamal N.H1, Hamidi Abdul Aziz
1
1 School of Civil Engineering, Engineering Campus, Universiti Sains Malaysia, 14300 Nibong Tebal, Penang, Malaysia
E-mail: [email protected]
Abstract
Malaysia is the 2nd largest in palm oil export, and after overcoming economic age (average 25 years), the
palm oil trees entail to replace usually. Therefore, a massive quantity of palm oil trunk biomass,
containing a significant amount of starch, is available as bio-waste annually. The efficient extraction of
this starch (carbohydrate polymer) would be worthwhile concerning the environment, economy,
conversion of biowaste to bioresources, and waste dumping challenges. Central composite design
executed an experimental model design, evaluated the impacts of process variables and their interaction
through response surface methodology to optimize the novel bisulfite steeping method for starch
synthesis. Design-Expert software performed the data analysis. The developed quadratic models for four
factors (Strength of Sodium bisulfite solution, steeping hour, mixing ratio with the bisulfite solution and
ultra-pure water) and one response (%Yield), demonstrated that a significant starch yield (13.54%) is
achievable utilizing 0.74% bisulfite solution, 5.6 steeping hours, for 1.6 and 0.6 mixing ratio with the
bisulfite solution and ultra-pure water respectively. Experimental outcomes were quite consistent with
the predicted model, which eventually sustains the significance of this method. Malvern Zetasizer test
revealed a bimodal granular distribution for starch, with 7.15µm of hydrodynamic size. Starch
morphology was determined by scanning electron microscopy. X-ray diffraction investigation exhibits an
A-type model, specifying persistent characteristics of extracted starch.
Keywords: oil palm trunk biomass, response surface methodology, Central composite design,
bisulfite steeping, Scanning electron microscopy, X-ray diffraction
1. Introduction
Oil palm (Elaeis guineensis Jacq.), a well-known monocotyledon perennial oilseed crop that is native
to Guinea Coast of West Africa and widely planted across 42 equatorial countries especially Malaysia
2
and Indonesia (Murai and Kondo, 2010). In 2019, Malaysia was the second among the global major palm
oil producer countries, produced 20.5 million metric tons of crude oil (Kushairi et al., 2019) with 2.13
metric tons of palm kernel oil while the ultimate plantation area of the palm oil trees was around 6.6
million hectares (Tan and Ho, 2019). Malaysia is continuing to hold its position in the world for palm oil
production as well as export, currently attributing to about 11% oil production and 27% of export trade of
the world. Besides this, the oil palm industry offers employment and livelihoods to a massive number of
people, which is around one million. In tandem with increasing palm oil production because of its unique
application as well as incredible requirement, the corresponding increase of generated residues also
inevitably happening, which will reach up to 110 million tons by 2020, almost 86% out of the total
national annual biomass production (Dalton, Mohamed and Chikere, 2017). If not been converted to
bioresource, these huge bio-wastes will be a severe environmental burden and barrier to achieving the
sustainable development goal (SDG). Meanwhile, UN already linked directly almost 12 (twelve) goals to
solid waste management globally, among the 17 (seventeen) Sustainable Development Goals (SDGs)
(Rodić and Wilson, 2017).
After an average of 25 years of economic life span, oil palm trees require replacement essentially with
higher-yielding young palms. Although agro-wastes are commonly used for animal feed (Kumar et al.,
2017) but open burning of oil palm trunks is a common phenomenon for rapid discarding at replantation
time. Formation of heavy haze, is a well-known impact of open burning ultimately, which is
responsible for significant impact on atmospheric chemistry, global warming through increasing
carbon emission (Wei et al., 2019) and human health (Ahmed, Guo and Zhao, 2016) while
remaining oil palm bio-wastes are discarded to mulch, and replenish the land without any further usage
(Yanita and Qoirina, 2019). Decently about only 22% of palm oil trunk biomass is used in veneer
manufacturing for plywood, medium-density fibreboards (MDF), and low-quality kiln-dried lumber
(Abdullah et al., 2012) and shockingly the rest volume of biomass is causing the severe environmental
declination (Hamzah, Tokimatsu and Yoshikawa, 2019).
Numerous studies affirmed the existence of a significant quantity of starch in palm oil trunk (OPT)
biomass, which is a carbohydrate polymer of general formula (C6H10O5)n, stored inside the highly
lignified parenchymatic cells (Murai and Kondo, 2010). Amylose (AM), amylopectin (AP) are the two
3
major elements of starch, while stipulates the basic nutrition for humans as well as animals. Efficient
extraction of natural starch from oil palm biomass will ensure the reduction of huge post-harvest
processing cost (approximately RM 560 per dry tonne) (Syamsul Bahri, 2016) and further reuse in any
other purpose, i.e. as food, as a natural coagulant for leachate and wastewater treatment (Yusoff et al.,
2019), to prepare particle boards, etc. Even it is also possible to apply broadly in chemical,
pharmaceuticals or cosmetics sector, paper and corrugation industries (Wu et al., 2020) because of its
extra ordinary composition eventually, which will convert this waste to beneficial bioresources. Extracted
starch typically consists of 20–367% linear and slightly branched AM with 0.41%-0.9% protein (H’ng et
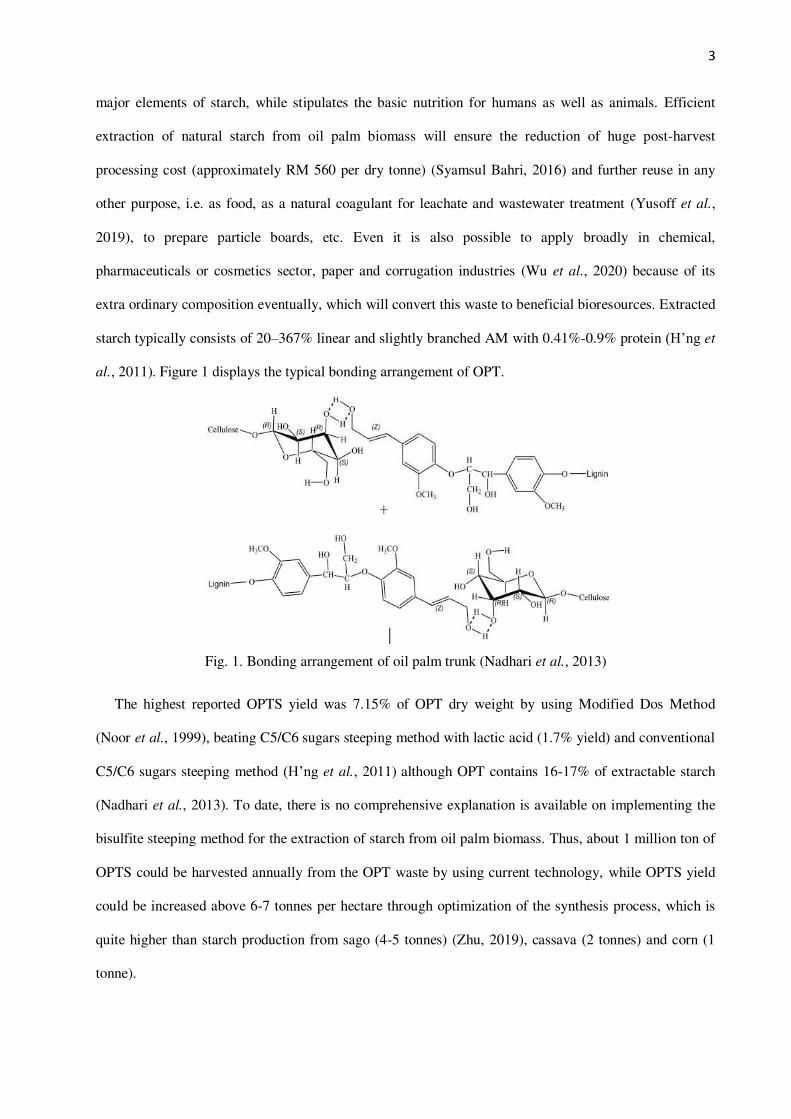
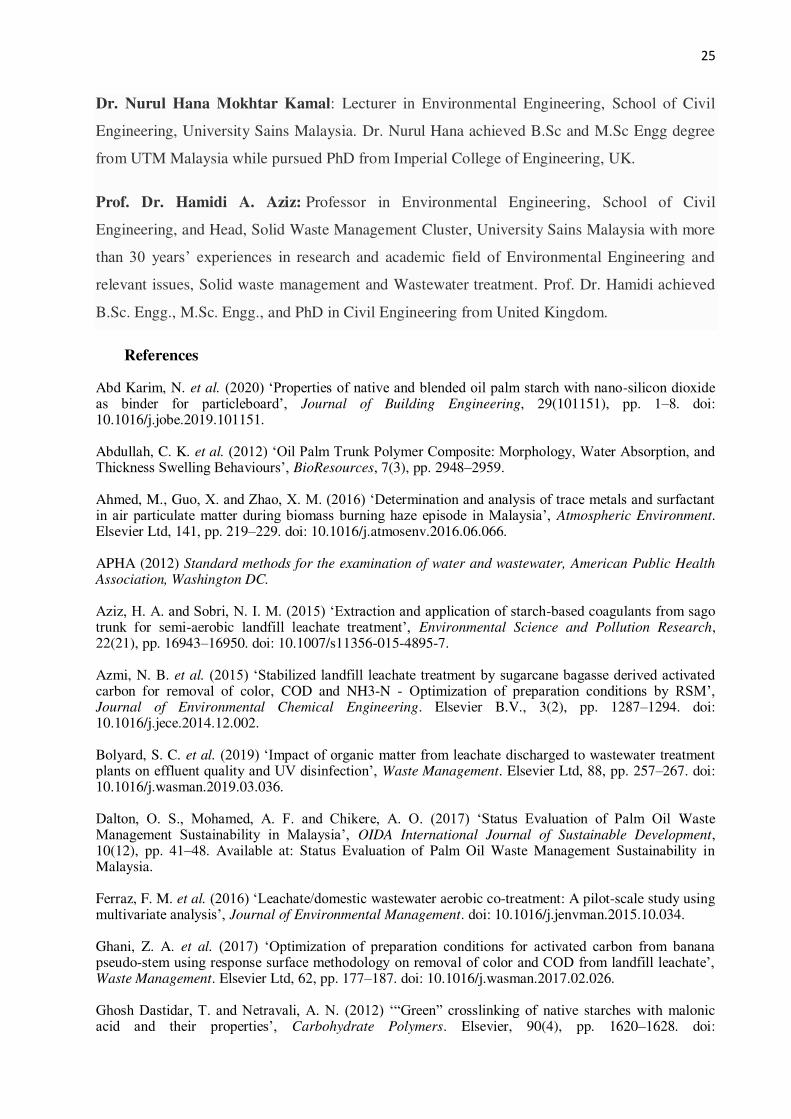
al., 2011). Figure 1 displays the typical bonding arrangement of OPT.
Fig. 1. Bonding arrangement of oil palm trunk (Nadhari et al., 2013)
The highest reported OPTS yield was 7.15% of OPT dry weight by using Modified Dos Method
(Noor et al., 1999), beating C5/C6 sugars steeping method with lactic acid (1.7% yield) and conventional
C5/C6 sugars steeping method (H’ng et al., 2011) although OPT contains 16-17% of extractable starch
(Nadhari et al., 2013). To date, there is no comprehensive explanation is available on implementing the
bisulfite steeping method for the extraction of starch from oil palm biomass. Thus, about 1 million ton of
OPTS could be harvested annually from the OPT waste by using current technology, while OPTS yield
could be increased above 6-7 tonnes per hectare through optimization of the synthesis process, which is
quite higher than starch production from sago (4-5 tonnes) (Zhu, 2019), cassava (2 tonnes) and corn (1
tonne).
4
So, the current research emphasized to investigate the convenience of the novel bisulfite steeping
method focusing the key experimental factors for optimising the synthesis of natural starch from the
discarded oil palm trunk biomass. The enhancement as well as the optimization of the extraction method
to maximize the starch synthesis, were performed applying a contemporary approach of mathematical
analysis i.e. response surface methodology (RSM). Central composite design (CCD) of Design-Expert
software (version 7.0) performed the experimental design and generated the mathematical models for
determining the optimum conditions. Analysis of variance (ANOVA) from response surface
methodology (RSM) offers the statistical outcomes with diagnostic checking, which makes it possible for
the researchers to justify the capability of the models. Therefore, the starch yield was evaluated through
this study as a sole response in terms of four experimental parameters, i.e. the strength of bisulfite
solution, steeping duration, mixing ratio with bisulfite solution as well as ultra-pure water (UPW).
2. Experimental Methodology
2.1 Collection of Oil Palm Trunk (OPT)
During the replantation period, discarded oil palm trunks (OPT) over 25 years old were obtained
between September 2019 and February 2020 for starch extraction through slicing, shredding as well as
debarking. Engineering Campus of University Sains Malaysia (USM), situated at Nibong Tebal, Pulau
Pinang State, Malaysia, was the collection spot of OPT (Fig.2), which was transported immediately to the
environmental engineering laboratory, School of Civil Engineering to preserve the samples initially at
room temperature. After debarking, the freshly chopped trunks were sliced again into stiff blocks of
around 8 cm to 12 cm size.
2.2 Reagents and Chemicals
Analytical grade chemicals and reagents, obtained based on the Standard Method in order to Analysis
of Water and Wastewater (APHA, 2012). This study applied collected reagents and chemicals throughout
the experimental phase of extracting the natural starch from palm oil trunk. AR Bendosen, PA, HmbG,
and Rashaki Venture Sdn Bhd served Sodium Bisulfite (NaHSO3) of 99.8% purity, Acetone, and 16 mm
Polypropylene Tubes, respectively as per experimental requirement. Veolia Water Solutions &
Technologies Ltd, UK produced distilled water (DW) while PURELAB Option-Q provided Ultra-pure
water (UPW) for this study. Phong Heng is the provider of the Filtration apparatus, 1000ml. (with flask,
5
funnel, filter holder, clamp), whereas Bio flow company supplied Glass fiber Filter paper (GF/A) 1.6μm,
47mm.
2.3 Extraction of Natural Starch from Palm Oil Trunk (OPT)
The current experimental study investigated the optimization of the bisulfite steeping method for
starch yield from palm oil trunk biomass as a natural polymer.
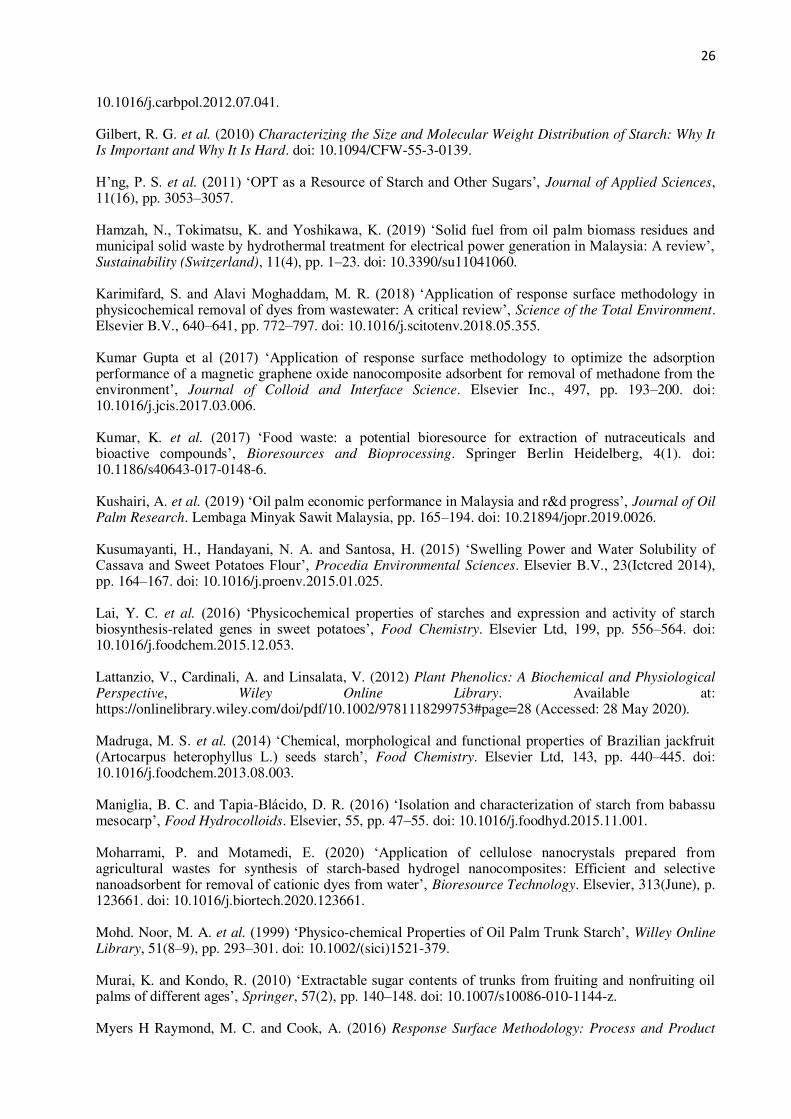
After washing throughout, 500 gm of freshly shredded and uniformly chipped (2-3 cm blocks) OPT
meal were steeped under Sodium bisulfite (BS) solution. The strength of BS solution varied from 0.2% to
1% (Madruga et al., 2014) while the variable steeping duration was 2 hrs to 10 hrs (Maniglia and Tapia-
Blácido, 2016) at a different mixing ratio of 1:1, 1:1.5 and 1:2 (with the initial weight of OPT). The
whole study followed the room temperature at original pH. The accumulation of sodium bisulfite solution
crumbles the protein/starch matrices and restrains the growth of microorganisms (Sulaiman et al., 2013).
While the steeping duration was over, the OPT meals were macerated homogenously dividing into
several batches (up to 5 mins each batch) using an industrial grinder, and the slurry was placed into a
nylon screen. After squeezing the slurry fairly, the filtrates were placed in a plastic dish. For extracting
the residual starch, the OPT remainders passed through a similar procedure. The ultimate filtrates were
screened through 212 μm sieve and allowed for 2 hrs settlement. After 2 hrs settlement, the supernatant
was removed by leaning the dish, and 2 liters of aquatic sodium bisulfite solution was blended
completely with the precipitate while allowed to settle again for 2 hrs. Discarding the floated like earlier,
the residue was mixed with ultra-pure water at a variable mixing ratio (from 1:0.3 to 1:0.7 based on the
initial weight of OPT) for washing. Later, this mixture was centrifuged at 3,500 rpm up to 10 mins
(Yusoff et al., 2019). The remaining starch precipitates were filtered after centrifugation through vacuum
filtration attired with a 1.6 μm opening size fiberglass filter for rinsing and refining the yielded starch.
100 mL of acetone was applied for further washing and removing water from the refined starch sediment.
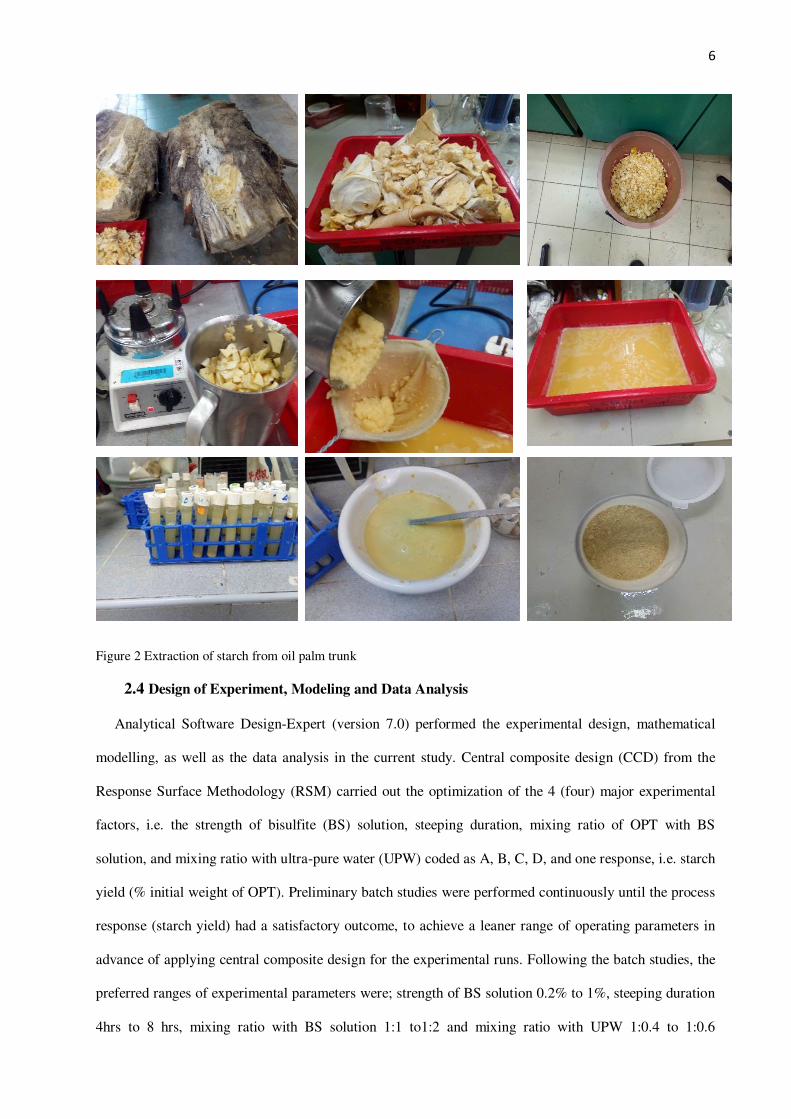
Finally, the washed starch was sun-dried for 24 hrs and crushed lightly to get fine powder-like starch
(Fig. 2). After passing through a 70-mesh sieve the weight of ground starch was measured to calculate
the ultimate yield (%) with respect to the initial weight of trunk biomass and stored in air-tight containers
until use.
6
Figure 2 Extraction of starch from oil palm trunk
2.4 Design of Experiment, Modeling and Data Analysis
Analytical Software Design-Expert (version 7.0) performed the experimental design, mathematical
modelling, as well as the data analysis in the current study. Central composite design (CCD) from the
Response Surface Methodology (RSM) carried out the optimization of the 4 (four) major experimental
factors, i.e. the strength of bisulfite (BS) solution, steeping duration, mixing ratio of OPT with BS
solution, and mixing ratio with ultra-pure water (UPW) coded as A, B, C, D, and one response, i.e. starch
yield (% initial weight of OPT). Preliminary batch studies were performed continuously until the process
response (starch yield) had a satisfactory outcome, to achieve a leaner range of operating parameters in
advance of applying central composite design for the experimental runs. Following the batch studies, the
preferred ranges of experimental parameters were; strength of BS solution 0.2% to 1%, steeping duration
4hrs to 8 hrs, mixing ratio with BS solution 1:1 to1:2 and mixing ratio with UPW 1:0.4 to 1:0.6
7
accordingly for optimising the starch yield. Table 2 displays the central composite design (CCD) for the
operating parameters in terms of their primary unit and terms of 2k factorial design considering nF
factorial runs (ensuring possible combinations for the operating parameters with maximum and minimum
values), along with the achieved results during every experiment. The values of experimental parameters
altered within three levels, between −1, 0, and +1 (Table 1).
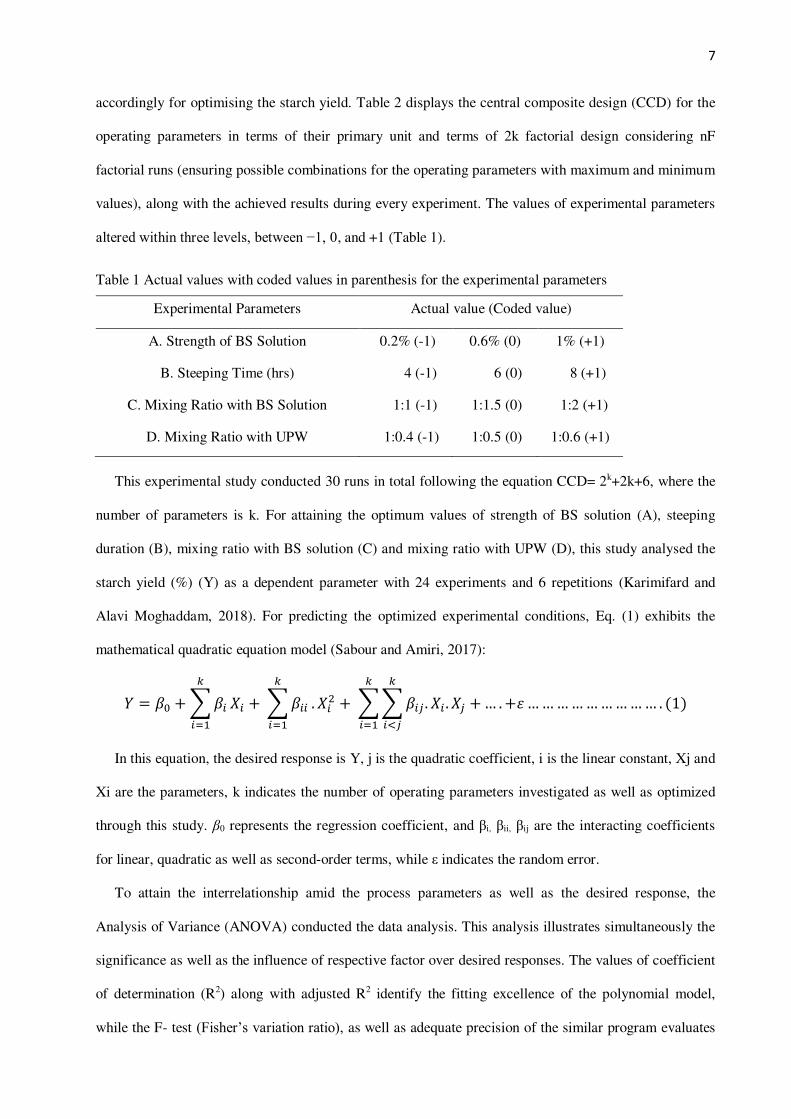
Table 1 Actual values with coded values in parenthesis for the experimental parameters
Experimental Parameters Actual value (Coded value)
A. Strength of BS Solution 0.2% (-1) 0.6% (0) 1% (+1)
B. Steeping Time (hrs) 4 (-1) 6 (0) 8 (+1)
C. Mixing Ratio with BS Solution 1:1 (-1) 1:1.5 (0) 1:2 (+1)
D. Mixing Ratio with UPW 1:0.4 (-1) 1:0.5 (0) 1:0.6 (+1)
This experimental study conducted 30 runs in total following the equation CCD= 2k+2k+6, where the
number of parameters is k. For attaining the optimum values of strength of BS solution (A), steeping
duration (B), mixing ratio with BS solution (C) and mixing ratio with UPW (D), this study analysed the
starch yield (%) (Y) as a dependent parameter with 24 experiments and 6 repetitions (Karimifard and
Alavi Moghaddam, 2018). For predicting the optimized experimental conditions, Eq. (1) exhibits the
mathematical quadratic equation model (Sabour and Amiri, 2017):
𝑌 = 𝛽0 + ∑ 𝛽𝑖𝑘𝑖=1 𝑋𝑖 + ∑ 𝛽𝑖𝑖𝑘
𝑖=1 . 𝑋𝑖2 + ∑ ∑ 𝛽𝑖𝑗 . 𝑋𝑖 . 𝑋𝑗 +𝑘𝑖<𝑗
𝑘𝑖=1 … . +𝜀 … … … … … … … … … . (1)
In this equation, the desired response is Y, j is the quadratic coefficient, i is the linear constant, Xj and
Xi are the parameters, k indicates the number of operating parameters investigated as well as optimized
through this study. β0 represents the regression coefficient, and βi, βii, βij are the interacting coefficients
for linear, quadratic as well as second-order terms, while ε indicates the random error.
To attain the interrelationship amid the process parameters as well as the desired response, the
Analysis of Variance (ANOVA) conducted the data analysis. This analysis illustrates simultaneously the
significance as well as the influence of respective factor over desired responses. The values of coefficient
of determination (R2) along with adjusted R2 identify the fitting excellence of the polynomial model,
while the F- test (Fisher’s variation ratio), as well as adequate precision of the similar program evaluates
8
the statistical significance of linear and quadratic terms. Predicted R2 illustrates the prediction capability
of the suggested model through PRESS (predicted residual error sum of squares). P-value (probability)
associated with a confidence level of 95% evaluated the model parameters and their interactions. Design-
Expert Software provided finally three-dimensional (3D) response surface and its corresponding contour
plots.
2.5 Physical Characteristics of Oil Palm Trunk Starch (OPTS)
2.5.1 pH and Moisture Content of OPTS
About 1.5 gm of starch was mixed up with 25 ml of purified water in an extraction bottle (50 ml), for
determining the pH according to the previous study (Abd Karim et al., 2020). After proper mixing with a
portable shaker for 3 mins, the mixture became stable within 15 min before pH measurement.
For achieving the moisture content (%) of oil palm extracted starch, 2 gm of the sample was
positioned within a natural convection oven with 105°C temperature for 24 hrs. After optimum drying in
the oven, the starch sample was set in a desiccator for about 15 min to cool down before measuring the
moisture content from weight loss. From the initial weight (W1) of starch before drying and oven-dried
weight (W2), moisture content was calculated.
2.5.2 Particle size and Polydispersity analysis
After properly dispersing the oil palm trunk starch sample, Malvern Zetasizer version 6.01 attired with
Scirocco dry powder feeding device, analysed the particle size distribution, as well as polydispersity
index (PDI), which expresses the broadness of molecular weight distribution. Particle size measurement
was expressed in terms of the micrometer (μm), while PDI is a numerical value only.
2.5.3 Analysis of Surface Morphology
The surface morphological structure and elemental analysis with composite homogeneity of oil palm
trunk starch were investigated applying digital electron microscopic analysis (SEM) as well as energy-
dispersive X-ray spectroscopy (EDX) using ophthalmic microscope FEI-Quanta 450 FEG. The
dispersion of starch was put on the aluminum heel, coated with a lean layer (30 angstroms) of gold
(sputtering) through the Polaron SC515 SEM coating system and then fixed on a sample table utilising
conductive carbon glue. The analysis was conducted under standard conditions within an expediting
voltage of 20 kV.
9
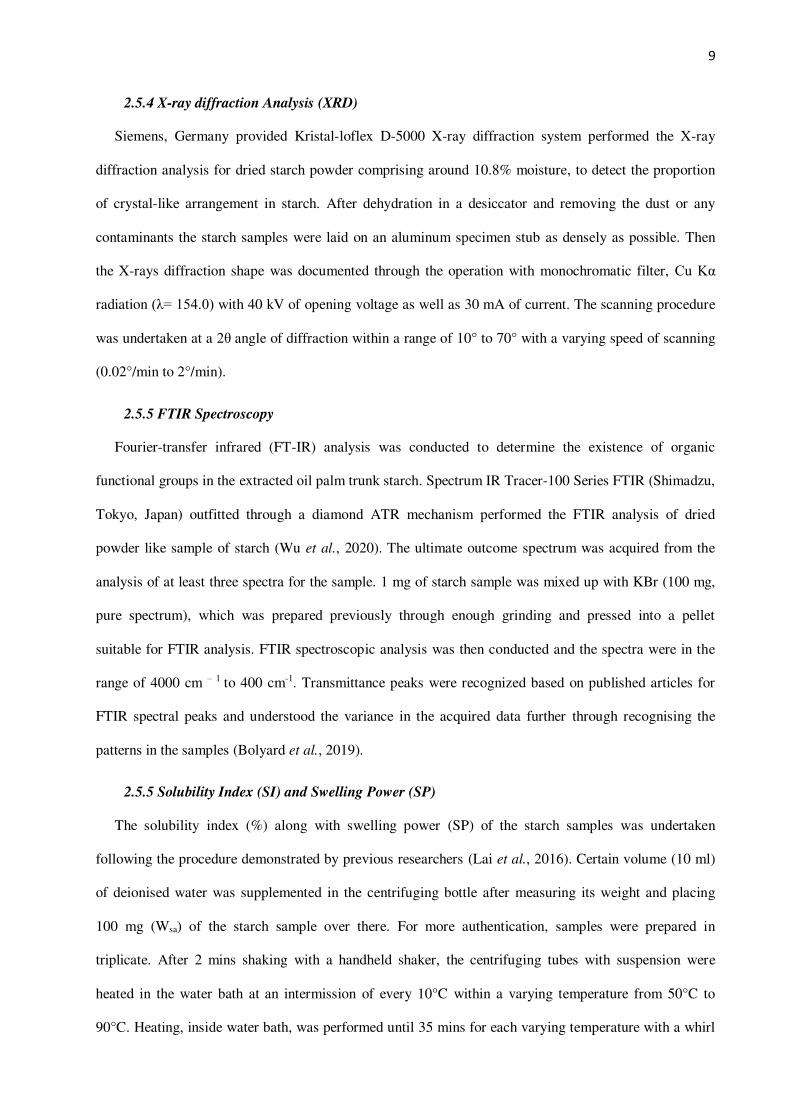
2.5.4 X-ray diffraction Analysis (XRD)
Siemens, Germany provided Kristal-loflex D-5000 X-ray diffraction system performed the X-ray
diffraction analysis for dried starch powder comprising around 10.8% moisture, to detect the proportion
of crystal-like arrangement in starch. After dehydration in a desiccator and removing the dust or any
contaminants the starch samples were laid on an aluminum specimen stub as densely as possible. Then
the X-rays diffraction shape was documented through the operation with monochromatic filter, Cu Kα
radiation (λ= 154.0) with 40 kV of opening voltage as well as 30 mA of current. The scanning procedure
was undertaken at a 2θ angle of diffraction within a range of 10° to 70° with a varying speed of scanning
(0.02°/min to 2°/min).
2.5.5 FTIR Spectroscopy
Fourier-transfer infrared (FT-IR) analysis was conducted to determine the existence of organic
functional groups in the extracted oil palm trunk starch. Spectrum IR Tracer-100 Series FTIR (Shimadzu,
Tokyo, Japan) outfitted through a diamond ATR mechanism performed the FTIR analysis of dried
powder like sample of starch (Wu et al., 2020). The ultimate outcome spectrum was acquired from the
analysis of at least three spectra for the sample. 1 mg of starch sample was mixed up with KBr (100 mg,
pure spectrum), which was prepared previously through enough grinding and pressed into a pellet
suitable for FTIR analysis. FTIR spectroscopic analysis was then conducted and the spectra were in the
range of 4000 cm – 1 to 400 cm-1. Transmittance peaks were recognized based on published articles for
FTIR spectral peaks and understood the variance in the acquired data further through recognising the
patterns in the samples (Bolyard et al., 2019).
2.5.5 Solubility Index (SI) and Swelling Power (SP)
The solubility index (%) along with swelling power (SP) of the starch samples was undertaken
following the procedure demonstrated by previous researchers (Lai et al., 2016). Certain volume (10 ml)
of deionised water was supplemented in the centrifuging bottle after measuring its weight and placing
100 mg (Wsa) of the starch sample over there. For more authentication, samples were prepared in
triplicate. After 2 mins shaking with a handheld shaker, the centrifuging tubes with suspension were
heated in the water bath at an intermission of every 10°C within a varying temperature from 50°C to
90°C. Heating, inside water bath, was performed until 35 mins for each varying temperature with a whirl
10
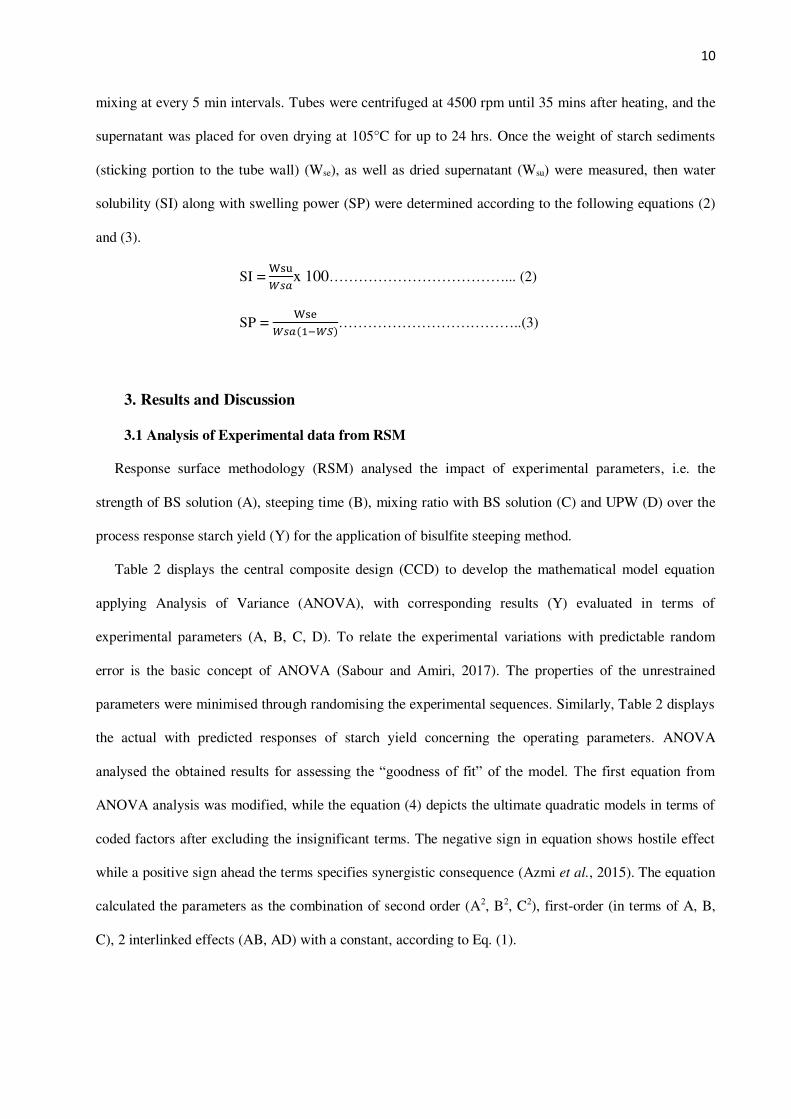
mixing at every 5 min intervals. Tubes were centrifuged at 4500 rpm until 35 mins after heating, and the
supernatant was placed for oven drying at 105°C for up to 24 hrs. Once the weight of starch sediments
(sticking portion to the tube wall) (Wse), as well as dried supernatant (Wsu) were measured, then water
solubility (SI) along with swelling power (SP) were determined according to the following equations (2)
and (3).
SI = Wsu𝑊𝑠𝑎x 100………………………………... (2)
SP = Wse𝑊𝑠𝑎(1−𝑊𝑆)………………………………..(3)
3. Results and Discussion
3.1 Analysis of Experimental data from RSM
Response surface methodology (RSM) analysed the impact of experimental parameters, i.e. the
strength of BS solution (A), steeping time (B), mixing ratio with BS solution (C) and UPW (D) over the
process response starch yield (Y) for the application of bisulfite steeping method.
Table 2 displays the central composite design (CCD) to develop the mathematical model equation
applying Analysis of Variance (ANOVA), with corresponding results (Y) evaluated in terms of
experimental parameters (A, B, C, D). To relate the experimental variations with predictable random
error is the basic concept of ANOVA (Sabour and Amiri, 2017). The properties of the unrestrained
parameters were minimised through randomising the experimental sequences. Similarly, Table 2 displays
the actual with predicted responses of starch yield concerning the operating parameters. ANOVA
analysed the obtained results for assessing the “goodness of fit” of the model. The first equation from
ANOVA analysis was modified, while the equation (4) depicts the ultimate quadratic models in terms of
coded factors after excluding the insignificant terms. The negative sign in equation shows hostile effect
while a positive sign ahead the terms specifies synergistic consequence (Azmi et al., 2015). The equation
calculated the parameters as the combination of second order (A2, B2, C2), first-order (in terms of A, B,
C), 2 interlinked effects (AB, AD) with a constant, according to Eq. (1).
11
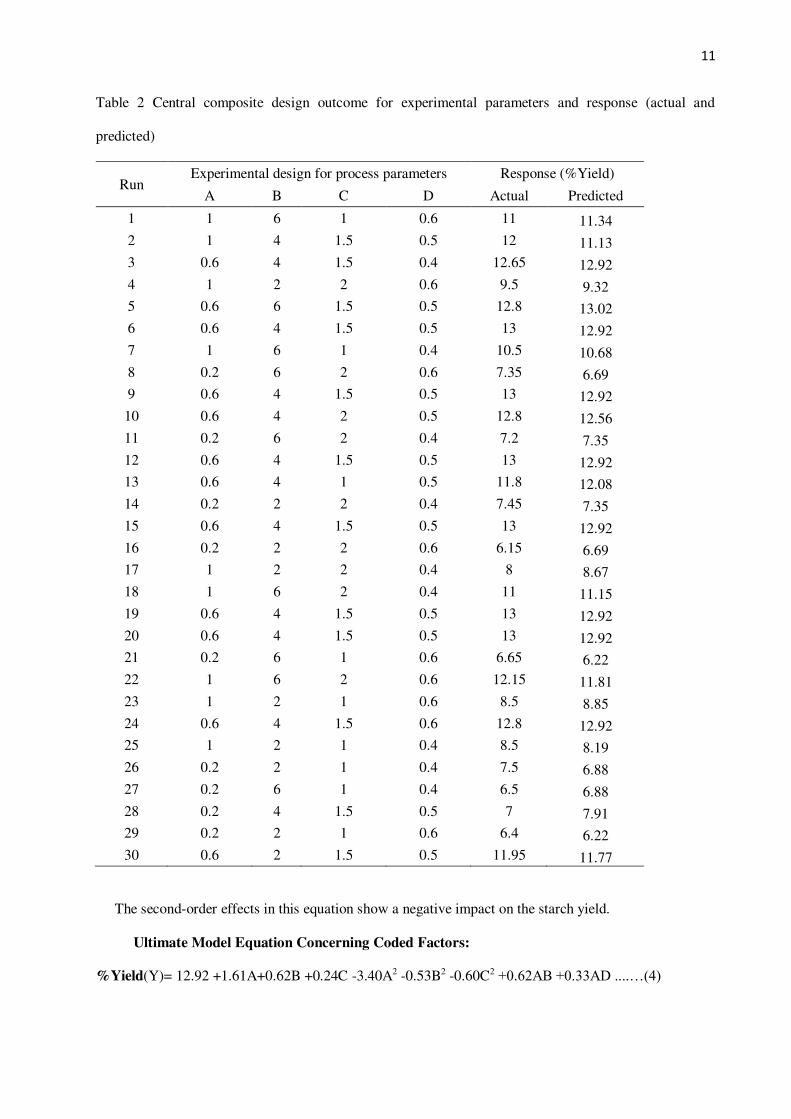
Table 2 Central composite design outcome for experimental parameters and response (actual and
predicted)
Run Experimental design for process parameters Response (%Yield)
A B C D Actual Predicted
1 1 6 1 0.6 11 11.34
2 1 4 1.5 0.5 12 11.13
3 0.6 4 1.5 0.4 12.65 12.92
4 1 2 2 0.6 9.5 9.32
5 0.6 6 1.5 0.5 12.8 13.02
6 0.6 4 1.5 0.5 13 12.92
7 1 6 1 0.4 10.5 10.68
8 0.2 6 2 0.6 7.35 6.69
9 0.6 4 1.5 0.5 13 12.92
10 0.6 4 2 0.5 12.8 12.56
11 0.2 6 2 0.4 7.2 7.35
12 0.6 4 1.5 0.5 13 12.92
13 0.6 4 1 0.5 11.8 12.08
14 0.2 2 2 0.4 7.45 7.35
15 0.6 4 1.5 0.5 13 12.92
16 0.2 2 2 0.6 6.15 6.69
17 1 2 2 0.4 8 8.67
18 1 6 2 0.4 11 11.15
19 0.6 4 1.5 0.5 13 12.92
20 0.6 4 1.5 0.5 13 12.92
21 0.2 6 1 0.6 6.65 6.22
22 1 6 2 0.6 12.15 11.81
23 1 2 1 0.6 8.5 8.85
24 0.6 4 1.5 0.6 12.8 12.92
25 1 2 1 0.4 8.5 8.19
26 0.2 2 1 0.4 7.5 6.88
27 0.2 6 1 0.4 6.5 6.88
28 0.2 4 1.5 0.5 7 7.91
29 0.2 2 1 0.6 6.4 6.22
30 0.6 2 1.5 0.5 11.95 11.77
The second-order effects in this equation show a negative impact on the starch yield.
Ultimate Model Equation Concerning Coded Factors:
%Yield(Y)= 12.92 +1.61A+0.62B +0.24C -3.40A2 -0.53B2 -0.60C2 +0.62AB +0.33AD ....…(4)
12
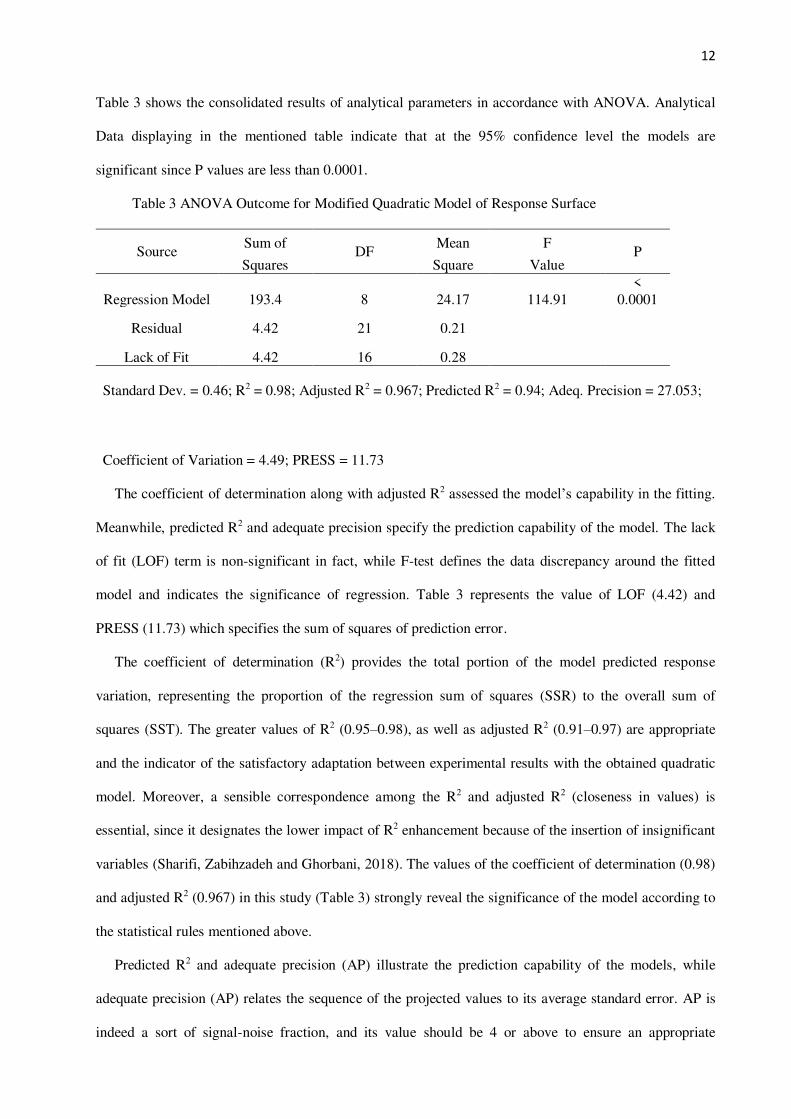
Table 3 shows the consolidated results of analytical parameters in accordance with ANOVA. Analytical
Data displaying in the mentioned table indicate that at the 95% confidence level the models are
significant since P values are less than 0.0001.
Table 3 ANOVA Outcome for Modified Quadratic Model of Response Surface
Source Sum of
DF Mean F
P Squares Square Value
Regression Model 193.4 8 24.17 114.91
<
0.0001
Residual 4.42 21 0.21
Lack of Fit 4.42 16 0.28
Standard Dev. = 0.46; R2 = 0.98; Adjusted R2 = 0.967; Predicted R2 = 0.94; Adeq. Precision = 27.053;
Coefficient of Variation = 4.49; PRESS = 11.73
The coefficient of determination along with adjusted R2 assessed the model’s capability in the fitting.
Meanwhile, predicted R2 and adequate precision specify the prediction capability of the model. The lack
of fit (LOF) term is non-significant in fact, while F-test defines the data discrepancy around the fitted
model and indicates the significance of regression. Table 3 represents the value of LOF (4.42) and
PRESS (11.73) which specifies the sum of squares of prediction error.
The coefficient of determination (R2) provides the total portion of the model predicted response
variation, representing the proportion of the regression sum of squares (SSR) to the overall sum of
squares (SST). The greater values of R2 (0.95–0.98), as well as adjusted R2 (0.91–0.97) are appropriate
and the indicator of the satisfactory adaptation between experimental results with the obtained quadratic
model. Moreover, a sensible correspondence among the R2 and adjusted R2 (closeness in values) is
essential, since it designates the lower impact of R2 enhancement because of the insertion of insignificant
variables (Sharifi, Zabihzadeh and Ghorbani, 2018). The values of the coefficient of determination (0.98)
and adjusted R2 (0.967) in this study (Table 3) strongly reveal the significance of the model according to
the statistical rules mentioned above.
Predicted R2 and adequate precision (AP) illustrate the prediction capability of the models, while
adequate precision (AP) relates the sequence of the projected values to its average standard error. AP is
indeed a sort of signal-noise fraction, and its value should be 4 or above to ensure an appropriate
13
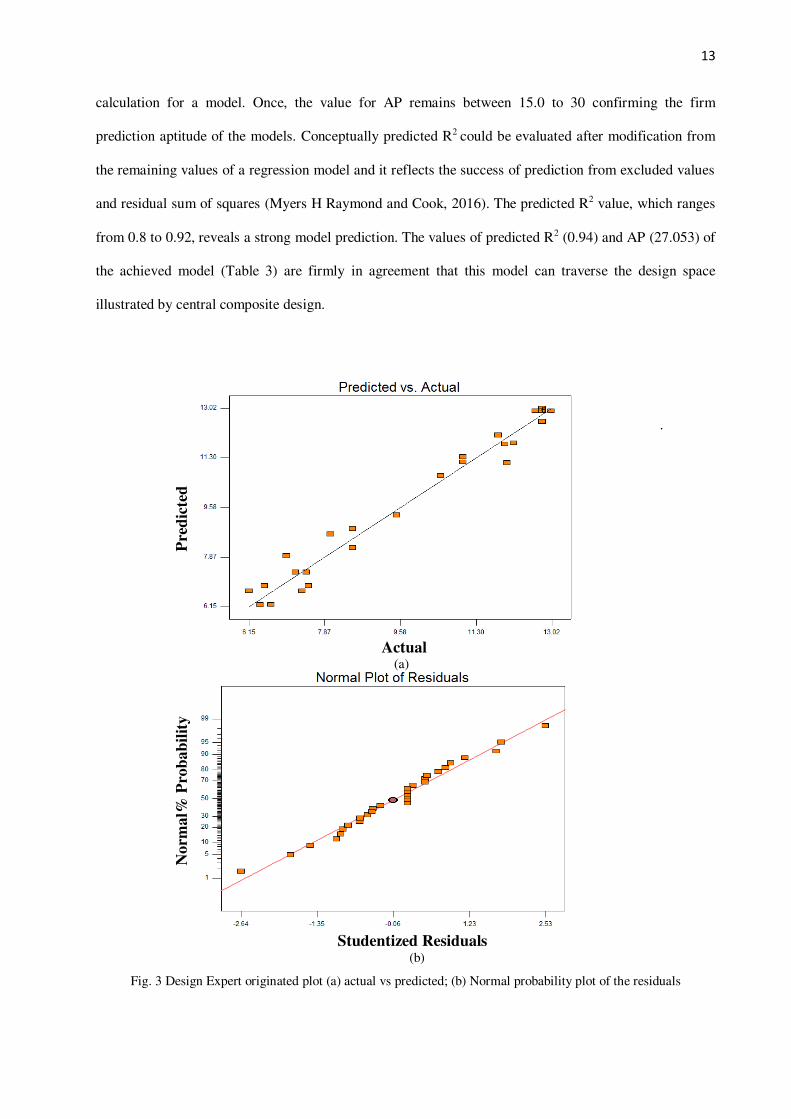
calculation for a model. Once, the value for AP remains between 15.0 to 30 confirming the firm
prediction aptitude of the models. Conceptually predicted R2 could be evaluated after modification from
the remaining values of a regression model and it reflects the success of prediction from excluded values
and residual sum of squares (Myers H Raymond and Cook, 2016). The predicted R2 value, which ranges
from 0.8 to 0.92, reveals a strong model prediction. The values of predicted R2 (0.94) and AP (27.053) of
the achieved model (Table 3) are firmly in agreement that this model can traverse the design space
illustrated by central composite design.
.
Fig. 3 Design Expert originated plot (a) actual vs predicted; (b) Normal probability plot of the residuals
Pre
dic
ted
Actual (a)
N
orm
al%
Pro
bab
ilit
y
Studentized Residuals (b)
14
The coefficient of variation (CV) is the most potent method for determining the validity of a sample,
which specifies the proportion of the expected standard error to the mean value of the practical response.
A model’s CV value no more than 10% (5.86% to 10.66% more precisely) is more consistent because the
lower CV values, the closer the predicted values are (Ghani et al., 2017). The obtained model may be
designated as reproducible concerning the value of CV (4.49), following Table 3.
ANOVA diagnostic plots showing the correlation between actual experimental values and predicted
values guide us to justify the model competence. Figure 3 displays the scattering amid the data points for
predicted against actual values of the starch yield obtained by the model, and the diagonal line presented
satisfactory agreement.
3.2 Process analysis
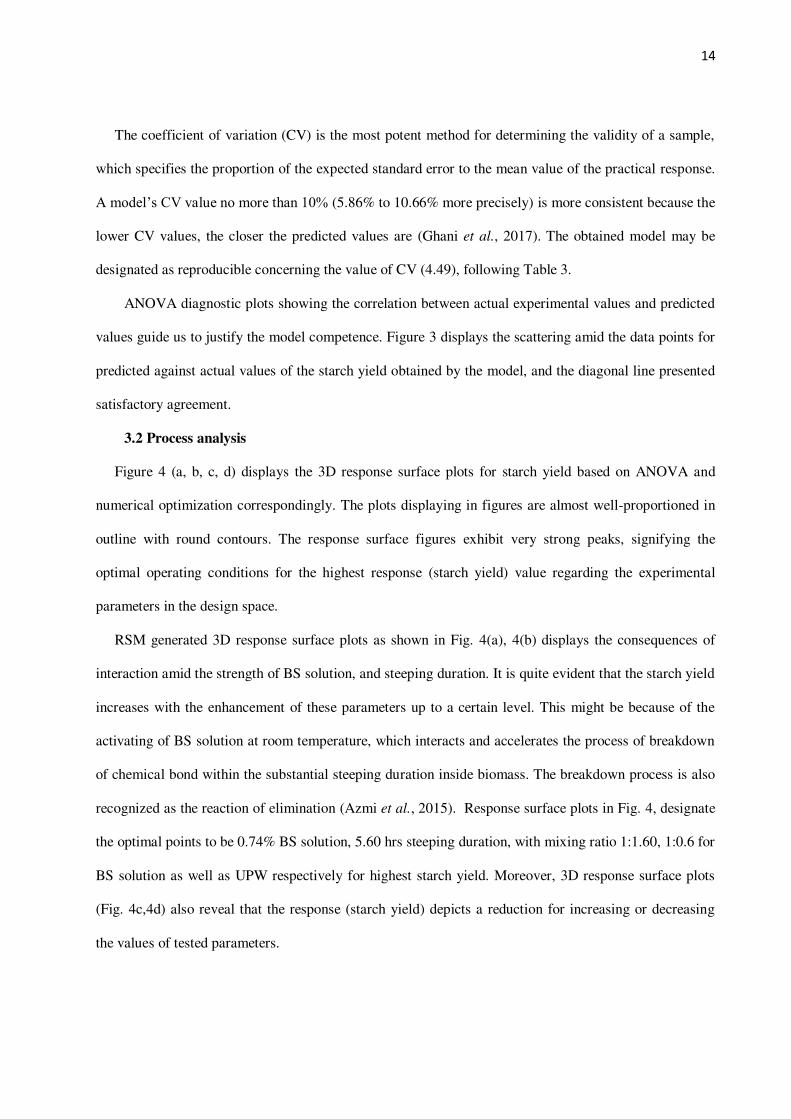
Figure 4 (a, b, c, d) displays the 3D response surface plots for starch yield based on ANOVA and
numerical optimization correspondingly. The plots displaying in figures are almost well-proportioned in
outline with round contours. The response surface figures exhibit very strong peaks, signifying the
optimal operating conditions for the highest response (starch yield) value regarding the experimental
parameters in the design space.
RSM generated 3D response surface plots as shown in Fig. 4(a), 4(b) displays the consequences of
interaction amid the strength of BS solution, and steeping duration. It is quite evident that the starch yield
increases with the enhancement of these parameters up to a certain level. This might be because of the
activating of BS solution at room temperature, which interacts and accelerates the process of breakdown
of chemical bond within the substantial steeping duration inside biomass. The breakdown process is also
recognized as the reaction of elimination (Azmi et al., 2015). Response surface plots in Fig. 4, designate
the optimal points to be 0.74% BS solution, 5.60 hrs steeping duration, with mixing ratio 1:1.60, 1:0.6 for
BS solution as well as UPW respectively for highest starch yield. Moreover, 3D response surface plots
(Fig. 4c,4d) also reveal that the response (starch yield) depicts a reduction for increasing or decreasing
the values of tested parameters.
15
(a)
(b)
(c)
(d)
Fig. 4 3D Response Surface Plot, (a) model graph from ANOVA; (b), (c), (d) numerical Optimization based on
interrelation of parameters;
Maintaining a constant value for the strength of BS solution and steeping time according to the
optimization solution, change in the values of both mixing ratios showed a decline in starch yield. In Fig.
4b the response surfaces exhibit 13.54% starch yield at the optimized condition for applying this bisulfite
steeping method which is remarkably higher than previous studies.
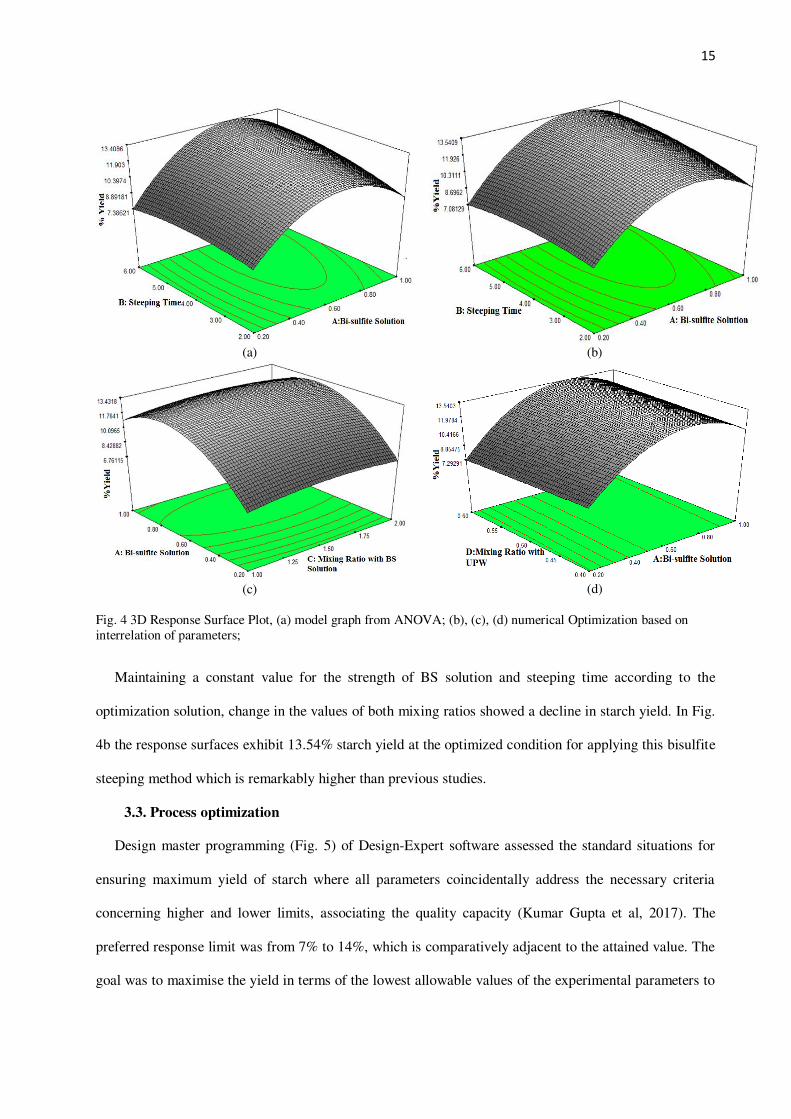
3.3. Process optimization
Design master programming (Fig. 5) of Design-Expert software assessed the standard situations for
ensuring maximum yield of starch where all parameters coincidentally address the necessary criteria
concerning higher and lower limits, associating the quality capacity (Kumar Gupta et al, 2017). The
preferred response limit was from 7% to 14%, which is comparatively adjacent to the attained value. The
goal was to maximise the yield in terms of the lowest allowable values of the experimental parameters to
16
obtain a reasonably specific optimum zone. The achieved outcomes are consistent with the operating
parameters, which lead to the ideal conditions for starch yield measurement.
Fig. 5 Desirability ramp for numerical optimization for four parameters and one response
The highest starch yield observed with this condition was 13.54%, with desirability function 0.934,
and these conditions were reviewed at room temperature under the corresponding setting up. To verify
the proposed optimum condition, three additional experiments were performed following the same values
of the testing parameters to authorise the predicted agreement of the models. Based on the outcomes of
the verification study, the average starch yield extracted 13.54+0.4+0.3%, which is quite a satisfactory
agreement from the regression model, with a comparatively lower error of 2.95%.
However, the outcomes of the experiments confirmed the model soundness satisfactorily, ensuring the
existence of the optimal point, and at the same time, recognise the significance of this method for
increasing the starch yield successfully.
3.4 Outcomes of Physical Characteristics of Starch
3.4.1 Starch Yield from Oil Palm Trunk
According to the central composite design (CCD) batch experimental outcomes showed that this
bisulfite steeping method could ensure maximum starch yield 13% at 0.6% BS solution, 4 hrs steeping
duration with the mixing ratio of 1:1.5, and 1:0.5 for BS solution as well as ultra-pure water respectively.
Although extracting the starch from the cells of the abrasive vascular bundles of oil palm trunk is quite
hard, rather this combination of proposed method augmented the yield remarkably higher than the yield
17
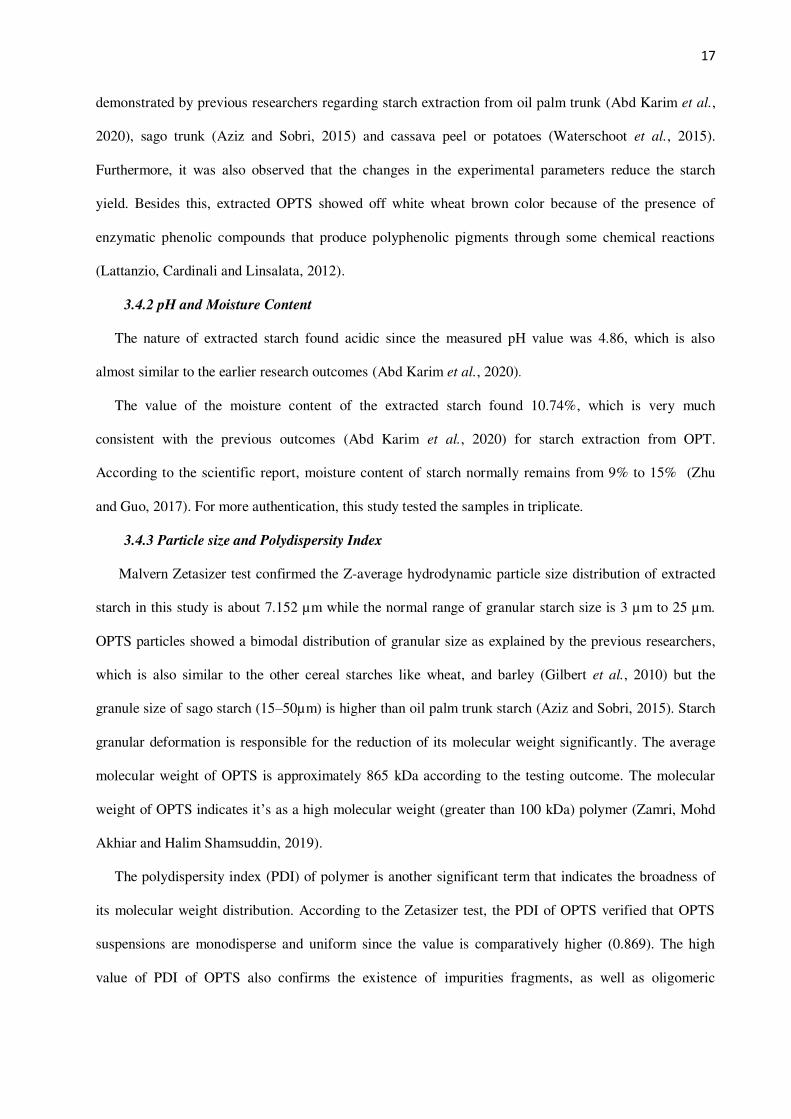
demonstrated by previous researchers regarding starch extraction from oil palm trunk (Abd Karim et al.,
2020), sago trunk (Aziz and Sobri, 2015) and cassava peel or potatoes (Waterschoot et al., 2015).
Furthermore, it was also observed that the changes in the experimental parameters reduce the starch
yield. Besides this, extracted OPTS showed off white wheat brown color because of the presence of
enzymatic phenolic compounds that produce polyphenolic pigments through some chemical reactions
(Lattanzio, Cardinali and Linsalata, 2012).
3.4.2 pH and Moisture Content
The nature of extracted starch found acidic since the measured pH value was 4.86, which is also
almost similar to the earlier research outcomes (Abd Karim et al., 2020).
The value of the moisture content of the extracted starch found 10.74%, which is very much
consistent with the previous outcomes (Abd Karim et al., 2020) for starch extraction from OPT.
According to the scientific report, moisture content of starch normally remains from 9% to 15% (Zhu
and Guo, 2017). For more authentication, this study tested the samples in triplicate.
3.4.3 Particle size and Polydispersity Index
Malvern Zetasizer test confirmed the Z-average hydrodynamic particle size distribution of extracted
starch in this study is about 7.152 µm while the normal range of granular starch size is 3 µm to 25 µm.
OPTS particles showed a bimodal distribution of granular size as explained by the previous researchers,
which is also similar to the other cereal starches like wheat, and barley (Gilbert et al., 2010) but the
granule size of sago starch (15–50µm) is higher than oil palm trunk starch (Aziz and Sobri, 2015). Starch
granular deformation is responsible for the reduction of its molecular weight significantly. The average
molecular weight of OPTS is approximately 865 kDa according to the testing outcome. The molecular
weight of OPTS indicates it’s as a high molecular weight (greater than 100 kDa) polymer (Zamri, Mohd
Akhiar and Halim Shamsuddin, 2019).
The polydispersity index (PDI) of polymer is another significant term that indicates the broadness of
its molecular weight distribution. According to the Zetasizer test, the PDI of OPTS verified that OPTS
suspensions are monodisperse and uniform since the value is comparatively higher (0.869). The high
value of PDI of OPTS also confirms the existence of impurities fragments, as well as oligomeric
18
assemblies in OPTS. However, IUPAC ideally considered OPTS as a uniform polymer rather than a
monodisperse polymer.
3.4.4 SEM-EDX Investigations Outcomes
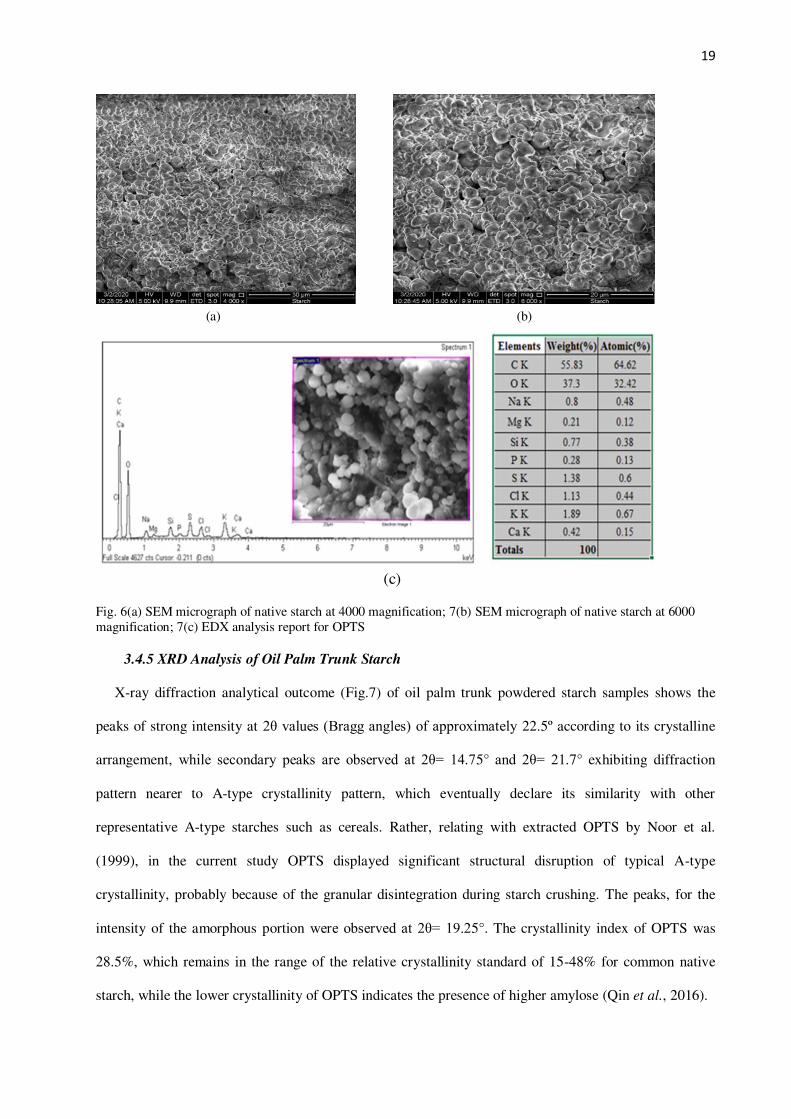
OPTS granule morphology was scrutinised using Scanning Electron Microscopy (SEM) and Fig. 6 (a,
b) shows the achieved images of oil palm trunk starch (OPTS) at 4000 and 6000 magnifications from
SEM analysis, while Fig. 6 (c) represents the EDX analysis result of oil palm trunk starch. OPTS
granules considered much greater granular sizes, i.e. 10-100 diameter µm. This phenomenon was
coherent with other OPTS granular architecture characteristics, featuring a much mature or possibly fully
mature storage starch. The micrographs show that the granular architecture of OPTS is almost like sago
palm starch, representing ovular and elliptical patterns with condensed ends. Bell-shaped granules were
also observed. This outcome was almost similar to the explanations by Hashim et al. (Nadhari et al.,
2013). Furthermore, from the apparent particle fractions, a minor fraction of OPTS particles represented
hourglass structure along with almost areolate shape including several trumpet-like swellings. On the
other hand, OPTS granule surface seemed a little bit less smooth than previous studies and marked by
more wave-like creases. Simultaneously SEM outcomes unveiled the presence of radial pattern surface
openings as well as some grooves or hollows on large-sized OPTS granule, which is not available in
early researches. The conspicuous openings of 0.5-2.0 µm diameters, could be openings to channels that
stabbed over various rings of starch growing as well as the hilum, while a portion remained on the outer
layer only.
Figure 6 (c) displayed the presence of several minerals i.e. Na, K, Mg, with carbon (C) and oxygen
(O) in oil palm trunk starch according to the Energy Dispersive X-Ray Analysis (EDX) analysis. Ample
existence of oxygen has followed in OPTS due to the lavish combination of carbohydrate (Aziz and
Sobri, 2015). Furthermore, carbohydrates are broken down in form of energy through using oxygen.
19
(a)
(b)
(c)
Fig. 6(a) SEM micrograph of native starch at 4000 magnification; 7(b) SEM micrograph of native starch at 6000
magnification; 7(c) EDX analysis report for OPTS
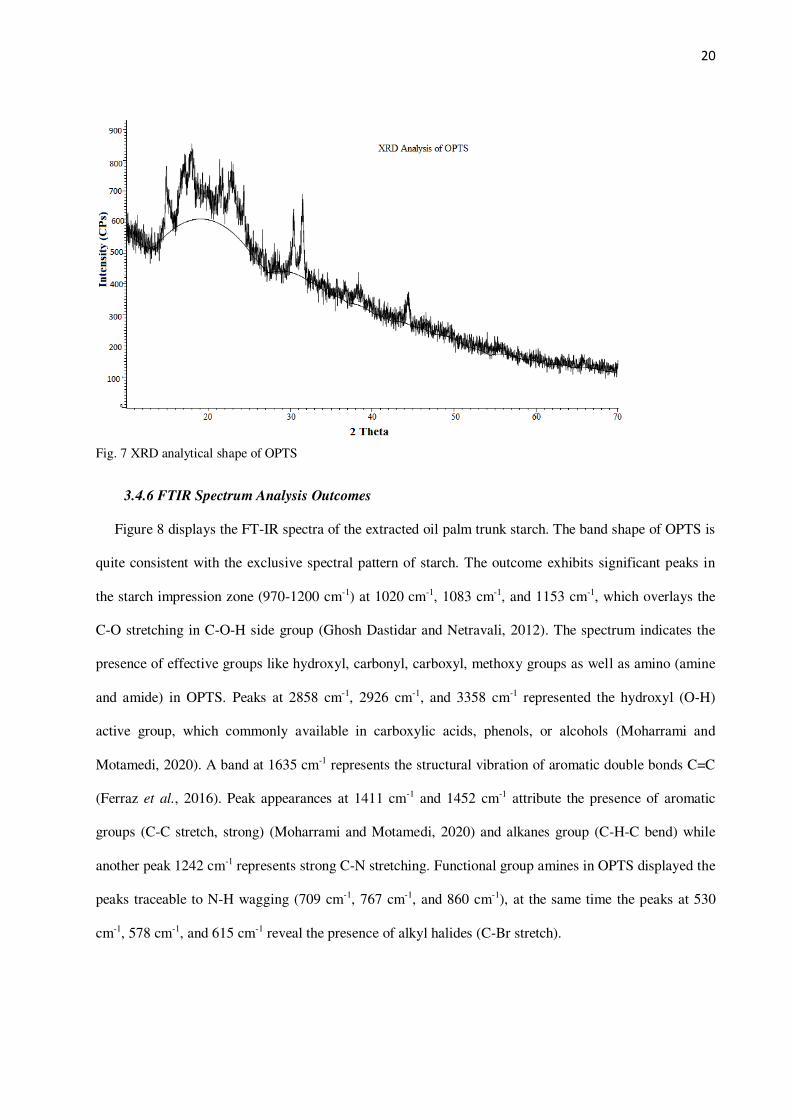
3.4.5 XRD Analysis of Oil Palm Trunk Starch
X-ray diffraction analytical outcome (Fig.7) of oil palm trunk powdered starch samples shows the
peaks of strong intensity at 2θ values (Bragg angles) of approximately 22.5º according to its crystalline
arrangement, while secondary peaks are observed at 2θ= 14.75° and 2θ= 21.7° exhibiting diffraction
pattern nearer to A-type crystallinity pattern, which eventually declare its similarity with other
representative A-type starches such as cereals. Rather, relating with extracted OPTS by Noor et al.
(1999), in the current study OPTS displayed significant structural disruption of typical A-type
crystallinity, probably because of the granular disintegration during starch crushing. The peaks, for the
intensity of the amorphous portion were observed at 2θ= 19.25°. The crystallinity index of OPTS was
28.5%, which remains in the range of the relative crystallinity standard of 15-48% for common native
starch, while the lower crystallinity of OPTS indicates the presence of higher amylose (Qin et al., 2016).
20
Fig. 7 XRD analytical shape of OPTS
3.4.6 FTIR Spectrum Analysis Outcomes
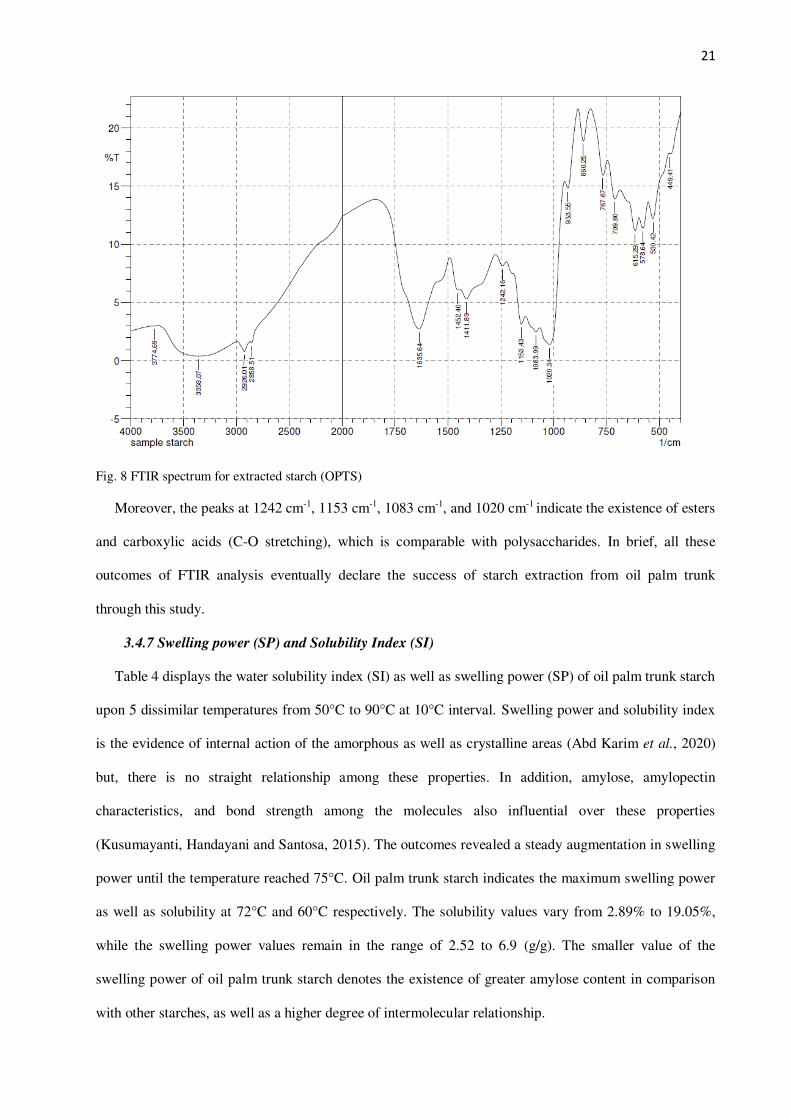
Figure 8 displays the FT-IR spectra of the extracted oil palm trunk starch. The band shape of OPTS is
quite consistent with the exclusive spectral pattern of starch. The outcome exhibits significant peaks in
the starch impression zone (970-1200 cm-1) at 1020 cm-1, 1083 cm-1, and 1153 cm-1, which overlays the
C-O stretching in C-O-H side group (Ghosh Dastidar and Netravali, 2012). The spectrum indicates the
presence of effective groups like hydroxyl, carbonyl, carboxyl, methoxy groups as well as amino (amine
and amide) in OPTS. Peaks at 2858 cm-1, 2926 cm-1, and 3358 cm-1 represented the hydroxyl (O-H)
active group, which commonly available in carboxylic acids, phenols, or alcohols (Moharrami and
Motamedi, 2020). A band at 1635 cm-1 represents the structural vibration of aromatic double bonds C=C
(Ferraz et al., 2016). Peak appearances at 1411 cm-1 and 1452 cm-1 attribute the presence of aromatic
groups (C-C stretch, strong) (Moharrami and Motamedi, 2020) and alkanes group (C-H-C bend) while
another peak 1242 cm-1 represents strong C-N stretching. Functional group amines in OPTS displayed the
peaks traceable to N-H wagging (709 cm-1, 767 cm-1, and 860 cm-1), at the same time the peaks at 530
cm-1, 578 cm-1, and 615 cm-1 reveal the presence of alkyl halides (C-Br stretch).
21
Fig. 8 FTIR spectrum for extracted starch (OPTS)
Moreover, the peaks at 1242 cm-1, 1153 cm-1, 1083 cm-1, and 1020 cm-1 indicate the existence of esters
and carboxylic acids (C-O stretching), which is comparable with polysaccharides. In brief, all these
outcomes of FTIR analysis eventually declare the success of starch extraction from oil palm trunk
through this study.
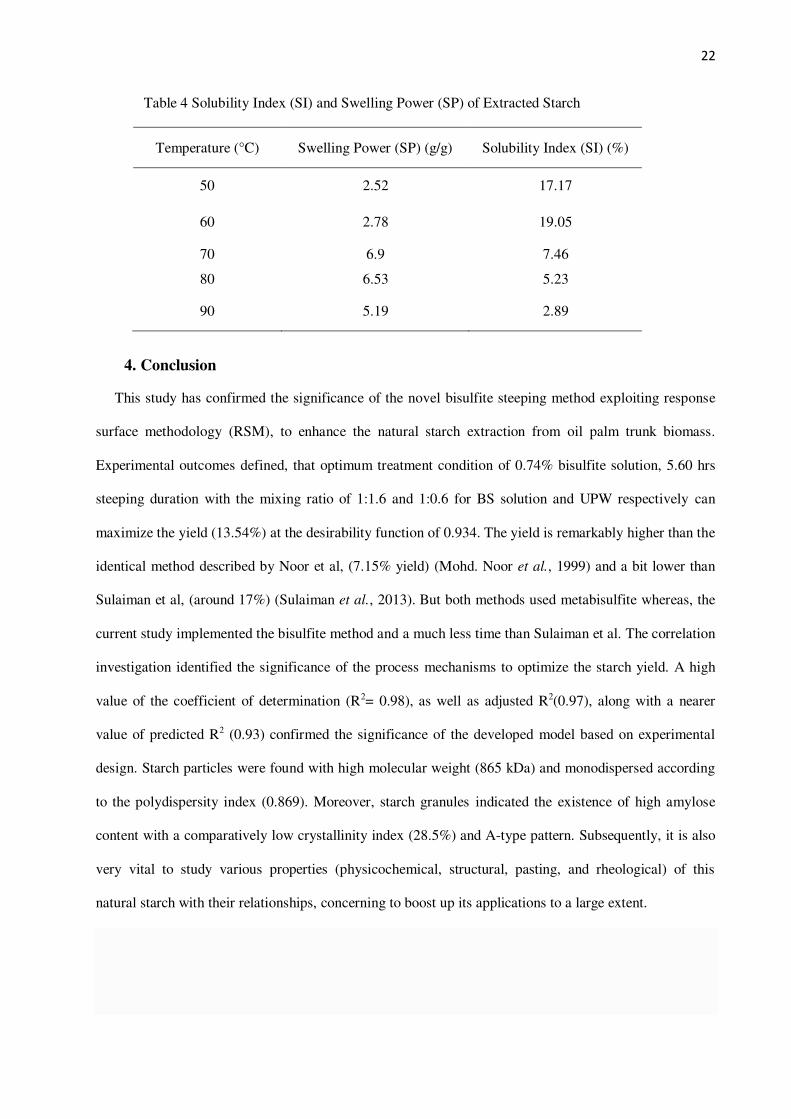
3.4.7 Swelling power (SP) and Solubility Index (SI)
Table 4 displays the water solubility index (SI) as well as swelling power (SP) of oil palm trunk starch
upon 5 dissimilar temperatures from 50°C to 90°C at 10°C interval. Swelling power and solubility index
is the evidence of internal action of the amorphous as well as crystalline areas (Abd Karim et al., 2020)
but, there is no straight relationship among these properties. In addition, amylose, amylopectin
characteristics, and bond strength among the molecules also influential over these properties
(Kusumayanti, Handayani and Santosa, 2015). The outcomes revealed a steady augmentation in swelling
power until the temperature reached 75°C. Oil palm trunk starch indicates the maximum swelling power
as well as solubility at 72°C and 60°C respectively. The solubility values vary from 2.89% to 19.05%,
while the swelling power values remain in the range of 2.52 to 6.9 (g/g). The smaller value of the
swelling power of oil palm trunk starch denotes the existence of greater amylose content in comparison
with other starches, as well as a higher degree of intermolecular relationship.
22
Table 4 Solubility Index (SI) and Swelling Power (SP) of Extracted Starch
Temperature (°C) Swelling Power (SP) (g/g) Solubility Index (SI) (%)
50 2.52 17.17
60 2.78 19.05
70 6.9 7.46
80 6.53 5.23
90 5.19 2.89
4. Conclusion
This study has confirmed the significance of the novel bisulfite steeping method exploiting response
surface methodology (RSM), to enhance the natural starch extraction from oil palm trunk biomass.
Experimental outcomes defined, that optimum treatment condition of 0.74% bisulfite solution, 5.60 hrs
steeping duration with the mixing ratio of 1:1.6 and 1:0.6 for BS solution and UPW respectively can
maximize the yield (13.54%) at the desirability function of 0.934. The yield is remarkably higher than the
identical method described by Noor et al, (7.15% yield) (Mohd. Noor et al., 1999) and a bit lower than
Sulaiman et al, (around 17%) (Sulaiman et al., 2013). But both methods used metabisulfite whereas, the
current study implemented the bisulfite method and a much less time than Sulaiman et al. The correlation
investigation identified the significance of the process mechanisms to optimize the starch yield. A high
value of the coefficient of determination (R2= 0.98), as well as adjusted R2(0.97), along with a nearer
value of predicted R2 (0.93) confirmed the significance of the developed model based on experimental
design. Starch particles were found with high molecular weight (865 kDa) and monodispersed according
to the polydispersity index (0.869). Moreover, starch granules indicated the existence of high amylose
content with a comparatively low crystallinity index (28.5%) and A-type pattern. Subsequently, it is also
very vital to study various properties (physicochemical, structural, pasting, and rheological) of this
natural starch with their relationships, concerning to boost up its applications to a large extent.
23
List of abbreviations
ANOVA- Analysis of Variance
BS- Bisulfite
CCD- Central Composite Design
FTIR- Fourier Transform Infra-Red
OPT- Oil Palm Trunk
OPTS- Oil Palm Trunk Starch
RSM- Response Surface Methodology
SDG- Sustainable Development Goal
SEM- Scanning Electron Microscopy
SP-Swelling Power
SI-Solubility Index
UPW- Ultra Pure Water
Declarations
Ethics approval and consent to participate
Not applicable
Consent for publication
Not applicable
Availability of data and materials
The datasets used and/or analysed during the current study are available from the
corresponding author on reasonable request.
Competing interests
The authors declare that they have no known competing financial interests or personal
relationships that could have appeared to influence the work reported in this paper.
24
Funding
Funding source of this study was Ministry of Higher Education, Malaysia through
“Fundamental Research Grant Scheme (FRGS)” under School of Civil Engineering, University
Sains Malaysia.
Authors' contributions
Zaber Ahmed: Conceptualization, Methodology, Writing- Original draft preparation, Software,
Validation and Analysis
Prof. Dr. Mohd. Suffian Yusoff: Reviewing and Editing, Supervision, Funding acquisition
Dr. Nurul Hana Mokhtar Kamal: Reviewing.
Prof. Dr. Hamidi A. Aziz: Reviewing and Editing
Acknowledgements
The authors would like to convey their warm gratitude to the Ministry of Higher Education,
Malaysia for financing this research study through “Fundamental Research Grant Scheme (FRGS)”
No- 203/PAWAM/6071415 and School of Civil Engineering, University Sains Malaysia.
Authors' information (optional)
Mr. Zaber Ahmed: PhD researcher under School of Civil Engineering, University Sains
Malaysia with 12 years of academic experiences. He has completed his M.Sc. Engg. Degree and
currently holding the position of Assistant Professor, Department of Civil Engineering, Model
Institute of Science and Technology, Bangladesh.
Prof. Dr. Mohd. Suffian Yusoff: Professor in Environmental Engineering, School of Civil
Engineering, and Deputy Head, Solid Waste Management Cluster, University Sains Malaysia
with about 30 years’ experience in research and academic field of Environmental Engineering
and relevant issues, Solid waste management and Wastewater treatment. Prof. Dr. Mohd.
Suffian Yusoff completed B.Sc in Agril Science from UPM, Malaysia while achieved M.Sc and
PhD degree from University Sains Malaysia (USM).
25
Dr. Nurul Hana Mokhtar Kamal: Lecturer in Environmental Engineering, School of Civil
Engineering, University Sains Malaysia. Dr. Nurul Hana achieved B.Sc and M.Sc Engg degree
from UTM Malaysia while pursued PhD from Imperial College of Engineering, UK.
Prof. Dr. Hamidi A. Aziz: Professor in Environmental Engineering, School of Civil
Engineering, and Head, Solid Waste Management Cluster, University Sains Malaysia with more
than 30 years’ experiences in research and academic field of Environmental Engineering and
relevant issues, Solid waste management and Wastewater treatment. Prof. Dr. Hamidi achieved
B.Sc. Engg., M.Sc. Engg., and PhD in Civil Engineering from United Kingdom.
References
Abd Karim, N. et al. (2020) ‘Properties of native and blended oil palm starch with nano-silicon dioxide as binder for particleboard’, Journal of Building Engineering, 29(101151), pp. 1–8. doi: 10.1016/j.jobe.2019.101151.
Abdullah, C. K. et al. (2012) ‘Oil Palm Trunk Polymer Composite: Morphology, Water Absorption, and Thickness Swelling Behaviours’, BioResources, 7(3), pp. 2948–2959.
Ahmed, M., Guo, X. and Zhao, X. M. (2016) ‘Determination and analysis of trace metals and surfactant in air particulate matter during biomass burning haze episode in Malaysia’, Atmospheric Environment. Elsevier Ltd, 141, pp. 219–229. doi: 10.1016/j.atmosenv.2016.06.066.
APHA (2012) Standard methods for the examination of water and wastewater, American Public Health Association, Washington DC.
Aziz, H. A. and Sobri, N. I. M. (2015) ‘Extraction and application of starch-based coagulants from sago trunk for semi-aerobic landfill leachate treatment’, Environmental Science and Pollution Research, 22(21), pp. 16943–16950. doi: 10.1007/s11356-015-4895-7.
Azmi, N. B. et al. (2015) ‘Stabilized landfill leachate treatment by sugarcane bagasse derived activated carbon for removal of color, COD and NH3-N - Optimization of preparation conditions by RSM’, Journal of Environmental Chemical Engineering. Elsevier B.V., 3(2), pp. 1287–1294. doi: 10.1016/j.jece.2014.12.002.
Bolyard, S. C. et al. (2019) ‘Impact of organic matter from leachate discharged to wastewater treatment plants on effluent quality and UV disinfection’, Waste Management. Elsevier Ltd, 88, pp. 257–267. doi: 10.1016/j.wasman.2019.03.036.
Dalton, O. S., Mohamed, A. F. and Chikere, A. O. (2017) ‘Status Evaluation of Palm Oil Waste Management Sustainability in Malaysia’, OIDA International Journal of Sustainable Development, 10(12), pp. 41–48. Available at: Status Evaluation of Palm Oil Waste Management Sustainability in Malaysia.
Ferraz, F. M. et al. (2016) ‘Leachate/domestic wastewater aerobic co-treatment: A pilot-scale study using multivariate analysis’, Journal of Environmental Management. doi: 10.1016/j.jenvman.2015.10.034.
Ghani, Z. A. et al. (2017) ‘Optimization of preparation conditions for activated carbon from banana pseudo-stem using response surface methodology on removal of color and COD from landfill leachate’, Waste Management. Elsevier Ltd, 62, pp. 177–187. doi: 10.1016/j.wasman.2017.02.026.
Ghosh Dastidar, T. and Netravali, A. N. (2012) ‘“Green” crosslinking of native starches with malonic acid and their properties’, Carbohydrate Polymers. Elsevier, 90(4), pp. 1620–1628. doi:
26
10.1016/j.carbpol.2012.07.041.
Gilbert, R. G. et al. (2010) Characterizing the Size and Molecular Weight Distribution of Starch: Why It Is Important and Why It Is Hard. doi: 10.1094/CFW-55-3-0139.
H’ng, P. S. et al. (2011) ‘OPT as a Resource of Starch and Other Sugars’, Journal of Applied Sciences, 11(16), pp. 3053–3057.
Hamzah, N., Tokimatsu, K. and Yoshikawa, K. (2019) ‘Solid fuel from oil palm biomass residues and municipal solid waste by hydrothermal treatment for electrical power generation in Malaysia: A review’, Sustainability (Switzerland), 11(4), pp. 1–23. doi: 10.3390/su11041060.
Karimifard, S. and Alavi Moghaddam, M. R. (2018) ‘Application of response surface methodology in physicochemical removal of dyes from wastewater: A critical review’, Science of the Total Environment. Elsevier B.V., 640–641, pp. 772–797. doi: 10.1016/j.scitotenv.2018.05.355.
Kumar Gupta et al (2017) ‘Application of response surface methodology to optimize the adsorption performance of a magnetic graphene oxide nanocomposite adsorbent for removal of methadone from the environment’, Journal of Colloid and Interface Science. Elsevier Inc., 497, pp. 193–200. doi: 10.1016/j.jcis.2017.03.006.
Kumar, K. et al. (2017) ‘Food waste: a potential bioresource for extraction of nutraceuticals and bioactive compounds’, Bioresources and Bioprocessing. Springer Berlin Heidelberg, 4(1). doi: 10.1186/s40643-017-0148-6.
Kushairi, A. et al. (2019) ‘Oil palm economic performance in Malaysia and r&d progress’, Journal of Oil Palm Research. Lembaga Minyak Sawit Malaysia, pp. 165–194. doi: 10.21894/jopr.2019.0026.
Kusumayanti, H., Handayani, N. A. and Santosa, H. (2015) ‘Swelling Power and Water Solubility of Cassava and Sweet Potatoes Flour’, Procedia Environmental Sciences. Elsevier B.V., 23(Ictcred 2014), pp. 164–167. doi: 10.1016/j.proenv.2015.01.025.
Lai, Y. C. et al. (2016) ‘Physicochemical properties of starches and expression and activity of starch biosynthesis-related genes in sweet potatoes’, Food Chemistry. Elsevier Ltd, 199, pp. 556–564. doi: 10.1016/j.foodchem.2015.12.053.
Lattanzio, V., Cardinali, A. and Linsalata, V. (2012) Plant Phenolics: A Biochemical and Physiological Perspective, Wiley Online Library. Available at: https://onlinelibrary.wiley.com/doi/pdf/10.1002/9781118299753#page=28 (Accessed: 28 May 2020).
Madruga, M. S. et al. (2014) ‘Chemical, morphological and functional properties of Brazilian jackfruit (Artocarpus heterophyllus L.) seeds starch’, Food Chemistry. Elsevier Ltd, 143, pp. 440–445. doi: 10.1016/j.foodchem.2013.08.003.
Maniglia, B. C. and Tapia-Blácido, D. R. (2016) ‘Isolation and characterization of starch from babassu mesocarp’, Food Hydrocolloids. Elsevier, 55, pp. 47–55. doi: 10.1016/j.foodhyd.2015.11.001.
Moharrami, P. and Motamedi, E. (2020) ‘Application of cellulose nanocrystals prepared from agricultural wastes for synthesis of starch-based hydrogel nanocomposites: Efficient and selective nanoadsorbent for removal of cationic dyes from water’, Bioresource Technology. Elsevier, 313(June), p. 123661. doi: 10.1016/j.biortech.2020.123661.
Mohd. Noor, M. A. et al. (1999) ‘Physico-chemical Properties of Oil Palm Trunk Starch’, Willey Online Library, 51(8–9), pp. 293–301. doi: 10.1002/(sici)1521-379.
Murai, K. and Kondo, R. (2010) ‘Extractable sugar contents of trunks from fruiting and nonfruiting oil palms of different ages’, Springer, 57(2), pp. 140–148. doi: 10.1007/s10086-010-1144-z.
Myers H Raymond, M. C. and Cook, A. (2016) Response Surface Methodology: Process and Product
27
Optimization Using Designed Experiments.
Nadhari, W. N. A. W. et al. (2013) ‘Utilization of oil palm trunk waste for manufacturing of binderless particleboard: Optimization study’, BioResources, 8(2), pp. 1675–1696. doi: 10.15376/biores.8.2.1675-1696.
Qin, Y. et al. (2016) ‘Characterization of starch nanoparticles prepared by nanoprecipitation: Influence of amylose content and starch type’, Industrial Crops and Products. Elsevier B.V., 87, pp. 182–190. doi: 10.1016/j.indcrop.2016.04.038.
Rodić, L. and Wilson, D. (2017) ‘Resolving Governance Issues to Achieve Priority Sustainable Development Goals Related to Solid Waste Management in Developing Countries’, Sustainability. MDPI AG, 9(3), p. 404. doi: 10.3390/su9030404.
Sabour, M. R. and Amiri, A. (2017) ‘Comparative study of ANN and RSM for simultaneous optimization of multiple targets in Fenton treatment of landfill leachate’, Waste Management, 65, pp. 54–62. doi: 10.1016/j.wasman.2017.03.048.
Sharifi, H., Zabihzadeh, M. and Ghorbani, M. (2018) ‘The application of response surface methodology on the synthesis of conductive polyaniline/cellulosic fiber nanocomposites’, Carbohydrate Polymers, 194(February), pp. 384–394. doi: 10.1016/j.carbpol.2018.04.083.
Sulaiman, N. S. et al. (2013) ‘Evaluation of the properties of particleboard made using oil palm starch modified with epichlorohydrin’, BioResources, 8(1), pp. 283–301. doi: 10.15376/biores.8.1.283-301.
Syamsul Bahri, D. (2016) ‘Oil Palm by Product: How to Compute Its Cost of Production’, IOSR Journal of Business and Management, 18(10), pp. 6–09. doi: 10.9790/487X-1810010609.
Tan, X. Y. and Ho, S. (2019) Oil palm planted areas to be capped at 6.5 million hectares | The Edge Markets, The Edge Market. Available at: https://www.theedgemarkets.com/article/oil-palm-planted-areas-be-capped-65-million-hectares.
Waterschoot, J. et al. (2015) ‘Production, structure, physicochemical and functional properties of maize, cassava, wheat, potato and rice starches’, Starch/Staerke, 67(1–2), pp. 14–29. doi: 10.1002/star.201300238.
Wei, C. et al. (2019) ‘Adsorption thermodynamic characteristics of Chlorella vulgaris with organic polymer adsorbent cationic starch: Effect of temperature on adsorption capacity and rate’, Bioresource Technology. Elsevier, 293(July), pp. 1–8. doi: 10.1016/j.biortech.2019.122056.
Wu, J. et al. (2020) ‘Pre-acidification greatly improved granules physicochemical properties and operational stability of Upflow anaerobic sludge Blanket (UASB) reactor treating low-strength starch wastewater’, Bioresource Technology, 302(June 2019), pp. 1–10. doi: 10.1016/j.biortech.2020.122810.
Yanita, M. and Qoirina, N. (2019) ‘The impact of replanting oil palm plantations on the farming income of the Sungai Bahar community in Muaro Jambi Regency’, Earth and Environmental Science, 012003(336), pp. 1–8. doi: 10.1088/1755-1315/336/1/012003.
Yusoff, M. S. et al. (2019) ‘Potential use of oil palm trunk starch as coagulant and coagulant aid in semi-aerobic landfill leachate treatment’, Water Quality Research Journal, 54(3), pp. 203–219. doi: 10.2166/wqrj.2019.041.
Zamri, F. M. A., Mohd Akhiar, A. and Halim Shamsuddin, A. (2019) ‘Talking Points of Green and Sustainable Palm Oil Mill System in Malaysia The effectiveness of oil palm trunk waste derived coagulant for landfill leachate treatment View project’, International Journal of Recent Technology and Engineering, 8(4), pp. 6474–6479. doi: 10.35940/ijrte.D5160.118419.
Zhu, F. (2019) ‘Recent advances in modifications and applications of sago starch’, Food Hydrocolloids, 96, pp. 412–423. doi: 10.1016/j.foodhyd.2019.05.035.

28
Zhu, Z. and Guo, W. (2017) ‘Frequency, moisture content, and temperature dependent dielectric properties of potato starch related to drying with radio-frequency/microwave energy’, Scientific Reports. Nature Publishing Group, 7(1), pp. 1–11. doi: 10.1038/s41598-017-09197-y.
Figures
Figure 1
Bonding arrangement of oil palm trunk (Nadhari et al., 2013)
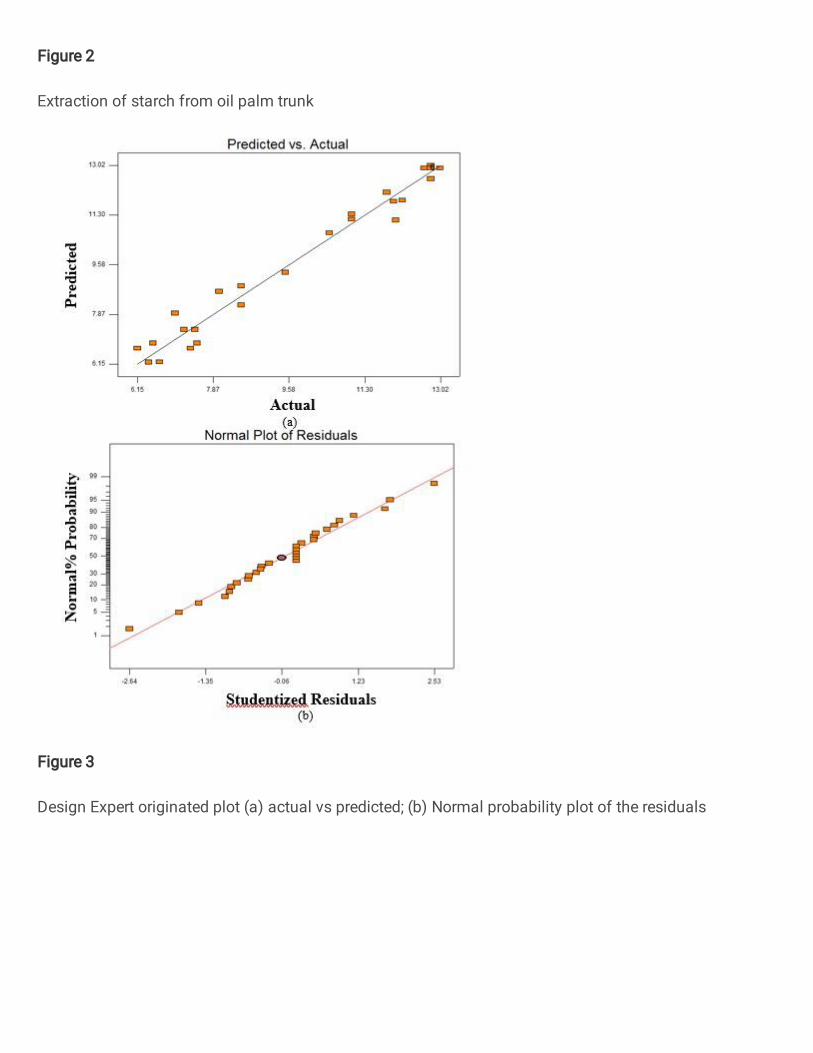
Figure 2
Extraction of starch from oil palm trunk
Figure 3
Design Expert originated plot (a) actual vs predicted; (b) Normal probability plot of the residuals
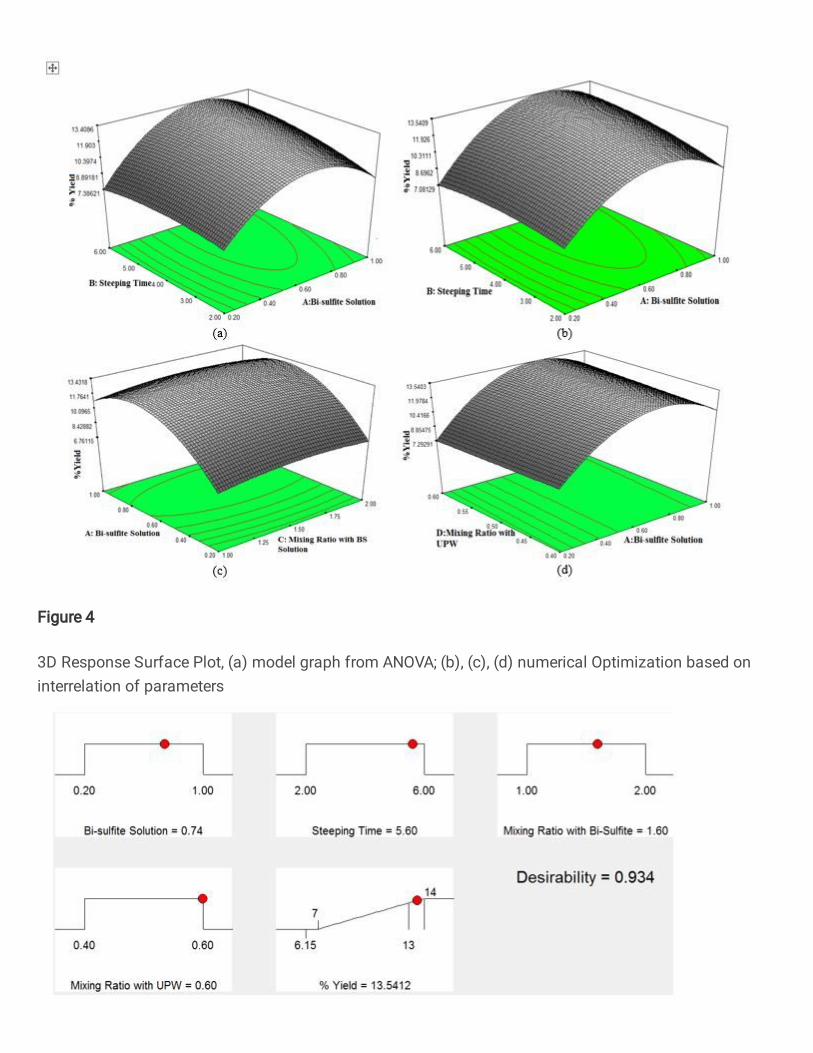
Figure 4
3D Response Surface Plot, (a) model graph from ANOVA; (b), (c), (d) numerical Optimization based oninterrelation of parameters
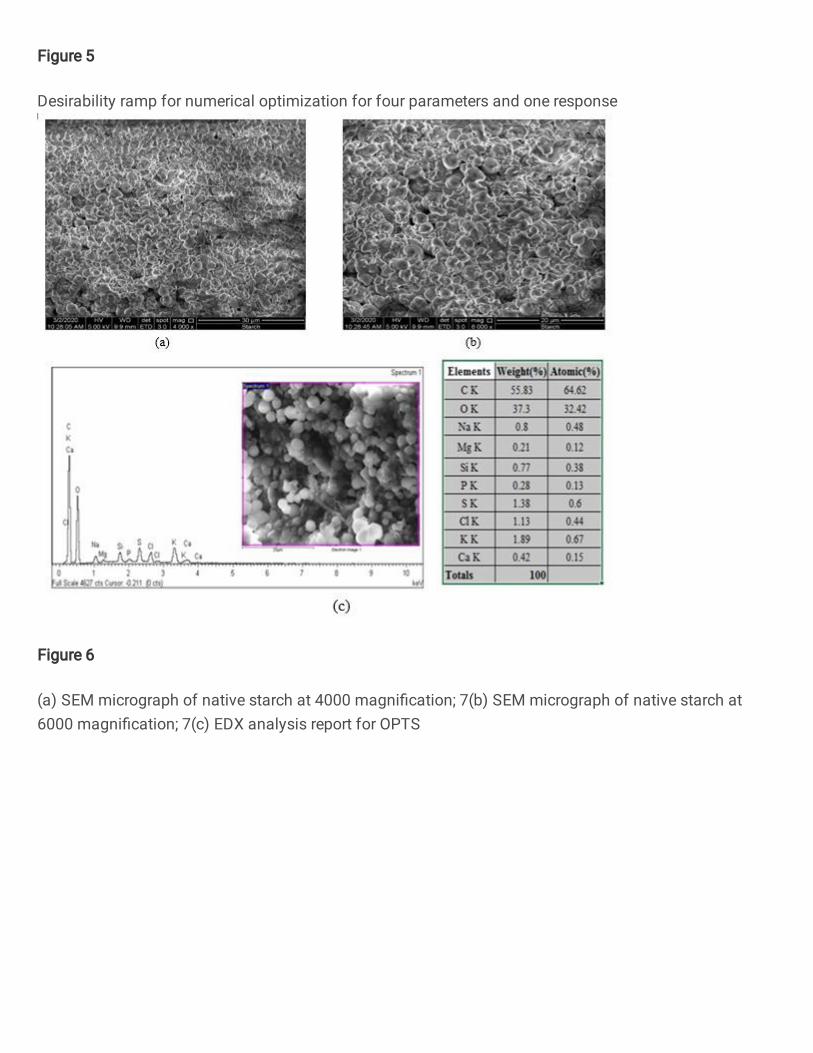
Figure 5
Desirability ramp for numerical optimization for four parameters and one response
Figure 6
(a) SEM micrograph of native starch at 4000 magni�cation; 7(b) SEM micrograph of native starch at6000 magni�cation; 7(c) EDX analysis report for OPTS
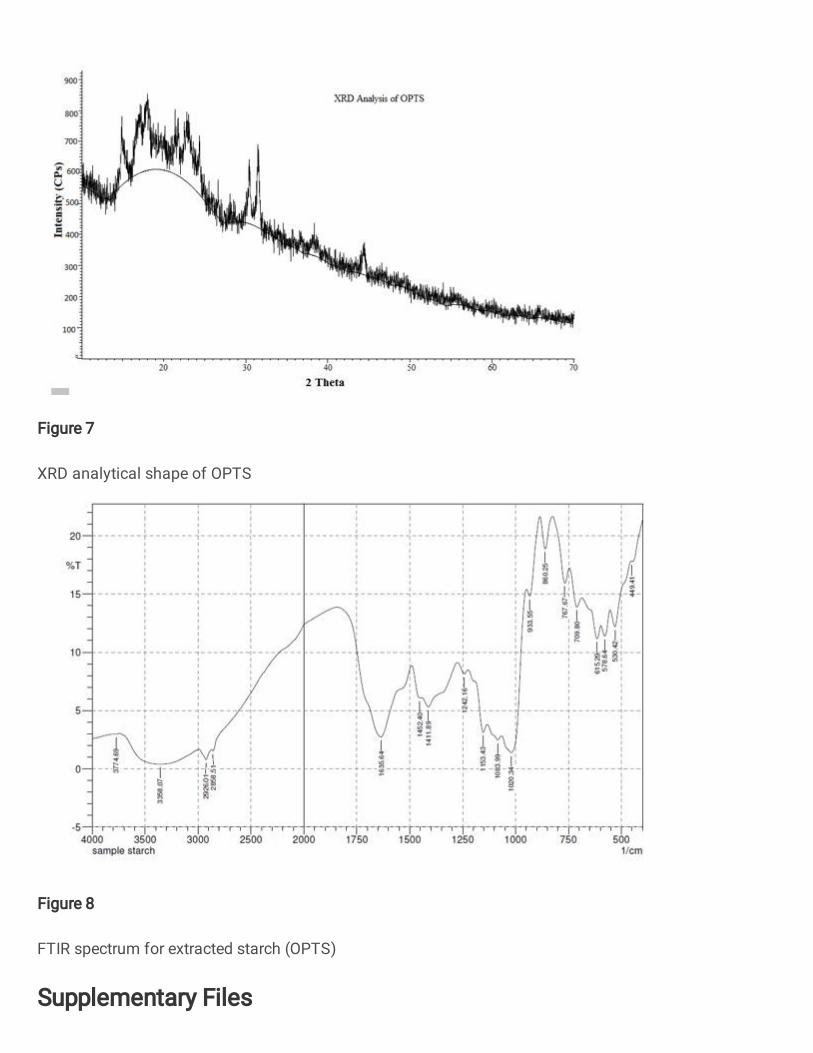
Figure 7
XRD analytical shape of OPTS
Figure 8
FTIR spectrum for extracted starch (OPTS)
Supplementary Files

This is a list of supplementary �les associated with this preprint. Click to download.
GraphAbsBRBPZA.png
Related Documents