LWT 39 (2006) 1189–1202 Optimization of sourdough process for improved sensory profile and texture of wheat bread K. Katina , R.-L. Heinio¨, K. Autio, K. Poutanen VTT Biotechnology, P.O. Box 1500, FIN-02044 VTT, Finland Received 27 December 2004; received in revised form 5 August 2005; accepted 16 August 2005 Abstract The aim of the study was to determine optimum sourdough process conditions for improved flavour and texture of wheat bread. The influence of process conditions and the starter culture on the characteristics of wheat sourdough bread was established by using response surface methodology. Influence of fermentation temperature (16–32 1C), ash content of flour (0.6–1.8 g/100 g), and fermentation time (6–20 h) were considered as independent factors and their effects were studied in sourdough bread fermented with Lactobacillus plantarum, Lactobacillus brevis, Saccharomyces cerevisiae or with a combination of yeast and lactic acid bacteria. Intensity of sensory attributes, specific volume and bread hardness were considered as the main responses. Ash content of flour and fermentation time were the main factors determining the intensity of sensory attributes. The possibility to enhance intensity of overall flavour, aftertaste and roasted flavour without excessive pungent flavour and without reduced fresh flavour in wheat bread containing 20 g sourdough/100 g of wheat dough was demonstrated by choosing e.g. Lb. brevis for a starter and by utilization of high ash content of flour, long fermentation time and reduced temperature. Bread specific volume was improved 0.2–0.5 ml/g and hardness was reduced (after 4 days of storage) up to 260 g by using low ash content of flour and by optimizing fermentation time according to the microbial strain. Lactic acid fermentation had more profound influence on both desired and undesired flavour attributes, as well as textural features of bread in comparison with yeast fermentation. r 2005 Swiss Society of Food Science and Technology. Published by Elsevier Ltd. All rights reserved. Keywords: Sourdough; Flavour; Texture; Optimization; Sensory profile 1. Introduction Use of sourdough has been reported to improve bread flavour, volume and shelf-life, especially in rye baking (Lorenz & Brummer, 2003). In wheat baking, use of sourdough is optional and more demanding way to improve bread quality because most of consumers accept only mild acidity in wheat products. Thus, controlled acidity level of wheat sourdough and subsequent bread is premise for improved flavour. Utilization of sourdough as quality improver is complex, which is well described in earlier papers reporting contradictory results on the influence of sourdough on bread quality. For example, usage of sourdough has been reported either to decrease (Armero & Collar, 1996; Rouzaud & Martinez-Anaya, 1997; Salovaara & Valjakka, 1987) or to increase (Corsetti et al., 1988, 2000; Crowley, Schober, Clarke, & Arendt, 2002; Hansen & Hansen, 1996) bread volume and shelf-life (Corsetti et al., 1998, 2000). Accordingly, sourdough fermentation has been reported enhance both desired and undesired flavour attributes (Collar, de Barber, & Marti- nez-Anaya, 1994; Hansen & Hansen, 1996; Meignen et al., 2001; Salovaara & Valjakka, 1987; Thiele, Ga¨nzle, & Vogel, 2002). Furthermore, industrial utilization of wheat sourdough as bread improver has not gained wide acceptance in many countries, which might also reflect difficulties to utilize wheat sourdough successfully. For example, in France breadmaking with sourdough has been estimated to be only 3% of all the bread manufactured (Poitrenaud, 2003). In Finland, yeasted preferments are used widely but use of wheat sourdough is very rare, despite of long tradition for eating acidic rye bread (Valjakka, Kerojoki, & Katina, 2003). ARTICLE IN PRESS www.elsevier.com/locate/lwt 0023-6438/$30.00 r 2005 Swiss Society of Food Science and Technology. Published by Elsevier Ltd. All rights reserved. doi:10.1016/j.lwt.2005.08.001 Corresponding author. Tel.: +358 9 456 5184; fax: +358 9 455 2103. E-mail address: Kati.Katina@vtt.fi (K. Katina).

Welcome message from author
This document is posted to help you gain knowledge. Please leave a comment to let me know what you think about it! Share it to your friends and learn new things together.
Transcript

ARTICLE IN PRESS
0023-6438/$30.0
doi:10.1016/j.lw
�CorrespondE-mail addr
LWT 39 (2006) 1189–1202
www.elsevier.com/locate/lwt
Optimization of sourdough process for improved sensoryprofile and texture of wheat bread
K. Katina�, R.-L. Heinio, K. Autio, K. Poutanen
VTT Biotechnology, P.O. Box 1500, FIN-02044 VTT, Finland
Received 27 December 2004; received in revised form 5 August 2005; accepted 16 August 2005
Abstract
The aim of the study was to determine optimum sourdough process conditions for improved flavour and texture of wheat bread. The
influence of process conditions and the starter culture on the characteristics of wheat sourdough bread was established by using response
surface methodology. Influence of fermentation temperature (16–32 1C), ash content of flour (0.6–1.8 g/100 g), and fermentation time
(6–20 h) were considered as independent factors and their effects were studied in sourdough bread fermented with Lactobacillus
plantarum, Lactobacillus brevis, Saccharomyces cerevisiae or with a combination of yeast and lactic acid bacteria. Intensity of sensory
attributes, specific volume and bread hardness were considered as the main responses. Ash content of flour and fermentation time were
the main factors determining the intensity of sensory attributes. The possibility to enhance intensity of overall flavour, aftertaste and
roasted flavour without excessive pungent flavour and without reduced fresh flavour in wheat bread containing 20 g sourdough/100 g of
wheat dough was demonstrated by choosing e.g. Lb. brevis for a starter and by utilization of high ash content of flour, long fermentation
time and reduced temperature. Bread specific volume was improved 0.2–0.5ml/g and hardness was reduced (after 4 days of storage) up to
260 g by using low ash content of flour and by optimizing fermentation time according to the microbial strain. Lactic acid fermentation
had more profound influence on both desired and undesired flavour attributes, as well as textural features of bread in comparison with
yeast fermentation.
r 2005 Swiss Society of Food Science and Technology. Published by Elsevier Ltd. All rights reserved.
Keywords: Sourdough; Flavour; Texture; Optimization; Sensory profile
1. Introduction
Use of sourdough has been reported to improve breadflavour, volume and shelf-life, especially in rye baking(Lorenz & Brummer, 2003). In wheat baking, use ofsourdough is optional and more demanding way toimprove bread quality because most of consumers acceptonly mild acidity in wheat products. Thus, controlledacidity level of wheat sourdough and subsequent bread ispremise for improved flavour. Utilization of sourdough asquality improver is complex, which is well described inearlier papers reporting contradictory results on theinfluence of sourdough on bread quality. For example,usage of sourdough has been reported either to decrease(Armero & Collar, 1996; Rouzaud & Martinez-Anaya,
0 r 2005 Swiss Society of Food Science and Technology. Pu
t.2005.08.001
ing author. Tel.: +358 9 456 5184; fax: +358 9 455 2103.
ess: [email protected] (K. Katina).
1997; Salovaara & Valjakka, 1987) or to increase (Corsettiet al., 1988, 2000; Crowley, Schober, Clarke, & Arendt,2002; Hansen & Hansen, 1996) bread volume and shelf-life(Corsetti et al., 1998, 2000). Accordingly, sourdoughfermentation has been reported enhance both desired andundesired flavour attributes (Collar, de Barber, & Marti-nez-Anaya, 1994; Hansen & Hansen, 1996; Meignen et al.,2001; Salovaara & Valjakka, 1987; Thiele, Ganzle, &Vogel, 2002). Furthermore, industrial utilization of wheatsourdough as bread improver has not gained wideacceptance in many countries, which might also reflectdifficulties to utilize wheat sourdough successfully. Forexample, in France breadmaking with sourdough has beenestimated to be only 3% of all the bread manufactured(Poitrenaud, 2003). In Finland, yeasted preferments areused widely but use of wheat sourdough is very rare,despite of long tradition for eating acidic rye bread(Valjakka, Kerojoki, & Katina, 2003).
blished by Elsevier Ltd. All rights reserved.

ARTICLE IN PRESS
Table 1
Composition of various runs of central composite design
Run Temperature
(Te, 1C)
Time
(Ti, h)
Ash content of flour
(A, g/100 g, d.w)
1 16 6 0.6
2 32 6 0.6
3 16 20 0.6
4 32 20 0.6
5 16 6 1.8
6 32 6 1.8
7 16 20 1.8
8 32 20 1.8
9 16 12 1.2
10 32 12 1.2
11 24 6 1.2
12 24 20 1.2
13 24 12 0.6
14 24 12 1.8
15 24 12 1.2
16 24 12 1.2
17 24 12 1.2
K. Katina et al. / LWT 39 (2006) 1189–12021190
However, sourdough is a potential option to improvebread quality also in wheat baking due to the natural,additive-free image of products containing sourdough(Salovaara, 1998). Furthermore, recent results demonstratethe effectiveness of sourdough fermentation in improvingthe nutritional value of cereal products (Liukkonen et al.,2003). Requirement for effective use of wheat sourdough isthat influence and interactions of sourdough processconditions on biochemical activity of sourdough andsubsequent bread quality are understood and optimizedaccordingly.
Bread flavour remains still a challenge due to itscomplicated nature. Especially when sourdough is utilized,improvement of wheat bread flavour requires a carefullycontrolled process to avoid e.g. excessive acidity (perceivedas a sour or pungent flavour), and still enhance thepositively charged flavour characteristics, such as roastedflavour of bread crust. Starter culture, ash content of flour,fermentation temperature and dough yield have beenreported to influence bread flavour (Gobbetti et al., 1995;Hansen & Hansen, 1996; Martinez-Anaya, Collar, & deBarber, 1995; Meignen et al., 2001). However, the influenceof the concurrent interactions of fermentation time,temperature and ash content of flour on the specificsensory attributes of sourdough breads determined byusing quantitative descriptive analysis has not beenreported before.
Traditionally, extensive pungent (or sour) flavourformation has been controlled by limiting amount ofsourdough (5–10 g/100 g of dough) to be used in subse-quent bread. This approach, however, limits alsoamount of sourdough originated flavour precursors as wellas important flavour compounds in the final breaddough. Recently, controlled sourdough process withmoderate acidity and high amount of flavour precursorshas been developed by utilizing yeast and lactic acidbacteria (LAB) with special technological properties(Mori, Okada, Onishi, & Takaki, 2001). Other possibilitywould be to adjust processing conditions to producemaximum amount of flavour precursors such as aminoacids and flavour active volatile compounds with minimumamount of acidity development (Katina, Poutanen, &Autio, 2004).
Improved volume and shelf-life of sourdough breads hasbeen suggested to be dependent on the nature and intensityof the acidification process (Clarke, Schober, & Arendt,2002). Systematic studies to improve bread volume andshelf-life by using optimized sourdough process are alsorare (Clarke, Schober, Angst, & Arendt, 2003), because theinteractions of the process parameters have not yet beenthoroughly studied.
The present study was designed: (1) to determine theinfluence and interactions of sourdough process parameters(ash content of flour, fermentation time and temperature)on the flavour attributes, the volume and the shelf-life ofsubsequent wheat sourdough breads fermented with singlestrains of lactobacillus or yeast or with a combination
starter (yeast+LAB); and (2) to improve flavour, volumeand shelf-life of wheat bread by using an optimizedsourdough process.
2. Materials and methods
2.1. Microbial strains
The LAB used in the studies were Lactobacillus
plantarum VTT E -78076 and Lactobacillus brevis
VTT E-95612. Yeast was Saccharomyces cerevisiae
VTT B81047. The selected strains originated fromFinnish sour rye baking. Combination starter containedboth studied LAB and S. cerevisiae. Growth abilityof LAB and yeast, and preparation of culture filtrate forsourdoughs was done as described earlier (Katina et al.,2004).
2.2. Preparation of sourdoughs
Wheat flours (Oululaisen Mylly, Finland) with differentash content (0.6 g/100 g, 1.2 g/100 g, 1.8 g/100 g, d.w) wereused in the experiments. Sourdough was prepared bymixing 600 g of tap water, 400 g of wheat flour and theinoculum of LAB or yeasts (106–107 cfu/g) in a large beaker(2000ml) and covered with aluminium foil. The size ofinoculum for LAB was 107 cfu/g of sourdough and foryeasts 106 cfu/g of sourdough. Ash content of flour,fermentation time and temperature were as indicated inthe experimental design (Table 1). Ready sourdoughs wereimmediately transferred to a cooling cabinet (4 1C) andused in subsequent baking without delay (maximumstorage time 1 h at 4 1C).
ARTICLE IN PRESSK. Katina et al. / LWT 39 (2006) 1189–1202 1191
2.3. Baking
Sourdoughs were prepared according to the experimen-tal design (Table 1) and used in the subsequent baking atthe level of 20 g/100 g of bread dough. The recipe for thecontrol bread without sourdough (g) used in this study waswheat flour with an ash content of 0.6 g/100 g (1250),wholemeal rye flour (200), wholemeal wheat flour (100) andwheat flour with an ash content of 1.2 g/100 g (100), freshyeast (55), salt (30), fat (25) and water (1073). The recipefor sourdough breads (g) was sourdough (578), wheat flourwith an ash content of 0.6 g/100 g (1019), wholemeal ryeflour (200), wholemeal wheat flour (100) and wheat flourwith an ash content of 1.2 g/100 g (100), fresh yeast (55),salt (30), fat (25) and water (726). Thus, the amount offlour and water was same in the control bread and in thesourdough breads.
Breads were prepared by mixing (sourdough), flour,water, sugar, salt, yeast (fresh yeast, Suomen Hiiva Oy,Finland), fat (baking margarine, Raision Yhtyma, Fin-land) and emulsifier (Panodan, Danisco Ingredients, Den-mark) for 3+5min with a Diosna spiral mixer (DIOSNADierks & Sohne GmbH, Germany). After a floor time of30min at +28 1C and relative humidity of 76% the doughwas divided into 400 g loaves and moulded mechanically.The loaves were proofed in pans (60min at +35 1C, RH75%) and baked at 230 1C for 20min. After 2–6 h ofcooling, sensory evaluation and determination of specificvolume were performed. For shelf-life evaluation, loaveswere stored in plastic bags at 20 1C for 4 days. TPA-testwas performed after 24 h and 96 h storage.
2.4. Analytical methods
2.4.1. Sensory evaluation
Descriptive analysis was used to determine the sensoryprofiles of the bread samples. The control for thesourdough bread samples was wheat bread withoutsourdough. For creating the vocabularies of the sensoryattributes, several sourdough breads deviating as much aspossible from each other were baked for model breads. A
Table 2
The attributes, definitions and anchors used in the descriptive analysis
Attribute Definition
Texture
Softness of bread crumb Degree of softness in crum
Springiness of bread crumb Degree of springiness in cr
Moistness of bread crumb Degree of moistness in cru
Flavour
Degree of roasted flavour of bread crust Degree of roasted/burnt od
Intensity of pungent flavour of bread crumb Degree of pungent (sour, v
Degree of fresh flavour of bread crumb Degree of fresh odour and
Intensity of overall flavour of bread crumb Intensity of overall odour a
Intensity of aftertaste of bread crumb Taste of crumb staying in m
four-member expert panel, specialized in cereal products,described the differences between the breads in a round-table session. The selected attributes of the sensory profiledescribed the texture and flavour (simultaneous perceptionof odour, taste and trigeminal nerve response) character-istics of the different sourdough breads as extensively aspossible. For the bread samples eight descriptors wererelevant: softness, springiness and moistness of the breadcrumb, degree of the roasted flavour of the bread crust, andintensity of pungent flavour and degree of fresh flavour,intensity of overall flavour and aftertaste of the breadcrumb. The assessors were instructed to evaluate first theintensity of the roasted flavour of the crust by breaking itup from the pan bread and thereafter the intensities of thecrumb attributes from the rest of the bread. Detaileddefinitions of the attributes are presented in Table 2. Theattribute intensities were rated on continuous unstructured,graphical intensity scales by the panel. The scales were10 cm in length and verbally anchored at each end, the leftside of the scale corresponding to the lowest intensity(value 0) and the right side to the highest intensity (value10) of the attribute.The descriptive panel consisted of ten trained assessors
with proven skills. All sensory work was carried out at thesensory laboratory of VTT Biotechnology, which fulfils therequirements of the ISO standards (ISO 1985, 1988). Allassessors of the internal sensory panel have passed thebasic taste test, the odour test and the colour vision test.They have been trained in sensory methods at numeroussessions over several years, and their evaluation ability isroutinely checked using individual control cards for eachassessor. The panel was particularly familiarized with thesensory descriptors and the attribute intensities by usingverbal definitions describing the ends of the intensity scalesof the attributes. The same panel has also frequently beenused in our previous studies on cereals.The 17 bread samples prepared according to the
experimental design consisted of 14 samples and threereplicates of the center point sample and the control breadwithout sourdough. Owing to the high number of samples,the samples were assessed in three sessions during one day.
Anchors
b by pressing between fingers Soft–hard
umb by pressing between fingers Not springy–springy
mb by feeling with fingers and in mouth Dry–moist
our and taste of bread crust Not roasted–roasted
inegar-like) odour and taste of bread crumb Not pungent–pungent
taste of bread crumb Not fresh, musty–fresh
nd taste of bread crumb Low–high
outh after tasting Low–high

ARTICLE IN PRESSK. Katina et al. / LWT 39 (2006) 1189–12021192
The freshly baked bread samples were presented to theassessors as 2.5 cm slices from three-digit coded whitecardboards in random order. The control bread withoutsourdough was thus introduced in evaluations as a hidden,randomized sample among other samples. Each assessorwas provided with six bread samples to be evaluated in onesession. Water was provided for cleansing the palatebetween the samples. The panel was instructed to sniffeach sample prior to tasting it, and they were requested toswallow the samples. Scores were recorded and collectedusing a computerized data system (Compusense Five, Ver4.2, CSA, Computerized Sensory Analysis System, Com-pusense Inc., Canada).
Means of the raw data obtained were calculated. Thesignificance of each descriptive attribute in discriminatingbetween the samples was analysed using analysis ofvariance (ANOVA), and Tukey’s honestly significantdifference (HSD) test (significance of differences atPo0:05). A two-way ANOVA was applied as the generallinear model (GLM) procedure for the bread samples byusing the SPSS software (SPSS Ver. 10.0, SPSS Inc.).ANOVA was used to test statistical differences in sensoryattributes between the samples, and the statistical differ-ence between the sessions. When the difference in ANOVAamong the samples was statistically significant, pairwisecomparisons of these samples were analysed using Tukey’stest.
2.5. Texture analysis
Bread volume was determined by rape seed displacement(4 loaves). Crumb firmness was measured at days 1 and 4 toassess the potential shelf-life of the breads. Bread crumbfirmness during storage was determined as maximumcompression force (40% compression, AACC 1998,modified method 74-09) using the texture profile analysis(TPA) test (Texture Analyser, Stable Micro Systems,Godalming, England). Eight bread slices (originating from3 loaves) were measured and results were expressed asmean values. The height of each bread slice was 2.5 cm andedges of the slice were cut off before measurement. Meanvalues of volume and hardness were calculated and used inmodelling.
2.6. Experimental design and statistical methods
To study the effects of the main factors on properties ofsourdough bread the following parameters were selected asindependent variables: temperature (Te, 16–32 1C), ashcontent of flour in g/100 g (A, 0.6–1.8 g/100 g) andfermentation time (Ti, 6–20 h). A central composite designwas used to arrange experiments and three replicates weremade at the centre point of design to allow estimation ofthe pure error at sum of the square. The experimentaldesign is presented in Table 1. Levels of variables wereselected on the basis of commonly used ones in real
sourdoughs and sponge fermentation processes applied inFinnish bakeries.The results were analysed by a multiple regression
method (MLR or PLS), which describes the effects ofvariables in second-order polynomial models. For eachresponse (flavour attributes, specific volume and hardness)a quadratic model was used:
Y ¼ b0 þ b1Teþ b2Tiþ b3Aþ b11Te2 þ b22T1
2
þ b33A2þ b12TenTiþ b13TenAþ b23TinAþ �.
This model took into account the effects of the variablealone (e.g.: Ti), the effects of the interactions between twovariables (e.g.: TinTe) and quadratic effects of the variablesalone (Ti2). Regression analysis was calculated and theresponse surfaces were plotted with the Modde 4.0 and 6.0(Umetrics AB, Umea, Sweden). The fit of model to theexperimental data was given by the coefficient of determi-nation, R2, which explains the extent of the variance in amodelled variable that can be explained with the model.Each model was validated by calculating predictive powerof model, Q2, which is a measure of how well the model willpredict the responses for a new experimental condition. Q2
is based on prediction of residual sum of squares (PRESS).For determining Q2, the computations are repeated severaltimes, each time omitting different objects from thecalculation of the model. PRESS is then computed as thesquared difference between observed Y and predictedvalues (cross validation of R2). Large Q2 indicates thatthe model has good predictive ability and will have smallprediction errors. Q2 should be40.5 if conclusion are to bedrawn from the model (Lingren, 1995). The replicates atthe center point made it possible to estimate pure error ofthe analyses, which was used to predict whether the modelsgave significant lack of fit (Carlsson, 1992). Validity ofmodel is considered to be good if lack of fit value is 40.25.Reproducibility of models was evaluated by comparingvariation of the response under the same conditions (pureerror), at the centre points to the total variation of theresponse with following equation: 1—(meansquare (pureerror)/mean square (total SS corrected). Only models withhigh reproducibility and with no significant lack of fit wereincluded in this study.
3. Results
Seventeen experiments were performed according to theexperimental design and intensity of sensory attributes,specific volume and bread firmness for single starters andfor the combination starter (yeast and LAB) weredetermined at each experimental point. For each responsegroup a quadratic equation was formed with relevant terms(Po0:05) to obtain as high R2 and Q2 values as possible.Based on these equations, behaviour of response can bepredicted within the experimental area and presented as aresponse surface. The coefficients of a particular model,and R2 and Q2 values, and lack of fit values obtained are

ARTICLE IN PRESS
Table 3
Effects of factors, expressed as their corresponding coefficients obtained in the models for sensory attributes, in sourdoughs fermented with Lb. brevis, Lb.
plantarum, S, cerevisiae or with combination startera
Sensory attributes Regression equationsb Goodness of fit and predictive power Lack of fit
Lb. plantarum
Dr* 0.59+0.044Ab+0.004Te+0.006Ti R2 ¼ 0:88, Q2 ¼ 0:81 0.44
IP* 0.047+0.163A+0.016Ti R2 ¼ 0:78, Q2 ¼ 0:58 0.24
DFr 5:48þ 1:28Aþ 0:12Ti� 0:007TenTi� 0:67TinA R2 ¼ 0:96, Q2 ¼ 0:63 0.27
Ifl 8:92þ 0:84Aþ 0:007TenTiþ 0:02Ti2 R2 ¼ 0:95, Q2 ¼ 0:87 0.25
IA 1:77þ 0:94Aþ 0:04Tiþ 0:01TenTi R2 ¼ 0:91, Q2 ¼ 0:75 0.25
Lb. brevis
Dr 2.67+1.08A+0.035Ti�0.005Ti2 R2 ¼ 0:91, Q2 ¼ 0:75 0.35
IP 2:01� 1:11A� 0:072Teþ 0:356Tiþ 0:013TenTiþ 0:84A2� 0:023Ti2 R2 ¼ 0:96, Q2 ¼ 0:84 0.33
DFr 9.45�0.84A+0.013Ti2 R2 ¼ 0:77, Q2 ¼ 0:58 0.77
Ifl 3.70+0.99A+0.065Ti R2 ¼ 0:85, Q2 ¼ 0:75 0.65
IA 2.16+1.01A+0.11Ti R2 ¼ 0:85, Q2 ¼ 0:70 0.27
S. cerevisiae
Dr 3.72+0.88A�0.32Ti R2 ¼ 0:75, Q2 ¼ 0:61IP 1:28� 1:14A� 0:045Teþ 0:008TenTi� 0:15Ti2 R2 ¼ 0:88, Q2 ¼ 0:67 0.77
DFr 5:82� 1:89Aþ 0:074AnTi R2 ¼ 0:91, Q2 ¼ 0:66 0.25
Ifl 5.2+0.95A�0.28Ti+0.015Ti2 R2 ¼ 0:85, Q2 ¼ 0:68 0.38
IA 3.72+0.88A�0.32Ti+0.016Ti2 R2 ¼ 0:75, Q2 ¼ 0:61 0.25
Combination starter
IP 4.47�0.069A+0.33Ti R2 ¼ 0:80, Q2 ¼ 0:56 0.39
DFr 8.44�0.17A+0.015Ti2 R2 ¼ 0:76, Q2 ¼ 0:63 0.52
IFl 4:73þ 0:013Aþ 0:076Tiþ 0:04AnTe R2 ¼ 0:89, Q2 ¼ 0:77 0.64
IA 2.92+0.79A+0.043Ti R2 ¼ 0:85, Q2 ¼ 0:76 0.26
aOnly values of significant coefficients are presented (95% confidence level), *, logarithm of the response is used; DR, degree of roasted flavour in bread
crust; IP, intensity of pungent flavour in bread crumb; DFr, degree of fresh flavour of bread crumb; IFl, intensity of overall flavour; IA, intensity of
aftertaste.bA, ash content of flour; Te, temperature; Ti, time; TenT1, time–temperature interaction; A2, quadratic effect of ash content of flour; Ti2, quadratic
effect of time; R2, measure of fit of the model; Q2, predictive power of the model.
K. Katina et al. / LWT 39 (2006) 1189–1202 1193
presented in Tables 3 and 4. Using these tables, values ofmeasured variables such as the degree of roasted flavour(e.g. bread with Lb. brevis fermented sourdough) can bepredicted by the following equation for the experimentalarea under consideration:
Degree of roasted flavourprd ¼ 2:67þ 1:08nA
þ 0:035nTi
þ�0:005nTi2,
where prd ¼ predicted, A ¼ ash content of flour andTi ¼ time.
If logarithm transformation of responses is used (tonormalize standard distribution of data), logarithm of theparticular response value is predicted from the equation.Selected response surface figures were also presented toillustrate these equations and figures were made bychoosing two main variables (e.g. time and temperature)exhibiting the highest influence on the particular response(e.g. specific volume) for x and z-axis. The coefficients ofcorrelation of the measured responses are also presented byusing Lb. brevis and combination starter fermentedsourdough breads as an example (Table 5).
3.1. Sensory attributes
Relatively high R2 values and Q2 were obtained in theflavour models (Table 3); typical R2 varied between 0.74and 0.99 and typical Q2 values between 0.58 and 0.93.In general, the intensities of pungent and fresh flavour,
the overall flavour and the aftertaste could be modified byusing sourdough, because these attributes were significantlydifferent (Po0:05) from each other among the sourdoughbreads and from the control bread without sourdough.Degree of roasted flavour of bread crust could be increasedonly with sourdoughs fermented by a single LAB starter.None of the texture attributes of sourdough breadsassessed in the sensory evaluations was significantlydifferent from each other, and thus only the abovementioned flavour attributes were included in the model-ling.Sourdough breads fermented with Lb. brevis or Lb.
plantarum had the most profound effect on sensory profile,since both of these strains intensified bread flavour aspresented in Figs. 1 and 2. Influence of processingconditions on flavour attributes was different for Lb.
plantarum and for Lb. brevis. With homofermentative

ARTICLE IN PRESS
Table 4
Effects of factors, expressed as their coefficients obtained in the models for specific volumes, and hardness after 4 days of storage in sourdough breads
fermented with Lb. brevis, Lb. plantarum, S. cerevisiae or with combination startera
Texture attributes Regression equationsb Goodness of fit and
predictive power
Lack of fit
Lb. plantarum
Specific volume 3.65+0.70A+0.004Te+0.40A2R2 ¼ 0:84, Q2 ¼ 0:72 0.61
Hardness after 4d 552:47þ 7:43Ti� 0:57TenTi R2 ¼ 0:99, Q2 ¼ 0:96
Lb. brevis
Specific volume* 0:38� 0:21Aþ 0:02Teþ 0:02Tiþ 0:001AnTe� 0:002AnTi
�0:0005TenTiþ 0:078A2� 0:003Te2 � 0:0005Ti2
R2 ¼ 0:99, Q2 ¼ 0:94 0.42
Hardness after 4 d 975.88+25.38A�52.95Ti+1.52Ti2 R2 ¼ 0:92, Q2 ¼ 0:65 0.34
S. cerevisiae
Specific volume 5:78� 0:48A� 0:08Tiþ 0:002TenTiþ 0:002Te2 R2 ¼ 0:88, Q2 ¼ 0:59 0.75
Hardness after 4 d 209:20þ 49:86Te� 10:21AnTi� 1:29Te2 þ 1:50Ti2 R2 ¼ 0:90, Q2 ¼ 0:56 0.28
Combination starter
Specific volume* 0:53� 0:021A� 0:00012TenTi R2 ¼ 0:81, Q2 ¼ 0:61 0.65
Hardness after 4 d 622.90�94.49A+9.03Te�11.86Ti R2 ¼ 0:88, Q2 ¼ 0:76 0.81
aOnly values of significant coefficients are presented (95% confidence level), * ¼ logarithm of the response is used.bA, ash content of flour; Te, temperature; Ti, time; AnTe, ash content–temperature interaction; A2
¼ quadratic effect of ash content; Ti2, quadratic
effect of time; Te2, quadratic effect of temperature, R2, measure of fit of the model; Q2, predictive power of the model.
Table 5
Correlation matrix between sensory attributes and texture properties in sourdough bread fermented with Lb. brevis or with combination starter
IFl IP DFr IA DR Volume Hardness
Lb. brevis
IFla 1 0.81 �0.81 0.90 0.67
IPb 0.89 1 �0.89 0.84 0.72 ns ns
DFrc �0.81 �0.89 1 �0.65 �0.67 ns ns
IAd 0.90 0.84 �0.65 1 0.74 ns ns
DRe 0.67 0.72 �0.67 0.74 1 ns ns
Volume nsf ns ns ns ns 1 ns
Hardness ns ns ns ns ns �0.68 1
Combination starter
IFla 1 0.86 �0.68 0.94 ndg ns ns
IPb 0.86 1 �0.86 0.89 nd ns ns
DFrc �0.68 �0.86 1 �0.70 nd ns ns
IAd 0.94 0.86 �0.70 1 nd ns ns
Volume nsf ns ns ns nd 1 �0.55
Hardness Ns ns ns ns nd �0.55 1
aIFl, intensity of overall flavour.bIP, Intensity of pungent flavour of bread crumb.cDFr, degree of fresh flavour of bread crumb.dIA, intensity of aftertaste.eDR, degree of roasted flavour of bread crust.fns, no significant correlation at the level of 5%.gnd, not determined.
K. Katina et al. / LWT 39 (2006) 1189–12021194
LAB, enhanced intensity of overall flavour could bereached after short fermentation time, which was not thecase with heterofermentative strain. With Lb. brevis,highest intensity of pungent flavour and decreased freshflavour as well as highest degree of roasted flavour wereobtained after 14 h of fermentation and with wholemealwheat flour. With Lb. plantarum, highest intensities of
above-mentioned attributes were reached after 20 hfermentation.Effect of sourdoughs fermented with S. cerevisiae on
both desired and undesired sensory attributes was con-siderably smaller in comparison with LAB-fermentedsourdoughs (Fig. 3). Sourdough bread fermented with S.
cerevisiae diminished roasted flavour of bread crust in the

ARTICLE IN PRESS
Fig. 1. Influence of fermentation time and ash content of flour on sensory attributes of sourdough bread fermented with Lb. plantarum (fermentation
temperature 24 1C). C ¼ intensity of the attribute in control bread.
K. Katina et al. / LWT 39 (2006) 1189–1202 1195
experimental region. Use of sourdough fermented withcombination starter enhanced intensity of overall flavour,pungent flavour, aftertaste and diminished degree of freshflavour. Response surface for these attributes (plots notshown) resembled ones obtained with Lb. brevis fermentedsourdoughs in Fig. 2. However, sourdough fermented withcombination starter did not alter roasted flavour in
comparison with control bread and this attribute wastherefore not modelled.In general, ash content of flour was clearly the
most important parameter influencing bread flavourin all sourdough types (Table 3, Figs. 1–3), as increasingash content resulted in enhanced intensity ofoverall flavour, pungent flavour, roasted flavour and

ARTICLE IN PRESS
Fig. 2. Influence of fermentation time and ash content of flour on sensory attributes of sourdough bread fermented with Lb. brevis (fermentation
temperature 24 1C). C ¼ intensity of the attribute in control bread.
K. Katina et al. / LWT 39 (2006) 1189–12021196
aftertaste. Increased ash content also diminished freshflavour.
In addition, increased fermentation time enhancedintensity of overall flavour, pungent flavour, roastedflavour and aftertaste, and diminished fresh flavour in
most sourdough types (Table 3). However, for someflavour attributes such as intensity of overall flavour (Lb.
plantarum, S. cerevisiae), degree of roasted flavour (Lb.
brevis), degree of fresh flavour (Lb. brevis and combinationstarter), intensity of pungent flavour (S. cerevisiae),

ARTICLE IN PRESS
Fig. 3. Influence of fermentation time and ash content of flour on sensory attributes in sourdough breads fermented with S. cerevisiae (fermentation
temperature 24 1C). C ¼ intensity of the attribute in control bread.
K. Katina et al. / LWT 39 (2006) 1189–1202 1197
quadratic effect of time was observed. This indicates thatthere is an optimum time window in which maximum/minimum value of the attribute in question will be reached.
The influence of fermentation temperature was ingeneral much smaller in comparison with time and flourquality. Increased fermentation temperature enhanced
ARTICLE IN PRESSK. Katina et al. / LWT 39 (2006) 1189–12021198
roasted flavour in sourdough breads fermented with Lb.
brevis and increased intensity of pungent flavour insourdough breads fermented with Lb. brevis or with S.
cerevisiae. Also, interaction of fermentation time andtemperature was recognized in the intensity of overallflavour, fresh flavour and aftertaste in sourdough breadsfermented with Lb. plantarum indicating that influence oftime on the attribute in question was dependent on the levelof temperature (Table 3). Interaction of time andtemperature was also significant in formation of pungentflavour in breads fermented either with Lb. brevis or with S.
cerevisiae.
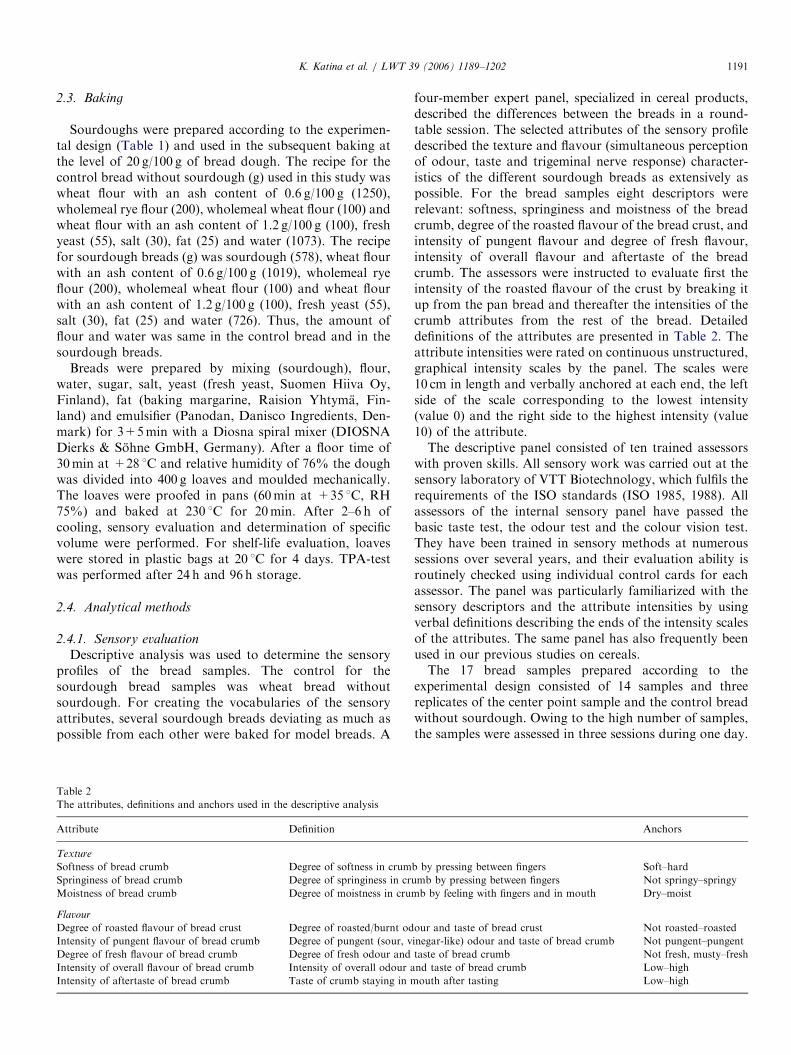
Fig. 5. Influence of fermentation time and temperature on specific volume
of sourdough bread fermented with S. cerevisiae with 0.6 g/100 g ash
content of flour. C ¼ specific volume of control bread.
3.2. Specific volume of breads
Relatively high R2 values and Q2 were obtained in thevolume models (Table 4); typical R2 values varied between0.81 and 0.99 and typical Q2 values between 0.59 and 0.94.
In general, specific volume of bread could be improvedby 0.2–0.5ml/g, if optimized sourdough process wasutilized. Increasing ash content of flour diminished breadvolume in all sourdough types, but influence of fermenta-tion time and temperature was strain-dependent.
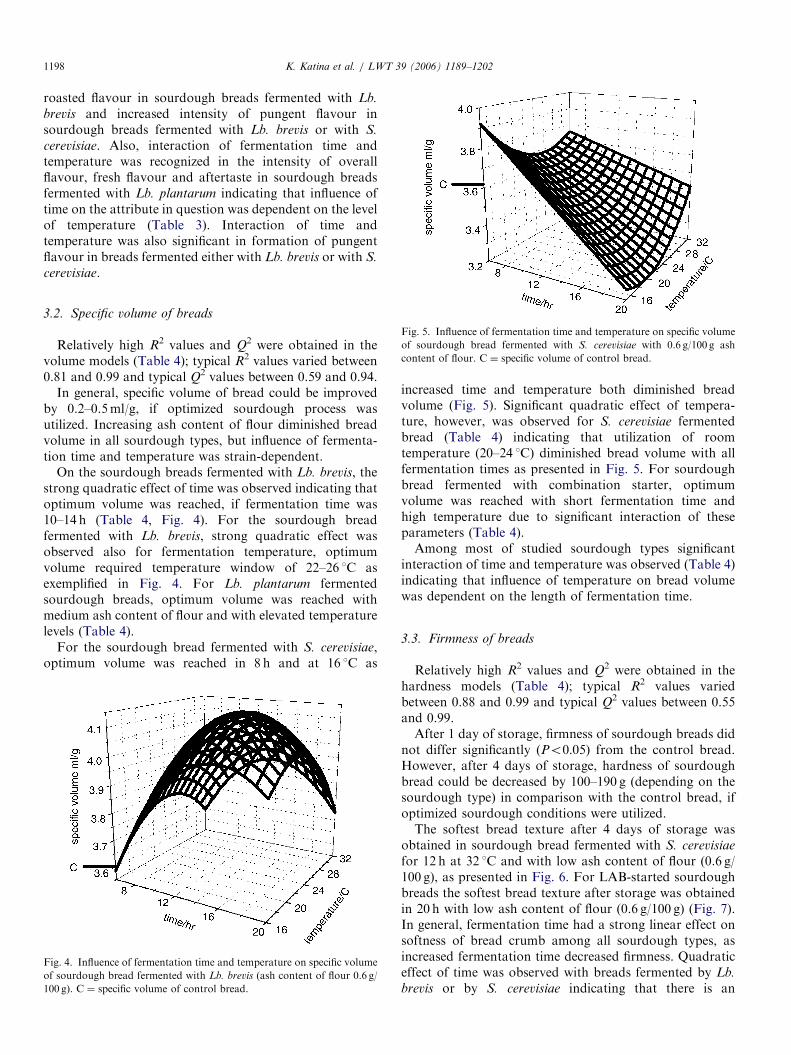
On the sourdough breads fermented with Lb. brevis, thestrong quadratic effect of time was observed indicating thatoptimum volume was reached, if fermentation time was10–14 h (Table 4, Fig. 4). For the sourdough breadfermented with Lb. brevis, strong quadratic effect wasobserved also for fermentation temperature, optimumvolume required temperature window of 22–26 1C asexemplified in Fig. 4. For Lb. plantarum fermentedsourdough breads, optimum volume was reached withmedium ash content of flour and with elevated temperaturelevels (Table 4).
For the sourdough bread fermented with S. cerevisiae,optimum volume was reached in 8 h and at 16 1C as
Fig. 4. Influence of fermentation time and temperature on specific volume
of sourdough bread fermented with Lb. brevis (ash content of flour 0.6 g/
100 g). C ¼ specific volume of control bread.
increased time and temperature both diminished breadvolume (Fig. 5). Significant quadratic effect of tempera-ture, however, was observed for S. cerevisiae fermentedbread (Table 4) indicating that utilization of roomtemperature (20–24 1C) diminished bread volume with allfermentation times as presented in Fig. 5. For sourdoughbread fermented with combination starter, optimumvolume was reached with short fermentation time andhigh temperature due to significant interaction of theseparameters (Table 4).Among most of studied sourdough types significant
interaction of time and temperature was observed (Table 4)indicating that influence of temperature on bread volumewas dependent on the length of fermentation time.
3.3. Firmness of breads
Relatively high R2 values and Q2 were obtained in thehardness models (Table 4); typical R2 values variedbetween 0.88 and 0.99 and typical Q2 values between 0.55and 0.99.After 1 day of storage, firmness of sourdough breads did
not differ significantly (Po0:05) from the control bread.However, after 4 days of storage, hardness of sourdoughbread could be decreased by 100–190 g (depending on thesourdough type) in comparison with the control bread, ifoptimized sourdough conditions were utilized.The softest bread texture after 4 days of storage was
obtained in sourdough bread fermented with S. cerevisiae
for 12 h at 32 1C and with low ash content of flour (0.6 g/100 g), as presented in Fig. 6. For LAB-started sourdoughbreads the softest bread texture after storage was obtainedin 20 h with low ash content of flour (0.6 g/100 g) (Fig. 7).In general, fermentation time had a strong linear effect onsoftness of bread crumb among all sourdough types, asincreased fermentation time decreased firmness. Quadraticeffect of time was observed with breads fermented by Lb.
brevis or by S. cerevisiae indicating that there is an

ARTICLE IN PRESS
Fig. 6. Influence of fermentation time and temperature on hardness of
sourdough bread fermented with S. cerevisiae after 4 days of storage (Ash
content of flour, 1.2 g/100 g). C ¼ hardness of control bread after 4 days of
storage.
Fig. 7. Influence of fermentation time and ash content of flour on
hardness of sourdough bread fermented with Lb. brevis after 4 days of
storage (fermentation temperature 24 1C). C ¼ hardness of control bread
after 4 days of storage.
K. Katina et al. / LWT 39 (2006) 1189–1202 1199
optimum time window for reaching maximum softness.With breads fermented with S. cerevisiae or with combina-tion starter, increasing temperature decreased bread firm-ness (Table 4). Furthermore, negative quadratic effect oftemperature was observed in sourdough breads fermentedwith S. cerevisiae. Increased ash content of flour increasedfirmness in sourdough breads fermented with either Lb.
brevis, S. cerevisiae or combination starter.
3.4. Correlation of textural measurement, sensory attributes
and acidity values of bread
In general, sensory attributes of sourdough breadscorrelated strongly (positively or negatively) with eachother (r ¼ 0:6520:94) as exemplified in Table 5 for breadsfermented with Lb. brevis or with combination starter.Intensity of pungent flavour correlated positively with
overall intensity of bread flavour, intensity of aftertaste andwith degree of roasted flavour and negatively with degreeof fresh flavour. Intensity of overall flavour correlatedpositively with intensity of aftertaste and negatively withdegree of fresh flavour. Degree of roasted flavourcorrelated positively with intensity of aftertaste andnegatively with degree of fresh flavour. Significant negativecorrelation was observed between volume and hardness ofthe sourdough bread. Sensory attributes were not signifi-cantly correlated with bread volume or with breadhardness in any of the studied sourdough breads.
4. Discussion
This work confirmed the effectiveness of sourdough inenhancing bread flavour attributes, especially if LAB-containing starters were utilized. The strong influence ofincreased ash content of flour and fermentation time inflavour modifications is most likely due to enhancedproteolysis, acidification and formation of volatile com-pounds, as reported earlier for fermentation conditionsidentical to those of this study (Katina et al., 2004).Furthermore, Czerny and Schieberle (2002) reportedintensive formation of flavour active volatile compoundsin wholemeal wheat flour during lactic acid fermentation incomparison to white wheat flour.Increased proteolysis is due to higher proteolytic activity
of wholemeal flour (Loponen, Mikola, Katina, Sontag-Strohm, & Salovaara, 2004) and leads to the accumulationof amino acids into the sourdough and into the subsequentbread dough. Amino acids, such as leucine and proline, arewell-known flavour precursors in yeast fermentationduring dough proofing and in the Maillard reaction duringbaking (Thiele et al., 2002; Gassenmeier & Schieberle,1995). However, desired flavour attributes (intensity ofoverall flavour, roasted flavour and intensity of aftertaste)correlated in general strongly with undesired flavourattributes such as pungent flavour and reduced freshflavour. This is due to the fact that acidification, andespecially formation of acetic acid, is the main factorenhancing pungent flavour (Salovaara & Valjakka, 1987;Spicher & Stephan, 1993) and diminishing fresh flavour(Heinio, Liukkonen, Katina, Myllymaki, & Poutanen,2003). On the other hand, acidification has been shownto be also a key factor in the induction of proteolysis, themain factor enhancing e.g. roasted flavour, during sour-dough fermentation (Thiele et al., 2002).Furthermore, in utilization of wholemeal wheat flour
with high ash content, outer layers of cereal kernel areintroduced to wheat baking. Bran layer of cereal kernel hasbeen reported to have more bitter flavour and intenseaftertaste (Heinio, Katina, Wilhelmson, Myllymaki, Raja-maki, Latva-Kala, 2003) in comparison to endospermflour, most likely due to location of various phenoliccompounds mainly in outer layers of cereal kernel.Phenolic compounds can have a major impact on flavourof cereals (Dimberg, Molteberg, Solheim, & Frolich, 1996).

ARTICLE IN PRESSK. Katina et al. / LWT 39 (2006) 1189–12021200
Recently, it was demonstrated by Liukkonen et al. (2003),that sourdough fermentation of whomeal rye withmixed culture (yeast+LAB) considerably increased levelof free phenolic compounds in sourdough, which mightpartly explain development of intense aftertaste and bitterflavour attributes. In addition, formation of peptidesduring intensive proteolysis, with undesired sensory char-acteristics, cannot be excluded (Martinez-Anaya, 1996).This dependence of proteolysis on the acidification (andpossible liberation of phenolic compounds) in sourdoughfermentation limits the possibility to enhance breadflavour, as maximum acceptable amounts of sourdoughto be used in wheat baking (in terms of flavour) has beenreported to be 5–10 g/100 g of dough (Lorenz & Brummer,2003).
Influence of processing conditions on bread flavourdiffered in some extent for Lb. plantarum and for Lb.
brevis. Differences can be partly explained by correlatingamino acids and organic acids of same sourdoughs (Katinaet al., 2004) with sensory properties of subsequentsourdough breads (correlation data not shown). Formationof acetic acid in sourdough resulted slightly higherintensities of aftertaste (r ¼ 0:82), and different timepattern for formation of pungent flavour for Lb. brevis
fermented sourdough bread. Acetic acid has been claimedto act as flavour enhancer in small concentrations byMolard, Nago, and Drapron (1979) and on the other hand,enhance pungent flavour in high concentrations (Molard &Cahagnier, 1980). Also, degree of roasted flavour wasslightly more intense with Lb. brevis fermented sourdoughand correlated highly with the level of proline (r ¼ 0:75) ofthis sourdough (Katina et al., 2004). With Lb. plantarum,roasted flavour correlated with formation of ornithine(r ¼ 0:80) and with reduce level of arginine formation insourdoughs which may indicate ability of this strain toproduce ornithine from arginine.
The influence of sourdough fermented with yeast(yeasted preferment) or with combination starter on breadflavour attributes (both desired and undesired ones) wasclearly smaller as compared with sourdoughs fermentedwith LAB. Inability of yeasted preferment or sourdoughcontaining yeast to enhance roasted flavour is due to thefact that in yeast fermentation, accumulation of aminoacids is modest, because of a high demand for amino acidsby yeast metabolism. If white wheat flour is used, amountof amino acids actually decreases during fermentation(Katina et al., 2004). This finding confirms the verysignificant role of proteolysis during sourdough fermenta-tion in enhancing subsequent bread flavour. An interestingfinding is that the well-established effect of intensiveformation of volatile compounds in yeasted prefermentswith low ash content of flour and with long fermentationtime (Katina et al., 2004; Meignen et al., 2001) does notseem to correlate with enhanced intensities of bread flavourattributes. This can be partly explained the fact that all theanalysed compounds are not flavour active compoundsidentified for example Schieberle and Grosch (1991).
However, Gassenmeier and Schieberle (1995) reportedintensive formation of flavour active compounds, 3-methylbutanol and 2-phenylethanol in yeasted, liquidpreferment (low ash content of flour) after fermentationof 16 h at 30 1C. In this study, similar conditions did notmodify significantly sensory properties of crumb incomparison to the control bread without preferment,perhaps due to the use of different yeast strains (sourdoughyeast versus commercial baker’s yeast) or due to differentsensory evaluation procedure. Zehentbauer and Grosch(1998) reported lower degree of roasted flavour of breadcrumb containing 10 g of yeasted preferment/100 g ofdough and made with 18 h fermentation in comparison toone made without preferment and fermented for 3 h. Alsoin our study, degree of roasted flavour was smaller in breadcontaining preferment fermented 6–20 h in comparison tobread made with straight dough (fermented 90min). Also,Lorenz and Brummer (2003) reported influence of pureyeast fermentation on enhancement of bread flavour beingunlikely.In practice, enhancement of the desired flavour attri-
butes without excessive pungent flavour and loss of freshflavour could be obtained with Lb. brevis started sour-dough fermented at 24 1C for 20 h and made with flourhaving an ash content of 1.6 g/100 g. According to themodels obtained, predicted values would be 6.7 forintensity of overall flavour (5.3 for control), 4.4 forintensity of pungent flavour (3.5 for control), 5.5 fordegree of fresh flavour (6.6 for control) 4.9 for intensity ofaftertaste (3.6 for control) and 7.5 for degree of roastedflavour of crust (6.5 for control bread). However, suchsourdough would be in an intensive phase of metabolismand would require an instant method (such as coolingdown or salting) to slow down fermentation and topreserve the required levels of metabolites responsible ofthe desired levels of flavour attributes.Enhanced intensity of overall flavour without develop-
ment of pungent flavour or reduced fresh flavour could beobtained with Lb. plantarum started sourdough breadsfermented at 32 1C for 6 h and made with flour having anash content of 1.6 g/100 g. According to the modelsobtained, predicted values would be 7.0 for intensity ofoverall flavour (5.3 for control), 3.6 for intensity ofpungent flavour (3.5 for control), 7.2. for degree of freshflavour (6.6 for control) 3.2 for intensity of aftertaste (3.6for control) and 6.6 for degree of roasted flavour of crust(6.5 for control bread).The study confirmed the effectiveness of LAB-containing
starters in improving bread volume as compared with pureyeasted preferments (Clarke et al., 2003; Corsetti et al.,2000; Gobbetti et al., 1995). However, the big influence ofthe level of process parameters as well as the mutualinteractions of these parameters in determining breadvolume have not been reported before. Achievement ofoptimum volume will require individual adjustment ofthese levels for each starter, as the influence of processparameters was strain-dependent.

ARTICLE IN PRESSK. Katina et al. / LWT 39 (2006) 1189–1202 1201
The positive effect of sourdough in bread volume hasbeen linked to better gas holding capacity of gluten inacidic dough containing sourdough (Gobbetti, Corsetti,Rossi, 1995), solubilization of pentosans during thesourdough process (Corsetti et al., 2000), altered activitiesof endogenous enzymes due to utilization of sourdoughand subsequent low pH (Clarke et al., 2003), and fasteryeast fermentation in the presence of LAB (Gobbetti,Corsetti et al., 1995). Increasing acidity, however, leadsfinally also to a stepwise degradation of gluten proteins(Thiele, Ganzle, & Vogel, 2003) and thus results in softer,less elastic dough with poorer gas holding properties, iffermentation is allowed to continue long enough to obtainintensive acidification (Clarke et al., 2003). Accordingly,the acidity level of sourdough and subsequent bread doughmust be carefully controlled to attain increased breadvolume as recognized by Clarke et al. (2003) and confirmedby the results of this study.
Increased softness after storage was at least partly due tothe improved specific volume (significant positive correla-tion) of these breads. Acidification, however, was related tothe improved softness, as pH of sourdoughs correlatedpositively with firmness values in all types of sourdoughbread. Biological acidification may aid in maintainingbread freshness because it influences moisture redistribu-tion throughout the loaf during storage (Corsetti et al.,2000). Furthermore, formation of exopolysaccharides anddextrins during fermentation has also been proposed toenhance the shelf-life by decreasing starch recrystallization(Korakli, Rossman, Ganzle, & Vogel, 2001; Martinez-Anaya, 1996; Rouzaud & Martinez-Anaya, 1997). Im-proved softness of sourdough breads during storage alsorequires controlled acidity levels, as positive influence isobtained only in moderate acidity.
According to our results, an overall improvement ofbread volume, softness and flavour with the samesourdough is not likely. This is due to the fact thatoptimum extraction rate of flour differs for texturalimprovement and for flavour independent of sourdoughtype, as the former requires use of low ash content flourand the latter high ash content flour, respectively. Inaddition, the requirement for fermentation time is differentfor texture and flavour improvement. Efficient use ofsourdough thus requires consideration of sourdough’s finalutilization in wheat baking, and sourdough can be tailoredeither for flavour improvement or texture improvement.Improvement of any of the quality attributes of wheatbread, however, is based on tuned metabolic activity ofsourdough, because positive effects in flavour, texture orshelf-life are obtained only in the optimized conditions ofsourdough fermentation.
5. Conclusion
Significant influence of sourdough process conditions onbread flavour and texture was clarified in this study byusing experimental design and mathematical modelling.
Based on obtained models, designed sourdough processesfor improved bread flavour, volume or shelf-life werepresented. Process requirements for optimum quality werestrain-specific and different for textural or flavour im-provement which should be taken into account in designingfuture sourdough baking processes.
Acknowledgements
We thank Marketta Sauri for cultivating the studiedmicrobes, and Arja Viljamaa, Tiina Jarvinen and LeenaPulkki for their skilful technical assistance. The financialsupport of the National Technology Agency (Tekes) isgratefully acknowledged. This project was part of VTTresearch programme Future Foods.
References
Armero, E., & Collar, C. (1996). Antistaling additives, flour type and
sourdough process effects on functionality of wheat doughs. Journal of
Food Science, 61, 299–302.
Carlsson, R. (1992). Response surface methods: In design and optimization
in organic synthesis (pp. 259–260). Amsterdam: Elsevier.
Clarke, C. I., Schober, T. J., & Arendt, E. K. (2002). The effect of single
strain and traditional mixed strain starter cultures on rheological
properties of wheat dough and bread quality. Cereal Chemistry, 79,
640–647.
Clarke, C. I., Schober, T. J., Angst, E., & Arendt, E. K. (2003). Use of
response surface methodology to investigate the effects of processing
conditions on sourdough wheat bread quality. European Food
Research and Technology, 217, 23–33.
Collar, C., de Barber, C., & Martinez-Anaya, M. (1994). Microbial sour
doughs influence acidification properties and bread making potential
of wheat dough. Journal of Food Science, 59(3), 629–633.
Corsetti, A., Gobbetti, M., Balestrieri, F., Paoletti, F., Russi, L., & Rossi,
J. (1998). Sourdough lactic acid bacteria effects on bread firmness and
staling. Journal of Food Science, 63, 347–351.
Corsetti, A., Gobbetti, B., De Marco, B., Balestrieri, F., Paoletti, F., &
Rossi, J. (2000). Combined effect of sourdough lactic acid bacteria and
additives on bread firmness and staling. Journal of Agricultural and
Food Chemistry, 48, 3044–3051.
Crowley, P., Schober, T., Clarke, C., & Arendt, E. (2002). The effect of
storage time on textural and crumb grain characteristics of sourdough
wheat bread. European Food Research and Technology, 214, 489–496.
Czerny, M., & Schieberle, P. (2002). Important aroma compounds in
freshly ground wholemeal and white flour—identification and quanti-
tative changes during sourdough fermentation. Journal of Agricultural
and Food Chemistry, 50(23), 6835–6840.
Dimberg, L. H., Molteberg, E. L., Solheim, R., & Frolich, W. (1996).
Variation in oat groats due to variety, storage and heat treatment. I:
Phenolic compounds. Journal of Cereal Science, 24, 263–272.
Gassenmeier, K., & Schieberle, P. (1995). Potent aromatic compounds in
the crumb of wheat bread (French-type)-influence of pre-ferments and
studies on the formation of key odorants during dough processing.
Zeitschrift fur Lebensmittel Untersuchung und Forschung, 201, 241–248.
Gobbetti, M., Corsetti, A., & Rossi, J. (1995). Interaction between lactic
acid bacteria and yeasts in sourdough using a rheofermentometer.
World Journal of Microbiology and Biotechnology, 11, 625–630.
Gobbetti, M., Simonetti, M. S., Corsetti, A., Santinelli, F., Rossi, J., &
Damiani, P. (1995). Volatile compound and organic acid productions
by mixed wheat sour dough starters: Influence of fermentation
parameters and dynamics during baking. Food Microbiology, 12,
497–507.

ARTICLE IN PRESSK. Katina et al. / LWT 39 (2006) 1189–12021202
Hansen, A., & Hansen, B. (1996). Flavour of sourdough wheat bread
crumb. Zeitschrift fur Lebensmittel Untersuchung und Forschung,
202(3), 244–249.
Heinio, R.-L., Katina, K., Wilhelmson, A., Myllymaki, O., Rajamaki, T.,
Latva-Kala, K., et al. (2003). Relationship between sensory perception
and flavour-active volatile compounds of germinated, sourdough
fermented and native rye following the extrusion. Lebensmittel
Wissenschaft und Technologie, 36(5), 533–545.
Heinio, R.-L., Liukkonen, K.-L., Katina, K., Myllymaki, O., & Poutanen,
K. (2003). Milling fractions of rye produces different sensory profiles
of both flour and bread. Lebensmittel Wissenschaft und Technologie,
36(6), 577–583.
Katina, K., Poutanen, K., & Autio, K. (2004). Influence and interactions
of processing conditions and starter culture on formation of acids,
volatile compounds and amino acids in wheat sourdoughs. Cereal
Chemistry, 81(5), 598–610.
Korakli, M., Rossmann, A., Ganzle, G., & Vogel, R. F. (2001). Sucrose
metabolism and exopolysaccharide production in wheat and rye
sourdoughs by Lactobacillus sanfranciscensis. Journal of Agricultural
and Food Chemistry, 49, 5194–5200.
Lingren, A. (1995). Multivariate structure-property relationship of non
ionic surfactans. Ph.D. thesis, Umea University, Umea.
Liukkonen, K.-H., Katina, K., Wilhelmson, A., Myllymaki, O., Lampi,
A.-M., Kariluoto, S., et al. (2003). Process-induced changes on
bioactive compounds in whole grain rye. Proceedings of the Nutrition
Society, 62, 117–122.
Loponen, J., Mikola, M., Katina, K., Sontag-Strohm, T., & Salovaara, H.
(2004). Degradation of HMW glutenins during wheat sourdough
fermentations. Cereal Chemistry, 81(1), 87–90.
Lorenz, K., & Brummer, J.-M. (2003). Preferments and sourdoughs for
German breads. In K. Kulp, & K. Lorenz (Eds.), Handbook of dough
fermentations (pp. 247–270). New York: Marcel Dekker.
Martinez-Anaya, M. A. (1996). Carbohydrate and nitrogen related
components in wheat sourdough processes: A review. Advances in
Food Science (CTML), 18(5/6), 185–200.
Martinez-Anaya, M., Collar, C., & de Barber, C. (1995). Comparison on
wheat flour from different European countries in microbiologically
started bread making processes. Cereal Foods World, 40(9), 605–610.
Meignen, B., Onno, B., Gelinas, P., Infantes, M., Guilos, S., & Cahagnier,
B. (2001). Optimisation of sourdough fermentation with Lactobacillus
brevis and baker’ yeast. Food Microbiology, 18, 239–245.
Molard, R., & Cahagnier, B. (1980). Bildung von essigsaure und
Mildchsaure im Verlauf der Teigfuhrumg-Auswirkkungen auf den
Brotgeshmack. Getreide Mehl Brot, 34, 147–149.
Molard, R., Nago, M. C., & Drapron, R. (1979). Influence of
breadmaking method on French bread flavour. Baker’s Digest, 53(6),
34–38.
Mori, H., Okada, H., Onishi, H., & Takaki, S. (2001). Bread making using
brewing micro-organisms (Part 1). New sour bread starter using
brewing micro-organsims. Journal of Brewing Society of Japan, 96(4),
282–288.
Poitrenaud, B. (2003). Commercial starters in France. In K. Kulp, & K.
Lorenz (Eds.), Handbook of dough fermentations (pp. 247–270). New
York: Marcel Dekker.
Rouzaud, O., & Martinez-Anaya, M. (1997). Relationship between
biochemical and quality-related characteristics of breads, resulting
from the interactions of flour, microbial starter and the type of process.
Zeitschrift fur Lebensmittel Untersuchung und Forschung, 204, 321–326.
Salovaara, H. (1998). Lactic acid bacteria in cereal-based products. In S.
Salminen, & A. von Wright (Eds.), Lactic acid bacteria—microbiology
and functional aspects, (2nd ed) (pp. 115–137). New York: Marcel
Dekker.
Salovaara, H., & Valjakka, T. (1987). The effect of fermentation
temperature, flour type, and starter on the properties of sour wheat
bread. International Journal of Food Science and Technology, 22,
591–597.
Schieberle, P., & Grosch, W. (1991). Potent odorants of wheat bread
crumb. Differences to the crust and effect of a longer dough
fermentation. Zeitschrift fur Lebensmittel Untersuchung und Forschung,
192, 120–135.
Spicher, S., & Stephan, H. (1993). Handbuch sauerteig—biologie, biohemie,
technologie. Hamburg: B. Behr’s Verlag GmbH.
Thiele, C., Ganzle, G., & Vogel, R. F. (2002). Contribution of sourdough
lactobacilli, yeast, and cereal enzymes to the generation of amino acids
in dough relevant for bread flavour. Cereal Chemistry, 79, 45–51.
Thiele, C., Ganzle, G., & Vogel, R. F. (2003). Fluorescence labelling of
wheat proteins for determination of gluten hydrolysis and depolymer-
isation during dough processing and sourdough fermentation. Journal
of Agricultural and Food Chemistry, 51(9), 2745–2752.
Valjakka, T., Kerojoki, H., & Katina, K. (2003). Sourdough bread in
Finland and Eastern Europe. In K. Kulp, & K. Karel (Eds.),
Handbook of dough fermentations (pp. 247–270). New York: Marcel
Dekker.
Zehentbauer, G., & Grosch, W. (1998). Crust Aroma of Baguettes I. Key
odorants of baguettes prepared in two different ways. Journal of Cereal
Science, 28, 81–92.
Related Documents