Optimization of Software Project Planning Via Search - Based Techniques Giuliano Antoniol Ecole Polytechnique de Montreal

Optimization of Software Project Planning Via Search - Based Techniques Giuliano Antoniol Ecole Polytechnique de Montreal.
Dec 20, 2015
Welcome message from author
This document is posted to help you gain knowledge. Please leave a comment to let me know what you think about it! Share it to your friends and learn new things together.
Transcript

Optimization of Software Project Planning
Via Search - Based Techniques
Giuliano Antoniol Ecole Polytechnique de Montreal

Wayne State University - Jan 16, 2006
2
Software engineering and VSF
ICTs are reshaping the software landscape
WEB booming, emerging economies … rosy prospects that hide opportunities as well as new new challenges
Customers, developers, sub-contractors may adopt the net to build a new infrastructure
The Virtual Software Factory - VSF

Wayne State University - Jan 16, 2006
3
Our problem80 people to fix year 2000 bugs
84 WPs
Each WP thousands of files
How many possible combinationsOf 80 programmers and 84 WPs?

Wayne State University - Jan 16, 2006
4
A WEB-centric maintenance model
Traditional maintenance and service centers are moving to WEB-centric solutions;
Incoming requests are queued before being served;
Objective: obtain a compromise between cost and customers’ satisfaction
Service centerCustomers
Requestsenqueued

Wayne State University - Jan 16, 2006
5
The Maintenance ProcessMaintenance phases
Rework
Abandonment
People distribution
DispatcherWP1 WP2 … WPn
Project
WP1 WP2 WP3
WP11 WP12 WP31 WP32
Project WBS
WP Ordering
Wayne State University - Jan 16, 2006
6
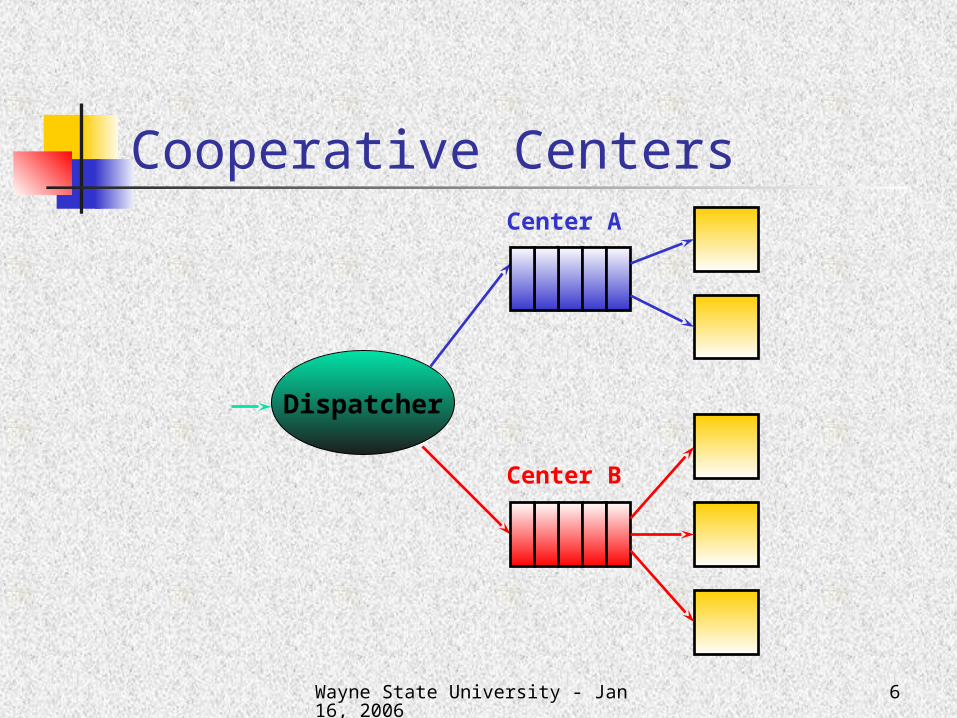
Cooperative Centers
Dispatcher
Center A
Center B

7Wayne State University - Jan 16, 2006
Express lane model
Dispatcher
Express lane
Slow lane
Drastic reduction of waiting times for express lane customers;
Reduction of overall waiting times;
Potential reduction of service time variability in the two subsystems;
A dispatcher is necessary.

Wayne State University - Jan 16, 2006
8
Basic Assumption Events modeled by stochastic processes Activities modeled via queue theory
Maintenance/development incoming requests modeled by Poisson
process service times often grossly deviates …
general distributions ….
Wayne State University - Jan 16, 2006
9
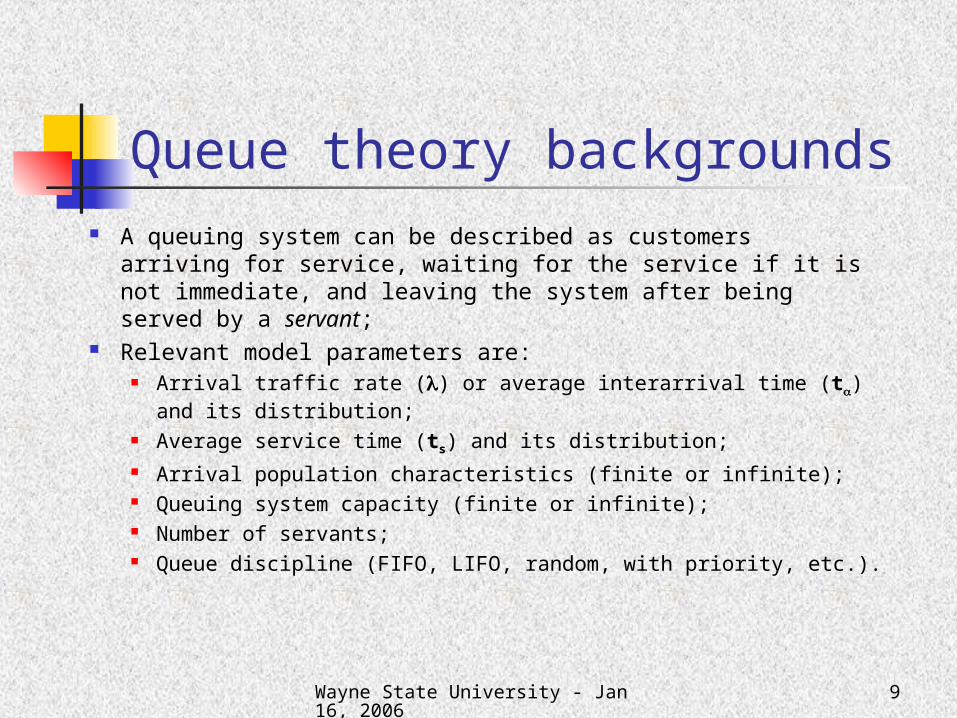
Queue theory backgrounds A queuing system can be described as customers arriving
for service, waiting for the service if it is not immediate, and leaving the system after being served by a servant;
Relevant model parameters are: Arrival traffic rate () or average interarrival time (t) and its
distribution; Average service time (ts) and its distribution; Arrival population characteristics (finite or infinite); Queuing system capacity (finite or infinite); Number of servants; Queue discipline (FIFO, LIFO, random, with priority, etc.).

Wayne State University - Jan 16, 2006
10
Model of a phase Distribution and average values (t) of waiting times; Distribution and average value (tr) of the times spent by
customers in the system, also called reply times; Distribution and average number of waiting customers (X); Distribution and average number of customers present in the
system (Xr); SERVANT
QUEUE t/1
t2C St
2SC
t St
rt
Wayne State University - Jan 16, 2006
11
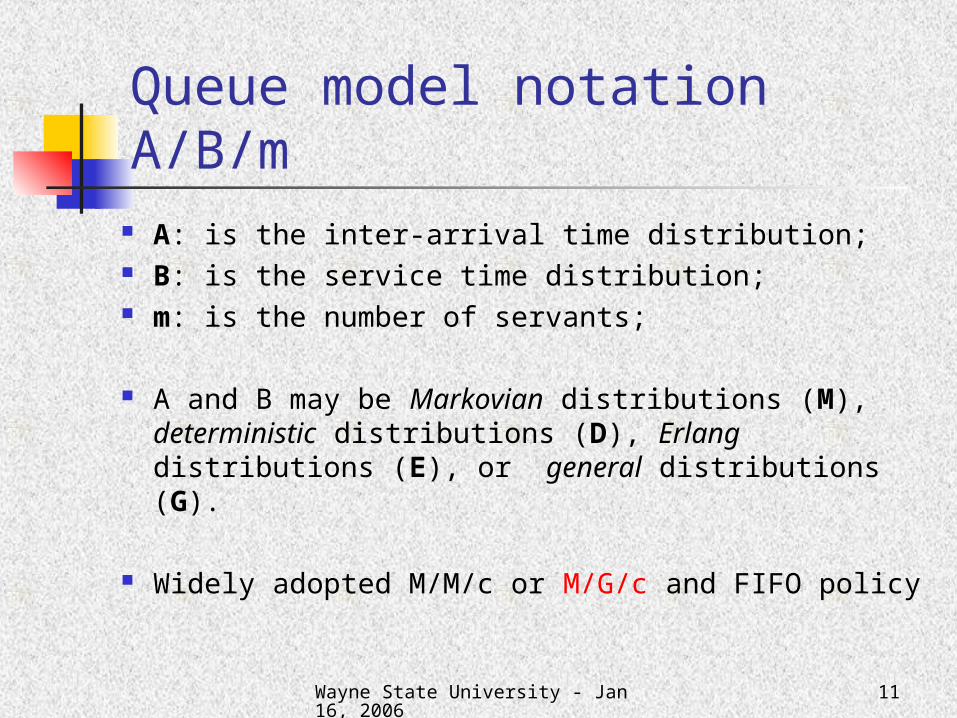
Queue model notation A/B/m A: is the inter-arrival time distribution; B: is the service time distribution; m: is the number of servants;
A and B may be Markovian distributions (M), deterministic distributions (D), Erlang distributions (E), or general distributions (G).
Widely adopted M/M/c or M/G/c and FIFO policy

Wayne State University - Jan 16, 2006
12
M/M/m, M/G/m or what? Evaluating the coefficient of variation Cs of service
times, defined as the ratio between the standard
deviation and the mean.
The service times distribution therefore is: A deterministic distribution when Cs
2 <0.3;
An Erlang distribution when 0.3< Cs2 <0.7;
An exponential distribution when 0.7< Cs2 <1.3;
… M/M/m … A general distribution when Cs
2 >1.3. … M/G/m …
Wayne State University - Jan 16, 2006
13
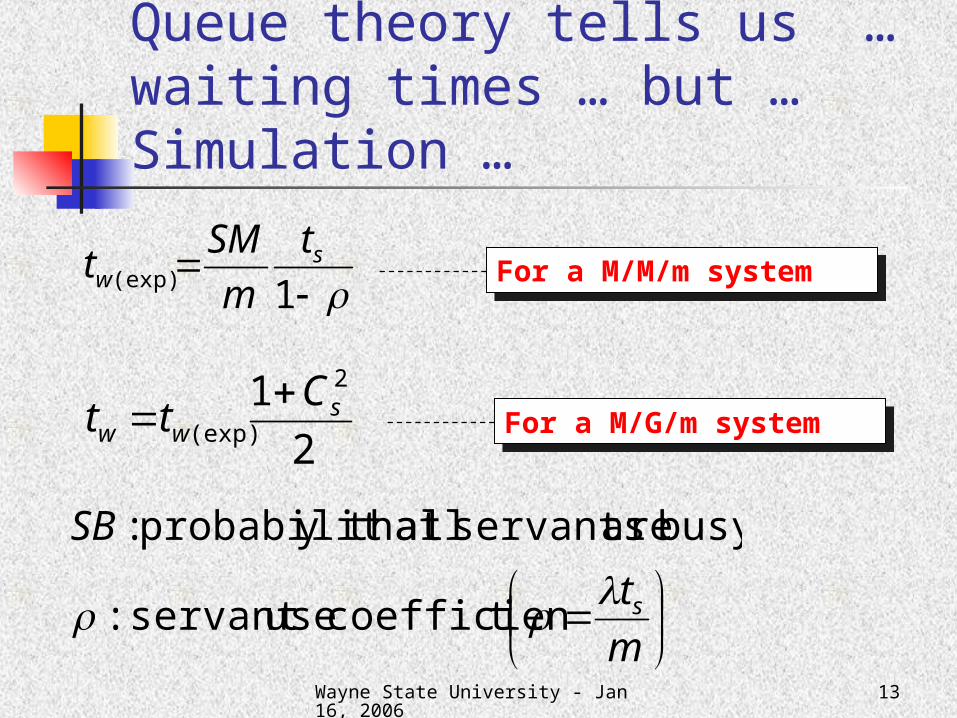
Queue theory tells us … waiting times … but … Simulation …
m
t
SB
s t coefficien useservant :
busy are servants ally that probabilit :
1(exp)s
w
t
m
SMt For a M/M/m system For a M/M/m system
2
1 2
(exp)s
ww
Ctt
For a M/G/m system For a M/G/m system

Wayne State University - Jan 16, 2006
14
Phased model
ts
tw
ts
tw
Phase A Phase B
Nothing get lost !
Wayne State University - Jan 16, 2006
15
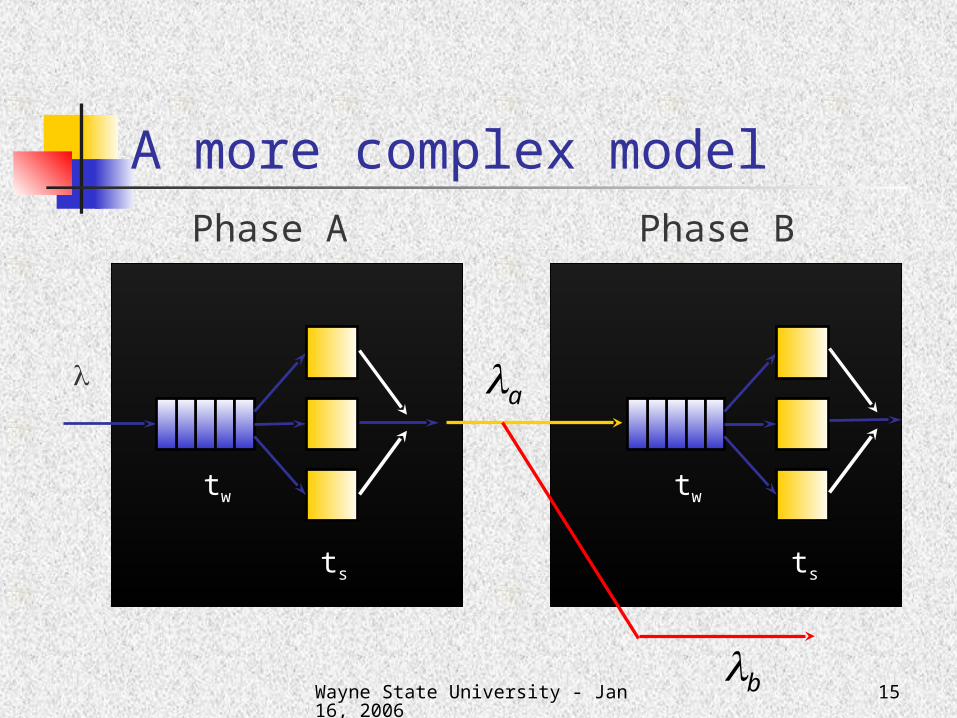
A more complex modelPhase A Phase B
ts
tw
ts
tw
a
b

Wayne State University - Jan 16, 2006
16
Almost … there … final model ?
ts
tw
ts
tw
a
b
rP

Wayne State University - Jan 16, 2006
17
Problem iterative solution
Meta heuristic Algorithms (MH) used to determine WP ordering and people distribution across teams
Objective: minimize the finishing time
Tandem MH
# of people Random WP ordering Uniform team organization
Sub-optimalTeam organization
Sub-optimalWP ordering
[equilibrium reached]
MH1 DetermineOptimal
WP ordering
Determine/negotiateAvailable staffing
MH2 DetermineOptimal
Team organization
SensitivityAnalysis
[Deadline OK]
NO
NO
YES
YES

Wayne State University - Jan 16, 2006
18
Genetic Algorithms (GA) Initialize population P[0]; g=0; while(g < max_number_of_generations) Evaluate P[g]; g=g+1; Select P[g] from P[g-1]; Crossover P[g]; Mutate P[g]; end while

Wayne State University - Jan 16, 2006
19
MH1 -> GA 1: determining the WP ordering
Genome: array encoding the WP order “ordering” genome N WPs N cells - j tells who is the j-th WP
Crossover Mutation: randomly selects 2 WP and
swaps their position in the genome
People distribution: random or fixed in the previous step
Fitness Function: determine finishing time given this order
Discrete-event simulation [TSE 2004]
WP4
WP2 WP3
WP6
WP4 WP6 WP3 WP2
WP4 WP2 WP6 WP3
WP4 WP6
WP2 WP3
4 12 3 21

Wayne State University - Jan 16, 2006
20
MH2 -> GA 2: determining people distribution across teams
Genome: array encoding people pigeon hole assignment, array size define the allocated number of people
Crossover: one-point Mutation: randomly change one
person’s team WP ordering: fixed in the previous
step Fitness Function: the same as the
previous step
Team 2 …
People 1
Team 7 Team 2
People 2 People n
Team 3
The cardinality of the numbers present in the genome determineThe number of teams … 7 in this example … Mutation may change the number of teams or assign a programmer to a new team

Wayne State University - Jan 16, 2006
21
Case Study The project concerned with an old legacy system
(financial application for an European firm); The project followed a phased maintenance:
Inventory (not considered); Assessment; Technical Analysis (TA); Enactment (Enact); Unit Testing (UT).
Project split in 84 WPs No constraints across WPs in this case study

Wayne State University - Jan 16, 2006
22
Threats to Validity Assumption: we can exchange people and months
Very-standardized and semi-automatic maintenance intervention
Brooks’ law not applicable Construct validity:
Simplification in the maintenance process topology this does not influence the applicability of the approach
No dependencies between WPs actual case study, cases with dependencies under investigation
Internal validity: Careful calibration of iterations and GA parameters GA executed a large number of times to avoid
randomness External validity:
This results can be extended to similar projects
size team
effortts

Wayne State University - Jan 16, 2006
23
Determining the WP Ordering: Estimated Completion Time

Wayne State University - Jan 16, 2006
24
Determining People Distribution: # of Teams

Wayne State University - Jan 16, 2006
25
People Allocation across Teams
TeamSize
Staffing Level
20 25 30 35 40 45 50
1 - - 2 1 7 5 10
2 1 1 1 3 7 10 14
3 - 1 4 5 5 4 4
4 2 1 1 2 1 2
5 2 2 2 1 - - -
6 - 1 - - - - -

Wayne State University - Jan 16, 2006
26
Setting a Minimum Team Size
0
1
2
3
4
5
# o
f p
erso
ns
per
tea
m
1 2 3 4 5 6 7 8 9 10
Teams (staffing of 30 people)
No Threshold Minimum 2 persons per team

Wayne State University - Jan 16, 2006
27
Completion Time Variability
0 50 100 150
Project completion time (days)
1
2
3
4
5
6
7
8
9
10
Te
am
s
0 10 20 30 40 50 60 70 80 90 100 110
Project completion time (days)
1
3
5
7
9
11
13
15
17
19
21
Te
am
s
30 people 45 people

Wayne State University - Jan 16, 2006
28
Abandonment and Rework
100
105
110
115
120
125
130
135
140
0 5 10 15 20
% of WPs subject to rework or abandonment
Pro
ject
com
plet
ion
time
(day
s)Rework Abandonment
(staffing level: 35 people)

Wayne State University - Jan 16, 2006
29
Effort estimate uncertainty
90
100
110
120
130
140
150
160
0 5 10 15 20
Uncertainty level (% )
Pro
jec
t c
om
ple
tio
n t
ime
(d
ay
s)
Neutral Over-pessimistic Over-optimistic
(staffing level: 35 people)

Wayne State University - Jan 16, 2006
30
Actual team sizes
0
5
10
15
20
25
30
0 10 20 30 40 50 60 70 80 90
WPs
Te
am
Siz
e
0
2
4
6
8
10
12
14
0 20 40 60 80 100 120 140 160
Days
# o
f a
lloc
ate
d t
ea
ms
Median 6
Median 6

Wayne State University - Jan 16, 2006
31
Discussion
No improvement over 45 people this confirms results of [TSE 2004]
Few people large teams More people several smaller teams
Managers should avoid singleton (too risky) and too large (causing overhead) groups
Even with low staffing resource usage is maximized
Low variability in finishing times Overstaffing may cause poor resource utilization

Wayne State University - Jan 16, 2006
32
Actual project staffing 80 people (not fully assigned to the project)
Working teams and people allocated varied during time
Project duration: 155 working days
Team size: 2 to 27 (median 6)
No fast lane, but big teams for large WPs
20 people would suffice to complete the project
Why GA … is it the Holy Grail …?
… Well … Yes and No …Comparing different heuristics

Wayne State University - Jan 16, 2006
34
I - Pigeon Hole representation N-sized array Values indicate the team to which the WP is assigned to Multi-queue model
4 32 1
WP1 WP2 WP3 WP4
WP3
WP2
WP4
WP14
3
2
1

Wayne State University - Jan 16, 2006
35
II - Ordering (scanning) representation
N-sized array Values indicate the position of the WP in the
incoming queue
4 32 1
WP1 WP2 WP3 WP4
WP1 WP4 WP2 WP3

Wayne State University - Jan 16, 2006
36
GA Operators: ordering Crossover Mutation: randomly selects 2 WP
and swaps their position in the queue
Selection: Roulette wheel pcross=0.6 pmut=0.1 GA type: Simple with elitism of 1
(best) individual Population size: 100 individuals
4
4 3
1
1 2 3 4
4 2 1 3
1 2
2 3
4 12 3 21
The array value is the position of the WP in theIncoming queue for a single, multi-server queue

Wayne State University - Jan 16, 2006
37
GA Operator: pigeon hole Mutation: randomly change
one WP assignment
Crossover: one-point
Queue 2 …
WP 1
Queue 7 Queue 2
WP 2 WP n
Queue 3
N integer where N is the WP numberEach value indicate the team the WP is assigned to

Wayne State University - Jan 16, 2006
38
Hill Climbing (HC) Initialize best restart=0 do pick a random solution si do local=true Consider all the neighbor solutions sj of si Take the best one sj’ if sj’< si then si = sj’ else local=false while local if si<best then best=si restart=restart+1 while restart<maxrestart
Local optima problem
Mitigated by restart
In the essence randomly pick up a WP, assign it to anotherrandomly selected team

Wayne State University - Jan 16, 2006
39
Simulated Annealing (SA) Cooling mechanism allows to move to less fit solutions Cooling reduces the probability of choosing an
unfavorable solution as the number of iterations increases
Similar to hill climbing, however a new solution will be accepted if
p<mwhere
p is a random number in the range [0…1]
iterblog
aT
T
'ss ji
em

Wayne State University - Jan 16, 2006
40
Cooling
0
0.1
0.2
0.3
0.4
0.5
0.6
0.7
0.8
1 2 3 4 5 6 7 8 9 10 11 12 13 14 15 16 17
iter
m
a=1, b=2 a=1, b=1 a=2, b=1

Wayne State University - Jan 16, 2006
41
Research Questions For a fixed staffing level, what is the
optimal order in which to present the WPs for action?
How do the results vary with team size and distribution?
Which is the best genome representation for our problem ?
What is the difference between GA, hill climbing and simulated annealing?

Wayne State University - Jan 16, 2006
42
Threats to Validity Construct validity:
Simplification in the maintenance process topology this does not influence the applicability of the approach
No dependencies between WPs actual case study, cases with dependencies under investigation
Can be handled by adding a penalty to the fitness function [Coello]
Internal validity: Careful calibration of algorithms (GA, HC and SA)
parameters Search run replicated a large (20) number of times to
avoid randomness External validity:
This results can be extended to similar projects

Wayne State University - Jan 16, 2006
43
Comparing different techniques and representations (20 teams of 1)
300
350
400
450
500
0 200 400 600 800 1000
Iterations/Generations
Tim
e R
eq
uir
ed
Random/Pigeon
SA/PigeonHC/Pigeon
GA/PigeonRandom/Ordering
SA/OrderingHC/Ordering
GA/Ordering
Ordering genome performs better
Also allows complex queuing networks
GA starts faster (due to its parallelisms)
Then HC and SA work better
SA starts slower No significant
difference among techniques
Wayne State University - Jan 16, 2006
44
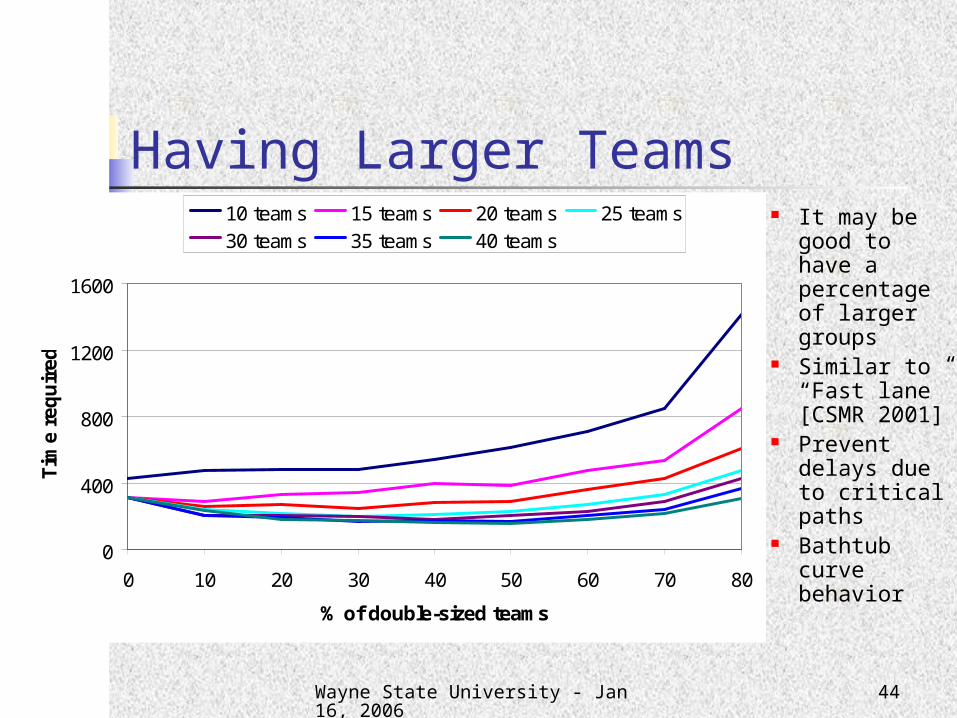
Having Larger Teams It may be
good to have a percentage of larger groups
Similar to “Fast lane” [CSMR 2001]
Prevent delays due to critical paths
Bathtub curve behavior
0
400
800
1200
1600
0 10 20 30 40 50 60 70 80
% of double-sized teams
Tim
e re
qu
ired
10 teams 15 teams 20 teams 25 teams
30 teams 35 teams 40 teams

Wayne State University - Jan 16, 2006
45
Conclusions Combination of queuing theory and search heuristics to
determine: The optimal allocation of people across teams The optimal assignment of WP to teams
Optimization can reduce project duration or staffing up to 50%
Different representations and heuristics compared Ordering representation works better No significant differences between heuristics
Use of “fast lane” teams: Useful for large staffing Bathtub curve

Wayne State University - Jan 16, 2006
46
Questions?

Wayne State University - Jan 16, 2006
47
VSF challenges ICT infrastructure communication backbone
Pert and GANTT to track and plan But how can we effectively planning large
projects?
How can we effectively staff VSF centers?
How can we manage VSF centers?
Related Documents