Optimization of renewable levulinic acid production from glucose conversion catalyzed by Fe/HY zeolite catalyst in aqueous medium Nur Aainaa Syahirah Ramli, Nor Aishah Saidina Amin ⇑ Chemical Reaction Engineering Group (CREG), Energy Research Alliance, Faculty of Chemical Engineering, Universiti Teknologi Malaysia, 81310 UTM Johor, Johor Bahru, Malaysia article info Article history: Received 10 December 2014 Accepted 5 February 2015 Keywords: Levulinic acid Optimization Glucose Oil palm fronds Fe/HY zeolite Response surface methodology abstract Levulinic acid (LA) is a versatile chemical with numerous applications. In this study, the conversions of glucose and oil palm fronds (OPF) to LA have been conducted over 10% Fe/HY zeolite catalyst. The opti- mization of LA yield from glucose conversion using Box–Behnken design and response surface method- ology reported 61.8% yield, which can be achieved at temperature 173.4 °C, reaction time 3.3 h, 0.93 g of glucose and 0.89 g 10% Fe/HY zeolite. The LA yield from OPF conversion conducted at the optimum con- ditions was 17.6% with 54.8% process efficiency. It was also observed that Fe leaching from 10% Fe/HY zeolite was insignificant and recycled 10% Fe/HY zeolite gave sufficient performance for five successive cycles. This study emphasizes the potential of Fe/HY zeolite catalyst for catalytic conversion of lignocel- lulosic biomass to LA. Ó 2015 Elsevier Ltd. All rights reserved. 1. Introduction Primary energy sources such as petroleum, natural gas and coal are all non-renewable, and depending on these sources for energy generation is not sustainable. The depleting primary energy sources and increasing greenhouse gas emissions have driven worldwide initiatives to develop clean technologies for chemical transformations from renewable and sustainable feedstocks. Bio- mass has received significant attention for its ability to produce fuels and chemicals. In Malaysia, the biomass residues culminate mostly from the oil palm industry. Oil palm fronds (OPF) are the most abundant oil palm wastes generated by the mills. OPF con- tains large amount of cellulose, the polymer of glucose, which can be further converted downstream to other value added prod- ucts [1]. This study presents the report of OPF conversion to levulinic acid (LA), which is one of the top twelve building blocks derived from biomass feedstock [2]. The production of value added products from OPF in a biorefinery may provide a better method to manage oil palm wastes for saving the environment and improving the sustainable development of the oil palm industry. LA is a versatile building block for the production of various plat- form chemicals. Besides fuel additives, LA can also be used in manufacturing biodegradable herbicides, solvents, food flavoring agents, fragrance, pharmaceutical compounds, and resins [3]. LA can be synthesized from various feedstocks including glucose, starch and lignocellulosic materials [4–9]. Generally, in the conver- sion of glucose to LA, glucose isomerizes to fructose and dehydrates to form the intermediate product, 5-hydroxymethylfurfural (5- HMF) [10–13], which will then catalytically rehydrate to form LA and formic acid. Due to the availability of cheap biomass, the direct transformation of biomass to LA has gained extensive attention from many researchers worldwide [5–8,14–16]. Previously, numerous studies have reported the production of LA using mineral acids such as HCl, H 2 SO 4 , and formic acid as cat- alysts [5,17,18]. A homogeneous catalytic system has been applied in the first biorefinery in Caserta, Italy for the synthesis of LA from biomass through a process developed by Biofine Renewables [19,20]. Although homogeneous catalytic reactions were effective for LA production, the use of mineral acids has caused serious envi- ronmental pollution [4]. From an economical and environmental point of view, hetero- geneous solid acid catalysts have attracted substantial interests since these solid catalysts can overcome the problems associated with homogeneous catalytic system [21]. Many efforts have been attempted to employ recyclable and reusable solid acid catalysts for the production of LA. Some of the catalysts were zeolites, metal salts, ion-exchange resins, niobium phosphate, and solid super acid [4,7–9,22,23]. It was demonstrated that zeolite has the potential to be used in glucose dehydration reaction since the pore structure could exert significant influence on the reaction [9,24,25]. Metal halides have also been used for LA production from cellulose [22]. Metal halides are expected to demonstrate superior catalytic activity for glucose dehydration due to its acidity. It also has the http://dx.doi.org/10.1016/j.enconman.2015.02.013 0196-8904/Ó 2015 Elsevier Ltd. All rights reserved. ⇑ Corresponding author. Tel.: +60 75535579; fax: +60 75588166. E-mail address: [email protected] (N.A.S. Amin). Energy Conversion and Management 95 (2015) 10–19 Contents lists available at ScienceDirect Energy Conversion and Management journal homepage: www.elsevier.com/locate/enconman

Welcome message from author
This document is posted to help you gain knowledge. Please leave a comment to let me know what you think about it! Share it to your friends and learn new things together.
Transcript
Energy Conversion and Management 95 (2015) 10–19
Contents lists available at ScienceDirect
Energy Conversion and Management
journal homepage: www.elsevier .com/locate /enconman
Optimization of renewable levulinic acid production from glucoseconversion catalyzed by Fe/HY zeolite catalyst in aqueous medium
http://dx.doi.org/10.1016/j.enconman.2015.02.0130196-8904/� 2015 Elsevier Ltd. All rights reserved.
⇑ Corresponding author. Tel.: +60 75535579; fax: +60 75588166.E-mail address: [email protected] (N.A.S. Amin).
Nur Aainaa Syahirah Ramli, Nor Aishah Saidina Amin ⇑Chemical Reaction Engineering Group (CREG), Energy Research Alliance, Faculty of Chemical Engineering, Universiti Teknologi Malaysia, 81310 UTM Johor, Johor Bahru, Malaysia
a r t i c l e i n f o
Article history:Received 10 December 2014Accepted 5 February 2015
Keywords:Levulinic acidOptimizationGlucoseOil palm frondsFe/HY zeoliteResponse surface methodology
a b s t r a c t
Levulinic acid (LA) is a versatile chemical with numerous applications. In this study, the conversions ofglucose and oil palm fronds (OPF) to LA have been conducted over 10% Fe/HY zeolite catalyst. The opti-mization of LA yield from glucose conversion using Box–Behnken design and response surface method-ology reported 61.8% yield, which can be achieved at temperature 173.4 �C, reaction time 3.3 h, 0.93 g ofglucose and 0.89 g 10% Fe/HY zeolite. The LA yield from OPF conversion conducted at the optimum con-ditions was 17.6% with 54.8% process efficiency. It was also observed that Fe leaching from 10% Fe/HYzeolite was insignificant and recycled 10% Fe/HY zeolite gave sufficient performance for five successivecycles. This study emphasizes the potential of Fe/HY zeolite catalyst for catalytic conversion of lignocel-lulosic biomass to LA.
� 2015 Elsevier Ltd. All rights reserved.
1. Introduction
Primary energy sources such as petroleum, natural gas and coalare all non-renewable, and depending on these sources for energygeneration is not sustainable. The depleting primary energysources and increasing greenhouse gas emissions have drivenworldwide initiatives to develop clean technologies for chemicaltransformations from renewable and sustainable feedstocks. Bio-mass has received significant attention for its ability to producefuels and chemicals. In Malaysia, the biomass residues culminatemostly from the oil palm industry. Oil palm fronds (OPF) are themost abundant oil palm wastes generated by the mills. OPF con-tains large amount of cellulose, the polymer of glucose, whichcan be further converted downstream to other value added prod-ucts [1]. This study presents the report of OPF conversion tolevulinic acid (LA), which is one of the top twelve building blocksderived from biomass feedstock [2]. The production of value addedproducts from OPF in a biorefinery may provide a better method tomanage oil palm wastes for saving the environment and improvingthe sustainable development of the oil palm industry.
LA is a versatile building block for the production of various plat-form chemicals. Besides fuel additives, LA can also be used inmanufacturing biodegradable herbicides, solvents, food flavoringagents, fragrance, pharmaceutical compounds, and resins [3]. LAcan be synthesized from various feedstocks including glucose,
starch and lignocellulosic materials [4–9]. Generally, in the conver-sion of glucose to LA, glucose isomerizes to fructose and dehydratesto form the intermediate product, 5-hydroxymethylfurfural (5-HMF) [10–13], which will then catalytically rehydrate to form LAand formic acid. Due to the availability of cheap biomass, the directtransformation of biomass to LA has gained extensive attentionfrom many researchers worldwide [5–8,14–16].
Previously, numerous studies have reported the production ofLA using mineral acids such as HCl, H2SO4, and formic acid as cat-alysts [5,17,18]. A homogeneous catalytic system has been appliedin the first biorefinery in Caserta, Italy for the synthesis of LA frombiomass through a process developed by Biofine Renewables[19,20]. Although homogeneous catalytic reactions were effectivefor LA production, the use of mineral acids has caused serious envi-ronmental pollution [4].
From an economical and environmental point of view, hetero-geneous solid acid catalysts have attracted substantial interestssince these solid catalysts can overcome the problems associatedwith homogeneous catalytic system [21]. Many efforts have beenattempted to employ recyclable and reusable solid acid catalystsfor the production of LA. Some of the catalysts were zeolites, metalsalts, ion-exchange resins, niobium phosphate, and solid super acid[4,7–9,22,23]. It was demonstrated that zeolite has the potential tobe used in glucose dehydration reaction since the pore structurecould exert significant influence on the reaction [9,24,25]. Metalhalides have also been used for LA production from cellulose[22]. Metal halides are expected to demonstrate superior catalyticactivity for glucose dehydration due to its acidity. It also has the
N.A.S. Ramli, N.A.S. Amin / Energy Conversion and Management 95 (2015) 10–19 11
additional benefit of being easily separated from reaction productsby supporting the metal halides on a carrier such as zeolite [26]. Inearlier research, CrCl2 or CrCl3 were mostly involved as catalyst forcatalytic conversion of carbohydrates [22,27–31]. However, highprice, toxicity and environmental pollution caused by CrCl2 andCrCl3 have necessitated the search for a non toxic and low cost cat-alyst. Instead of using Cr, other metal chlorides can be consideredDue to the low cost and non toxic properties of FeCl3 [32], it isenvisaged that this extensively available compound is able to per-form as an eco-friendly catalyst for conversion of carbohydrates toLA.
Optimization process is a crucial step in determining suitableand economical conditions to enhance process efficiency. Responsesurface methodology (RSM) is managed by certain rules where therelationship between the factors can be used to optimize a desiredoutput [33]. The application of RSM can decrease the number ofexperimental runs needed and reduce the cost and time consumedaccordingly. In previous studies, RSM have been employed to opti-mize LA yield from glucose and biomass conversions [5,15,34,35].The important variables which possibly affect the LA yield includereaction temperature, reaction time, feedstock loading, and cata-lyst loading [8,15,23,34,36].
Recently, CrCl3 and HY zeolite were combined for the produc-tion of LA from glucose conversion [34,37]. Herein, Fe/HY zeolite,prepared by combination of FeCl3 and HY zeolite through wetimpregnation method, was explored for the optimization of LAyield from catalytic conversion of glucose. The activity and charac-terization of different FeCl3 loading on HY zeolite have beenevaluated for glucose dehydration reaction [38]. The Fe/HY zeolitecatalyst has previously been tested for reducing sugar productionfrom the hydrolysis of cellulose and oil palm biomass in ionic liq-uid for further production of LA [39]. The combination of Fe/HYzeolite catalyst and ionic liquid has also been tested for direct con-version of OPF to LA [40]. The Fe/HY zeolite-ionic liquid catalyticsystem was effective for LA production. However, the exorbitantcost of ionic liquid restricted its extensive application. This posesthe challenge to investigate the catalytic activity of Fe/HY zeolitefor the conversion of biomass in aqueous medium.
Thus, the present work demonstrates the optimization of LAyield from glucose conversion catalyzed by Fe/HY zeolite catalystin aqueous medium. Initially, Fe/HY zeolite catalysts with differentFeCl3 loadings (5, 10 and 15 wt%) were screened. The effect ofFe/HY zeolite properties on the production of LA from glucosewas examined and briefly discussed. Next, the optimization of LAyield from glucose conversion over the best Fe/HY zeolite catalystusing Box Behnken design under RSM was performed. The study isessential for determining the optimum conditions for better uti-lization of Fe/HY zeolite catalyst in an industrial scale process.The effect of various process conditions; reaction temperature,reaction time, glucose loading, and Fe/HY zeolite loading on LAyield as the response was evaluated. The significance of processvariables and the interaction between variables on the processwere also examined using RSM. Subsequently, the potential ofFe/HY zeolite as catalyst was evaluated on OPF conversion to LAat the optimum condition obtained from the glucose conversionreaction. In addition, leaching of Fe ions from Fe/HY zeolite catalystand the reusability of Fe/HY zeolite catalyst for LA production fromglucose and OPF conversions were also examined.
2. Materials and methods
2.1. Materials
Iron (III) chloride (FeCl3), glucose, LA, 5-HMF, formic acid, andfurfural were purchased from Merck, Germany. NaY faujasite type
zeolite (SiO2/Al2O3 = 5) was obtained from Zeolyst International,U.S.A. Ammonium chloride (NH4Cl) and sulfuric acid (H2SO4) weresupplied by Qrec, New Zealand. OPF was supplied by MalaysiaPalm Oil Board (MPOB), Kuala Lumpur, Malaysia. The whole OPF,consisted of leaflets and petiole, were dried and grinded to smallsize particles (less than 5 mm).
2.2. Catalyst preparation and characterization
HY zeolite was prepared by exchanging the ion from NaY zeolitewith NH4Cl. NaY zeolite was contacted with 2 M NH4Cl with stir-ring (250 rpm) at room temperature for 2 h. The precipitate wasthen washed with distilled water, followed by drying overnightat 120 �C. The material was calcined at 400 �C for 5 h resulting inthe HY zeolite. The Fe/HY zeolite was prepared using wetnessimpregnation method [38]. FeCl3 solution and HY zeolite with cer-tain weight ratio of FeCl3 to HY zeolite (5%, 10%, 15%) were mixedand stirred (250 rpm) at room temperature for 2 h. Then, the mix-ture was dried in the oven overnight at 120 �C. Finally, the Fe/HYzeolite catalyst was calcined at 400 �C for 5 h.
The properties of Fe/HY zeolite and HY zeolite catalysts wereexamined using several characterization methods. EDX analysiswas conducted to confirm the weight percentage of Fe on Fe/HYzeolite samples. N2 physisorption method was applied to deter-mine the surface area of the catalysts using a MicromeriticsASAP2020 analyzer. The acidity of the catalysts was evaluatedusing temperature programmed desorption of ammonia(NH3-TPD, TPDRO 1100 series, Thermo Finnigan). The Brønsted toLewis acid sites ratios were determined by Perkin Elmer FTIR spec-troscopy with pyridine as a probe molecule. The pyridine adsorp-tion was performed at 250 �C for 1 h. Besides, FTIR, XRD, FESEM,N2 physisorption, and NH3-TPD analyses were conducted to exam-ine the regenerated catalyst. The FTIR spectra were recorded usingPerkin Elmer at 400–4000 cm�1 and the FESEM images wereobtained using FESEM, Hitachi SU8020. Meanwhile, the XRD wasemployed using Bruker D8 Advance diffractometer system (CuKa radiation).
2.3. Catalytic tests
All experiments were carried out in a 100 ml high pressurereactor. The reactor was loaded with predetermined amount ofglucose and Fe/HY zeolite catalyst in distilled water (50 ml) andheated at the specified temperature and constant stirring speed(200 rpm). After the reaction was completed, the product was letcooled to room temperature and filtered prior to product analysis.The concentration of LA in the liquid product was determined byHPLC (Perkin Elmer Series 200) using column, Hi Plex H; flow rate,0.6 ml/min; mobile phase, 5 mM H2SO4; detector, UV210 nm;retention time, 60 min; column temperature, 60 �C. The same stepswere applied to OPF hydrolysis. The LA yield from glucose and OPF,theoretical LA yield from OPF, and process efficiency of OPF hydro-lysis are calculated according to Eqs. (1)–(3). Other water solubleproducts from glucose conversion reaction (5-HMF, formic acid,furfural) were detected using HPLC (Perkin Elmer Series 200) underthe same conditions as LA determination. The products yield is cal-culated according to Eq. (4):
LA yield ð%Þ ¼ Final LA amountInitial feedstock amount
� 100% ð1Þ
Theoretical LA yield ð%Þ ¼ Cellulose amount� 0:71Oil palm frond amount
� 100% ð2Þ
where the value of 0.71 is equal to the molecular weight of LA divid-ed by the molecular weight of cellulose (MW of LA, C5H8O3 = 116,MW of cellulose, C6H10O5 = 162).
12 N.A.S. Ramli, N.A.S. Amin / Energy Conversion and Management 95 (2015) 10–19
Efficiency ð%Þ ¼ LA yieldTheoretical LA yield
� 100% ð3Þ
where efficiency refers to the efficiency of OPF conversion to LAbased on the cellulose content.
Product yield ð%Þ ¼ Final product amountInitial glucose amount
� 100% ð4Þ
40
60
ld (%
)
2.4. Experimental design
In this study, the Box–Behnken design (BBD) was used to designthe experiments with four variables. The variables; reaction tem-perature (x1), reaction time (x2), glucose loading (x3), and 10%Fe/HY zeolite loading (x4), at three different levels; low, medium,high, and coded as �1, 0, +1, respectively (Table 1). The statisticalanalysis of the response was carried out using Statsoft Statisticasoftware version 8.0. The mathematical model for LA yield wasfitted to second order polynomial model as in Eq. (5):
Yi ¼ bo þ b1x1 þ b2x2 þ b3x3 þ b4x4 þ b11x21 þ b22x2
2 þ b33x23
þ b44x24 þ b12x1x2 þ b13x1x3 þ b14x1x4 þ b23x2x3 þ b24x2x4
þ b34x3x4 ð5Þ
where Yi is dependent variable (LA yield); x1, x2, x3, and x4 are theindependent variables; bo is the regression coefficient; b1, b2, b3,and b4 are the linear coefficients; b11, b22, b33, and b44 are thequadratic coefficients; b12, b13, b23, b34, b24, and b14 are the secondorder interaction coefficients.
2.5. OPF characterization
The chemical compositions of OPF were determined by thermalgravimetric analysis (TGA) using a NETZSCH STA 449F3 instru-ment. The OPF sample was heated with heating rate of 10 �C/minunder N2 flow, from 30 to 700 �C. TGA method has been provenas a method to determine biomass compositions [20,41]. The char-acterization of sugars and ash content in the OPF were in accor-dance with the standard laboratory analytical proceduresprovided by the National Renewable Energy Laboratory (NREL)[42].
3. Results and discussions
3.1. Preliminary testing and Fe/HY zeolite characterization
The first step in this study was screening among the three Femodified HY zeolite based catalysts with different FeCl3 loading;5%, 10% and 15%, through glucose conversion to LA. These catalystsare referred as 5% Fe/HY zeolite, 10% Fe/HY zeolite, and 15% Fe/HYzeolite. The operation conditions were 180 �C, 3 h, 1 g of glucose,1 g of catalyst, and 50 ml of distilled water. As mentioned earlier,this paper deals with the optimization of LA from glucose conver-sion using RSM and the application of Fe/HY zeolite for OPF conver-sion to LA while our previous paper [38] is more focused anddetailed on the catalysts characterization and performance. As it
Table 1Experimental range and levels for the independent variables.
Factors Symbol Range and level
Uncoded Coded �1 0 +1
Reaction temperature (�C) X1 x1 140 170 200Reaction time (h) X2 x2 2 3 4Glucose loading (g) X3 x3 0.5 1 1.510% Fe/HY zeolite loading (g) X4 x4 0.5 1 1.5
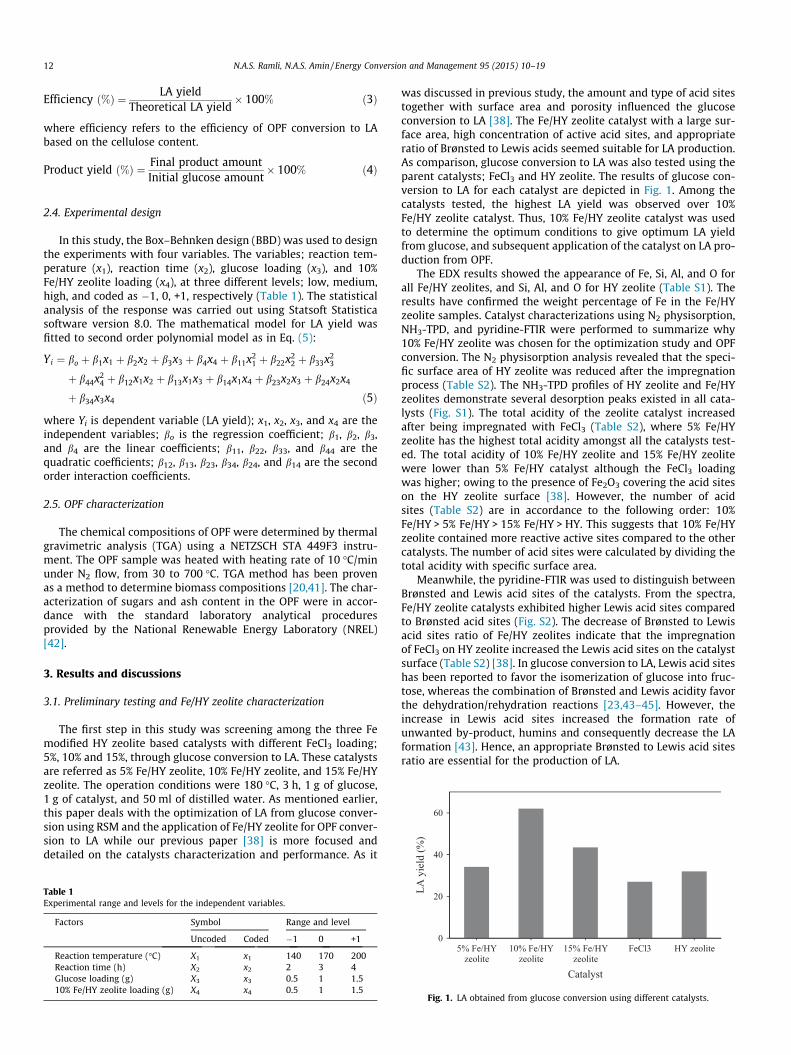
was discussed in previous study, the amount and type of acid sitestogether with surface area and porosity influenced the glucoseconversion to LA [38]. The Fe/HY zeolite catalyst with a large sur-face area, high concentration of active acid sites, and appropriateratio of Brønsted to Lewis acids seemed suitable for LA production.As comparison, glucose conversion to LA was also tested using theparent catalysts; FeCl3 and HY zeolite. The results of glucose con-version to LA for each catalyst are depicted in Fig. 1. Among thecatalysts tested, the highest LA yield was observed over 10%Fe/HY zeolite catalyst. Thus, 10% Fe/HY zeolite catalyst was usedto determine the optimum conditions to give optimum LA yieldfrom glucose, and subsequent application of the catalyst on LA pro-duction from OPF.
The EDX results showed the appearance of Fe, Si, Al, and O forall Fe/HY zeolites, and Si, Al, and O for HY zeolite (Table S1). Theresults have confirmed the weight percentage of Fe in the Fe/HYzeolite samples. Catalyst characterizations using N2 physisorption,NH3-TPD, and pyridine-FTIR were performed to summarize why10% Fe/HY zeolite was chosen for the optimization study and OPFconversion. The N2 physisorption analysis revealed that the speci-fic surface area of HY zeolite was reduced after the impregnationprocess (Table S2). The NH3-TPD profiles of HY zeolite and Fe/HYzeolites demonstrate several desorption peaks existed in all cata-lysts (Fig. S1). The total acidity of the zeolite catalyst increasedafter being impregnated with FeCl3 (Table S2), where 5% Fe/HYzeolite has the highest total acidity amongst all the catalysts test-ed. The total acidity of 10% Fe/HY zeolite and 15% Fe/HY zeolitewere lower than 5% Fe/HY catalyst although the FeCl3 loadingwas higher; owing to the presence of Fe2O3 covering the acid siteson the HY zeolite surface [38]. However, the number of acidsites (Table S2) are in accordance to the following order: 10%Fe/HY > 5% Fe/HY > 15% Fe/HY > HY. This suggests that 10% Fe/HYzeolite contained more reactive active sites compared to the othercatalysts. The number of acid sites were calculated by dividing thetotal acidity with specific surface area.
Meanwhile, the pyridine-FTIR was used to distinguish betweenBrønsted and Lewis acid sites of the catalysts. From the spectra,Fe/HY zeolite catalysts exhibited higher Lewis acid sites comparedto Brønsted acid sites (Fig. S2). The decrease of Brønsted to Lewisacid sites ratio of Fe/HY zeolites indicate that the impregnationof FeCl3 on HY zeolite increased the Lewis acid sites on the catalystsurface (Table S2) [38]. In glucose conversion to LA, Lewis acid siteshas been reported to favor the isomerization of glucose into fruc-tose, whereas the combination of Brønsted and Lewis acidity favorthe dehydration/rehydration reactions [23,43–45]. However, theincrease in Lewis acid sites increased the formation rate ofunwanted by-product, humins and consequently decrease the LAformation [43]. Hence, an appropriate Brønsted to Lewis acid sitesratio are essential for the production of LA.
0
20
5% Fe/HY zeolite
10% Fe/HY zeolite
15% Fe/HY zeolite
FeCl3 HY zeolite
LA y
ie
Catalyst
Fig. 1. LA obtained from glucose conversion using different catalysts.
N.A.S. Ramli, N.A.S. Amin / Energy Conversion and Management 95 (2015) 10–19 13
The trend in LA profile implies that number of acid sites togeth-er with Brønsted and Lewis acid sites present in the catalyst sur-face affect the LA production. From the preliminary testing, theLA yield over 15% Fe/HY zeolite was lower compared to 5% Fe/HYand 10% Fe/HY zeolite catalysts. As aforementioned, this mightbe due to the highest Lewis acid sites that promote the formationof humins. Among all the tested catalysts, HY zeolite exhibited thehighest Brønsted acid sites, and yet the LA yield was lower com-pared to the LA yields produced over Fe/HY zeolite catalysts. Thetrend is attributed to the smallest number of acid sites displayedby the HY zeolite. Thus, it is surmised that glucose conversion toLA over Fe/HY zeolite is predominantly influenced by the catalystacidity and active catalytic sites derived from HY zeolite.
The effects of reaction time and catalyst loading have beenbriefly inspected on glucose conversion over 10% Fe/HY zeolite[38]. In order to produce LA, water is need in the reaction system,otherwise 5-HMF may be converted to humins [18]. The effect ofwater to glucose by weight ratio on LA yield was examined.According to Fig. S3, no significant effect of water to glucose ratiohas been detected on LA yield. Thus, constant amount of water(50 ml) was used through out the reactions.
3.2. RSM study for LA production from glucose
3.2.1. Model analysisAccording to the preliminary testing the best catalyst was 10%
Fe/HY zeolite. Thus, 10% Fe/HY zeolite was used in the optimizationof LA yield from glucose conversion. The process was investigatedaccording to BBD (27 batch experiments) and the results are shownin Table 3. The second order polynomial model for LA yield fromglucose conversion using 10% Fe/HY zeolite catalyst is as in Eq. (6):
Yi ¼ �268:933þ 2:555x1 þ 41:133x2 þ 30:533x3 þ 63:1x4
� 0:007x21 � 5x2
2 � 15:95x23 � 9:65x2
4 � 0:005x1x2
þ 0:057x1x3 � 0:183x1x4 � 3:55x2x3 � 4:55x2x4 þ x3x4 ð6Þ
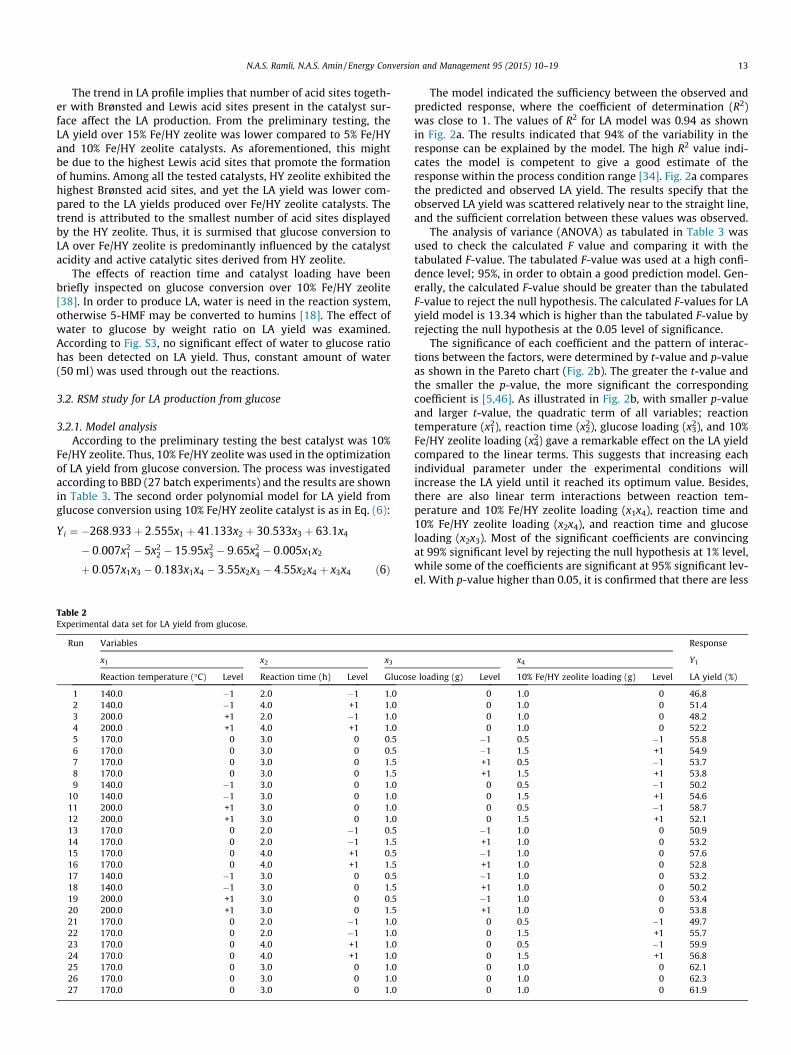
Table 2Experimental data set for LA yield from glucose.
Run Variables
x1 x2 x3
Reaction temperature (�C) Level Reaction time (h) Level Glucos
1 140.0 �1 2.0 �1 1.02 140.0 �1 4.0 +1 1.03 200.0 +1 2.0 �1 1.04 200.0 +1 4.0 +1 1.05 170.0 0 3.0 0 0.56 170.0 0 3.0 0 0.57 170.0 0 3.0 0 1.58 170.0 0 3.0 0 1.59 140.0 �1 3.0 0 1.0
10 140.0 �1 3.0 0 1.011 200.0 +1 3.0 0 1.012 200.0 +1 3.0 0 1.013 170.0 0 2.0 �1 0.514 170.0 0 2.0 �1 1.515 170.0 0 4.0 +1 0.516 170.0 0 4.0 +1 1.517 140.0 �1 3.0 0 0.518 140.0 �1 3.0 0 1.519 200.0 +1 3.0 0 0.520 200.0 +1 3.0 0 1.521 170.0 0 2.0 �1 1.022 170.0 0 2.0 �1 1.023 170.0 0 4.0 +1 1.024 170.0 0 4.0 +1 1.025 170.0 0 3.0 0 1.026 170.0 0 3.0 0 1.027 170.0 0 3.0 0 1.0
The model indicated the sufficiency between the observed andpredicted response, where the coefficient of determination (R2)was close to 1. The values of R2 for LA model was 0.94 as shownin Fig. 2a. The results indicated that 94% of the variability in theresponse can be explained by the model. The high R2 value indi-cates the model is competent to give a good estimate of theresponse within the process condition range [34]. Fig. 2a comparesthe predicted and observed LA yield. The results specify that theobserved LA yield was scattered relatively near to the straight line,and the sufficient correlation between these values was observed.
The analysis of variance (ANOVA) as tabulated in Table 3 wasused to check the calculated F value and comparing it with thetabulated F-value. The tabulated F-value was used at a high confi-dence level; 95%, in order to obtain a good prediction model. Gen-erally, the calculated F-value should be greater than the tabulatedF-value to reject the null hypothesis. The calculated F-values for LAyield model is 13.34 which is higher than the tabulated F-value byrejecting the null hypothesis at the 0.05 level of significance.
The significance of each coefficient and the pattern of interac-tions between the factors, were determined by t-value and p-valueas shown in the Pareto chart (Fig. 2b). The greater the t-value andthe smaller the p-value, the more significant the correspondingcoefficient is [5,46]. As illustrated in Fig. 2b, with smaller p-valueand larger t-value, the quadratic term of all variables; reactiontemperature (x1
2), reaction time (x22), glucose loading (x3
2), and 10%Fe/HY zeolite loading (x4
2) gave a remarkable effect on the LA yieldcompared to the linear terms. This suggests that increasing eachindividual parameter under the experimental conditions willincrease the LA yield until it reached its optimum value. Besides,there are also linear term interactions between reaction tem-perature and 10% Fe/HY zeolite loading (x1x4), reaction time and10% Fe/HY zeolite loading (x2x4), and reaction time and glucoseloading (x2x3). Most of the significant coefficients are convincingat 99% significant level by rejecting the null hypothesis at 1% level,while some of the coefficients are significant at 95% significant lev-el. With p-value higher than 0.05, it is confirmed that there are less
Response
x4 Y1
e loading (g) Level 10% Fe/HY zeolite loading (g) Level LA yield (%)
0 1.0 0 46.80 1.0 0 51.40 1.0 0 48.20 1.0 0 52.2�1 0.5 �1 55.8�1 1.5 +1 54.9+1 0.5 �1 53.7+1 1.5 +1 53.8
0 0.5 �1 50.20 1.5 +1 54.60 0.5 �1 58.70 1.5 +1 52.1�1 1.0 0 50.9+1 1.0 0 53.2�1 1.0 0 57.6+1 1.0 0 52.8�1 1.0 0 53.2+1 1.0 0 50.2�1 1.0 0 53.4+1 1.0 0 53.8
0 0.5 �1 49.70 1.5 +1 55.70 0.5 �1 59.90 1.5 +1 56.80 1.0 0 62.10 1.0 0 62.30 1.0 0 61.9
44 48 52 56 60 64
Observed levulinic acid yield (%)
48
52
56
60
64
Pred
icte
d le
vulin
ic a
cid
yiel
d (%
)
R 2 =0.94
(a)
p-value = 0.05
Standardized Effect Estimate (Absolute Value)
p -value
0.000001 9.756
7.7436.175
5.072
3.7363.688
3.051
2.3802.323
1.607
1.140
0.3350.201
0.019
0.000005
0.843937
0.276550
0.1341070.038565
0.0347320.0100650.003103
0.002843
0.0002740.000048
0.743203
0.984874
x12
x1x 3
x2
x42
x1x 4
x2x 4
x2x 3
x1
x3
x3x 4
x1x 2
x32
x22
x4
(b)
Fig. 2. (a) The coefficient of determination and predicted versus observed LA yield.(b) Pareto chart of LA yield model.
14 N.A.S. Ramli, N.A.S. Amin / Energy Conversion and Management 95 (2015) 10–19
interactions between reaction temperature and glucose loading(x1x3), glucose loading and 10% Fe/HY zeolite loading (x3x4), andreaction temperature and reaction time (x1x2) on the LA yield fromglucose conversion.
3.2.2. Variables effect on the responseThe three-dimensional (3D) response surface plots and contour
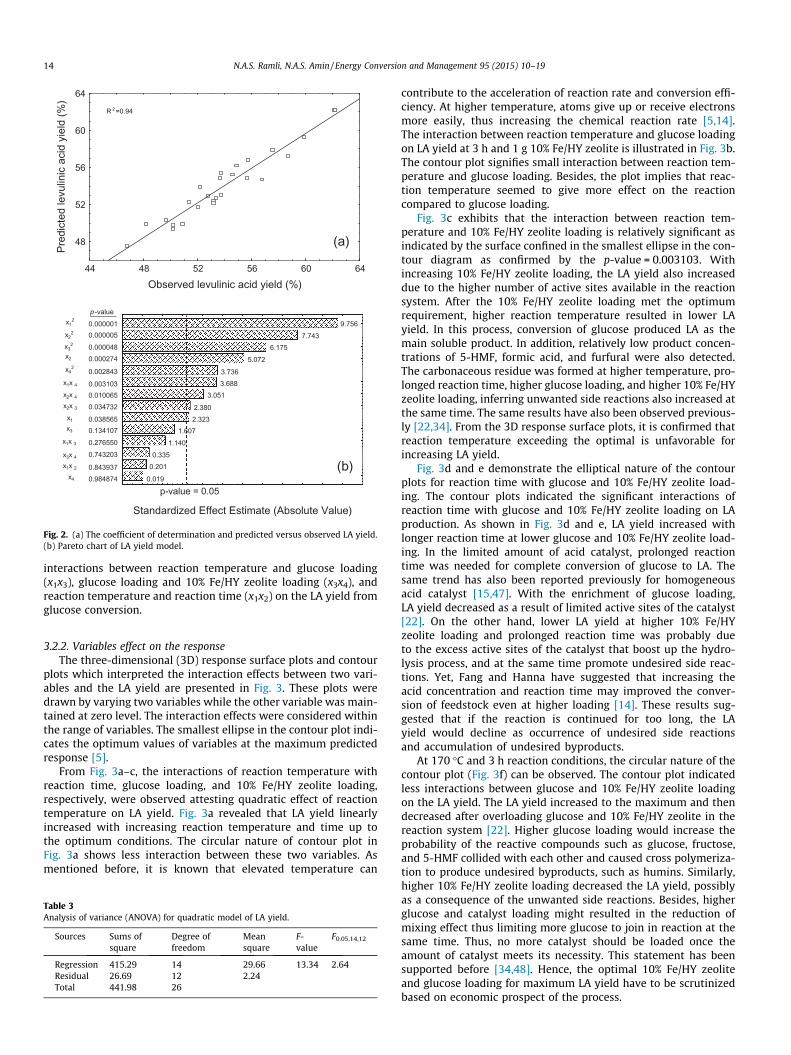
plots which interpreted the interaction effects between two vari-ables and the LA yield are presented in Fig. 3. These plots weredrawn by varying two variables while the other variable was main-tained at zero level. The interaction effects were considered withinthe range of variables. The smallest ellipse in the contour plot indi-cates the optimum values of variables at the maximum predictedresponse [5].
From Fig. 3a–c, the interactions of reaction temperature withreaction time, glucose loading, and 10% Fe/HY zeolite loading,respectively, were observed attesting quadratic effect of reactiontemperature on LA yield. Fig. 3a revealed that LA yield linearlyincreased with increasing reaction temperature and time up tothe optimum conditions. The circular nature of contour plot inFig. 3a shows less interaction between these two variables. Asmentioned before, it is known that elevated temperature can
Table 3Analysis of variance (ANOVA) for quadratic model of LA yield.
Sources Sums ofsquare
Degree offreedom
Meansquare
F-value
F0.05,14,12
Regression 415.29 14 29.66 13.34 2.64Residual 26.69 12 2.24Total 441.98 26
contribute to the acceleration of reaction rate and conversion effi-ciency. At higher temperature, atoms give up or receive electronsmore easily, thus increasing the chemical reaction rate [5,14].The interaction between reaction temperature and glucose loadingon LA yield at 3 h and 1 g 10% Fe/HY zeolite is illustrated in Fig. 3b.The contour plot signifies small interaction between reaction tem-perature and glucose loading. Besides, the plot implies that reac-tion temperature seemed to give more effect on the reactioncompared to glucose loading.
Fig. 3c exhibits that the interaction between reaction tem-perature and 10% Fe/HY zeolite loading is relatively significant asindicated by the surface confined in the smallest ellipse in the con-tour diagram as confirmed by the p-value = 0.003103. Withincreasing 10% Fe/HY zeolite loading, the LA yield also increaseddue to the higher number of active sites available in the reactionsystem. After the 10% Fe/HY zeolite loading met the optimumrequirement, higher reaction temperature resulted in lower LAyield. In this process, conversion of glucose produced LA as themain soluble product. In addition, relatively low product concen-trations of 5-HMF, formic acid, and furfural were also detected.The carbonaceous residue was formed at higher temperature, pro-longed reaction time, higher glucose loading, and higher 10% Fe/HYzeolite loading, inferring unwanted side reactions also increased atthe same time. The same results have also been observed previous-ly [22,34]. From the 3D response surface plots, it is confirmed thatreaction temperature exceeding the optimal is unfavorable forincreasing LA yield.
Fig. 3d and e demonstrate the elliptical nature of the contourplots for reaction time with glucose and 10% Fe/HY zeolite load-ing. The contour plots indicated the significant interactions ofreaction time with glucose and 10% Fe/HY zeolite loading on LAproduction. As shown in Fig. 3d and e, LA yield increased withlonger reaction time at lower glucose and 10% Fe/HY zeolite load-ing. In the limited amount of acid catalyst, prolonged reactiontime was needed for complete conversion of glucose to LA. Thesame trend has also been reported previously for homogeneousacid catalyst [15,47]. With the enrichment of glucose loading,LA yield decreased as a result of limited active sites of the catalyst[22]. On the other hand, lower LA yield at higher 10% Fe/HYzeolite loading and prolonged reaction time was probably dueto the excess active sites of the catalyst that boost up the hydro-lysis process, and at the same time promote undesired side reac-tions. Yet, Fang and Hanna have suggested that increasing theacid concentration and reaction time may improved the conver-sion of feedstock even at higher loading [14]. These results sug-gested that if the reaction is continued for too long, the LAyield would decline as occurrence of undesired side reactionsand accumulation of undesired byproducts.
At 170 �C and 3 h reaction conditions, the circular nature of thecontour plot (Fig. 3f) can be observed. The contour plot indicatedless interactions between glucose and 10% Fe/HY zeolite loadingon the LA yield. The LA yield increased to the maximum and thendecreased after overloading glucose and 10% Fe/HY zeolite in thereaction system [22]. Higher glucose loading would increase theprobability of the reactive compounds such as glucose, fructose,and 5-HMF collided with each other and caused cross polymeriza-tion to produce undesired byproducts, such as humins. Similarly,higher 10% Fe/HY zeolite loading decreased the LA yield, possiblyas a consequence of the unwanted side reactions. Besides, higherglucose and catalyst loading might resulted in the reduction ofmixing effect thus limiting more glucose to join in reaction at thesame time. Thus, no more catalyst should be loaded once theamount of catalyst meets its necessity. This statement has beensupported before [34,48]. Hence, the optimal 10% Fe/HY zeoliteand glucose loading for maximum LA yield have to be scrutinizedbased on economic prospect of the process.
Levu
linic
aci
d yi
eld
(%)
Reaction time (h)
Reaction time (h)
Reaction time (h)
65
60
2.0
210
130150
170190
4.03.6
3.22.8
2.4
55
50
45
40
35
(a)
Levu
linic
aci
d yi
eld
(%)
Reaction temperature (o C)
Reaction temperature (o C)
Reaction temperature (o C)
Glucose loading (g)
Glucose loading (g)
Glucose loading (g)
64
48
40
210
130150
170190
0.60.8
1.01.2
1.4
44
52
56
60
(b)Le
vulin
ic a
cid
yiel
d (%
) 64
40
1.0
0.6
210
130150
170190
0.8
1.21.4
44
48
52
56
60
(c)Le
vulin
ic a
cid
yiel
d (%
) 64
1.4
0.6
4.2
1.82.2
2.63.0
3.43.81.2
1.00.8
44
48
52
56
60
(d)
Levu
linic
aci
d yi
eld
(%)
Catalyst loading (g)
Catalyst loading (g)
Catalyst loading (g)
64
60
56
52
48
1.61.41.41.2
1.21.01.00.8 0.8
0.6 0.60.4
(f)
Levu
linic
aci
d yi
eld
(%) 64
52
48
44
1.21.0
0.6
4.23.8
3.43.0
2.62.2
1.8
0.8
1.4
56
60
(e)
Fig. 3. Response fitted surface area plots of LA yield versus different variables.
N.A.S. Ramli, N.A.S. Amin / Energy Conversion and Management 95 (2015) 10–19 15
3.2.3. Optimization studyBased on the model analysis, the LA yield is forecasted at opti-
mum conditions in order to achieve high LA yield from glucoseconversion. The response surface analysis indicates that the
predicted optimum LA yield from glucose is 62.6% which can beachieved from reaction conducted at 173.4 �C, 3.3 h reaction time,using 0.93 g glucose, and 0.89 g 10% Fe/HY zeolite. Further test wasconducted at the optimum conditions for the confirmation of the
OHO
OH OHOH
OH
O
OH
OH
OH
OH
OH
OH
OH
OH
OH
OH
HOFe
OSi
O
OO
OHO OH
OHOHOH
OHO OH
OHOH
OHO O
OHOH
OHO O
OO
OH
O
OOH
O
1 2 3
456
7 98
10
+ Fe/HY
- Fe/HY
- H2O
tautomerization
- 2H2O
+ 2H2O+
- HCHO
+ Fe/HY
Fig. 4. Proposed reaction mechanism of LA production from glucose over Fe/HY zeolite.
16 N.A.S. Ramli, N.A.S. Amin / Energy Conversion and Management 95 (2015) 10–19
predicted LA yield. The LA yield at optimum conditions is 61.8%indicating 1.3% error between the observed and predicted yield.The error is considered small as the observed value is within the5% significance level.
In this study, LA is the main dehydration product from the glu-cose conversion process using 10% Fe/HY zeolite as catalyst. Yet,other water soluble compounds were also detected such as 5-HMF, formic acid, and furfural. At the optimum conditions, com-plete conversion of glucose was achieved, with 61.8%, 5.7%, 14.3%and 10.4% of LA, 5-HMF, formic acid, and furfural yield, respective-ly. Other by-products could also be generated from the reaction,such as lactic acid, as has been reported previously [23,49].Besides, insoluble black solid residue regarded as humins was alsoobserved in all reactions.
0 100 200 300 400 500 600 7000
20
40
60
80
100
Wei
ght (
wt%
)
Temperature (oC)
Ash
Lignin
Cellulose + hemicellulose
H2O
Fig. 5. Thermal gravimetric analysis of OPF.
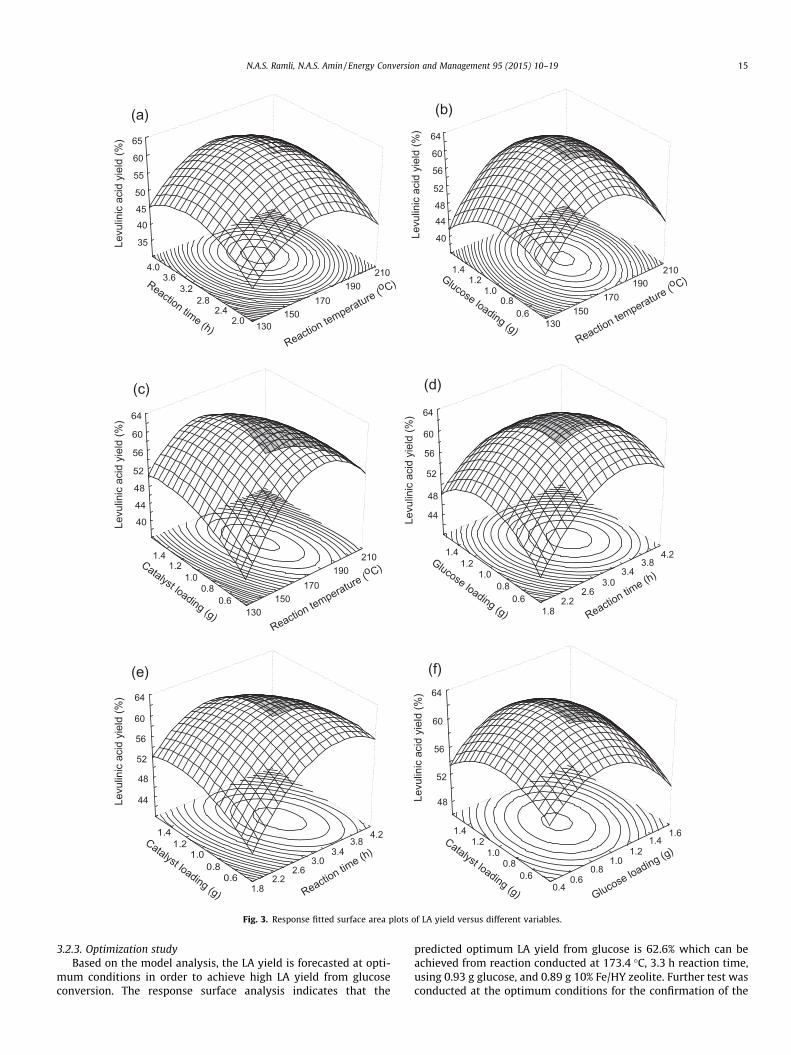
3.3. Proposed mechanism of LA production from glucose using Fe/HYzeolite
A possible mechanism that might take place in LA productionfrom glucose over Fe/HY zeolite catalyst is illustrated in Fig. 4.The reaction was initiated by isomerization of glucose to fructose.The active sites for the isomerization of glucose using Fe/HY zeoliteare Fe atoms incorporated in the zeolite framework. Glucose (1)was converted into open chain form (2) through complex forma-tion with Fe/HY zeolite catalyst. Next, the open chain glucosewas combined with Fe/HY to form an enolate intermediate (3).The enolate was converted into fructose (4) by the release ofFe/HY zeolite. Similarly, few studies have reported that fructosewas produced from glucose through an enediol intermediateaccelerated by the catalyst used [50,51]. The isomerization reac-tion of glucose into fructose might also take place by hydrogentransfer through a hydride shift between carbonyl containing C1
and hydroxyl bearing C2 [52]. The hydride shift is due to the pres-ence of Fe metal in the zeolite framework.
The enolate formation would allow the conversion of glucoseinto fructose, followed by dehydration reaction to produce 5-HMF. A detailed mechanism of fructose dehydration to 5-HMFhas been explained by Caratzoulas and Vlachos [53]. Fructose (4)discharged one water molecule to form fructofuranosyloxocarbeni-um, then this oxocarbenium ion discharge H+ to form enolic com-pound (5) [51]. The enolic compound undergoes tautomerizationbefore elimination of two water molecules to form 5-HMF (7). 5-HMF was then rehydrated with the presence of water in the sys-tem. A thorough mechanism of 5-HMF rehydration was previouslyenlightened [54]. The final products of the rehydration reaction of5-HMF are LA (8) and formic acid (9). Furfural (10) might form inthe product mixture by the lost of formaldehyde from 5-HMF com-pound. The presence of LA, 5-HMF, formic acid, and furfural detect-ed in the reaction product has supported the proposed reactionmechanism.
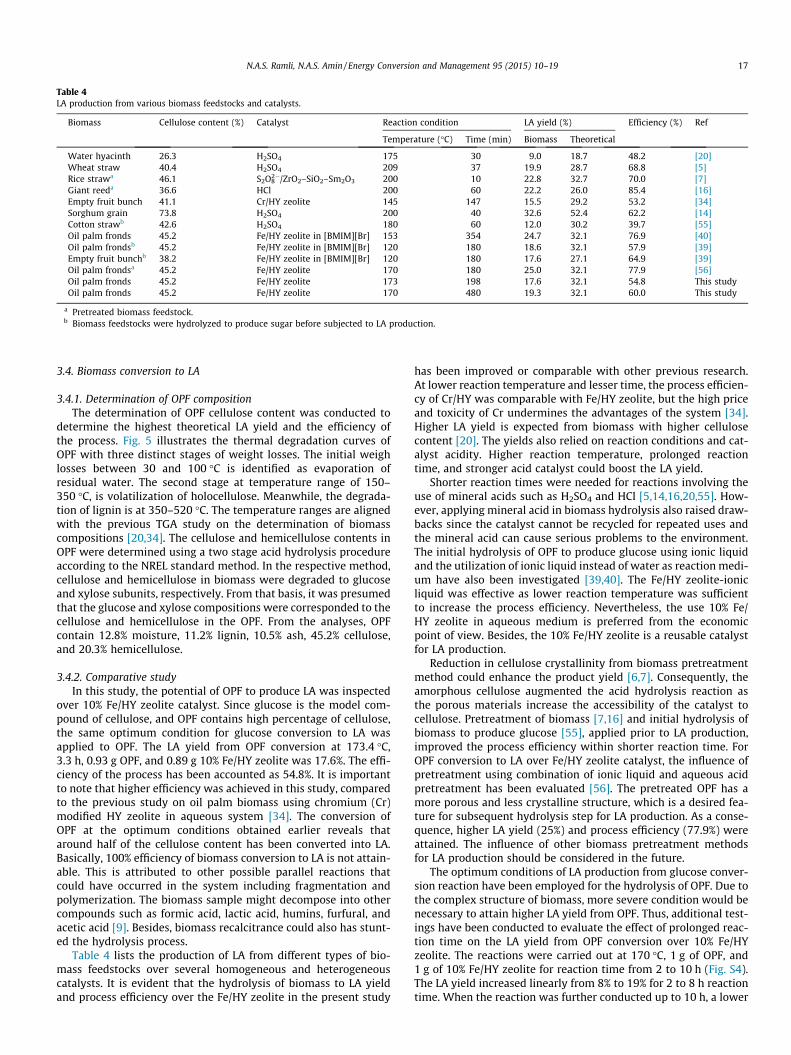
Table 4LA production from various biomass feedstocks and catalysts.
Biomass Cellulose content (%) Catalyst Reaction condition LA yield (%) Efficiency (%) Ref
Temperature (�C) Time (min) Biomass Theoretical
Water hyacinth 26.3 H2SO4 175 30 9.0 18.7 48.2 [20]Wheat straw 40.4 H2SO4 209 37 19.9 28.7 68.8 [5]Rice strawa 46.1 S2O8
2�/ZrO2–SiO2–Sm2O3 200 10 22.8 32.7 70.0 [7]Giant reeda 36.6 HCl 200 60 22.2 26.0 85.4 [16]Empty fruit bunch 41.1 Cr/HY zeolite 145 147 15.5 29.2 53.2 [34]Sorghum grain 73.8 H2SO4 200 40 32.6 52.4 62.2 [14]Cotton strawb 42.6 H2SO4 180 60 12.0 30.2 39.7 [55]Oil palm fronds 45.2 Fe/HY zeolite in [BMIM][Br] 153 354 24.7 32.1 76.9 [40]Oil palm frondsb 45.2 Fe/HY zeolite in [BMIM][Br] 120 180 18.6 32.1 57.9 [39]Empty fruit bunchb 38.2 Fe/HY zeolite in [BMIM][Br] 120 180 17.6 27.1 64.9 [39]Oil palm frondsa 45.2 Fe/HY zeolite 170 180 25.0 32.1 77.9 [56]Oil palm fronds 45.2 Fe/HY zeolite 173 198 17.6 32.1 54.8 This studyOil palm fronds 45.2 Fe/HY zeolite 170 480 19.3 32.1 60.0 This study
a Pretreated biomass feedstock.b Biomass feedstocks were hydrolyzed to produce sugar before subjected to LA production.
N.A.S. Ramli, N.A.S. Amin / Energy Conversion and Management 95 (2015) 10–19 17
3.4. Biomass conversion to LA
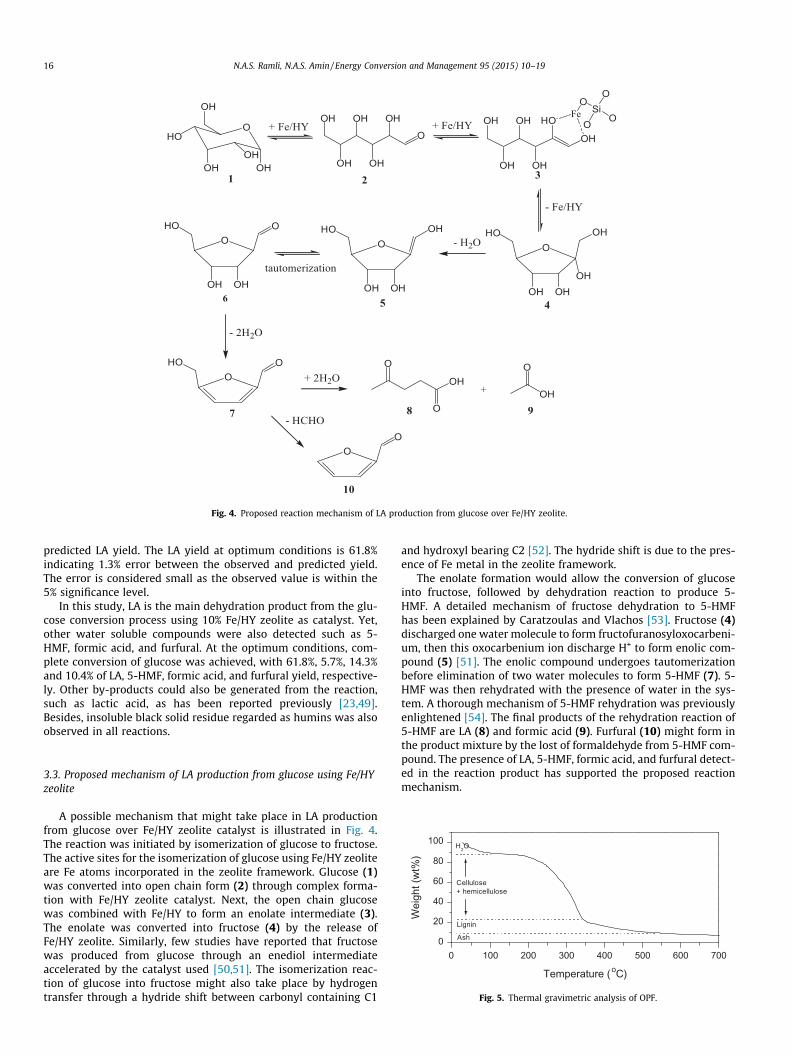
3.4.1. Determination of OPF compositionThe determination of OPF cellulose content was conducted to
determine the highest theoretical LA yield and the efficiency ofthe process. Fig. 5 illustrates the thermal degradation curves ofOPF with three distinct stages of weight losses. The initial weighlosses between 30 and 100 �C is identified as evaporation ofresidual water. The second stage at temperature range of 150–350 �C, is volatilization of holocellulose. Meanwhile, the degrada-tion of lignin is at 350–520 �C. The temperature ranges are alignedwith the previous TGA study on the determination of biomasscompositions [20,34]. The cellulose and hemicellulose contents inOPF were determined using a two stage acid hydrolysis procedureaccording to the NREL standard method. In the respective method,cellulose and hemicellulose in biomass were degraded to glucoseand xylose subunits, respectively. From that basis, it was presumedthat the glucose and xylose compositions were corresponded to thecellulose and hemicellulose in the OPF. From the analyses, OPFcontain 12.8% moisture, 11.2% lignin, 10.5% ash, 45.2% cellulose,and 20.3% hemicellulose.
3.4.2. Comparative studyIn this study, the potential of OPF to produce LA was inspected
over 10% Fe/HY zeolite catalyst. Since glucose is the model com-pound of cellulose, and OPF contains high percentage of cellulose,the same optimum condition for glucose conversion to LA wasapplied to OPF. The LA yield from OPF conversion at 173.4 �C,3.3 h, 0.93 g OPF, and 0.89 g 10% Fe/HY zeolite was 17.6%. The effi-ciency of the process has been accounted as 54.8%. It is importantto note that higher efficiency was achieved in this study, comparedto the previous study on oil palm biomass using chromium (Cr)modified HY zeolite in aqueous system [34]. The conversion ofOPF at the optimum conditions obtained earlier reveals thataround half of the cellulose content has been converted into LA.Basically, 100% efficiency of biomass conversion to LA is not attain-able. This is attributed to other possible parallel reactions thatcould have occurred in the system including fragmentation andpolymerization. The biomass sample might decompose into othercompounds such as formic acid, lactic acid, humins, furfural, andacetic acid [9]. Besides, biomass recalcitrance could also has stunt-ed the hydrolysis process.
Table 4 lists the production of LA from different types of bio-mass feedstocks over several homogeneous and heterogeneouscatalysts. It is evident that the hydrolysis of biomass to LA yieldand process efficiency over the Fe/HY zeolite in the present study
has been improved or comparable with other previous research.At lower reaction temperature and lesser time, the process efficien-cy of Cr/HY was comparable with Fe/HY zeolite, but the high priceand toxicity of Cr undermines the advantages of the system [34].Higher LA yield is expected from biomass with higher cellulosecontent [20]. The yields also relied on reaction conditions and cat-alyst acidity. Higher reaction temperature, prolonged reactiontime, and stronger acid catalyst could boost the LA yield.
Shorter reaction times were needed for reactions involving theuse of mineral acids such as H2SO4 and HCl [5,14,16,20,55]. How-ever, applying mineral acid in biomass hydrolysis also raised draw-backs since the catalyst cannot be recycled for repeated uses andthe mineral acid can cause serious problems to the environment.The initial hydrolysis of OPF to produce glucose using ionic liquidand the utilization of ionic liquid instead of water as reaction medi-um have also been investigated [39,40]. The Fe/HY zeolite-ionicliquid was effective as lower reaction temperature was sufficientto increase the process efficiency. Nevertheless, the use 10% Fe/HY zeolite in aqueous medium is preferred from the economicpoint of view. Besides, the 10% Fe/HY zeolite is a reusable catalystfor LA production.
Reduction in cellulose crystallinity from biomass pretreatmentmethod could enhance the product yield [6,7]. Consequently, theamorphous cellulose augmented the acid hydrolysis reaction asthe porous materials increase the accessibility of the catalyst tocellulose. Pretreatment of biomass [7,16] and initial hydrolysis ofbiomass to produce glucose [55], applied prior to LA production,improved the process efficiency within shorter reaction time. ForOPF conversion to LA over Fe/HY zeolite catalyst, the influence ofpretreatment using combination of ionic liquid and aqueous acidpretreatment has been evaluated [56]. The pretreated OPF has amore porous and less crystalline structure, which is a desired fea-ture for subsequent hydrolysis step for LA production. As a conse-quence, higher LA yield (25%) and process efficiency (77.9%) wereattained. The influence of other biomass pretreatment methodsfor LA production should be considered in the future.
The optimum conditions of LA production from glucose conver-sion reaction have been employed for the hydrolysis of OPF. Due tothe complex structure of biomass, more severe condition would benecessary to attain higher LA yield from OPF. Thus, additional test-ings have been conducted to evaluate the effect of prolonged reac-tion time on the LA yield from OPF conversion over 10% Fe/HYzeolite. The reactions were carried out at 170 �C, 1 g of OPF, and1 g of 10% Fe/HY zeolite for reaction time from 2 to 10 h (Fig. S4).The LA yield increased linearly from 8% to 19% for 2 to 8 h reactiontime. When the reaction was further conducted up to 10 h, a lower
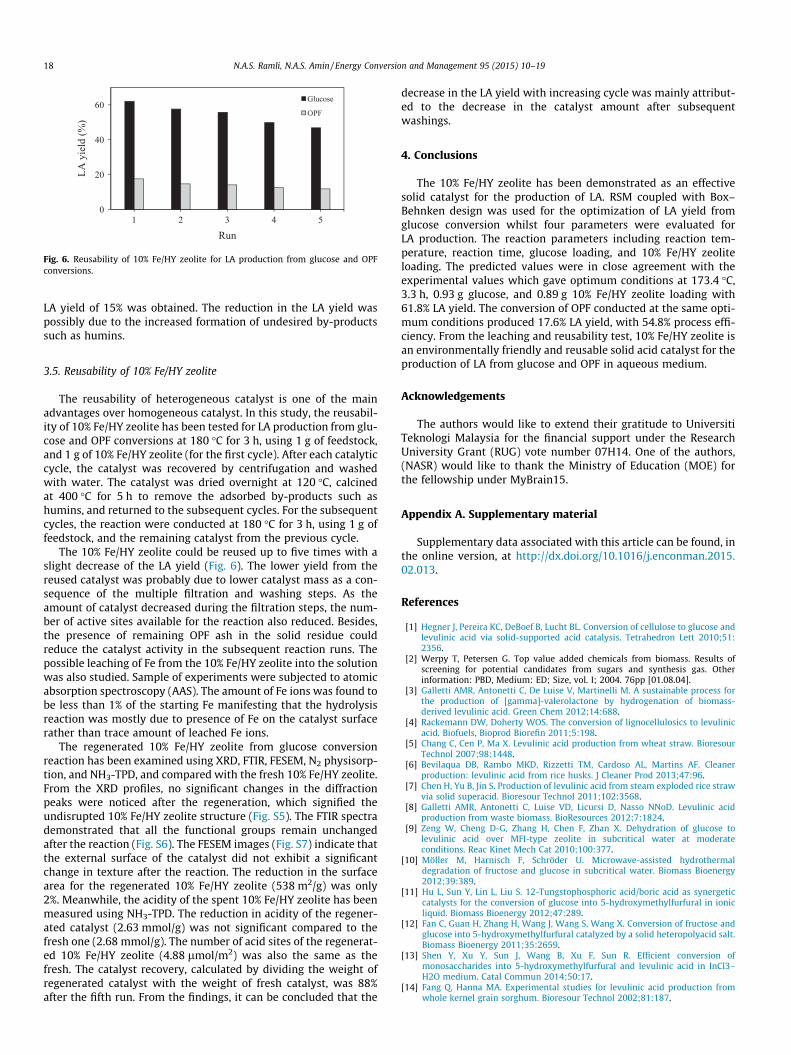
0
20
40
60
1 2 3 4 5
LA y
ield
(%)
Run
Glucose
OPF
Fig. 6. Reusability of 10% Fe/HY zeolite for LA production from glucose and OPFconversions.
18 N.A.S. Ramli, N.A.S. Amin / Energy Conversion and Management 95 (2015) 10–19
LA yield of 15% was obtained. The reduction in the LA yield waspossibly due to the increased formation of undesired by-productssuch as humins.
3.5. Reusability of 10% Fe/HY zeolite
The reusability of heterogeneous catalyst is one of the mainadvantages over homogeneous catalyst. In this study, the reusabil-ity of 10% Fe/HY zeolite has been tested for LA production from glu-cose and OPF conversions at 180 �C for 3 h, using 1 g of feedstock,and 1 g of 10% Fe/HY zeolite (for the first cycle). After each catalyticcycle, the catalyst was recovered by centrifugation and washedwith water. The catalyst was dried overnight at 120 �C, calcinedat 400 �C for 5 h to remove the adsorbed by-products such ashumins, and returned to the subsequent cycles. For the subsequentcycles, the reaction were conducted at 180 �C for 3 h, using 1 g offeedstock, and the remaining catalyst from the previous cycle.
The 10% Fe/HY zeolite could be reused up to five times with aslight decrease of the LA yield (Fig. 6). The lower yield from thereused catalyst was probably due to lower catalyst mass as a con-sequence of the multiple filtration and washing steps. As theamount of catalyst decreased during the filtration steps, the num-ber of active sites available for the reaction also reduced. Besides,the presence of remaining OPF ash in the solid residue couldreduce the catalyst activity in the subsequent reaction runs. Thepossible leaching of Fe from the 10% Fe/HY zeolite into the solutionwas also studied. Sample of experiments were subjected to atomicabsorption spectroscopy (AAS). The amount of Fe ions was found tobe less than 1% of the starting Fe manifesting that the hydrolysisreaction was mostly due to presence of Fe on the catalyst surfacerather than trace amount of leached Fe ions.
The regenerated 10% Fe/HY zeolite from glucose conversionreaction has been examined using XRD, FTIR, FESEM, N2 physisorp-tion, and NH3-TPD, and compared with the fresh 10% Fe/HY zeolite.From the XRD profiles, no significant changes in the diffractionpeaks were noticed after the regeneration, which signified theundisrupted 10% Fe/HY zeolite structure (Fig. S5). The FTIR spectrademonstrated that all the functional groups remain unchangedafter the reaction (Fig. S6). The FESEM images (Fig. S7) indicate thatthe external surface of the catalyst did not exhibit a significantchange in texture after the reaction. The reduction in the surfacearea for the regenerated 10% Fe/HY zeolite (538 m2/g) was only2%. Meanwhile, the acidity of the spent 10% Fe/HY zeolite has beenmeasured using NH3-TPD. The reduction in acidity of the regener-ated catalyst (2.63 mmol/g) was not significant compared to thefresh one (2.68 mmol/g). The number of acid sites of the regenerat-ed 10% Fe/HY zeolite (4.88 lmol/m2) was also the same as thefresh. The catalyst recovery, calculated by dividing the weight ofregenerated catalyst with the weight of fresh catalyst, was 88%after the fifth run. From the findings, it can be concluded that the
decrease in the LA yield with increasing cycle was mainly attribut-ed to the decrease in the catalyst amount after subsequentwashings.
4. Conclusions
The 10% Fe/HY zeolite has been demonstrated as an effectivesolid catalyst for the production of LA. RSM coupled with Box–Behnken design was used for the optimization of LA yield fromglucose conversion whilst four parameters were evaluated forLA production. The reaction parameters including reaction tem-perature, reaction time, glucose loading, and 10% Fe/HY zeoliteloading. The predicted values were in close agreement with theexperimental values which gave optimum conditions at 173.4 �C,3.3 h, 0.93 g glucose, and 0.89 g 10% Fe/HY zeolite loading with61.8% LA yield. The conversion of OPF conducted at the same opti-mum conditions produced 17.6% LA yield, with 54.8% process effi-ciency. From the leaching and reusability test, 10% Fe/HY zeolite isan environmentally friendly and reusable solid acid catalyst for theproduction of LA from glucose and OPF in aqueous medium.
Acknowledgements
The authors would like to extend their gratitude to UniversitiTeknologi Malaysia for the financial support under the ResearchUniversity Grant (RUG) vote number 07H14. One of the authors,(NASR) would like to thank the Ministry of Education (MOE) forthe fellowship under MyBrain15.
Appendix A. Supplementary material
Supplementary data associated with this article can be found, inthe online version, at http://dx.doi.org/10.1016/j.enconman.2015.02.013.
References
[1] Hegner J, Pereira KC, DeBoef B, Lucht BL. Conversion of cellulose to glucose andlevulinic acid via solid-supported acid catalysis. Tetrahedron Lett 2010;51:2356.
[2] Werpy T, Petersen G. Top value added chemicals from biomass. Results ofscreening for potential candidates from sugars and synthesis gas. Otherinformation: PBD, Medium: ED; Size, vol. I; 2004. 76pp [01.08.04].
[3] Galletti AMR, Antonetti C, De Luise V, Martinelli M. A sustainable process forthe production of [gamma]-valerolactone by hydrogenation of biomass-derived levulinic acid. Green Chem 2012;14:688.
[4] Rackemann DW, Doherty WOS. The conversion of lignocellulosics to levulinicacid. Biofuels, Bioprod Biorefin 2011;5:198.
[5] Chang C, Cen P, Ma X. Levulinic acid production from wheat straw. BioresourTechnol 2007;98:1448.
[6] Bevilaqua DB, Rambo MKD, Rizzetti TM, Cardoso AL, Martins AF. Cleanerproduction: levulinic acid from rice husks. J Cleaner Prod 2013;47:96.
[7] Chen H, Yu B, Jin S. Production of levulinic acid from steam exploded rice strawvia solid superacid. Bioresour Technol 2011;102:3568.
[8] Galletti AMR, Antonetti C, Luise VD, Licursi D, Nasso NNoD. Levulinic acidproduction from waste biomass. BioResources 2012;7:1824.
[9] Zeng W, Cheng D-G, Zhang H, Chen F, Zhan X. Dehydration of glucose tolevulinic acid over MFI-type zeolite in subcritical water at moderateconditions. Reac Kinet Mech Cat 2010;100:377.
[10] Möller M, Harnisch F, Schröder U. Microwave-assisted hydrothermaldegradation of fructose and glucose in subcritical water. Biomass Bioenergy2012;39:389.
[11] Hu L, Sun Y, Lin L, Liu S. 12-Tungstophosphoric acid/boric acid as synergeticcatalysts for the conversion of glucose into 5-hydroxymethylfurfural in ionicliquid. Biomass Bioenergy 2012;47:289.
[12] Fan C, Guan H, Zhang H, Wang J, Wang S, Wang X. Conversion of fructose andglucose into 5-hydroxymethylfurfural catalyzed by a solid heteropolyacid salt.Biomass Bioenergy 2011;35:2659.
[13] Shen Y, Xu Y, Sun J, Wang B, Xu F, Sun R. Efficient conversion ofmonosaccharides into 5-hydroxymethylfurfural and levulinic acid in InCl3–H2O medium. Catal Commun 2014;50:17.
[14] Fang Q, Hanna MA. Experimental studies for levulinic acid production fromwhole kernel grain sorghum. Bioresour Technol 2002;81:187.
N.A.S. Ramli, N.A.S. Amin / Energy Conversion and Management 95 (2015) 10–19 19
[15] Kang M, Kim SW, Kim J-W, Kim TH, Kim JS. Optimization of levulinic acidproduction from Gelidium amansii. Renewable Energy 2013;54:173.
[16] Raspolli Galletti AM, Antonetti C, Ribechini E, Colombini MP, Nassi o Di NassoN, Bonari E. From giant reed to levulinic acid and gamma-valerolactone: a highyield catalytic route to valeric biofuels. Appl Energy 2013;102:157.
[17] Kupiainen L, Ahola J, Tanskanen J. Kinetics of glucose decomposition in formicacid. Chem Eng Res Des 2011;89:2706.
[18] Yan L, Yang N, Pang H, Liao B. Production of levulinic acid from bagasse andpaddy straw by liquefaction in the presence of hydrochloride acid. CLEAN –Soil, Air, Water 2008;36:158.
[19] Hayes DJ, Fitzpatrick S, Hayes MHB, Ross JRH. The biofine process – productionof levulinic acid, furfural, and formic acid from lignocellulosic feedstocks.Biorefineries-industrial processes and products. Wiley-VCH Verlag GmbH;2008. p. 139.
[20] Girisuta B, Danon B, Manurung R, Janssen LPBM, Heeres HJ. Experimental andkinetic modelling studies on the acid-catalysed hydrolysis of the waterhyacinth plant to levulinic acid. Bioresour Technol 2008;99:8367.
[21] Li H, Govind KS, Kotni R, Shunmugavel S, Riisager A, Yang S. Direct catalytictransformation of carbohydrates into 5-ethoxymethylfurfural with acid–basebifunctional hybrid nanospheres. Energy Convers Manage 2014;88:1245.
[22] Peng L, Lin L, Zhang J, Zhuang J, Zhang B, Gong Y. Catalytic conversion ofcellulose to levulinic acid by metal chlorides. Molecules 2010;15:5258.
[23] Weingarten R, Kim YT, Tompsett GA, Fernández A, Han KS, Hagaman EW, et al.Conversion of glucose into levulinic acid with solid metal(IV) phosphatecatalysts. J Catal 2013;304:123.
[24] Jae J, Tompsett GA, Foster AJ, Hammond KD, Auerbach SM, Lobo RF, et al.Investigation into the shape selectivity of zeolite catalysts for biomassconversion. J Catal 2011;279:257.
[25] Xavier NM, Lucas SD, Rauter AP. Zeolites as efficient catalysts for keytransformations in carbohydrate chemistry. J Mol Catal A: Chem 2009;305:84.
[26] Li Z, Xie K, Slade RCT. Studies of the interaction between CuCl and HY zeolitefor preparing heterogeneous CuI catalyst. Appl Catal A 2001;209:107.
[27] Hu L, Sun Y, Lin L. Efficient conversion of glucose into 5-hydroxymethylfurfuralby Chromium(III) chloride in inexpensive ionic liquid. Ind Eng Chem Res2011;51:1099.
[28] Tan M, Zhao L, Zhang Y. Production of 5-hydroxymethyl furfural from cellulosein CrCl2/Zeolite/BMIMCl system. Biomass Bioenergy 2011;35:1367.
[29] Yuan Z, Xu C, Cheng S, Leitch M. Catalytic conversion of glucose to 5-hydroxymethyl furfural using inexpensive co-catalysts and solvents.Carbohydr Res 2011;346:2019.
[30] Wang S, Du Y, Zhang W, Cheng X, Wang J. Catalytic conversion of cellulose into5-hydroxymethylfurfural over chromium trichloride in ionic liquid. Korean JChem Eng 2014;31:1786.
[31] Wang S, Du Y, Zhang P, Cheng X, Qu Y. One-pot synthesis of 5-hydroxymethylfurfural directly from cottonseed hull biomass usingchromium (III) chloride in ionic liquid. Korean J Chem Eng 2014;31:2286.
[32] Mao L, Zhang L, Gao N, Li A. Seawater-based furfural production via corncobhydrolysis catalyzed by FeCl3 in acetic acid steam. Green Chem 2013;15:727.
[33] Cornell JA. How to apply response surface methodology. American Society forQuality Control; 1990.
[34] Ya’aini N, Amin NAS, Asmadi M. Optimization of levulinic acid fromlignocellulosic biomass using a new hybrid catalyst. Bioresour Technol2012;116:58.
[35] Yu XC, Sun DL, Li XS. Preparation of levulinic acid using cellulase and solid acidsynergistic hydrolysis for rice straw. Asian J Chem 2010;22:7113.
[36] Zhou C, Yu X, Ma H, He R, Vittayapadung S. Optimization on the conversion ofbamboo shoot shell to levulinic acid with environmentally benign acidic ionicliquid and response surface analysis. Chin J Chem Eng 2013;21:544.
[37] Ya’aini N, Amin NAS, Endud S. Characterization and performance of hybridcatalysts for levulinic acid production from glucose. Microporous MesoporousMater 2013;171:14.
[38] Ramli NAS, Amin NAS. Fe/HY zeolite as an effective catalyst for levulinic acidproduction from glucose: characterization and catalytic performance. ApplCatal B 2015;163:487.
[39] Ramli NAS, Amin NAS. Catalytic hydrolysis of cellulose and oil palm biomass inionic liquid to reducing sugar for levulinic acid production. Fuel ProcessTechnol 2014;128:490.
[40] Ramli NAS, Amin NAS. Catalytic conversion of oil palm fronds to levulinic acidin ionic liquid. Appl. Mech. Mater. 2014;625:361.
[41] Carrier M, Loppinet-Serani A, Denux D, Lasnier J-M, Ham-Pichavant F, CansellF, et al. Thermogravimetric analysis as a new method to determine thelignocellulosic composition of biomass. Biomass Bioenergy 2011;35:298.
[42] Laboratory NRE. Chemical analysis and testing standard procedure. Golden Co,National Renewable Energy Laboratory (NREL), No. 002-005; 1996.
[43] Weingarten R, Tompsett GA, Conner Jr WC, Huber GW. Design of solid acidcatalysts for aqueous-phase dehydration of carbohydrates: the role of Lewisand Brønsted acid sites. J Catal 2011;279:174.
[44] Jiménez-Morales I, Teckchandani-Ortiz A, Santamaría-González J, Maireles-Torres P, Jiménez-López A. Selective dehydration of glucose to 5-hydroxymethylfurfural on acidic mesoporous tantalum phosphate. ApplCatal B 2014;144:22.
[45] Jiménez-Morales I, Moreno-Recio M, Santamaría-González J, Maireles-TorresP, Jiménez-López A. Mesoporous tantalum oxide as catalyst for dehydration ofglucose to 5-hydroxymethylfurfural. Appl Catal B 2014;154–155:190.
[46] Wan Omar WNN WNN, Saidina Amin NA. Optimization of heterogeneousbiodiesel production from waste cooking palm oil via response surfacemethodology. Biomass Bioenergy 2011;35:1329.
[47] Cha JY, Hanna MA. Levulinic acid production based on extrusion andpressurized batch reaction. Ind Crops Prod 2002;16:109.
[48] Li Y, Liu H, Song C, Gu X, Li H, Zhu W, et al. The dehydration of fructose to 5-hydroxymethylfurfural efficiently catalyzed by acidic ion-exchange resin inionic liquid. Bioresour Technol 2013;133:347.
[49] Chambon F, Rataboul F, Pinel C, Cabiac A, Guillon E, Essayem N. Cellulosehydrothermal conversion promoted by heterogeneous Brønsted and Lewisacids: Remarkable efficiency of solid Lewis acids to produce lactic acid. ApplCatal B 2011;105:171.
[50] Zhao H, Holladay JE, Brown H, Zhang C. Metal chlorides in ionic liquid solventsconvert sugars to 5-hydroxymethylfurfural. Science 2007;316:1597.
[51] Utami SP, Amin NS. Optimization of glucose conversion to 5-hydroxymethylfulfural using [BMIM]Cl with ytterbium triflate. Ind CropsProd 2013;41:64.
[52] Román-Leshkov Y, Moliner M, Labinger JA, Davis ME. Mechanism of glucoseisomerization using a solid lewis acid catalyst in water. Angew Chem Int Ed2010;49:8954.
[53] Caratzoulas S, Vlachos DG. Converting fructose to 5-hydroxymethylfurfural: aquantum mechanics/molecular mechanics study of the mechanism andenergetics. Carbohydr Res 2011;346:664.
[54] Horvat J, Klaic B, Metelko B, Šunjic V. Mechanism of levulinic acid formation.Tetrahedron Lett 1985;26:2111.
[55] Yang Z, Kang H, Guo Y, Zhuang G, Bai Z, Zhang H, et al. Dilute-acid conversionof cotton straw to sugars and levulinic acid via 2-stage hydrolysis. Ind CropsProd 2013;46:205.
[56] Ramli NAS, Amin NAS. Optimization of oil palm fronds pretreatment usingionic liquid for levulinic acid production. Jurnal Teknologi 2014;71:33.
Related Documents