Optimization of Pressure Swing Adsorption and Fractionated Vacuum Pressure Swing Adsorption Processes for CO 2 Sequestration Daeho Ko 1) , Ranjani Siriwardane 2) and Lorenz T. Biegler 1) 1) Department of Chemical Engineering Carnegie Mellon University Pittsburgh, PA 15213 2) National Energy Technology Laboratory U.S. Department of Energy Morgantown, WV 26507 Key words: optimization, PSA, FVPSA, CO 2 sequestration, cyclic steady state Prepared for Presentation at the 2004 AIChE Annual Meeting, Austin Convention Center Austin, TX, November 7-12 PSA/TSA Copyright © Daeho Ko, Ranjani V. Siriwardane, and Lorenz T. Biegler November 2004 Unpublished AIChE shall not be responsible for statements or opinions contained in papers or printed in its publications

Welcome message from author
This document is posted to help you gain knowledge. Please leave a comment to let me know what you think about it! Share it to your friends and learn new things together.
Transcript

Optimization of Pressure Swing Adsorption and Fractionated Vacuum Pressure Swing Adsorption Processes for CO2 Sequestration
Daeho Ko1), Ranjani Siriwardane2) and Lorenz T. Biegler1)
1) Department of Chemical Engineering
Carnegie Mellon University
Pittsburgh, PA 15213
2) National Energy Technology Laboratory
U.S. Department of Energy
Morgantown, WV 26507
Key words: optimization, PSA, FVPSA, CO2 sequestration, cyclic steady state Prepared for Presentation at the 2004 AIChE Annual Meeting, Austin Convention Center Austin, TX, November 7-12 PSA/TSA Copyright © Daeho Ko, Ranjani V. Siriwardane, and Lorenz T. Biegler November 2004 Unpublished AIChE shall not be responsible for statements or opinions contained in papers or printed in its publications

Abstract
This work focuses on the optimization of cyclic adsorption processes to improve the performance of CO2 sequestration from flue gas consisting of nitrogen and carbon dioxide. The adopted processes are the PSA (pressure swing adsorption) process and the FVPSA (fractionated vacuum pressure swing adsorption) process, which is modified from the FVSA (fractionated vacuum swing adsorption) process developed by Air Products and Chemicals, Inc. The systems adopt zeolite13x as an adsorbent. The high temperature PSA is better for high purity of the sequestered product (CO2) and the high temperature FVPSA is much better than the normal temperature PSA processes. The main goal of this study is to improve purities of both components (nitrogen and carbon dioxide). The Langmuir isotherm parameters were calculated from the experimental data of NETL [1]. To perform optimization work more efficiently, we modified the previous optimization method by Ko et al. [2, 3] and obtained the optimization results with more accurate cyclic steady states (CSS) and better convergence as well as faster computation. As a result, the optimal conditions at CSS are found for these systems.

1. Introduction
As discussed in [4, 5], almost 42 % of industrial CO2 emissions are from energy conversion. Because the CO2 accumulation of green house gases may seriously affect the global climate, efficient sequestration of carbon dioxide is very important. One way to mitigate CO2 accumulation in the air is to capture CO2 from the emission sources and inject it into the ocean [6]. Gas absorption has been used to recover CO2; however, this process is energy-consuming for the regeneration of solvent and has corrosion problems [7]. Recently, gas-solid adsorption processes may be applicable for the removal of CO2 from power plant flue gas. A few cyclic adsorption processes are used commercially for the regeneration of CO2 [8]. In pressure swing adsorption (PSA) and vacuum pressure swing adsorption (VPSA), the adsorbent is regenerated by decreasing the total or partial pressure. Thermal (or temperature) swing adsorption (TSA) regenerates the sorbent by increasing temperature. PSA processes have been suggested as an energy saving process and as an alternative to traditional separations, distillation and absorption [3], for bulk gas separations such as CO2 sequestration. To dispose of CO2 to the ocean or depleted oil fields, CO2 needs to be highly concentrated [7]. In this sense, PSA or VPSA processes may be useful for the CO2 concentration. The PSA operation has initially adopted the steps of the classical Skarstrom cycle [9]: pressurization with feed, adsorption with high pressure, depressurization, and purge. In the 1960s, a pressure equalization step was suggested to save repressurization energy after the purge step [10, 11, 12]. Since the 1980s, VSA has also been attractive in enhancing regeneration efficiency [13, 14, 15]. Among the many applications of PSA processes, the production of top product- and bottom product-enriched gases from feed gas is very important, but almost all the PSA processes produce only top product- or bottom product-enriched gases. This characteristic is based on the following reasons [16]. First, the total concentration of the strong adsorbate in the bed is not high, as the strong species is in the void space of the adsorbent. The released vent gas has only a high concentration of weak adsorbate, which is discarded. Consequently, in these PSA processes, only one product-enriched stream is produced at the feeding step. Air Products resolved this problem by using vacuum swing adsorption (VSA) process. The key technology of the VSA in air separation is to introduce a nitrogen-rinse step after the air adsorption step [17]. Moreover, in the 1990s, a fractionated vacuum swing adsorption (FVSA) process was developed by Air Products, which simultaneously produces a 98+% nitrogen-enriched gas and an 80-90% oxygen-enriched gas from ambient air [16, 18]. The FVSA process studied is a dual-bed four-step process which simultaneously produces concentrated oxygen and nitrogen with ambient air as the feed [16, 18].
Our previous work [3] treated the optimization of PSA to remove CO2 and obtained a high N2 purity; however, the previous model needs to be updated because its CO2 purity was not high. So the current work adopts a new isotherm data ranging from 303.15K to 390.15K and optimizes three types of adsorption processes: a normal temperature PSA, a high temperature PSA and a modified

fractionated vacuum pressure swing adsorption (FVPSA) process, based on the FVSA concept, to improve the CO2 purity as well as N2 purity. The PSA operation adopts a Skarstrom cycle and the modified FVPSA operation consists of four steps: pressurization, adsorption, cocurrent blowdown and countercurrent regeneration. In FVPSA nitrogen is produced at the top of the bed during the adsorption and cocurrent blowdown steps, and carbon dioxide is obtained at the bottom of the bed during the countercurrent regeneration step. To calculate the gas velocity of the boundary during the pressure change step, valve equations are used [19]. This study presents an updated PSA optimization method from the previous one, called tailored single discretization (TSD) developed by Ko et al. (2002 and 2003) [2, 3], and performs the optimizations of the PSA and FVPSA processes.
2. Operations of target processes and the model equations
2.1 Target processes. The target processes are the PSA which is similar to the previous work [3] and FVPSA that is modified from the FVSA of Air Products. The adsorbent is zeolite13x and the feed gas consists of 85% nitrogen and 15% carbon dioxide. The parameters for the adsorption model are shown in Table 1. The operation cycles of the processes are shown in Figure 1.
The previous work [3] explains the PSA operation adopted in this study: (1) Pressurization step with feed gas at high pressure, (2) Adsorption step with feed gas producing N2 at the top of the bed, (3) Depressurization step to atmospheric pressure (around 1atm)
emitting the CO2 at the bottom of the bed, and (4) Purge step with the carrier gas (pure N2) at atmospheric pressure
(around 1atm) regenerating CO2 from the adsorbent.

(a) PSA operation: Skarstrom cycle (b) FVPSA operation
Figure 1. Four-step operation of PSA and FVPSA processes
The FVPSA operation also consists of four steps: (1) Pressurization step with feed at high pressure, (2) Adsorption step with feed at high pressure producing N2, (3) Cocurrent blowdown step (product purge step) at medium pressure
(around 1atm) purging the top product (N2), and (4) Countercurrent blowdown step (countercurrent regeneration step)
at low pressure (around 0.1~0.7atm) obtaining the sequestered product (CO2) at the bottom of the bed.
Table1. Parameters for Adsorption Models
Parameters Values Bed radius (Rbed) 1.1×10⁻² m Pore diameter (Dpore) 1.0×10⁻⁹ m Particle radius (Rparticle) 1.0×10⁻³ m Bed density (ρbed) 1.06×10³ kg/m3 Wall density (ρwall) 7.8×10³ kg/m3 Bed void (εbed) 0.348 Particle density (ρparticle) 1.87×10³ kg/m3 R 8.314 J/mol/K Heat capacity of solid (Cps) 504 J/kg/K

2.2 Model equations. The following model assumptions and equations are adopted in this study. The current assumptions 1~5 are the same as the previous work [3] and assumptions 6-10 are different.
1. The gas phase follows ideal gas law. 2. Radial variation of temperature, pressure and concentration is
neglected. 3. Competitive adsorption behaviors are described by the Langmuir
equation for mixture gas. 4. The adsorption rate is approximated by the linear driving force
(LDF) expression. 5. Physical properties of the bed are independent of the temperature. 6. Diffusion coefficient is affected by the temperature. 7. For all given superficial velocities, we assume that the axial
pressure drop along the bed remains negligible. 8. In PSA operation, pressure within the bed is constant during the
adsorption and desorption steps, and it is changed linearly according to time during the pressurization and depressurization step; In FVPSA operation, pressure within the bed is constant during the adsorption step, and it is changed linearly according to the time during the pressurization, cocurrent blowdown, and regeneration steps.
9. The superficial velocity along the bed is calculated by nonisothermal overall mass balance equations during the constant pressure steps;
10. During the pressure change step the profile of the superficial velocity is linear along the bed and affected by the valve equation. From additional numerical experiments, we found this assumption to be reasonable.
The following dual-site Langmuir isotherm describes the adsorption
equilibrium.
∑∑==
++
+= n
iii
iiimn
iii
iiimi
Pb
Pbq
Pb
Pbqq
1)2(
)2()2(
1)1(
)1()1(*
11 (1)
The isotherm parameters are calculated by the following equations
(2a~2d) depending on the temperature, of which range is from 303.15K to 393.15K.
Tkkq iiim )1(,2)1(,1)1( += (2a)
( )Tkkb iii )1(,4)1(,3)1( exp= (2b)
Tkkq iiim )2(,2)2(,1)2( += (2c)
( )Tkkb iii )2(,4)2(,3)2( exp= (2d)
The isotherm parameter values, which are shown in Table 2, were
obtained from experimental data taken at NETL. The isotherm parameter values calculated by using a nonlinear regression method agree well with the experimental data as shown in Figure 2. For the whole temperature range (303.15~393.15K), the selectivity of CO2 over N2 is very high as shown in Figure 2. Tables 3 and 4 list the model equations and mole flux variables to calculate the performances (purities and recoveries), respectively. The boundary conditions of each operating step are shown in Tables 5-1 and 5-2.
Table 2. Values of parameters of the dual-site Langmuir isotherm
CO2 (i=1) N2 (i=2) k1,i(1) 2.817269 1.889581045 k2,i(1) -3.5×10⁻⁴ -22462×10-4 k3,i(1) 2.83×10⁻⁹ 1.163388×10⁻⁹ k4,i(1) 2,598.203 1,944.605788 k1,i(2) 3.970888 1.889581045 k2,i(2) -4.95×10⁻³ -2.2462×10⁻⁴ k3,i(2) 4.411×10⁻⁹ 1.163388×10⁻⁹ k4,i(2) 3,594.071 1,944.605788
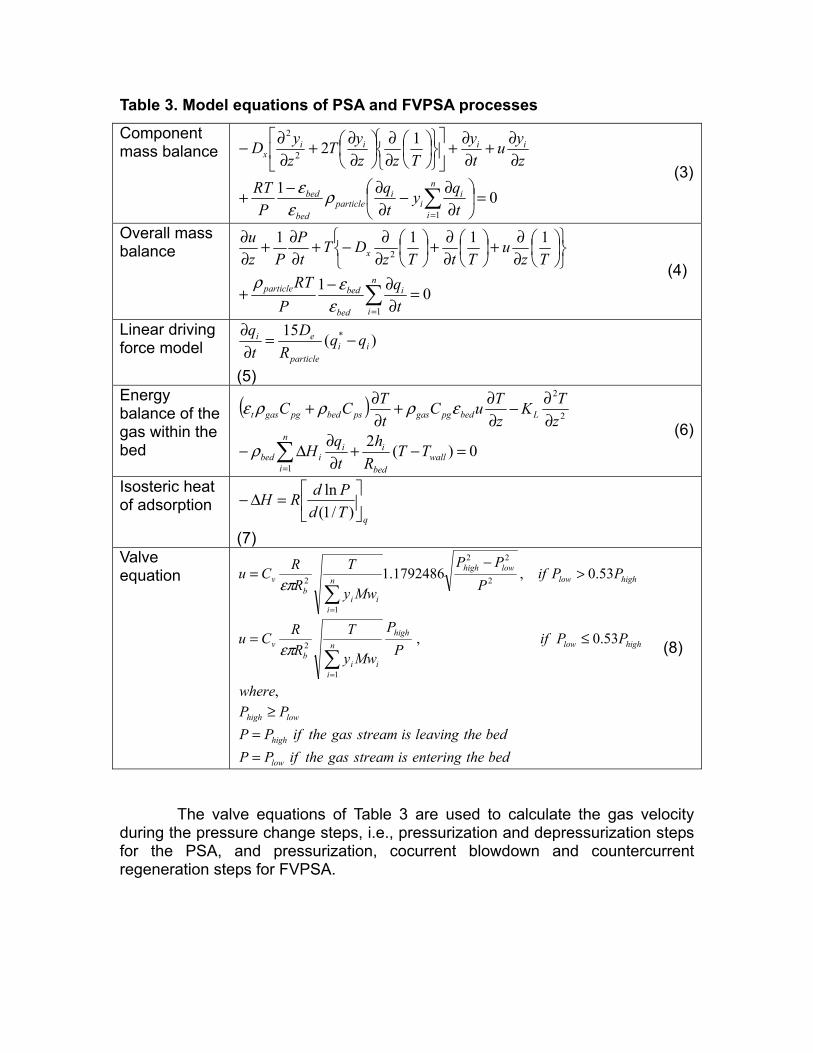
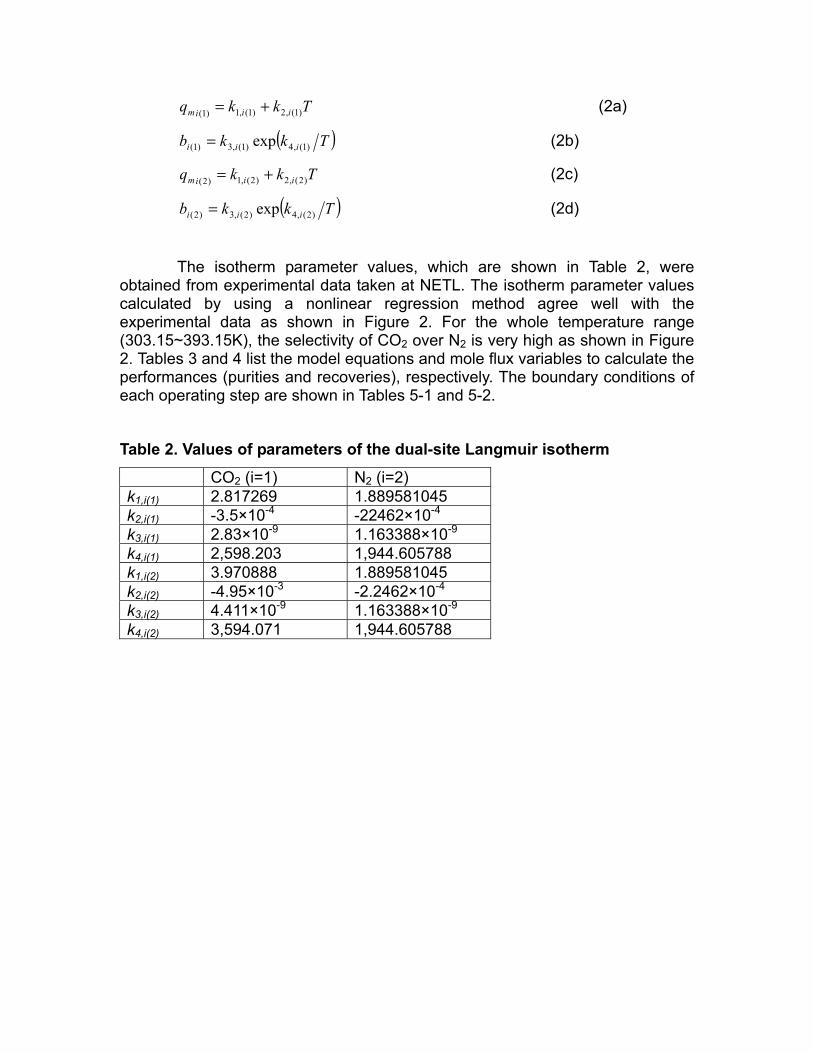
Table 3. Model equations of PSA and FVPSA processes
Component mass balance
01
12
1
2
2
=
∂∂−
∂∂−+
∂∂+
∂∂+
∂∂
∂∂+
∂∂−
∑=
n
i
ii
iparticle
bed
bed
iiiix
tqy
tq
PRT
zyu
ty
TzzyT
zyD
ρε
ε (3)
Overall mass balance
01
1111
1
2
=∂∂−+
∂∂+
∂∂+
∂∂−+
∂∂+
∂∂
∑=
n
i
i
bed
bedparticle
x
tq
PRT
Tzu
TtTzDT
tP
Pzu
εερ
(4)
Linear driving force model )(15 *
iiparticle
ei qqR
Dtq −=
∂∂
(5) Energy balance of the gas within the bed
( )
0)(21
2
2
=−+∂∂∆−
∂∂−
∂∂+
∂∂+
∑=
n
iwall
bed
iiibed
Lbedpggaspsbedpggast
TTR
htqH
zTK
zTuC
tTCC
ρ
ερρρε (6)
Isosteric heat of adsorption
qTdPdRH
=∆−
)/1(ln
(7) Valve equation
bedtheenteringisstreamgastheifPPbedtheleavingisstreamgastheifPP
PPwhere
PPifP
P
Mwy
TRRCu
PPifP
PP
Mwy
TRRCu
low
high
lowhigh
highlowhigh
n
iii
bv
highlowlowhigh
n
iii
bv
==
≥
≤=
>−
=
∑
∑
=
=
,
53.0,
53.0,1792486.1
1
2
2
22
1
2
επ
επ
(8)
The valve equations of Table 3 are used to calculate the gas velocity during the pressure change steps, i.e., pressurization and depressurization steps for the PSA, and pressurization, cocurrent blowdown and countercurrent regeneration steps for FVPSA.

Partial pressure [MPa]0.0 0.5 1.0 1.5 2.0A
mou
nt a
dsor
bed
of C
O2 [
mol
e/kg
]
0
1
2
3
4
5
6
Experimental data at 303.15KLangmuir isotherm at 303.15KExperimental data at 313.15KLangmuir isotherm at 313.15KExperimental data at 323.25KLangmuir isotherm at 323.15KExperimental data at 363.15KLangmuir isotherm at 363.15KExperimental data at 393.15KLangmuir isotherm at 393.15K
Partial pressure [MPa]0.0 0.5 1.0 1.5 2.0 2.5A
mou
nt A
dsor
bed
of N
2 [m
ole/
kg]
0.0
0.5
1.0
1.5
2.0
2.5
Experimental data at 303.15KLangmuir isotherm at 303.15KExperimental data at 313.15KLangmuir isotherm at 313.15KExperimental data at 323.15KLangmuir isotherm at 323.25Experimental data at 363.15KLangmuir isotherm at 363.15KExperimental data at 393.15KLangmuir isotherm at 393.15K
(a) Adsorption isotherm of CO2 (b) Adsorption isotherm of N2
Figure 2. Adsorption isotherms at different temperatures (303.15K~393.15K) on
zeolite13x
Based on the mole flux variables of Table 4, the purities and recoveries of CO2 (i=1) and N2 (i=2) are calculated by
( )
stepExhaust
n
ii
stepExhaustCO
aveCO
dtExhaust
tdExhaustPurity
∫ ∑
∫
=
=1
,
2
2 (9)
( )
stepProduct
n
1ii
stepProductN
aveN
dtProduct
dtProductPurity
2
2
∫ ∑
∫
=
=
, (10)
stepfeedCO
stepexhaustCO
aveCOdtFeed
dtExhaustRecovery
∫∫
=2
2
2 , (11)

stepfeedN
stepProductN
aveN
2
2
2 Feed
ProductRecovery
∫∫
=, (12)
where: Feed step of PSA and FVPSA = pressurization and adsorption step; Product step of PSA = adsorption step for PSA; Product step of FVPSA = adsorption and cocurrent blowdown step; Exhaust step of PSA = depressurization and regeneration steps; Exhaust step of FVPSA = regeneration step. The work to compress the feed gas is given by
( )feed
feedbed
atm
feedfeed RT
PRu
PP
RTowerP 2
1
)0(11
πγ
γ γγ
−
−
=
−
(13)
( )∫+
= AP tt
cycle dtPowerW0
(14)
AP
cycleave tt
WowerP
+= (15)
−
−
=
−
11
1γ
γ
γγ
atm
feedfeed P
PRTowerP Specific (16)
( )∫+
= AP ttdtPower SpecificrkSpecificWo
0 (17)
APave tt
Work SpecificowerP Specific+
= (18)
Table 4-1. Mole flux variables at each operating step of PSA [3]
Pressurization Adsorption Depressurization Purge
=
∂∂
=
= PP
TT
RTuP
tFeed
STP
STP
z
z
i
i
0
0
)(
=
∂∂
=
= PP
TT
RTuP
tFeed
STP
STP
z
z
i
i
0
0
)(
0)( =
∂∂
tFeed 0)( =
∂∂
tFeed

0)( =∂
∂t
oductPr i
=
∂∂
=
= PP
TT
RTuP
toductPr
STP
STP
Lz
Lz
i
i )(
0)( =
∂∂
toductPr i 0)( =
∂∂
toductPr i
0)( =∂
∂t
Exhausti 0)( =∂
∂t
Exhausti
−=
∂∂
=
= PP
TT
RTuP
tExhaust
STP
STP
z
z
i 0
0
)(
−=
∂∂
=
= PP
TT
RTuP
tExhaust
STP
STP
z
z
i 0
0
)(
0)( =∂
∂t
PurgeFeedi 0)( =∂
∂t
PurgeFeedi 0)( =∂
∂t
PurgeFeedi
−=
∂∂
=
= PP
TT
RTuP
tPurgeFeed
STP
STP
Lz
Lz
i
i )(

Table 4-2. Mole flux variables at each operating step of FVPSA
Pressurization Adsorption Cocurrent blowdown
Countercurrent regeneration
=
∂∂
=
= PP
TT
RTuP
tFeed
STP
STP
z
z
i
i
0
0
)(
=
∂∂
=
= PP
TT
RTuP
tFeed
STP
STP
z
z
i
i
0
0
)(
0)( =
∂∂
tFeed 0)( =
∂∂
tFeed
0)( =∂
∂t
oductPr i
=
∂∂
=
= PP
TT
RTuP
toductPr
STP
STP
Lz
Lz
i
i )(
=
∂∂
=
= PP
TT
RTuP
toductPr
STP
STP
Lz
Lz
i
i )( 0)( =∂
∂t
oductPr i
0)( =∂
∂t
Exhausti 0)( =∂
∂t
Exhausti 0)( =∂
∂t
Exhausti
−=
∂∂
=
= PP
TT
RTuP
tExhaust
STP
STP
z
z
i 0
0
)(
0)( =∂
∂t
PurgeFeedi 0)( =∂
∂t
PurgeFeedi 0)( =∂
∂t
PurgeFeedi 0)( =∂
∂t
PurgeFeedi
Table 5-1. Boundary conditions of PSA operation
Pressurization Adsorption Depressurization Regeneration ifzi yy ,0
==
ifzi yy ,0=
= 0
0
=∂∂
=z
i
zy 0
0
=∂∂
=z
i
zy
0=∂∂
=Lz
i
zy 0=
∂∂
=Lz
i
zy 0=
∂∂
=Lz
i
zy 1;0
22==
== LzNLzCO yy
feedzTT =
=0 feedz
TT ==0
00
=∂∂
=zzT 0
0
=∂∂
=zzT
0=∂∂
=LzzT 0=
∂∂
=LzzT 0=
∂∂
=LzzT purgeLz
TT ==
)8.(0
equz
⇐=
feedzuu =
=0 )8.(
0equ
z⇐
= )4.(
0equ
z⇐
=
0==Lz
u )4.(equLz
⇐=
0==Lz
u purgeLzuu =
=
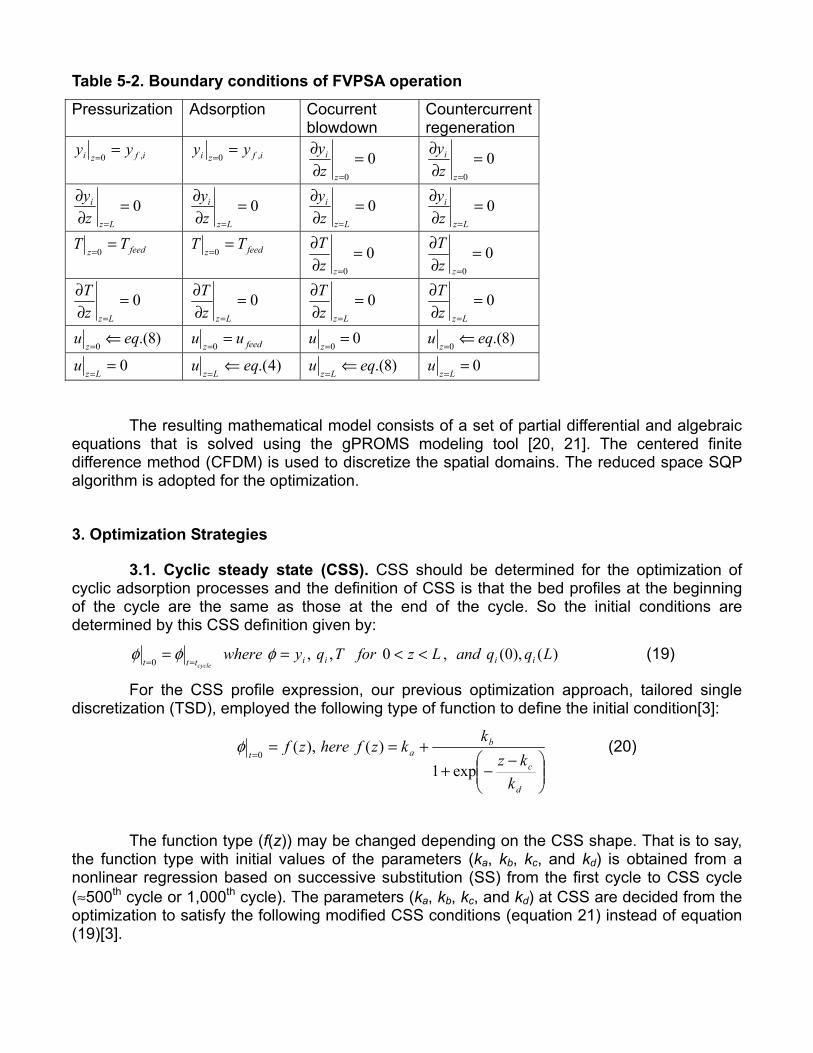
Table 5-2. Boundary conditions of FVPSA operation
Pressurization Adsorption Cocurrent blowdown
Countercurrent regeneration
ifzi yy ,0=
= ifzi yy ,0
==
00
=∂∂
=z
i
zy 0
0
=∂∂
=z
i
zy
0=∂∂
=Lz
i
zy 0=
∂∂
=Lz
i
zy 0=
∂∂
=Lz
i
zy 0=
∂∂
=Lz
i
zy
feedzTT =
=0 feedz
TT ==0
00
=∂∂
=zzT 0
0
=∂∂
=zzT
0=∂∂
=LzzT 0=
∂∂
=LzzT 0=
∂∂
=LzzT 0=
∂∂
=LzzT
)8.(0
equz
⇐=
feedzuu =
=0 0
0=
=zu )8.(
0equ
z⇐
=
0==Lz
u )4.(equLz
⇐=
)8.(equLz
⇐=
0==Lz
u
The resulting mathematical model consists of a set of partial differential and algebraic equations that is solved using the gPROMS modeling tool [20, 21]. The centered finite difference method (CFDM) is used to discretize the spatial domains. The reduced space SQP algorithm is adopted for the optimization.
3. Optimization Strategies
3.1. Cyclic steady state (CSS). CSS should be determined for the optimization of cyclic adsorption processes and the definition of CSS is that the bed profiles at the beginning of the cycle are the same as those at the end of the cycle. So the initial conditions are determined by this CSS definition given by:
)(),0(,0,,0
LqqandLzforTqywhere iiiittt cycle<<==
==φφφ (19)
For the CSS profile expression, our previous optimization approach, tailored single discretization (TSD), employed the following type of function to define the initial condition[3]:
−−+
+===
d
c
bat
kkz
kkzfherezf
exp1)(),(
0φ (20)
The function type (f(z)) may be changed depending on the CSS shape. That is to say,
the function type with initial values of the parameters (ka, kb, kc, and kd) is obtained from a nonlinear regression based on successive substitution (SS) from the first cycle to CSS cycle (≈500th cycle or 1,000th cycle). The parameters (ka, kb, kc, and kd) at CSS are decided from the optimization to satisfy the following modified CSS conditions (equation 21) instead of equation (19)[3].

[ ] [ ] constantpositivesmall a is where,0
δδφφ ≤−== ∫∫
cycletttdzdz (21)
In the updated TSD (uTSD) approach, the following is used for the CSS determination
as in the work by Jiang et al. [22]
[ ] [ ] ,,,0 εφφε ≤−≤− == nttnt cycle (22)
where,
ε is a nonnegative variable which is minimized during the optimization; n is an axial point at each node of the finite difference or finite element method. In the TSD and uTSD methods, the CSS condition is decided by the optimization. The
previous method obtains the CSS by using the CSS constraint (equation 21) with the small CSS tolerance (�), and the new method determines this by minimizing the CSS variable (ε) in the CSS constraint (equation 22).
3.2. Optimization algorithms. We briefly compare the new optimization method with
the TSD method developed in [2, 3]. In this study we propose a new uTSD approach, which adopts the same discretization concept as TSD. Like TSD it uses binary variables to express the changing operating conditions and update the optimization procedure.
The tailored single discretization (TSD) optimization strategy is summarized below [2, 3]:
1) Formulation of the model by using single discretization (SD) approach. 2) Expression of the operating step changes for the PSA operation by using binary
variables. 3) CSS prediction with regression. (1) Obtain the approximate CSS profile through successive substitution (SS) from
1st cycle to CSS cycle (≈500th or 1000th cycle) (2) Guess functions (equation 17) which express the CSS profile from a parameter
regression 4) Addition of the CSS constraints (equation 18) to the optimization model as the
inequality constraint with the small positive tolerance (�). 5) Optimization of the PSA model with the CSS constraints by minimizing the
objective function (Φ). This approach has advantages over the complete discretization (CD) method in cyclic
adsorption process optimization, but this has the two shortcomings:

- The CSS condition is only approximate. It is obtained by setting the small tolerance; however, sometimes this very small tolerance makes it difficult to converge to the optimal point or requires a long computation time for the optimization.
- A nonlinear regression step is required to get the proper function describing the CSS profile accurately; however, the regression may sometimes be impossible or inaccurate when the real CSS shape is not predictable by any function type.
To eliminate the above problems, this work proposes the following uTSD approach,
which removes the regression step from the optimization procedure and determines the CSS profiles by minimizing �.
1) Formulation of the model by using single discretization (SD) approach. 2) Expression of the operating step changes for the PSA operation by using binary
variables. 3) CSS prediction: Successive substitution (SS) from 1st cycle to CSS to get the
initial values of φ at each node for the CSS optimization. 4) Addition of the CSS constraints (equation 19), with the nonnegative variable (�)
applied at each axial point at CSS. Optimization of the PSA model with the CSS constraints by minimizing the objective function (Φ) as well as the nonnegative variable (ε), i.e., Min Φ + Mε, where M is a large value (≈105).
4. Optimization Results
4.1. Comparison of the new TSD and the previous TSD. To demonstrate that the new method is better than the previous one, this study first
considers a simplified PSA process. The model is not as detailed as the current target processes (normal temperature PSA, high temperature PSA and FVPSA of this work), but allows us to compare the methods easily and quickly. The operation is the Skarstrom cycle shown in the Figure 3.
Figure 3. H2/CO2 gas separation PSA process

The optimization formulation is Min. Power/PurityH2 for TSD (23-1)
Min. Power/PurityH2 + Mε for uTSD (23-2) s.t.
0.3m ≤ L ≤ 3m (24a)
3atm ≤ Pfeed ≤ 20atm (24b)
1sec ≤ tP, tDP ≤ 50sec (24c)
80sec ≤ tA, tR ≤ 950sec (24d)
0.004m/sec ≤ ufeed ≤0.1m/sec (24e)
-0.2m/sec ≤ upurge ≤ -4E-5m/sec (24f)
0.9 ≤ PurityH2 ≤ 1 (24g)
Power ≤ 40 (24h) General PSA model equations [23]
Judging from the optimization results in Table 6, the updated tailored single discretization (uTSD) has the following advantages over the tailored single discretization (TSD): fewer iterations, faster calculation, more accurate CSS (ε = 1.29858×10⁻²⁴ ≈ 0), and better results.
Table 6. Optimization results of the previous TSD and updated TSD
Optimization algorithm by Ko et al.
Previous TSD updated TSD
Total CPU Time for Optimization 1,667.03 sec 628.265 sec No. of NLP Iterations 66 32 No. of Line Search Steps 145 34 PurityH2 95.1694% 95.1458% Power 6.13834 W 2.9283 W
CSS accuracy ( dzqqL
ttt cycle∫ == −0 ,10,1 ) 0.02995 5.19391×10⁻⁸
CSS accuracy ( dzqqL
ttt cycle∫ == −0 ,20,2 ) 0.02601 1.33813×10⁻⁸
CSS accuracy ( dzyyL
ttiti cycle∫ == −0 ,0, ) 0.03012 1.02731×10⁻⁷
Objective function value 0.0451494 0.0215438 Here, the optimal value of ε in uTSD is 1.29858×10⁻²⁴

4.2. PSA Optimization at normal temperature region Two optimization cases for CO2 sequestration are presented in this section. The
following is the optimization model:
Min. εMPurity-PurityObjective22 NCO +−= (25)
Subject to
sec50sec10 ≤≤ Pt (26-1)
sec115sec35 ≤≤ At (26-2)
sec60sec10 ≤≤ DPt (26-3)
sec105sec35 ≤≤ Rt (26-4)
mLm 225.0 ≤≤ (26-5)
kPaPkPa feed 000,2170 ≤≤ (26-6)
kPaPPkPa purgeinitial 110,90 ≤≤ (26-7)
sec/50sec/51
kPatPkPastep
≤∂∂≤ (26-8)
sec/10,sec/10 1042
10 PatPtPPastepstep
−− ≤∂∂∂∂≤− (26-9)
sec/2sec/503
kPatPkPastep
−≤∂∂≤− (26-10)
KTTK purgefeed 15.323,295 ≤≤ (26-11)
00, ==tadsu (26-12)
21
25 sec/1.0sec/10 mtumstepads ≤∂∂≤− (26-13)
2532
2 sec/10,sec/1.0 mtutumstepadsstepads
−≤∂∂∂∂≤− (26-14)
04
=∂∂stepads tu (26-15)
sec/10sec/1.0 50, mum treg
−= −≤≤− (26-16)
21
25 sec/051.0sec/10 mtumstepreg ≤∂∂≤− (26-17)
032
=∂∂=∂∂stepregstepreg tutu (26-18)
2104
2 sec/10sec/0261.0 mtumstepreg
−−≤∂∂≤− (26-19)
UBztzLBz φφφ ≤≤=0
(26-20)

BoundUpperUBBoundLowerLB
TandyforLengthz
qforLengthz
Toryqwhere
tztzi
tzi
==
<<
≤≤
=
==
=
,
0
0
,,
00,
0,
φ
3100 −≤≤ ε (26-21)
εφφε ≤−≤−== cyclettztz 0
(26-22)
31,
9 105103 −− ×≤≤× LvC (26-23)
23,
9 105105 −− ×≤≤× LvC (26-24)
sec/100 JowerP Ave ≤ (26-25)
%15:1 ,2≥AveCOPurityACase (26-26a)
%85,2≥AveNPurity (26-27a)
%15,2≥AveCORecovery (26-28a)
%85,2≥AveNRecovery (26-29a)
%44:2 ,2≥AveCOPurityACase (26-26b)
%97,2≥AveNPurity (26-27b)
%99,2≥AveCORecovery (26-28b)
%86,2≥AveNRecovery (26-29b)
Equations (1)~(18), (22) The decision variables of the PSA optimizations are the following: step times; bed
length; initial bed pressure; feed pressure; pressure change rate according to the time during pressurization and depressurization step; purge pressure; temperatures; input feed gas velocity during the adsorption step; input purge gas velocity during the purge step; CSS variable (ε); valve coefficients during pressurization and depressurization. Tables 7-1 and 7-2 list the optimization results.

Table 7-1. Optimization results of case A1 in PSA at normal temperature region
Variables Results Bed length (L) 0.319231 m Feed pressure (Pfeed) 718.029 kPa Purge pressure (Ppurge) 90.0 kPa Initial pressure within the bed (Pinitial) 90.0 kPa Feed temperature (Tfeed) 323.15 K Purge temperature (Tpurge) 323.15 K Input velocity at adsorption step (ufeed): Linear change of velocity at the feed end
5.6363 ×10⁻² ~ 4.16752 ×10⁻² m/sec
Input velocity at purge step (upurge): Linear change of velocity at the product end
-1.59453×10⁻¹²
~ -0.2 m/sec
Pressurization time (tP) 20.8985 sec Adsorption time (tA) 115 sec Depressurization time (tDP) 60 sec Regeneration time (tR) 35.035 sec Valve coefficient at step1 (Cv1L) 4.41413×10⁻⁸ Valve coefficient at step3 (Cv3L) 5×10⁻⁹ CSS tolerance (ε) 0 Average CO2 purity (PurityCO2,ave) 47.7662 % Average CO2 recovery (RecoveryCO2,ave) 99.9992 % Average N2 purity (PurityN2,ave) 95.2574 % Average N2 recovery (RecoveryN2,ave) 85 % Average Power at feed step (Powerave) 32.1722 W Average Specific Power at feed step (SpecificPowerave)
7,112.25 W
Objective Function 143.024 % Total CPU time = 4,222.92 sec on Pentium ® 4 with 1.8 GHz machine Number of NLP iterations = 157 Number of NLP line search steps = 167 Optimization tolerance of NLP solver (SRQPD) = 0.001

Table 7-2. Optimization results of case A2 in PSA at normal temperature region
Variables Results Bed length (L) 0.25002 m Feed pressure (Pfeed) 655.358 kPa Purge pressure (Ppurge) 90.0 kPa Initial pressure within the bed (Pinitial) 90.0 kPa Feed temperature (Tfeed) 323.15 K Purge temperature (Tpurge) 323.15 K Input velocity at adsorption step (ufeed): Linear change of velocity at the feed end
5.34327×10⁻² ~ 1.6566×10⁻² m/sec
Input velocity at purge step (upurge): Linear change of velocity at the product end
-1.98728×10⁻⁷ ~ -0.193841 m/sec
Pressurization time (tP) 21.8376 sec Adsorption time (tA) 115 sec Depressurization time (tDP) 59.711 sec Regeneration time (tR) 35 sec Valve coefficient at step1 (Cv1L) 3.26987×10⁻⁸ Valve coefficient at step3 (Cv3U) 5×10⁻⁹ CSS tolerance (ε) 0 Average CO2 purity (PurityCO2,ave) 44.9549 % Average CO2 recovery (RecoveryCO2,ave) 100 % Average N2 purity (PurityN2,ave) 97.0 % Average N2 recovery (RecoveryN2,ave) 86.0 % Average Power at feed step (Powerave) 19.6391 W Average Specific Power at feed step (SpecificPowerave)
6,686.87 W
Objective Function 141.9549 % Total CPU time = 1,310.34 sec on Pentium ® 4 with 1.8 GHz machine Number of NLP iterations = 44 Number of NLP line search steps = 50 Optimization tolerance of NLP solver (SRQPD) = 0.001

4.3. PSA Optimization at high temperature region Two high temperature PSA models for CO2 sequestration are also performed. The
optimization models and the decision variables are the same as the models in section 4.2, except with the following differences in step times, temperature, gas velocities and product specification:
Subject to
sec50sec10 ≤≤ Pt (27-1)
sec145sec35 ≤≤ At (27-2)
sec80sec10 ≤≤ DPt (27-3)
sec105sec20 ≤≤ Rt (27-4)
KTTK purgefeed 15.370,295 ≤≤ (27-5)
sec/11.0sec/10 0,5 mum tads ≤≤− =
− (27-6)
sec/10sec/12.0 50, mum treg
−= −≤≤− (27-7)
31,
9 105103 −− ×≤≤× LvC (27-8)
23,
9 105104 −− ×≤≤× LvC (27-9)
%47:1 ,2≥AveCOPurityBCase (27-10a)
%97,2≥AveNPurity (27-11a)
%15,2≥AveCORecovery (27-12a)
%85,2≥AveNRecovery (27-13a)
%53:2 ,2≥AveCOPurityBCase (27-10b)
%98,2≥AveNPurity (27-11b)
%99,2≥AveCORecovery (27-12b)
%86,2≥AveNRecovery (27-13b)
Tables 8-1 and 8-2 summarize the optimization results.

Table 8-1. Optimization results of case B1 in PSA at high temperature region
Variables Results Bed length (L) 0.344343 m Feed pressure (Pfeed) 784.174 kPa Purge pressure (Ppurge) 90.000 kPa Initial pressure within the bed (Pinitial) 90.000 kPa Feed temperature (Tfeed) 370.15 K Purge temperature (Tpurge) 370.15 K Input velocity at adsorption step (ufeed): Linear change of velocity at the feed end
3.90816×10⁻² ~ 1.61418×10⁻² m/sec
Input velocity at purge step (upurge): Linear change of velocity at the product end
-2.1525×10⁻⁸
~ -0.12 m/sec
Pressurization time (tP) 41.1225 sec Adsorption time (tA) 145 sec Depressurization time (tDP) 78.5842 sec Regeneration time (tR) 32.5934 sec Valve coefficient at step1 (Cv1L) 1.3704×10⁻⁸ Valve coefficient at step3 (Cv3L) 4×10⁻⁹ CSS tolerance (ε) -4.7414×10⁻²¹ Average CO2 purity (PurityCO2,ave) 59.3687 % Average CO2 recovery (RecoveryCO2,ave) 100.0 % Average N2 purity (PurityN2,ave) 97.0 % Average N2 recovery (RecoveryN2,ave) 85.0785 % Average Power at feed step (Powerave) 19.2355 W Average Specific Power at feed step (SpecificPowerave)
8,629.03 W
Objective Function 156.369 % Total CPU time = 5,394.53 sec on Pentium ® 4 with 1.8 GHz machine Number of NLP iterations = 208 Number of NLP line search steps = 238 Optimization tolerance of NLP solver (SRQPD) = 0.001

Table 8-2. Optimization results of case B2 in PSA at high temperature region
Variables Results Bed length (L) 0.267065 m Feed pressure (Pfeed) 709.942 kPa Purge pressure (Ppurge) 90.00 kPa Initial pressure within the bed (Pinitial) 90.00 kPa Feed temperature (Tfeed) 370.15 K Purge temperature (Tpurge) 370.15 K Input velocity at adsorption step (ufeed): Linear change of velocity at the feed end
4.80913×10⁻² ~1.36809×10⁻³ m/sec
Input velocity at purge step (upurge): Linear change of velocity at the product end
-1.51995×10⁻⁷ ~ -0.12 m/sec
Pressurization time (tP) 42.9705 sec Adsorption time (tA) 145 sec Depressurization time (tDP) 76.5696 sec Regeneration time (tR) 39.338 sec Valve coefficient at step1 (Cv1L) 1.48999×10⁻⁸ Valve coefficient at step3 (Cv3U) 4×10⁻⁹ CSS tolerance (ε) 0 Average CO2 purity (PurityCO2,ave) 55.7042 % Average CO2 recovery (RecoveryCO2,ave) 100 % Average N2 purity (PurityN2,ave) 98.00 % Average N2 recovery (RecoveryN2,ave) 86.0004 % Average Power at feed step (Powerave) 14.6806 J/sec Average Specific Power at feed step (SpecificPowerave)
8,085.56 W
Objective Function 153.7042 % Total CPU time = 3,451.22 sec on Pentium ® 4 with 1.8 GHz machine Number of NLP iterations = 129 Number of NLP line search steps = 138 Optimization tolerance of NLP solver (SRQPD) = 0.001

4.4. FVPSA Optimization at high temperature region To improve the purities over PSA, the three FVPSA processes are optimized. The
optimization results are listed in Table 8, and the optimization formulation is given by:
Min. εMPurity-PurityObjective22 NCO +−= (28)
Subject to
sec55sec10 ≤≤ Pt (29-1)
sec150sec35 ≤≤ At (29-2)
sec55sec10 ≤≤ PROt for case C1 (29-3a)
sec60sec10 ≤≤ PROt for cases C2 and C3 (29-3b,c)
sec150sec35 ≤≤ Rt (29-4)
mLengthm 225.0 ≤≤ (29-5)
kPaPkPa feed 000,2170 ≤≤ (29-6)
kPaPkPa pro 13070 ≤≤ (29-7)
kPaPPkPa initialreg 70,9.9 ≤≤ (29-8)
sec/50sec/0.51
kPatPkPastep
≤∂∂≤ (29-9)
sec/10sec/10 102
10 PatPPastep
−− ≤∂∂≤− (29-10)
sec/0.2sec/0.503
PatPkPastep
−≤∂∂≤− (29-11)
sec/100.0sec/0.9 4 kPatPkPa step −≤∂∂≤− (29-12)
KTK feed 370275 ≤≤ (29-13)
00, ==tadsu (29-14)
21
25 sec/1.0sec/10 mtumstepads ≤∂∂≤− (29-15)
232
2 sec/103sec/1.0 mtumstepads
−×≤∂∂≤− (29-16)
253
2 sec/10sec/1.0 mtumstepads
−≤∂∂≤− (29-17)
04
=∂∂stepads tu (29-18)
UBztzLBz φφφ ≤≤=0
(29-19)
Toryqwhere ,,=φ
0,0=
≤≤tziqforLengthz

00,0==
<<tztzi TandyforLengthz
BoundUpperUBBoundLowerLB == , 3100 −≤≤ ε (29-20)
εφφε ≤−≤−== cyclettztz 0
(29-21)
31,
9 105105 −− ×≤≤× LvC (29-22)
23,
9 105105 −− ×≤≤× UvC (29-23)
34,
9 105105 −− ×≤≤× LvC (29-24)
:1CCase %82,2≥AveCOPurity (29-25a)
%97,2≥AveNPurity (29-26a)
%15≥Ave,CO2Recovery (29-27a)
%85≥Ave,N2Recovery (29-28a)
sec/000,500 JowerP Ave ≤ (29-29a)
:2CCase %90,2≥AveCOPurity (29-25b)
%99,2≥AveNPurity (29-26b)
%80≥Ave,CO2Recovery (29-27b)
%90≥Ave,N2Recovery (29-28b)
WowerP Ave 000,700≤ (29-29b)
:3CCase %90,2≥AveCOPurity (29-25c)
%99,2≥AveNPurity (29-26c)
%95≥Ave,CO2Recovery (29-27c)
%95≥Ave,N2Recovery (29-28c)
WowerP Ave 000,700≤ (29-29c)
The decision variables of the FVPSA optimizations are the following: step times; bed
length; initial bed pressure; feed pressure; product purge pressure; regeneration pressure; pressure change rate according to the time during the pressurization, product purge and regeneration steps; temperatures; input feed gas velocity during the adsorption step; the CSS tolerance (ε); valve coefficients during the pressurization, product purge and regeneration steps. Tables 9-1, 9-2 and 9-3 list the optimization results.

Table 9-1. Optimization results of case C1 in FVPSA at high temperature region
Variables Results Bed length (L) 0.25 m Feed pressure (Pfeed) 693.482 kPa Cocurrent blowdown product pressure (Ppro)
70.00 kPa
Countercurrent regeneration pressure (Preg)
9.900 kPa
Initial pressure within the bed (Pinitial) 9.900 kPa Feed temperature (Tfeed) 365.316 K Input velocity at adsorption step (ufeed): Linear change of velocity at the feed end
2.29158×10⁻² ~3.00148×10⁻² m/sec
Pressurization time (tP) 47.4861 sec Adsorption time (tA) 132.003 sec Cocurrent blowdown time (tPRO) 54.7927 sec Regeneration time (tR) 35.7814 sec Valve coefficient at step1 (Cv1L) 1.03919×10⁻⁴ Valve coefficient at step3 (Cv3U) 8.76024×10⁻⁴ Valve coefficient at step4 (Cv4L) 2.4652×10⁻⁴ CSS tolerance (ε) 7.62875×10⁻¹⁷ Average CO2 purity (PurityCO2,ave) 95.4624 % Average CO2 recovery (RecoveryCO2,ave) 15.0002 % Average N2 purity (PurityN2,ave) 97.7535 % Average N2 recovery (RecoveryN2,ave) 100. % Average Power at feed step (Powerave) 44,352.2 W Average Specific Power at feed step (SpecificPowerave)
7,855.65 W
Objective Function 193.2159 % Total CPU time = 7,503.51 sec on Pentium ® 4 with 1.8 GHz machine Number of NLP iterations = 100 Number of NLP line search steps = 123 Optimization tolerance of NLP solver (SRQPD) = 0.002
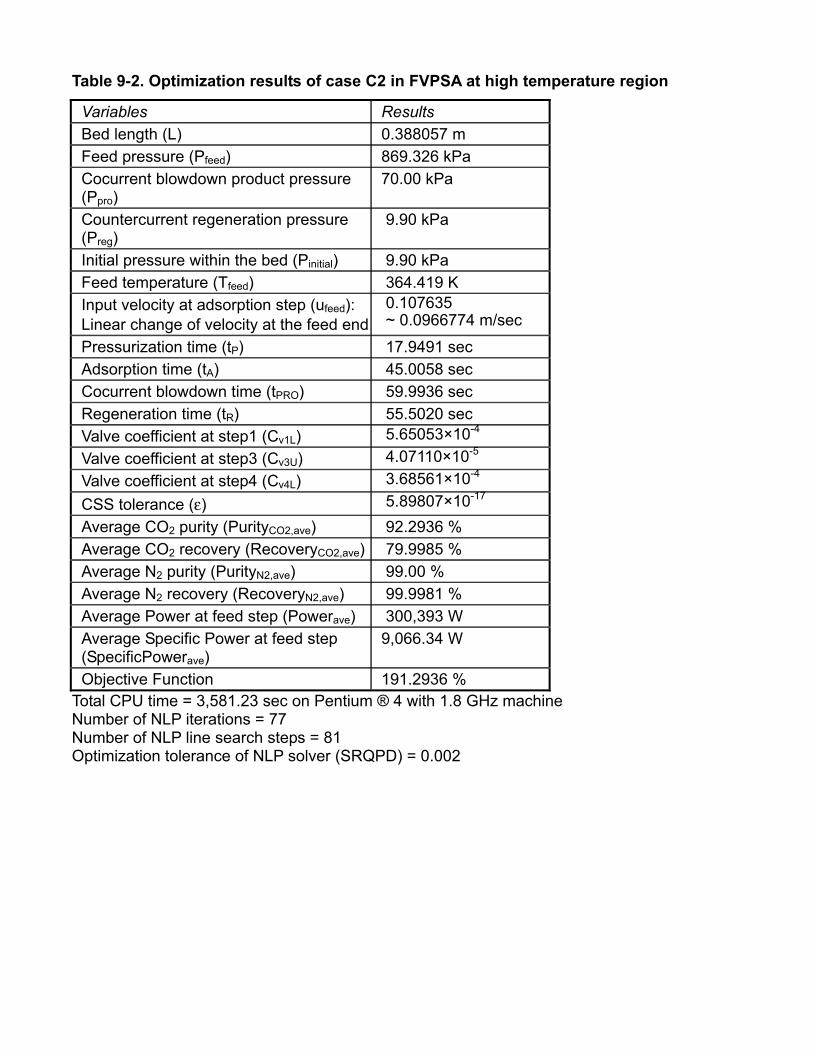
Table 9-2. Optimization results of case C2 in FVPSA at high temperature region
Variables Results Bed length (L) 0.388057 m Feed pressure (Pfeed) 869.326 kPa Cocurrent blowdown product pressure (Ppro)
70.00 kPa
Countercurrent regeneration pressure (Preg)
9.90 kPa
Initial pressure within the bed (Pinitial) 9.90 kPa Feed temperature (Tfeed) 364.419 K Input velocity at adsorption step (ufeed): Linear change of velocity at the feed end
0.107635 ~ 0.0966774 m/sec
Pressurization time (tP) 17.9491 sec Adsorption time (tA) 45.0058 sec Cocurrent blowdown time (tPRO) 59.9936 sec Regeneration time (tR) 55.5020 sec Valve coefficient at step1 (Cv1L) 5.65053×10⁻⁴ Valve coefficient at step3 (Cv3U) 4.07110×10⁻⁵ Valve coefficient at step4 (Cv4L) 3.68561×10⁻⁴ CSS tolerance (ε) 5.89807×10⁻¹⁷ Average CO2 purity (PurityCO2,ave) 92.2936 % Average CO2 recovery (RecoveryCO2,ave) 79.9985 % Average N2 purity (PurityN2,ave) 99.00 % Average N2 recovery (RecoveryN2,ave) 99.9981 % Average Power at feed step (Powerave) 300,393 W Average Specific Power at feed step (SpecificPowerave)
9,066.34 W
Objective Function 191.2936 % Total CPU time = 3,581.23 sec on Pentium ® 4 with 1.8 GHz machine Number of NLP iterations = 77 Number of NLP line search steps = 81 Optimization tolerance of NLP solver (SRQPD) = 0.002

Table 9-3. Optimization results of case C3 in high temperature FVPSA process
Variables Results Bed length (L) 0.966855 m Feed pressure (Pfeed) 902.959 kPa Cocurrent blowdown product pressure (Ppro)
70.00 kPa
Countercurrent regeneration pressure (Preg)
9.90 kPa
Initial pressure within the bed (Pinitial) 9.90 kPa Feed temperature (Tfeed) 365.373 K Input velocity at adsorption step (ufeed): Linear change of velocity at the feed end
0.215801 ~0.217474 m/sec
Pressurization time (tP) 19.0672 sec Adsorption time (tA) 54.6696 sec Cocurrent blowdown time (tPRO) 59.3987 sec Regeneration time (tR) 57.8045 sec Valve coefficient at step1 (Cv1L) 1.1498×10⁻³ Valve coefficient at step3 (Cv3U) 9.06724×10⁻⁵ Valve coefficient at step4 (Cv4L) 1.09952×10⁻³ CSS tolerance (ε) 1.2845×10⁻¹⁷ Average CO2 purity (PurityCO2,ave) 91.9232 % Average CO2 recovery (RecoveryCO2,ave) 95.0012 % Average N2 purity (PurityN2,ave) 99.0321 % Average N2 recovery (RecoveryN2,ave) 100 % Average Power at feed step (Powerave) 648,504 W Average Specific Power at feed step (SpecificPowerave)
9,305.14 W
Objective Function 190.9553 % Total CPU time = 4,764.8 sec on Pentium ® 4 with 1.8 GHz machine Number of NLP iterations = 102 Number of NLP line search steps = 128 Optimization tolerance of NLP solver (SRQPD) = 0.002
5. Conclusions
An improved optimization algorithm is described for PSA. The updated PSA optimization method shows the following advantages over the previous method (Ko et al., 2002 and 2003): 1) faster calculation, 2) more robust convergence, and 3) more accurate CSS. With the new optimization procedure, we performed the simulations and optimizations of the normal temperature PSA, the high temperature PSA and the FVPSA processes to get high CO2 purity

as well as N2 purity from the mixture gas (85% N2 and 15% CO2). The process models are formulated by using partial differential algebraic equations (PDAEs) that describe the dynamic behaviors and spatial distribution of the variables within the bed. The centered finite difference method (CFDM) is used for the discretization of the spatial domain, and a reduced space SQP algorithm is adopted for the optimizations.
The optimization results lead to the following observations:
• As the PSA models are more constrained (cases A2 and B2), the optimal bed lengths become smaller. Since most adsorption occurs close to the feed end of the bed than at the product end, a longer bed does not seem to be necessary and a length of 25cm might be good enough to satisfy the tighter constraints in the PSA optimizations. However, to increase the average N2 purity and CO2 recovery simultaneously, a longer bed length is required in the FVPSA process.
• Average N2 purities of the normal temperature PSA processes are more affected by the contact time of the adsorption step than by the feed pressure of the step. That is, the higher N2 purity is obtained by the larger contact time in normal temperature PSA processes. In high temperature PSA, the larger contact time and higher feed pressure may lead to lower N2 purity. On the other hand, for FVPSA the effect of feed pressure on N2 purity is stronger than that of contact time. So the N2 purity can be improved by increasing the feed pressure in the FVPSA processes.
• The optimal purge and blowdown pressures are almost at the lower bounds of the optimization constraints. This means that the regeneration of CO2 can be improved by reducing the pressure at the regeneration (purge) step. The cocurrent blowdown step of FVPSA to evacuate the N2 within the bed also requires the low pressure (lower bound), so that the average N2 recovery can be 100% in FVPSA processes.
• In PSA, the optimized adsorption times are the upper bounds of optimization constraints because the average N2 recovery increases and the increasing rate becomes smaller over time. The optimal regeneration time of PSA is small because the average CO2 purity quickly increases and then starts decreasing as the regeneration proceeds. In FVPSA, we note that average CO2 recovery increases with regeneration time. CO2 purity decreases accordingly as CO2 recovery increases.
• The adsorption times of Cases C2 and C3 (FVPSA to get 99% of N2 purities) are shorter than the adsorption time of Case C1 (FVPSA to get 97% purity) because N2 purity decreases slightly as the adsorption and cocurrent blowdown steps proceed.
• The optimal gas velocity for FVPSA processes is much larger than for PSA processes. For high CO2 purity more CO2 is adsorbed and regenerated. Also, the optimal values of valve coefficients in FVPSA are much larger than those in PSA.
In summary, we can conclude that 1) FVPSA is much better than PSA in obtaining high purities of CO2 (about 92%~95%) and N2 (about 99%), 2) CO2 recoveries of FVPSA is low (about 15%~95%), compared with those of PSA (almost 100%), 3) N2 purities of high temperature processes can also be higher (98%) than those of normal temperature PSA (97%), 4) N2 recoveries of FVPSA are almost 100% and those of PSA are 85 % or a little higher, and 5) the average power (watts) for FVPSA operation is much larger than that for PSA operation because the input gas velocity and valve coefficient value of FVPSA is much bigger than those of PSA. On the other hand, the average specific powers are comparable for all cases considered.
NOMENCLATURE qmi Langmuir constant (mole/kg) as a function of Temerature
bi Langmuir constant (1/Pa) as a function of Temerature
k1,i Langmuir isotherm parameter (mole/kg)
k2,i Langmuir isotherm parameter (1/K)
k3,i Langmuir isotherm parameter (1/Pa)
k4,i Langmuir isotherm parameter (K)
ka parameter to predict CSS profile of TSD method
kb parameter to predict CSS profile of TSD method
kc parameter to predict CSS profile of TSD method
kd parameter to predict CSS profile of TSD method
Cpg heat capacity of gas (J/kg/K)
Cps heat capacity of adsorbent (J/kg/K)
Cv1L valve coefficient at the feed end of the bed during the 1st step
Cv3L valve coefficient at the feed end of the bed during the 3rd step in PSA
Cv3U valve coefficient at the product end of the bed during the 3rd step in FVPSA
Cv4L valve coefficient at the feed end of the bed during the 4th step in FVPSA
De effective diffusivity (m2/sec)
Dparticle particle diameter (m)
Dx dispersion coefficient (m2/sec)
hi heat transfer coefficient (J/m2/sec/K)
-∆H isosteric heat of adsorption (J/mole)
i a component identifier (“i = 1” denotes CO2, “i = 2” is N2)
KL effective axial thermal conductivity (J/m/sec/K)

L bed length (m)
Mw molecular weight
n number of elements for finite difference method
P total pressure (Pa)
PSTP pressure at standard condition (105Pa) (Pa)
Pfeed feed pressure (Pa)
Pi partial pressure (Pa)
Ppurge purge pressure (Pa) in PSA
Ppro Cocurrent blowdown product pressure (Pa) in FVPSA
Preg Countercurrent regeneration pressure (Pa) in FVPSA
Pinitial Initial pressure within the bed (Pa)
qi solid phase concentration (mol/kg)
qi* amount of adsorption of component i in equilibrium state of mixture
R universal gas constant (J/mol/K)
q state variable
Rbed bed radius (m)
Rparticle particle radius (m)
t time (sec)
tcycle cycle time (sec)
tP pressurization time (sec)
tA adsorption time (sec)
tDP depressurization time (sec) in PSA
tPRO cocurrent blowdown product time (sec) in FVPSA
tR purge time in PSA and regeneration time (sec) in FVPSA
T gas temperature within the bed (K)
Twall column wall temperature (K)
TSTP temperature at standard condition (298.15K) (K)
Tfeed feed temperature (K)
u superficial gas velocity (m/sec)
uads inlet feed gas velocity at the feed end of the bed during the adsorption step (m/sec)
ufeed inlet feed gas velocity at the feed end of the bed during the adsorption step (m/sec)
upurge inlet purge gas velocity at the product end of the bed during the purge step (m/sec)

ureg inlet purge gas velocity at the product end of the bed during the purge step (m/sec)
w constraints
yf feed mole fraction
yi mole fraction of component i
z the axial position (m) or state variable
Greek letters
ε CSS tolerance which is a very small value
µ gas viscosity (kg/m/sec)
ρbed bed density (kg/m3)
εbed bed void
ρgas gas density (kg/m3)
∆Hi isosteric heat of adsorption (J/mol) of the component I
ρparticle particle density (kg/m3)
ρwall wall density (kg/m3)
εt total void fraction
φ representative of mole fraction (y), adsorption amount (q) and temperature (T)
Φ objective function

References 1. Siriwardane, R. N2/CO2 isotherm data, NETL, DOE, 2004.
2. Ko, D.; Siriwardane, R.; Biegler, L. T. Optimization of PSA using Zeolite 13x for CO2
Sequestration. 2002 AIChE Annual meeting, Nov. 6, 2002, Indianapolis, Indiana, USA
3. Ko, D.; Siriwardane, R.; Biegler, L. T. Optimization of a pressure-swing adsorption
process using zeolite13x for CO2 sequestration. Ind. Eng. Chem. Res. 2003, 42, 339-
348
4. Alders, J. G. M. Energy Conver. Mgmt. 1992, 33(5-8), 283-286
5. Kessel, L.B.M. et al. IGCC power plant: CO2 removal with moderate temperature
adsorbents, final report. TNO report R98/135. 2002
6. PICHTR, CO2 ocean sequestration: field experiment http://www.co2experiment.org,
2001.
7. Park, J.-H.; Beum, H.-T.; Kim, J.-N.; Cho, S.-H., Numerical analysis on the power
consumption of the PSA process for recovering CO2 from flue gas. Ind. Eng. Chem.
Res. 2002, 41, 4122-4131.
8. IEA Greenhouse R&D program, Carbon dioxide capture from power stations
http://www.ieagreen.org.uk/capt5.htm, 1994.
9. Skarstrom, C. W. Method and apparatus for fractionating gaseous mixtures by
adsorption. US Patent No. 2944627. 1960.
10. Marsh, W. D.; Pramuk, F. S.; Hoke, R. C.; Skarstrom, C. W. Pressure equalization
depressurizing in heatless adsorption. US Patent No. 3 142 547. 1964.
11. Berlin, N. H. Method fo r providing an oxygen-enriched environment, US Patent No. 3
280 536. 1966.
12. Wagner, J. L. Selective adsorption process. US Patent No. 3 430 418. 1984.
13. Ruthven, D. M. Principles of adsorption and adsorption processes. New York: Wiley.
1984.
14. Yang, R. T. Gas separation by adsorption processes. Boston: Butterworths. 1987.
15. Ruthven, D. M.; Farooq, S.; Knaebel, K. S. Pressure swing adsorption. New York: VCH
Publishers. 1994.
16. Chou, C.-T.; Ju, D.-M.; Chang S.-C. Simulation of a fractionated vacuum swing
adsorption process for air separation. Separation science and technology, 1998, 33 (13),

2059-2073.
17. Sircar, S.: Zondlo, J. W. US Patent 4,013,429. 1997.
18. Sicar, S.; Hanley, B. F. Fractionated vacuum swing adsorption process for air separation.
Separation science and technology, 1993, 28 (17&18), 2553-2566.
19. Chou, C.-T.; Huang, W.-C. Incorporation of a valve equation into the simulation of a
pressure swing adsorption process. Chemical Engineering Science, 1994, 49 (1), 75-84.
20. Process Systems Enterprise Ltd. gPROMS introductory user’s guide (release 2.3.1).
June 2004.
21. Process Systems Enterprise Ltd. gPROMS advanced user guide (release 2.3).
February 2004.
22. Jiang, L.; Biegler, L. T.; Fox, V. G. Simulation and optimization of pressure-swing
adsorption systems for air separation. AIChE Journal, 2003, 49(5), 1140-1157.
23. Kim, W.-G.; Yang, J.; Han, S.; Cho, C.; Lee, C.-H.; Lee, H. Experimental and theoretical
study on H2/CO2 separation by a five-step one-column PSA process. Korean J. of Chem.
Eng., 1995, 12(5), 503-511.
Related Documents