Optimization Of Plant Based Diets For Pacific White Shrimp (Litopenaeus vannamei) by Yangen Zhou A dissertation submitted to the Graduate Faculty of Auburn University in partial fulfillment of the requirements for the Degree of Doctor of Philosophy Auburn, Alabama August 02, 2014 Keywords: Pacific white shrimp, soybean meal, apparent digestibility coefficients, DDGS sorghum, copper Copyright 2014 by Yangen Zhou Approved by D. Allen Davis, Chair, Professor of School of Fisheries, Aquaculture, and Aquatic Sciences Claude E. Boyd, Professor of School of Fisheries, Aquaculture, and Aquatic Sciences David B. Rouse, Professor of School of Fisheries, Aquaculture, and Aquatic Sciences Ronald P. Phelps, Associate Professor of School of Fisheries, Aquaculture, and Aquatic Sciences

Welcome message from author
This document is posted to help you gain knowledge. Please leave a comment to let me know what you think about it! Share it to your friends and learn new things together.
Transcript

Optimization Of Plant Based Diets For Pacific White Shrimp
(Litopenaeus vannamei)
by
Yangen Zhou
A dissertation submitted to the Graduate Faculty of Auburn University
in partial fulfillment of the requirements for the Degree of
Doctor of Philosophy
Auburn, Alabama August 02, 2014
Keywords: Pacific white shrimp, soybean meal, apparent digestibility coefficients, DDGS sorghum, copper
Copyright 2014 by Yangen Zhou
Approved by
D. Allen Davis, Chair, Professor of School of Fisheries, Aquaculture, and Aquatic Sciences
Claude E. Boyd, Professor of School of Fisheries, Aquaculture, and Aquatic Sciences David B. Rouse, Professor of School of Fisheries, Aquaculture, and Aquatic Sciences
Ronald P. Phelps, Associate Professor of School of Fisheries, Aquaculture, and Aquatic Sciences

ii
ABSTRACT
Supplies of marine ingredients are finite and their prices are high, fluctuating and the
price is expected to continue to rise. The aquaculture industry has long recognized that the viable
utilization of plant feedstuffs formulated in aquafeeds is essential for the sustainable
development of aquaculture. Soybean meal is regarded as economical and nutritious feedstuffs
with moderate crude protein content and a reasonably balanced amino acid profile, which can
function as the primary protein source in practical shrimp feeds. To facilitate the continued
development of plant based feed formulations, a series of studies were conducted to determine
the impact of utilizing high level of soybean meal on feed formulations. Traditional sources of
soybean meal have certain characteristics including the presence of several antinutritional factors
and a high carbohydrate concentration which may limit the quantity that can be used in the
aquafeeds. New strains of selectively bred non-genetically modified (non-GM) soybeans can
reduce level of trypsin inhibitors, oligosaccharides, and/or enhance protein levels. The first study
evaluated the efficacy of six new varieties of soybean meal in practical feed formulations by
evaluating the biological response of shrimp in terms of growth and in vivo digestibility in high
soy feed formulations. Results of this study demonstrated that new lines of soybean could be
used to improve growth and digestibility coefficients in shrimp feed and the commercialization
of nutritionally improved soybean should be encouraged. Soybean meal is an inexpensive
ingredient. To help reduce the shrimp feed cost, soybean meal can be replaced with other less
expensive ingredients such as Dried Distillers Grains with Solubles (DDGS) from sorghum (S-

iii
DDGS). Furthermore, the use of pelleted or extruded feeds may result in shifts in performance as
the processing conditions are considerably different. Hence, the second component of this
research was to evaluate the biological response to practical diets containing grade level of S-
DDGS in extruded and pelleted shrimp feeds. Results of this study revealed that S-DDGS can be
included in practical diets without negative effects on growth, survival, and feed conversation
ratio (FCR). Hence the use of S-DDGS (up to 40%) should be encouraged as an alternative
protein in shrimp feed formulations. As fishmeal is replaced with plant based protein sources,
there are a number of nutrients that will change, including minerals such as copper, zinc and iron
etc. Copper is essential for the survival of all organisms, including shrimp. Three trials in this
study were conducted to evaluate growth and tissues response to two copper sources (copper
sulfate pentahydrate and tri-basic copper chloride) for L. vannamei in a practical feed
formulation. Results in this study demonstrated that tri-basic copper chloride (TBCC) was a safe,
effective and highly available source of copper in shrimp diet formulations for L. vannamei.
Overall, results from these studies reveal that the use of new varieties of soybean meal
should be encouraged for use in shrimp feed formulations. Meanwhile, it also indicated the use
of high level of soybean meal as main protein source in combination with S-DDGS in formulated
diets formulation as long as essential nutrients in diets are properly balanced to meet shrimp
nutritional requirements. In addition, TBCC could be used as alternative copper source in shrimp
diet formulations for L. vannamei.

iv
ACKNOWLEDGMENTS
This dissertation is dedicated to my major professor, Dr. Donald. A. Davis. I would like
to extend my special thanks for his patience and encouragement, as well as all the valuable
guidance and support during my whole Ph.D. process. I am grateful to all my other committee
members, Dr. Claude E. Boyd, Dr. David B. Rouse, and Dr. Ronald P. Phelps, for their
participation and suggestions in completing this program.
I deeply thank my father, Qiren Zhou, my older sister Qingru Zhou and my older brother
Zonghuai Zhou for their love, support and encouragement. Hearty thanks to my mother Meizhu
Chen for her invaluable love, encouragement, and enlightenments. I would like to thank my
girlfriend Ke Liu for her enthusiasm and unconditional support throughout this time in Auburn.
I would like to thank Dr. Luke Roy, Dr. Guillaume Salze, Melanie Rhodes, Daranee
Sookying, Fabio Soller Dias da Silva, Waldemar Rossi Junior, Bochao Hu, Matthew Ferrell,
Jerrod Duncan, Sirirat Chatvijikul, and Xiaoyun Fang for all their help and friendship during my
Auburn experience. I would like to thank Julio M. Achupallas and Rebecca L. Cook for being
my partner during the whole summer culture period. Appreciation is also extended to the staffs
of Auburn aquatic nutrition lab and North Auburn Fisheries station, for their support and help
during the completion of the project. I also would like to thank Ocean University of China and
School of Fisheries, Aquaculture, and Aquatic Sciences of Auburn University for offering me a

v
chance to study abroad and to pursue a Ph.D. degree. I would like to especially thank the Chinese
Scholarship Council for the financial support.
Especially, I offer my gratitude and deep appreciation to friends, colleagues, and students,
faculty, and the staffs of Swingle Hall for their friendship, hospitality, assistance, knowledge,
and support during the completion of the project. I also want to thank the Alabama Department
of Conservation and Nature Resources, Marine Resources Division, Claude Peteet Mariculture
Center for allowing the use of their facilities during the development of this study and for their
physical and logistic support.
Finally, I would like to express my appreciation for the support and funding of this study
in part from the United Soybean Board, Navita Premium Feed Ingredients, Inc., the United
Sorghum Checkoff Program (USA) and Hatch Funding Program of Alabama Agriculture
Experiment Station.

vi
Style of journal used: Aquaculture���
Computer software used: Word Perfect 12, Microsoft Power Point, Microsoft Excel XP,
and SAS v. 9.3

vii
TABLE OF CONTENTS
ABSTRACT .................................................................................................................................... ii
ACKNOWLEDGMENTS ............................................................................................................. iv
LIST OF TABLES ......................................................................................................................... ix
LIST OF FIGURES ....................................................................................................................... xi
CHAPTER I INTRODUCTION .................................................................................................... 1
CHAPTER II USE OF NEW SOYBEAN VARIETIES IN PRACTICAL DIETS FOR PACIFIC WHITE SHRIMP, Litopenaeus vannamei ...................................................................................... 8
Abstract ............................................................................................................................... 8
Introduction ......................................................................................................................... 9
Materials and Methods ...................................................................................................... 10
Results ............................................................................................................................... 14
Discussion ......................................................................................................................... 15
References ......................................................................................................................... 21
CHAPTER III UTILIZATION OF SORGHUM CO-PRODUCT (S-DDGS) IN AQUATIC ANIMAL FEED PRODUCTION FOR PACIFIC WHITE SHRIMP Litopenaeus vannamei ..... 35
Abstract ............................................................................................................................. 35
Introduction ....................................................................................................................... 37
Materials and Methods ...................................................................................................... 40
Results and Discussion ..................................................................................................... 46
viii
Conclusion ........................................................................................................................ 54
References ......................................................................................................................... 55
CHAPTER IV COMPARATIVE EVALUATION OF COPPER SULFATE AND TRIBASIC COPPER CHLORIDE ON GROWTH PERFORMANCE AND TISSUE RESPONSE IN PACIFIC WHITE SHRIMP Litopenaeus vannamei FED PRACTICAL DIETS ........................ 76
Abstract ............................................................................................................................. 76
Introduction ....................................................................................................................... 78
Materials and Methods ...................................................................................................... 80
Results ............................................................................................................................... 84
Discussion ......................................................................................................................... 87
References ......................................................................................................................... 93
CHAPTER V SUMMARY AND CONCLUSIONS .................................................................. 111
LITERATURE CITED ............................................................................................................... 114

ix
LIST OF TABLES
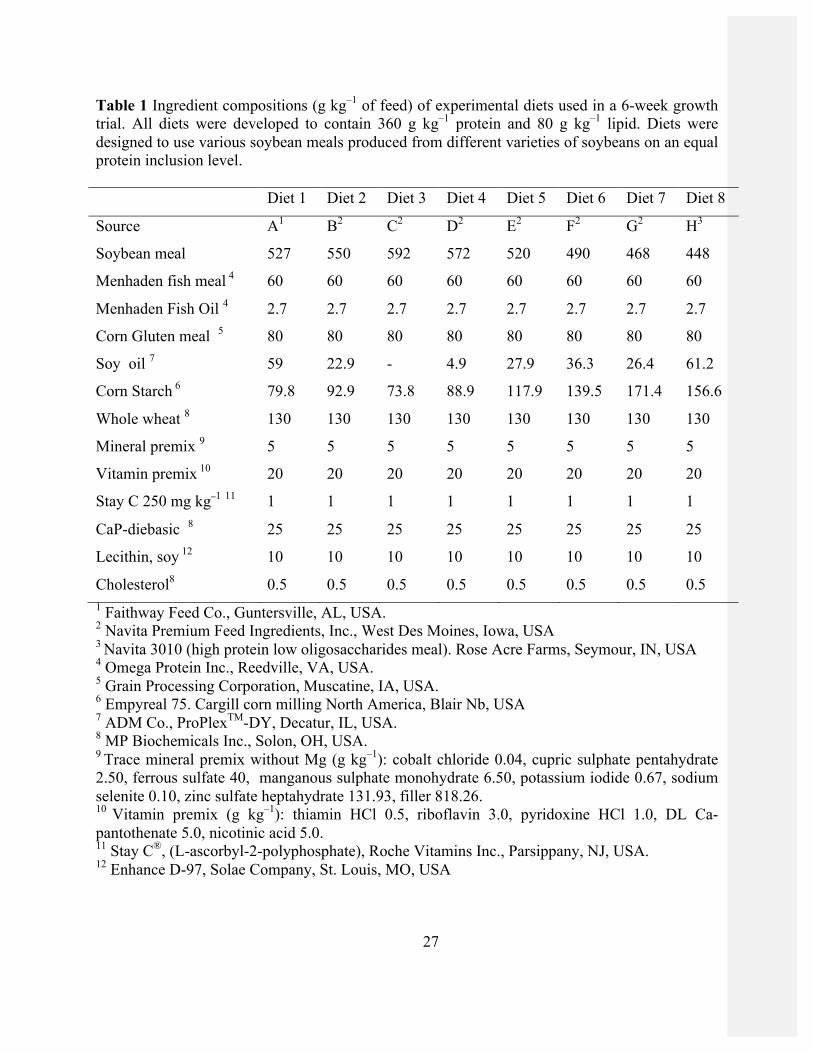
CHAPTER II Table 1 Ingredient compositions (g kg–1 of feed) of experimental diets uses in a 6-week growth
trial. All diets were developed to contain 360 g kg–1 protein and 80 g kg–1 lipid. Diets were designed to use various soybean meals produced from different varieties of soybeans on an equal protein inclusion level 27
Table 2 Formulation of the reference diet for determination of digestibility coefficients in
Litopenaeus vannamei 28 Table 3 Proximate composition, amino acid and carbohydrate profiles of the experimental
ingredients 29
Table 4 Response of juvenile L. vannamei (0.52 g initial weight) offered a plant based diet using
various types of soybean meal over a 6-week culture period 31 Table 5 Apparent dry matter digestibility (ADMD), apparent protein digestibility (ADP), and
apparent energy digestibility (ADE) in a trial with shrimp offered a reference diet (RD) or test dies of the RD (70%) and one of eight sources of soybean meal (30%) 32
Table 6 P-values from correlation analysis of apparent digestibility of dry matter (ADMD),
energy (ADE), and crude protein (ADP) with the chemical characteristics of the ingredient 33
CHAPTER III Table 1 Composition (g kg-1 as is basis) of five practical diets formulated with different levels of
distillers dried grains with solubles from sorghum (S-DDGS) as a partial replacement for solvent extracted soybean meal and whole wheat 63
Table 2 Proximate composition of the sorghum based distillers dried grains 64 Table 3 Proximate composition of extruded and pelleted S-DDGS based aquatic feeds (g kg–1) 65 Table 4 Sinking characteristics of extruded and pelleted S-DDGS based aquatic feeds 66 Table 5 Degree of gelatinization of extruded and pelleted S-DDGS based aquatic feeds 67

x
Table 6 Water stability property of extruded and pelleted S-DDGS based aquatic feeds 68 Table 7a Response of juvenile L. vannamei (0.35 ± 0.032 g) to the test diets after a 63-day
growth trial. Diets were either extruded (E) or pelleted (P) 69 Table 7 b Response of juvenile L. vannamei (0.38 ± 0.02 g) to the test diets after a 42-day growth
trial (Trial 2). Diets were either extruded (E) or pelleted (P) 70 CHAPTER IV Table 1 Composition of six practical diets formulated with increasing percentages of dietary
copper 5, 10 and 20 mg kg–1 from CuSO4 containing 254.5 g kg–1 copper or TBCC containing 588.1 g kg–1 copper. The diets were formulated to be isonitrogenous at 360 g kg–1 protein and 80 g kg–1 lipid 101
Table 2 Composition of six practical diets formulated with different dietary copper level (0, 5,
10, 20, 40 and 60 mg kg–1) from TBCC containing 588.1 g kg–1 copper. The diets were formulated to be isonitrogenous at 360 g kg–1 protein and 80 g kg–1 lipid 103
Table 3 The treatments in three trials used to evaluate the efficacy of different sources of copper
in Pacific white shrimp Litopenaeus vannamei 105 Table 4 Effect of dietary copper sources and levels on performance of Litopenaeus vannamei 106 Table 5 Effects of dietary copper sources and levels on copper concentrations of carapace,
hepatopancreas, hemolymph, heart index and hepatopancreas index in Litopenaeus vannamei 108
Table 6 Relative bioavailability values (RBV) of Cu based on multiple linear regression of log10
Cu concentrations in carapace, hepatopancreas and hemolymph of shrimp on dietary analyzed Cu during the culture period 109

xi
LIST OF FIGURES
CHAPTER II Figure 1 Relationship between ADCs of crude protein and energy versus trypsin inhibitor for
differences soybean meal 34 CHAPTER III Figure 1 Schematic diagram of single screw elements for X-20 extruder with barrel temperature
profile 71 Figure 2 Specific mechanical energy input during extrusion of S-DDGS based aquatic feeds 72 Figure 3 Bulk density of extruded and pelleted S-DDGS based aquatic feeds 73 Figure 4 Expansion ratio of extruded and pelleted S-DDGS based aquatic feeds 74 Figure 5 Pellet durability index of S-DDGS based extruded and pelleted diets using both (a)
unmodified and (b) modified (more rigorous, with metal pieces) testing methods 75 CHAPTER IV Figure 1 Effects of dietary copper sources with levels pooled, on carapace, hepatopancreas, and
hemolymph in Litopenaeus vannamei in trial 1 (A) and trial 2 (B) 110

1
CHAPTER I
INTRODUCTION
Pacific white shrimp (Litopenaeus vannamei) is native to the eastern Pacific Ocean, from
the Mexican state of Sonora to as far south as northern Peru. Currently, it is one of the most
prevalent cultured species and accounts for over 66% shrimp aquaculture production, which
totaled 3.49 million metric tonnes globally with a worldwide value over $14 billion in 2009
(FAO, 2011). Reasons for this increased production include the capacity of L. vannamei for rapid
growth, good survival in high-density culture, and disease tolerance for intensive grow-out
production (Williams et al., 1996; Ponce-Palafox et al., 1997).
Maintaining the growth of the shrimp industry depends in large part on having adequate
supplies of high-quality feed. Current feed formulations rely on fishmeal and fish oil as primary
nutrient sources. The predicted supplies of these key ingredients are clearly inadequate to support
the demand, and levels used in feeds will have to be reduced (NRC, 2011). In addition, the costs
of fishmeal and fish oil have increased over time due to increased demand, limitations of
availability, and growing social and environmental concerns regarding wild fish extraction
practices (Tacon and Metian, 2008). Hence, the aquaculture industry has long recognized the
need to reduce the quantities of marine feed ingredient in aquaculture diets.
Soybean meal is considered a reliable and cost-effective protein source for shrimp feeds.
The reasons for this are the high protein content, high digestibility, relatively well-balanced
amino acid profile, reasonable price, and steady supply (Amaya et al., 2007a, b; Baker 2000;
Davis and Arnold, 2000). Among the common ingredients that have been investigated as
fishmeal replacements, soybean meal has generally been successfully incorporated into shrimp
formulations (Akiyama et al., 1989; Álvarez et al., 2007; Davis and Arnold 2000; Forster et al.,

2
2003; Hardy, 1999; Lawrence et al., 1986; Lim and Dominy, 1990, 1991, 1992; Mendoza-Alfaro
et al., 2001; Paripatananont et al., 2001; Piedad-Pacual et al., 1990; Sookying and Davis, 2011,
2012). The protein digestibility value was found to be higher in soybean protein (96.4%) than
that in marine animal meals such as fish meal (80.7%), shrimp meal (74.6%), and squid meal
(79.7%) for L. vannamei (Akiyama et al., 1989). However, Lim and Dominy reported (1990) the
weight gain of shrimp significantly decreased as levels of dietary soybean meal increased to 42%
or higher, and the 70% soybean meal diet was utilized very poorly by the shrimp. Commodity
soybean meal has a number of anti-nutritional factors that limit its inclusion in feed formulations
(Liener, 2000). However, new strains of selectively-bred, non-genetically modified (non-GM)
soybeans have reduced levels of oligosaccharides, lecithin, trypsin inhibitors, and/or enhanced
levels of protein, which may support better growth, improved digestion, and afford higher
substitutions in formulations for marine shrimp.
Digestibility data are very important for the formulation of suitable feeds. Nutrient
digestibility information is indispensable for L. vannamei to improve the accuracy of a diet in
formulation. Determining digestibility of food and feeds in animals requires collection of fecal
material. Direct and indirect methods are used to collect feces. The indirect method of
digestibility determination is widely used with most species of farmed fish and shrimp. This
method relies on the collection of a representative sample of feces that is free of uneaten feed
particles and the use of a nontoxic, inert, indigestible digestion indicator, such as chromic oxide
or yttrium oxide. The term “Apparent digestibility coefficients” (ADC) is used to acknowledge
the fact that values obtained using either the direct or indirect method are not corrected for
endogenous gut losses (NRC, 2011). The indirect method of digestibility determination is widely
used with most species of farmed fish and shrimp. This method relies on the collection of a

3
representative sample of feces that is free of uneaten feed particles and the use of a nontoxic,
inert, ingestible digestion indicator, such as chromic oxide or yttrium oxide, added to feed (NRC,
2011). Apparent digestibility coefficients could be used to select ingredients that optimize the
nutritional value and cost of formulated diets and also provide estimates of nutrient availability
in foods. Apparent digestibility coefficients for dry matter, protein, lipid, energy, phosphorus,
amino acids and chitin have been determined for L. vannamei (Akiyama et al., 1989; Brunson et
al., 1997; Clark et al., 1993; Cruz-Suárez et al., 2009; Smith et al., 1985; Yang et al., 2009).
According to the available research, there is lack of information on apparent digestibility
coefficients for new varieties of soybean meal for L. vannamei.
Distiller’s dried grains with solubles (DDGS) is also a potential protein source for shrimp
feed due to its low price and consistent supply as a co-product of the bio-ethanol production
which is expected to increase rapidly in the next decade. In 2001, the United States produced
about 3.1 million metric tonnes of DDGS. The production of DDGS has increased rapidly from
16.4 million metric tonnes in 2006 to 35.3 million tonnes in 2010 (Renewable Fuels Association
2010). Therefore, DDGS has become a promising protein ingredient due to its low cost and
abundant supply. The nutrient composition of DDGS contains crude protein, fat, ash, acid
detergent fiber, and neutral detergent fiber ranging from 26.0-31.7%, 9.1-14.1%, 3.7-8.1%, 11.4-
20.8%, and 33.1-43.9%, on dry matter basis, respectively (Cromwell et al., 1993). However, the
protein quality of DDGS is poor because of the low level of some essential amino acid contents,
particularly lysine (Liu and Rosentrater, 2012). Spiehs et al. (2002) reported that DDGS
contained about 30% crude protein from 119 samples for 10 essential amino acids and that the
average values of lysine, methionine, tryptophan, threonine, arginine, histidine, phenylalanine,
4
isoleucine, leucine, and valine were 0.85, 0.55, 0.25, 1.13, 1.20, 0.76, 1.47, 1.12, 3.55, and
1.50%, respectively.
Feed ingredients are selected and combined based on their nutritional content, cost and
how they affect the physical characteristics of pellet. Feed manufacturing is the physical process
of forming feed ingredient mixture into particles used to feed shrimp. Most commercial feeds are
manufactured as pellets using cooked extrusion, compression pelleting, or cold extrusion
processes (NRC, 2011). Pelleting is by far the most popular method of producing crustacean
feeds due to its technological and economic advantages (Lovell, 1989, 1990; MacGrath, 1976).
The advantages of pelleted feed include less bridging in bins, dust and feed waste, increased bulk
density, nutrient density and nutrient availability, reduced ingredient segregation, decreased
microbiological activity and improved palatability. While many processing technologies result in
an agglomerated feed, only a few have sufficient energy inputs to ensure microbiological safety
of feed. Feed safety is a major factor in choosing extrusion methods over traditional pelleting
methods (Riaz, 2009).
Extruded pellets have advantages over steam pellets for they generally have superior
water stability and floating properties, which allow direct determination of feed consumption
(Stickney, 1979). Robinette (1977) reported that the extrusion processing has much greater levels
of heat, moisture, and pressure than steam pelleting. These higher levels may increase the
bioavailability of carbohydrate and destroy heat labile anti-nutrients. Compared to steam
pelleting, extrusion processing can also damage nutrients such as ascorbic acid (Hilton et al.,
1977; Lovell and Lim, 1978). Hilton et al. (1981) indicated that extruded pellets increased the
gastric emptying time of trout which was probably responsible for the reduced total feed
consumption and weight gain but may have improved feed efficiency. In the rainbow trout

5
(Salmo gairdneri R.) extrusion processing appeared to increase carbohydrate digestion and
absorption, increase liver, body weight and percent liver glycogen content as compared with
steam pelleting (Hilton et al., 1981). Although both systems have advantages, there is a lack of
studies that evaluate the biological response of shrimp to typical practical diet that are processed
using extrusion or pelleting technologies.
As fishmeal is substituted with alternative plant based protein sources, there are a number
of nutrients that will change, including minerals. As compared to most other nutrient groups,
information concerning mineral nutrition of shrimp is limited. Conducting research on mineral
nutrition of aquatic species is relatively difficult. Problems associated with quantification of
mineral requirements include identification of the potential contribution of minerals from the
water, leaching of mineral from the diet prior to consumption, and availability of suitable test
diets that have a low concentration of the targeted mineral (NRC, 2011). The metabolism of
various minerals by aquatic organisms is influenced not only by dietary concentrations but also
by the concentration and relative composition of dissolved ions in the aquatic medium, which
may influence the organism’s osmoregulation, ion regulation, and acid-base balance (Moyle and
Cech, 2000).
Copper (Cu) is an essential element for all organisms including fish (Watanabe et al., 1997;
Lorentzen et al., 1998). It functions in hematopoiesis and in numerous copper dependent
enzymes including lysyl oxidase, cytochrome C oxidase (CCO), superoxide dismutase (SOD),
ferroxidase, and tyrosinase (O'Dell, 1976). It is also important as a part of antioxidant enzymes
(Lorentzen et al., 1998). Crustaceans utilize hemocyanin as the oxygen-carrying pigment. This
copper-containing pigment has an analogous role to hemoglobin in red-blooded animals (Lovell,
1989).

6
Knowledge of bioavailability of supplemental copper sources plays a vital role in selection
of a copper source in feed production (Miles et al., 1998; Spears et al., 2004; Luo et al., 2005).
Copper sulfate (CuSO4) is the most common form of copper used in feeds for growth promotion.
Chelated forms of various elements have also been found to be effective for some aquatic
animals (Paripatananont and Lovell, 1995, 1997; Apines-Amar et al., 2004). Chelated minerals
are widely utilized in the livestock and poultry industries; however, research concerning these
compounds with respect to aquatic species such as fish has been very limited (Apines-Amar et
al., 2003, 2004). Tri-basic copper chloride (TBCC) is a more concentrated form of copper than
copper sulfate (58% vs 25% Cu). Because it has low hygroscopicity and is insoluble in neutral
water, it should be a less reactive and less destructive form of copper when combined with
vitamins in diets (Cromwell et al., 1998). Cromwell et al. (1998) indicated that TBCC was as
effective as copper sulfate to improve growth for weanling pigs. Luo et al. (2005) reported that
TBCC was a safer product and was more available than copper sulfate for broilers, and similar
results were found in steers (Spears et al., 2004). According to the available research, there is a
lack of information for evaluating the growth performance and bioavailability of two copper
sources [copper sulfate pentahydrate (CuSO4) and tri-basic copper chloride (TBCC)] for L.
vannamei.
The long-term goal of this study is to use new varieties of soybean meal and Dried
Distillers Grains with Solubles (DDGS) from sorghum (S-DDGS) as an alternative protein
source in shrimp feed formulation to improve the sustainable development of aquaculture. To
further optimize plant-based feeds, trace mineral supplements may also need to be optimized.
Three specific objectives were included as follows:

7
1. Determine growth performance and digestibility coefficients for protein, energy and
dry matter for new varieties of soybean meal in Pacific white shrimp juvenile L. vannamei.
2. Evaluate the effect of processing methods (extrusion and pelleting) on physical and
nutritional characteristics of shrimp feed with different levels of S-DDGS.
3. Evaluate the growth performance, tissues response and bioavailability of two copper
sources (copper sulfate pentahydrate and tri-basic copper chloride) for L. vannamei in practical
feed formulations.

8
CHAPTER II
USE OF NEW SOYBEAN VARIETIES IN PRACTICAL DIETS FOR PACIFIC WHITE
SHRIMP, Litopenaeus vannamei
Abstract
This study was designed to evaluate the efficacy of eight sources (designated A-H) of
soybean meal (SBM) that included six new non-genetically modified soy varieties in practical
feed formulation for Litopenaeus vannamei, using both growth and digestibility trials. A soybean
meal-based reference diet was formulated by using conventional soybean meal (527 g kg–1 diet),
which was then replaced on an iso-nitrogenous basis with various other experimental soybean
meals. In a 6-week growth trial, shrimp in four replicate tanks per dietary treatment (10
shrimp/tank, initial weight 0.52 ± 0.04 g) were cultured in a recirculating system. There were no
significant differences with respects to percent weight gain and survival across all dietary
treatments; however, final weights and FCR were lower in shrimp offered diet 3. Apparent
digestibility coefficients for the eight (A–H) different soybean meals were determined in L.
vannamei for dry matter (ADMD), gross energy (ADE) and crude protein (ADP) using 10 g kg–1
chromic oxide as inert marker with 70:30 replacement techniques. Coefficients ranged from
71.3%–88.3%, 76.6%–91.3%, and 93.6%–99.8%, for ADMD, ADE, and ADP, respectively.
Improved digestibility values were observed in soybean C, which was characterized by crude
protein (471 g kg–1), crude fat (97 g kg–1), low cooking temperature (180 °C), higher nitrogen
solubility index (689 g kg–1), and protein dispersibility index (619 g kg–1). This indicates that
new lines of soybean meal can be used to improve digestibility coefficients in shrimp feeds.

9
1. Introduction
The use of cost-effective feed formulations for L. vannamei is critical to improving profit
margins by reducing feed cost. The selection of appropriate feed ingredients should target not
only cost reduction but also improving the nutritional quality of feeds and reducing metabolic
waste while meeting all nutrient requirements of the rapidly growing shrimp. Ingredient
digestibility is the measurement of the proportion of energy and nutrients that an animal can
obtain from a particular ingredient through its digestive and absorptive processes (Glencross et
al., 2007). Apparent digestibility coefficients can be used to select ingredients that optimize the
nutritional value and cost of formulated diets and also provide estimates of nutrient availability
in feeds. Therefore, the nutrient digestibility data of diets and feed ingredients are of utmost
importance to nutritionists and feed formulators to optimize nutritional value and the cost of diets
(Smith et al., 2007).
Although several studies of nutrient digestibility for shrimp feed have been documented
(Akiyama et al., 1989; Brunson et al., 1997; Cruz-Suárez et al., 2009; Davis et al., 1993; Nieto-
López et al., 2011; Smith et al., 2007, 1985; Terrazas-Fierro et al., 2010; Yang et al., 2009),
information on digestibility coefficients for novel feed ingredients is indispensable to accuracy in
dietary formulations as these ingredients become commercially available. Among the common
ingredients that have been investigated as fishmeal replacements, soybean meal has generally
been successfully incorporated into shrimp formulations (Akiyama, 1989; Álvarez et al., 2007;
Amaya et al., 2007; Davis and Arnold, 2000; Lawrence et al., 1986; Lim and Dominy, 1990;
Mendoza-Alfaro et al., 2001; Sookying and Davis, 2011, 2012; Zhu et al., 2013). Because of its
steady supply, price and amino acid composition, soybean meal is one of the primary protein
sources used today in animal feeds (Baker, 2000). Nevertheless, the nutritional value of

10
conventional soybean meal is often lower compared to that of fishmeal for penaeid shrimp
(Zaldivar, 2002). Commodity soybean meal has a number of anti-nutritional factors that limit its
inclusion in feed formulations (Liener, 2000). However, new strains of selectively-bred non-
genetically modified (non-GM) soybeans can have reduced levels of oligosaccharides, lectins,
trypsin inhibitors and/or enhanced levels of protein that may afford higher substitutions in
formulations for marine shrimp. As explained before, digestibility coefficients for new varieties
of soybean meal in practical diets for L. vannamei are presently unavailable as is an assessment
of the biological responses of penaeid shrimp to these novel feed ingredients. Therefore, the
objective of the present study was to determine growth performance and digestibility coefficients
for protein, energy and dry matter for new varieties of soybean meal in Pacific white shrimp
juvenile L. vannamei.
2. Materials and Methods
Eight sources of soybean meal, including six new varieties of non-GM soybean meal
were obtained for the evaluation of their potential as an ingredient in aquaculture feeds for L.
vannamei. These ingredients were characterized and then used in two experiments, including
both growth and digestibility trials. Commodity soybean meal A was obtained from Faithway
Feed Co., LLC, Guntersville, AL. The non-GM soybean meals were donated by Navita Premium
Feed Ingredients (NPFI), West Des Moines, IA, USA. These were genetically unique, patented
non-GM soy cultivars that contained increased levels of protein and amino acids and reduced
levels of some anti-nutritional factors. Beans of different cultivars (B–H) were produced in Iowa,
Illinois, Indiana and Maryland, USA, and made into meals by conventional processing methods.

11
A complete chemical characterization of each meal is provided in Table 3 for dry matter,
moisture, fiber, fat, crude protein and ash (Eurofins Scientific, Inc. through NPFI).
2.1. Growth trial
Eight plant-based diets (Table 1) using soybean meals as the primary protein source were
utilized to evaluate the biological response of shrimp to the various dietary treatments. The
growth trial was conducted with juvenile shrimp reared over a 6-week period in a low salinity,
indoor recirculating culture system. Each test diet was offered to four replicate tanks of shrimp.
Research was conducted at the E.W. Shell Fisheries Research Station (EWS), Auburn,
AL, USA. Pacific white shrimp, L. vannamei, post larvae were obtained from Shrimp
Improvement Systems (Islamorada, FL). At the conclusion of the nursery phase, juvenile shrimp
(0.52 ± 0.04 g) were hand-sorted for uniform size and stocked into 40 aquaria (60 L) at a density
of 10 shrimp tank–1.
To minimize shrimp losses due to jumping, each aquarium was covered with a plastic
plate. Each tank was provided with one air-stone. Tanks were filled with reconstituted seawater,
and culture water was circulated throughout the system at a rate of 3.6 L min-1 to provide one full
turnover of water exchange approximately every hour. Water temperature, dissolved oxygen
(DO) and salinity were monitored twice daily (0830 and 1630) using a YSI 650 multi-parameter
instrument (YSI, Yellow Springs, OH) and were maintained within acceptable levels for L.
vannamei at 28.28 ± 1.55 °C, 6.42 ± 0.41 mg L–1 and 3.99 ± 1.01 g L–1, respectively.
Experimental diets for the growth trial were prepared at the Aquatic Animal Nutrition
Laboratory of the School of Fisheries, Aquaculture, and Aquatic Sciences, Auburn University
(Auburn, AL, USA), using standard procedures for the laboratory production of shrimp feeds to

12
contain 360 g kg–1 protein and 80 g kg–1 lipid. Pre-ground dry ingredients and oil were mixed in
a food mixer (Hobart Corporation, Troy, OH, USA) for 10–15 min. Hot water was then blended
into the mixture to obtain a consistency appropriate for pelleting. Diets were pressure-pelleted by
using a meat grinder with a 3-mm die, air dried (< 50 ̊C) to a moisture content of 8–10%. After
drying, pellets were crumbled, packed in sealed plastic bags and stored in a freezer (-20 ̊C) until
use. Dietary treatments were randomly assigned, and each experiment was conducted using a
double blind experimental design. The protein value for the diets was confirmed, ranging from
342 to 357 g kg–1 diet on an as is basis.
Shrimp were fed four times daily. Based on historic results, feed inputs were determined
assuming a weight gain of 0.8 g per week and feed conversion ratio (FCR) of 2. Shrimp were
counted each week to adjust rations for mortality. At the conclusion of the 6-week growth trial,
shrimp were counted and group-weighed. Mean final weight, final biomass, percent survival, and
feed conversion ratio were determined.
2.2. Digestibility trial
Apparent digestibility coefficients for dry matter, protein and energy in eight sources of
soybean meal were determined by using chromic oxide (Cr2O3, 10 g kg–1) as an inert marker.
The reference diet (Table 2) was formulated to contain 280 g kg–1 crude protein and 80 g kg–1
lipid. The test diets (70:30 mixture of reference diet and test ingredient), which contained 322–
391 g kg–1 protein and 80 g kg–1 lipid, were produced using the previously mentioned technique.
Proximate composition, amino acid, and carbohydrate profiles of eight sources of soybean meal
are shown in Table 3.

13
Four replicate groups of 10 shrimp (~ 8.8 g mean weight) were stocked in a closed
recirculating system consisting of sixteen 60-L plastic tanks, biological filter, reservoir,
circulation pump, and supplemental aeration. Shrimp were allowed to acclimate to each diet for 3
d. before starting the collection of feces. Feces were collected for 5–7 d. Prior to each feeding
the tanks were cleaned by siphoning. The shrimp were then offered an excess of feed. One hour
after offering the feed, feces were collected by siphoning through a 500 µm mesh screen. Shrimp
were offered five feedings per day. To ensure the fecal strands were from the current day’s feed,
feces obtained after the first feeding were discarded. Collected feces were rinsed with distilled
water, sealed in plastic containers and frozen (-20 °C). Samples from four replicate tanks were
kept separate and frozen until analyzed. Samples were dried by placing each sample in an oven
at 105 °C until a constant weight was obtained. Gross energy of diets and fecal samples were
analyzed with a semi micro-bomb calorimeter (Model 1425, Parr Instrument Co., Moline, IL,
USA). Chromic oxide concentrations were determined by the method of McGinns and Kasting
(1964) in which, after a colorimetric reaction, absorbance was read on a spectrophotometer
(Model 4001/4, Thermo Spectronic Genesys 20, Thermo Fisher Scientific, FL,) at 540 nm.
Protein was determined by micro-Kjeldahl analysis (Ma and Zuazago, 1942). All sample
analyses were conducted in triplicate. The ADC of energy and dry matter of each diet and the
ADC of energy for the feed ingredients were determined using standard formulas (Cho et al.,
1982). The ingredient ADC of energy was adjusted according to Forster (1999).
The apparent digestibility coefficients for dry matter (ADMD), protein (ADP) and energy
(ADE) were calculated according to Maynard and Loosli (1969) and Hardy and Barrows (2002),
as follows:

14
ADMD % = 100 − 100×% Cr!O! in feed% Cr!O! in feces
ADP and ADE % = 100 − 100×% Cr!O! in feed% Cr!O! in feces
×% nutrient feces% nutrient feed
2.3. Statistical analysis
Statistical analyses were performed using SAS 9.2 (SAS Institute, Cary, NC, USA). Data
was analyzed by using one-way analysis of variance to determine if significant differences
existed among treatment means. Duncan’s multiple range tests were used to identify significant
differences between treatment means. Correlation and regression analyses were used to explore
possible interactions of chemical properties of the soybean meals with digestibility values. All
statistical tests were considered significant at P < 0.05.
3. Results
The overall means for water quality variables observed over a 6-week trial were
maintained within suitable ranges for growth of this species. Water temperature ranged from
24.60 to 31.70 °C with an average of 28.28 ± 1.55 °C, salinity varied from 2.5 to 5.8 g L–1 with
an average of 3.99 ± 1.01 g L–1, and dissolved oxygen ranged from 5.50 to 7.20 mg L–1 with an
average of 6.42 ± 0.41 mg L–1. Results from the growth trial reveal that final biomass, final mean
weight, percent weight gain, FCR and survival were typical for this system (Table 4). Final
biomass ranged from 29.2 to 38.7 g, mean final weight from 3.9 to 4.4 g, survival from 72.5 to
97.5 %, FCR 2.1 to 2.8, and percent weight gain from 599.0 to 771.9%. In regards to survival
and percent weight gain there was no significant difference among any of the treatments. There
UnknownField Code Changed

15
was minor difference (P = 0.037) between diet 3 and other diets, and no significant differences
among other diets on final mean weight and FCR.
Apparent digestibility coefficients for the reference diet, test diets, and ingredients are
presented in Table 5. Determined coefficients for the experimental diets ranged from 71.95% to
77.06% for ADMD, 88.95% to 92.97% for ADE, and 77.57% to 82.14% for ADP (Table 5).
Interestingly, ADMD, ADP, ADE coefficients in the reference diet (RD) were significantly
lower than reference diet with soybean meal C (RDC) and reference diet with soybean meal H
(RDH).
Apparent dry matter digestibility coefficients for the test ingredients ranged from 71.26%
to 88.26% (Table 5). Significant differences (P < 0.05) in ADMD of the test ingredients were
observed. For the high-fiber (56 g kg–1) ingredient B, ADMD was lowest and significantly so as
compared to ADMD values for soybean meal A, C and H. A tendency was observed for ADMD
values to be lower in ingredients with high fiber content. Apparent crude protein digestibility
coefficients in the ingredients ranged from 93.64% to 99.79% (Table 5) and that of meal C was
highest among all ingredients tested, being significantly higher than ADP of meals A, D and E.
The ADE coefficients in test ingredients ranged from 76.62% to 91.34% (Table 5). The ADE
coefficient of soybean meal B was lowest among all tested ingredients and was significantly
lower than ADE of meals A, C and H.
4. Discussion
Dietary protein plays a vital role affecting growth performance and feed cost (Hu et al.,
2008). Consequently, highly digestible protein sources would make it easier for shrimp to
assimilate protein and presumably grow faster than shrimp fed marginally digestible feed

16
ingredients. Similarly, higher protein availability in shrimp feeds would facilitate higher protein
deposition into tissues and decrease excretion of nitrogen metabolites into the environment.
Because the proportion of nutrients that are absorbed in a form readily utilizable by shrimp is
affected by, among other things, anti-nutrients, it is possible that selectively bred soybean
varieties with reduced levels of anti-nutritional factors may afford an increased bioavailability of
nutrients to shrimp. This would make possible a higher inclusion level in feeds than conventional
commodity soybean meal which, in turn, could reduce the overall cost of shrimp feed
formulations.
In the present study only minor differences in final mean weight and final biomass and no
significant differences in percent weight gain and survival were observed. This indicates that all
diets containing the various sources of soybean meal were able to support reasonable growth and
survival of shrimp over a 6-week culture period. There were significant differences in mean final
weights (Table 4), with diet 3 producing the smallest shrimp (3.4 g) and diet 4 the largest (4.4 g)
shrimp. It is interesting to note the poorest growth and highest survival rate was observed in
shrimp fed diet 3, which utilized meal C. This meal also had the highest digestibility values
(ADP 99.8%) as compared to other meals. These results confirm that digestibility and growth do
not always go hand in hand. The improved growth performance of shrimp maintained on diets 4
using ingredient D, may be due to the reduced level of trypsin inhibitors (52,100 TIU vs 19,500
TIU in meal C vs D, respectively) and relatively lower levels of oligosaccharides (58.5 g kg–1 vs
50.7 g kg–1 combined raffinose and stachyose in the meal C and D, respectively), which may
have influenced growth. These results indicate that the composition of soybean meal can
influence growth and consequently the development of soybean lines with modified nutrient
profiles is warranted.

17
The apparent dry matter digestibility coefficients provide a measure of the total quantity
of an ingredient that is digested and absorbed. Because not all the components of a feedstuff are
digested equally, ADMD coefficients, by definition provide an estimate of the quantity of
indigestible materials present in a feed ingredient (Brunson et al., 1997). The ADMD coefficients
for different soybean meal sources in this study with L. vannamei ranged from 71.26% to
88.26%. In contrast, Akiyama et al. (1989) reported an ADMD value for soybean meal of only
55.9% for the same species using nutritionally incomplete diets. More in agreement with results
from the present study, Divakaran et al. (2000) reported ADMD values for de-hulled, solvent-
extracted, toasted soybean meal as ranging from 61.2% to 84.7%. More recently, Cruz-Suárez et
al. (2009) also obtained ADMD values with L. vannamei for four different soybean products
ranging from 82.7% to 91.7%. Values for ADMD obtained in the present study are in general
agreement with those observed in previous studies. Slight differences in these values may be due,
in part, to differences in the size of shrimp utilized, specific environmental/experimental
conditions and/or differences in ingredients/diets manufacturing process. An important
observation of the current study is that the ADMD of feed consumed by shrimp tended to
decrease as fiber and ash content of the test ingredient increased. Accordingly, the ADMD
coefficient in meal B (high fiber) was significantly lower than ADMD values for meals A, C and
H.
In contrast with dry matter digestibility values, those for apparent crude protein
digestibility were relatively higher (93.64–99.79%) for the test ingredients. The ADP values
from soybean meal by L. vannamei are similar to those reported for the same species by
Akiyama et al. (1989; 89.9%–96.4%), Ezquerra et al. (1997; 91.0%), Ezquerra et al. (1998;
85.9%), Divakaran et al. (2000; 91%–102.2%), Siccardi et al. (2006; 96.9%), Cruz-Suárez et al.

18
(2009; 93–96%), Liu et al. (2013; 92.3%), and Zhu et al. (2013; 78.8–89.8%). Observed
differences in ADP among experimental meals could be attributed to several factors including
processing, presence of trypsin inhibitors as well as differences in nitrogen solubility indices
(NSI), and protein dispersibility indices (PDI). Trypsin inhibitors, which constitute
approximately 6% of the total protein of soybeans (Kakade et al., 1973), have generally been
known to cause growth depression and pancreatic hypertrophy in numerous experimental
animals (Lim and Akiyama 1991). Negative effects on protein digestibility have been attributed
to trypsin inhibitors due to their ability to bind to digestive enzymes (Francis et al., 2001).
However, out of all shrimp species cultivated in the world only very few like the Indian white
shrimp, Penaeus indicus, have been reported to exhibit digestive sensitivity to soy-derived
protease inhibitors (Osmondi, 2005).
To elucidate such interactions in the present study, correlation analysis followed by
regression analysis was utilized. We observed that ADP values had a direct relationship with the
presence of trypsin inhibitor inhibitors (P < 0.05) as well as with measured NSI (P < 0.1) and
PDI (P < 0.3) values (Table 6). PDI measures the dispersibility of proteins in water and is
generally used as a quality parameter of protein denaturation upon thermal processing of soybean
(Qin et al. 1996). PDI is often used to characterize the protein quality of raw materials. PDI has
been demonstrated to be a simple and effective procedure in assessing the quality of heat-treated
soybeans (Hsu and Satter, 1995). Batal et al. (2000) suggested that PDI is a more consistent and
sensitive indicator of minimum adequate heat processing of soybean meal than urease index or
protein in KOH. For example, a SBM containing low urease (0.3 or below) and high PDI (40 to
45 %) may indicate that the sample is high quality because it has been adequately heat processed,
but not over-processed (Căpriţă et al., 2010). The PDI values for meals B, E, and F subjected to

19
cooking temperature of 320 ˚C were much lower than those for meals C and D with processing
temperature of 180 ˚C. In this study, the trend of PDI values, which decreased with increased
temperature, is similar to those reported for soybean meal by Qin et al. (1996). The processing
temperature (e.g., cooking and drying) is of particular importance, and the occurrence of protease
inhibitors can be attributed to insufficient heat during processing (Swick, 2000; Genovese et al.,
2006). Heat treatment of soybean meal can reduce levels of some anti-nutrients (e.g., protease
inhibitors, chitosan inhibitors, lectins, goitrogens, anti-vitamins, glycinin and β-conglycin).
However, significant levels of heat-resistant anti-nutritional factors may remain in conventional
soybean meal (e.g., saponins, lipase inhibitors, tannins, phyto-estrogens, oligosaccharides,
antigens and phytate) (Francis et al., 2001).
In contrast to simple processing, marker-assisted soy breeding programs can selectively
discriminate among varieties that have high levels of either heat-labile or heat resistant anti-
nutrients such that the resulting meals – produced in the conventional manner – have less of
these noxious compounds. Trypsin inhibitor values for meals B, E, and F subjected to cooking
temperature of 320 ˚C were much lower than those for meals C and D with processing
temperature of 180 ˚C, corroborating the heat-labile nature of these inhibitors. With regard to the
response to trypsin inhibitor, there was a poor correlation with ADP and ADE values (Fig.1). As
this experiment was not designed to look specifically at trypsin inhibitor, it is not surprising that
other factors may affect the results. For example, the sources and processing of the soy are not
controlled. Furthermore, the level of trypsin inhibitor reported is that of the ingredient and not
the final diet. Hence, one has to realize that multiple factors are at play. The high digestibility of
diet 3 could be due to other factors. For example, as this source was processed at lower

20
temperatures, it also has the highest PDI value. Given that PDI values are often correlated with
digestibility, this may be the overriding factor.
Based on the results from Table 5, differences in energy digestibility among ingredients
were similar to differences in ADMD value. Both ADMD and ADE coefficients were
significantly (P < 0.05) lower for meal B than for meals A, C and H. The lowest ADE value was
found to be for meal B which, excluding meal E, subsequently had the highest fiber contents
(Table 3, 56 g kg–1) compared to other ingredients. This observation is in agreement with the
report by Brunson et al. (1997), in which energy digestibility of plant products used for aquatic
animals was also found to be inversely related to the fiber content of the materials and in some
species to starch content. Fiber could potentially contribute to the gross energy of some animals,
but monogastric organisms such as shrimp are unable to digest it. Because the energy in fiber is
typically unavailable for cultured marine organisms, ADE values of a diet tend to decrease as
fiber content increases (Lech and Reigh, 2012).
To summarize the present experiments, there were no significant differences in survival
or percent weight gain among treatments; albeit, there were minor differences in final weight in
the growth trial. In the digestibility trial, meal C displayed the highest ADMD and ADP values
compared to the other experimental meals, and also exhibited a significantly higher ADP value
than conventional soybean meal A. Thus, meal C may hold a high potential as a shrimp feed
ingredient. In general, the selection of new lines of soybean on biochemical properties is
promising and could lead to improvements in the nutritional value of soybean meals for shrimp
and other species.

21
References
Akiyama, D.M., 1989. Soybean meal utilization by marine shrimp. In: Proceeding of the world
congress on vegetable protein utilization in human foods and animal feedstuffs.
(Applewhite T.H. ed.). J. Am. Oil Chem. Soc. Champaign, IL, USA, pp. 252–265.
Akiyama, D.M., Coelho, S.R., Lawrence, A.L., Robison, E.H., 1989. Apparent digestibility of
feedstuffs by the marine shrimp Penaeus vannamei Boone. Nippon Suisan Gakkaishi 55,
91–98.
Álvarez, J.S., Hernández-Llamas, A., Galindo, J., Fraga, L., García, T., Villarreal, H., 2007.
Substitution of fishmeal with soybean meal in practical diets for juvenile white shrimp
Litopenaeus schmitti (Pérez-Farfante & Kensley 1997). Aquac. Res. 38, 689–695.
Amaya, E., Davis, D.A., Rouse, D.B., 2007. Alternative diets for the Pacific white shrimp
Litopenaeus vannamei. Aquaculture 264, 353–362.
Baker, D.H., 2000. Nutritional constraints to use of soy products by animals. In: Soy in animal
nutrition (Drackley, J.K. ed.), Federation of Animal Societies, Savoy, IL, USA, pp. 1–12.
Batal, A.B., Douglas, M.W., Engram, A.E., Parsons, C.M., 2000. Protein dispersibility index as
an indicator of adequately processed soybean meal. Poult. Sci. 79, 1592–1596.
Brunson, J.F., Romaire, R.P., Reigh, R.C., 1997. Apparent digestibility of selected ingredients in
diets for white shrimp Penaeus setiferus L. Aquac. Nutr. 3, 9–16.
Căpriţă, R., Căpriţă, A., Creţescu, I., 2010. Protein solubility as quality index for processed
soybean. J. Anim. Sci. Biotechnol. 43, 375–378.
Cho, C.Y., Slinger, S.J., Bayley, H.S., 1982. Bioenergetics of salmonid fishes: energy intake,
expenditure and productivity. Comp. Biochem. Physiol. 73B, 25–41.

22
Cruz-Suárez, L.E., Tapia-Salazar, M., Villarreal-Cavazos, D., Beltran-Rocha, J., Nieto-López,
M.G., Lemme, A., Ricque-Marie, D., 2009. Apparent dry matter, energy, protein and
amino acid digestibility of four soybean ingredients in white shrimp Litopenaeus
vannamei juveniles. Aquaculture 292, 87–94.
Davis, D.A., Arnold, C.R., 2000. Replacement of fish meal in practical diets for the Pacific white
shrimp Litopenaeus vannamei. Aquaculture 185, 291–298.
Davis, D.A., Lawrence, A.L., Gatlin, D.M., 1993. Evaluation of the dietary zinc requirement of
Penaeus vannamei and effects of phytic acid on zinc and phosphorus bio-availability. J.
World Aquac. Soc. 24, 40–47.
Divakaran, S., Velasco, M., Beyer, E., Forster, I., Tacon, A.G.J., 2000. Soybean meal apparent
digestibility for Litopenaeus vannamei, including a critique of methodology. In: Cruz-
Suarez, L.E., Ricque-Marie, D., Tapia-Salazar, M., Olvera-Novoa, M.A., Civera-
Cerecedo, R. (Eds), Avances en Nutrición Acuícola (Memorias del V Simposium
Internacional de Nutrición Acuícola, Merida, Yucatan, Mexico, pp. 267–276.
Ezquerra, J.M., Garcia-Carreno, F.L., Carrillio, O., 1998. In vitro digestibility of dietary protein
sources for white shrimp (Penaeus vannamei). Aquaculture 163, 123–136.
Ezquerra, J.M., Garcia-Carreno, F.L., Civera, R., Haard, N.F., 1997. pH-stat method to predict
protein digestibility in vitro in white shrimp Penaeus vannamei. Aquaculture 157, 249–
260.
Forster, I., 1999. A note on the method of calculating digestibility coefficients of nutrients
provided by single ingredients to feeds of aquatic animals. Aquac. Nutr. 5, 143–145.
Francis, G., Makkar, H.P.S., Becker, K., 2001. Antinutritional factors present in plant-derived
alternative fish feed ingredients and their effects in fish. Aquaculture 199, 197–227.

23
Genovese, M.I., Davila, J., Lajolo, F.M., 2006. Isoflavones in processed soybean products from
Ecuador. Braz. Arch. Biol. Technol. 49, 853–859.
Glencross, B.D., Booth, M., Allan, G.L., 2007. A feed is only as good as its ingredients – a
review of ingredient evaluation strategies for aquaculture feeds. Aquac. Nutr. 13, 17–34.
Hardy, R.W., Barrows, F.T., 2002. Diet formulation and manufacture. In: Halver, J.E., Hardy,
R.W. (Eds.), Fish Nutrition, Academic Press, San Diego, CA. pp. 505–600.
Hardy, R.W., 1999. Aquaculture's rapid growth requirements for alternate protein sources. Feed
Manage. 50, 25–28.
Hsu, J.T., Satter, L.D., 1995. Procedure for measuring the quality of heat-treated soybeans, J.
Dairy Sci. 78, 1353–1361.
Hu, Y., Tan, B., Mai, K., Ai, Q., Zheng, S. Cheng, K., 2008. Growth and body composition of
juvenile white shrimp, Litopenaeus vannamei, fed different ratios of dietary protein to
energy. Aquac. Nutr. 14, 499–506.
Kakade, M.L., Hoffa, D.E., Liener, I.E., 1973. Contribution of trypsin inhibitors to the
deleterious effects of unheated soybeans fed to rats. J. Nutr. 103, 1772–1778.
Kakade, M.L., Simons, N., Liener, I.E., 1969. An evaluation of natural versus synthetic
substrates for measuring the antitryptic activity of soybean samples. Cereal Chem. 46,
518–526.
Lawrence, A.L., Castille, F.L., Sturmer, L.N., Akiyama, D.M., 1986. Nutritional response of
marine shrimps to different levels of soybean meal in feeds. USA-ROC and ROC-USA
Economic Councils’ Tenth Anniversary Joint Business Conference, Taipei, Taiwan. pp.
21.

24
Lech, G.P., Reigh, R.C., 2012. Plant products affect growth and digestive efficiency of cultured
Florida Pompano (Trachinotus carolinus) fed compounded diets. PloS one, 7, e34981.
Liener, I.E., 2000. Non-nutritive factors and bioactive compounds in soy. In: Soy in animal
nutrition (Drackley, J.K. ed.), Federation of Animal Societies, Savoy, IL, USA. pp. 1–12.
Lim, C., Akiyama, D.M., 1991. Full-fat soybean meal utilization by fish. In: Akiyama, D.M.,
Tan, R.K.H. (Eds), Proceedings of the Aquaculture Feed Processing and Nutrition
Workshop, Thailand and Indonesia American Soybean Association, Singapore. pp.188–
198
Lim, C., Dominy, W., 1990. Evaluation of soybean meal as a replacement for marine animal
protein in diets for shrimp (Penaeus vannamei). Aquaculture 87, 53–56.
Liu, X.H., Ye, J.D., Kong, J.H., Wang, K., Wang, A.L., 2013. Apparent Digestibility of 12
Protein-Origin Ingredients for Pacific White Shrimp Litopenaeus vannamei. N. Am. J.
Aquac. 75, 90–98.
Ma, T.S., Zuazago, G., 1942. Micro-Kjeldahl determination of nitrogen. A new indicator and an
improved rapid method. Ind. Eng. Chem. 14, 280–282.
Maynard, L.A., Loosli, J.K., 1969. Animal Nutrition, 6th edn, McGraw-Hill, New York, NY. pp.
613.
McGinns, A.J., Kasting, R., 1964. Colorimetric analysis of chromic oxide used to study food
utilization by phytophagous insects. Food Chem. 12, 259–262.
Mendoza-Alfaro, R., De Dios, A., Vázquez, C., Cruz-Suárez, E., Ricque-Marie, D., Aguilera, C.,
Montemayor, J., 2001. Fishmeal replacement with feather-enzymatic hydrolyzates co-
extruded with soya-bean meal in practical diets for the Pacific white shrimp (Litopenaeus
vannamei). Aquac. Nutr. 7, 143–151.

25
Nieto-López, M., Tapia-Salazar, M., Ricque-Marie, D., Villarreal-Cavazos, D., Lemme, A.,
Cruz-Suárez, L.E., 2011. Digestibility of different wheat products in white shrimp
Litopenaeus vannamei juveniles. Aquaculture 319, 369-376.
Osmondi, J.G., 2005. Digestive endo-proteases from the midgut glands of the Indian white
shrimp, Penaeus indicus (Decapoda: Penaeidae) from Kenya. Western Indian Ocean. J.
Mar. Sci. 4, 109–121
Qin, G., Ter Elst, E.R., Bosch, M.W., Van der Poel, A.F.B., 1996. Thermal processing of whole
soya beans: Studies on the inactivation of antinutritional factors and effects on ileal
digestibility in piglets. Anim. Feed Sci. Technol. 57, 313–324.
Siccardi III, A.J., Lawrence, A.L., Gatlin III, D.M., Fox, J.M., Castille, F.L., Perez-Velazquez,
M., González-Félix, M.L., 2006. Digestibilidad aparente de energía, proteína y materia
seca de ingredientes utilizados en alimentos balanceados para el camarón blanco del
pacífico Litopenaeus vannamei. In: Cruz-Suárez, L.E., Ricque-Marie, D., Nieto-López,
M.G., Tapia-Salazar, M., Villarreal-Cavazos, D.A., Puello-Cruz, A.C., García-Ortega, A.
(Eds), Avances enNutricion Acuícola VIII - Memorias del VIII Simposio Internacional
de Nutrición Acuícola, Mazatlán, Sinaloa, México, pp. 213–237.
Smith, L.L., Lee, P.G., Lawrence, A.L., Strawn, K., 1985. Growth and digestibility by three sizes
of Penaeus vannamei Boone: effects of dietary protein level and protein source,
Aquaculture 46, 85–96.
Smith, D.M., Tabrett, S.J., Glencross, B.D., Irvin, S.J., Barclay, M.C., 2007. Digestibility of
lupin kernel meals in feeds for the black tiger shrimp, Penaeus monodon. Aquaculture
264, 353–362.

26
Sookying, D., Davis, D.A., 2011. Pond production of Pacific white shrimp (Litopenaeus
vannamei) fed high levels of soybean meal in various combinations. Aquaculture 319,
141–149.
Sookying, D., Davis, D.A., 2012. Use of soy protein concentrate in practical diets for Pacific
white shrimp (Litopenaeus vannamei) reared under field conditions. Aquac. Int. 20, 357–
371.
Swick, R., 2000. Soybean meal quality, assessing the characteristics of the major aquatic feed
ingredient. Advocate, 5, 46–49.
Terrazas-Fierro, M., Civera-Cerecedo, R., Ibarra-Martínez, L., Goytortúa-Bores, E., Herrera-
Andrade, M., Reyes-Becerra, A., 2010. Apparent digestibility of dry matter, protein, and
essential amino acid in marine feedstuffs for juvenile whiteleg shrimp Litopenaeus
vannamei. Aquaculture 308, 166-173.
Yang, Q.H., Zhou, X.Q., Zhou, Q.C., Tan, B.P., Chi, S.Y., Dong, X.H., 2009. Apparent
digestibility of selected feed ingredients for white shrimp Litopenaeus vannamei, Boone.
Aquac. Res. 41, 78–86.
Zaldivar, F.J., 2002. Las harinas y aceites de pescado en la alimentación acuícola. In: Avances en
Nutrición Acuícola VI. Memorias del VI Simposio Internacional de Nutrición Acuicóla,
3-6 septiembre 2002 (Cruz-Suárez, L.E., Ricque-Marie, D., Tapia-Salazar, M., Gaxiola-
Cortés, G. & Simoes, N. eds), pp. 516–526. Cancún, Quintana Roo, Mexico.
Zhu, X., Davis, D.A., Roy, L.A., Samocha, T.M., Lazo, J.P., 2013. Response of Pacific white
shrimp, Litopenaeus vannamei, to three sources of solvent extracted soybean Meal. J.
World Aquac. Soc. 44, 396–404.
27
Table 1 Ingredient compositions (g kg–1 of feed) of experimental diets used in a 6-week growth trial. All diets were developed to contain 360 g kg–1 protein and 80 g kg–1 lipid. Diets were designed to use various soybean meals produced from different varieties of soybeans on an equal protein inclusion level.
Diet 1 Diet 2 Diet 3 Diet 4 Diet 5 Diet 6 Diet 7 Diet 8
Source A1 B2 C2 D2 E2 F2 G2 H3
Soybean meal 527 550 592 572 520 490 468 448
Menhaden fish meal 4 60 60 60 60 60 60 60 60
Menhaden Fish Oil 4 2.7 2.7 2.7 2.7 2.7 2.7 2.7 2.7
Corn Gluten meal 5 80 80 80 80 80 80 80 80
Soy oil 7 59 22.9 - 4.9 27.9 36.3 26.4 61.2
Corn Starch 6 79.8 92.9 73.8 88.9 117.9 139.5 171.4 156.6
Whole wheat 8 130 130 130 130 130 130 130 130
Mineral premix 9 5 5 5 5 5 5 5 5
Vitamin premix 10 20 20 20 20 20 20 20 20
Stay C 250 mg kg–1 11 1 1 1 1 1 1 1 1
CaP-diebasic 8 25 25 25 25 25 25 25 25
Lecithin, soy 12 10 10 10 10 10 10 10 10
Cholesterol8 0.5 0.5 0.5 0.5 0.5 0.5 0.5 0.5 1 Faithway Feed Co., Guntersville, AL, USA. 2 Navita Premium Feed Ingredients, Inc., West Des Moines, Iowa, USA 3 Navita 3010 (high protein low oligosaccharides meal). Rose Acre Farms, Seymour, IN, USA 4 Omega Protein Inc., Reedville, VA, USA. 5 Grain Processing Corporation, Muscatine, IA, USA. 6 Empyreal 75. Cargill corn milling North America, Blair Nb, USA 7 ADM Co., ProPlexTM-DY, Decatur, IL, USA. 8 MP Biochemicals Inc., Solon, OH, USA. 9 Trace mineral premix without Mg (g kg–1): cobalt chloride 0.04, cupric sulphate pentahydrate 2.50, ferrous sulfate 40, manganous sulphate monohydrate 6.50, potassium iodide 0.67, sodium selenite 0.10, zinc sulfate heptahydrate 131.93, filler 818.26. 10 Vitamin premix (g kg–1): thiamin HCl 0.5, riboflavin 3.0, pyridoxine HCl 1.0, DL Ca-pantothenate 5.0, nicotinic acid 5.0. 11 Stay C®, (L-ascorbyl-2-polyphosphate), Roche Vitamins Inc., Parsippany, NJ, USA. 12 Enhance D-97, Solae Company, St. Louis, MO, USA

28
Table 2 Formulation of the reference diet for determination of digestibility coefficients in Litopenaeus vannamei
1 Omega Protein Inc., Reedville, VA, USA. 2 Faithway Feed Co., Guntersville, AL, USA. 3 MP Biochemicals Inc., Solon, OH, USA. 4 Trace mineral premix without Mg (g kg–1): cobalt chloride 0.04, cupric sulphate pentahydrate 2.50, ferrous sulfate 40, manganous sulphate monohydrate 6.50, potassium iodide 0.67, sodium selenite 0.10, zinc sulfate heptahydrate 131.93, filler 818.26. 5 Vitamin premix (g kg–1): thiamin HCl 0.5, riboflavin 3.0, pyridoxine HCl 1.0, DL Ca-pantothenate 5.0, nicotinic acid 5.0. 6 Fisher Scientific, Fair lawn, NJ, USA 7 Stay C®, (L-ascorbyl-2-polyphosphate 350 g kg–1), Roche Vitamins Inc., Parsippany, NJ, USA. 8 Enhance D-97, The Solae Company, St. Louis, MO, USA
Ingredients Amount (g kg–1 diet dry weight)
Menhaden fish meal1 100.0
Soybean meal2 310.0
Menhaden fish oil1 41.2
Whole wheat3 496.6
Trace mineral premix4 5.0
Vitamin premix w/o choline5 18.0
Choline cloride6 2.0
Stay C 250 mg kg–1 7 0.7
Chromic oxide6 10.0
Lecithin8 15.0
Cholesterol3 1.5

29
Table 3 Proximate composition, amino acid and carbohydrate profiles of the experimental ingredients1
Composition (g kg–1) A B C D E F G H Cooking Temp (°C) - 320 180 180 320 320 285 - Moisture 111 55 102 105 64 64 48 - Crude Protein 544 483 471 489 515 547 562 561 Crude Fat 16 70 97 92 65 53 76 - Crude Fiber 41 56 51 54 56 42 33 26 Acid Detergent Fiber 45 59 56 61 60 50 38 - Netural Detergent Fiber 73 89 98 92 92 75 57 - Phosphorus 8 5 5 6 6 6 6 7.3 Calcium 3 3 3 2 4 3 2 - Trypsin inhibitor (TIU)3 - 5700 52100 19500 5700 5000 25400 - NSI 2 168 194 689 590 131 121 326 - PDI 3 183 75 619 585 71 72 287 - Amino acids Alanine 23.7 21.7 20.5 21.1 22.0 22.6 24.1 22.9 Arginine 39.6 36.0 34.3 36.6 38.0 41.1 41.7 41.9 Aspartic acid 59.9 56.0 53.0 54.8 56.8 60.8 64.3 63.4 Cysteine 7.0 7.2 7.0 6.7 6.8 7.3 8.0 8.1 Glutamic acid 96.2 86.9 82.4 86.0 87.7 94.1 99.3 103.5 Glycine 23.1 20.8 13.3 20.4 21.3 22.2 23.3 - Histidine 15.1 12.3 11.7 12.6 13.0 13.5 14.2 14.5 Hydroxylysine 1.4 0.2 0.2 0.2 0.2 0.2 0.2 - Isoleucine 25.7 23.6 22.5 22.3 23.6 25.0 25.9 25.1 Leucine 42.2 37.5 35.5 37.2 38.5 40.5 42.9 42.7 Lysine 34.9 31.2 30.2 30.8 31.3 32.6 35.3 34.5 Methionine 7.4 7.1 6.8 6.7 7.1 7.3 7.8 7.6 Ornithine 0.6 0.3 0.2 0.2 0.3 0.3 0.3 - Phenylalanine 28.7 24.7 23.4 24.1 25.1 26.4 27.9 28.3 Proline 26.0 24.0 22.7 24.1 24.7 26.4 28.1 27.6 Serine 23.0 20.3 19.5 21.6 21.4 22.2 25.2 24.1 Threonine 21.4 17.9 17.1 18.2 18.6 18.9 20.9 20.9 Tryptophan 7.9 6.6 6.0 7.8 6.5 7.0 7.3 7.0 Tyrosine 20.5 16.8 16.5 17.2 17.6 17.9 19.6 20.4 Valine 27.1 24.8 23.4 23.6 24.9 26.4 27.0 26.3 Carbohydrates Maltose 3.5 2.8 1.6 1.9 1.2 2.7 2.5 - Raffinose 10.5 9.3 9.8 6.7 1.6 2.3 8.2 - Stachyose 60.7 49.9 48.7 44.0 6.8 14.2 59.8 - Sucrose 86.5 79.9 79.1 74.1 85.5 76.6 61.9 -

30
1 Ingredients were analyzed by Eurofins Scientific, Inc. Nutrition Analysis Center, Des Moines, IA 50321. Ingredient A is traditional soybean meal, Ingredient B-H are new varieties soybean meal. 2 NSI nitrogen solubility index. 3 PDI protein dispersibility index.

31
Table 4 Response of juvenile L. vannamei (0.52 g initial weight) offered a plant based diet using various types of soybean meal over a 6-week culture period1 Diet Final
Biomass (g)
Final mean
weight (g)
Weight
gain (%)
FCR Survival (%)
1 37.8ab 4.3a 698.1 2.2b 87.5
2 30.7c 4.0a 668.4 2.4b 77.5
3 33.0abc 3.4b 603.1 2.8a 97.5
4 38.7a 4.4a 771.9 2.1b 87.5
5 29.2c 4.1a 686.9 2.4b 72.5
6 31.6bc 3.9ab 599.0 2.5ab 82.5
7 29.9c 4.1a 689.3 2.3b 72.5
8 32.3abc 4.2a 738.1 2.3b 77.5
PSE2 2.05 0.20 48.27 0.14 5.95
P-value 0.0216 0.041 0.207 0.037 0.082
1Mean of quadruplicate. Base on Duncan test, Number within the same column with different superscript are significant different (P <0.05). 2 Pooled Standard Error.

32
Table 5 Apparent dry matter digestibility (ADMD), apparent protein digestibility (ADP), and apparent energy digestibility (ADE) in a trial with shrimp offered a reference diet (RD) or test dies of the RD (70%) and one of eight sources of soybean meal (30%)1. Test diet Ingredient
ADMD-D ADP-D ADE-D ADMD-I ADP-I ADE-I
Reference diet 72.2±0.6c 89.0±1.0c 77.9±0.6b
RD-A 76.1±1.5ab 90.9±1.6b 82.0±1.0a 85.2±4.9ab 93.8±3.9b 90.4±3.0a
RD-B 72.0±1.6c 92.3±1.9ab 77.6±1.3b 71.3±5.3c 96.9±4.6ab 76.6±4.6b
RD-C 77.1±0.7a 93.0±0.5a 82.1±0.4a 88.3±2.2a 99.8±1.3a 90.6±1.1a
RD-D 73.2±2.3bc 91.0±0.9b 79.6±2.0ab 75.4±7.6bc 94.2±2.3b 83.2±6.4ab
RD-E 73.6±4.1bc 90.9±1.6b 79.1±3.4b 76.8±13.6abc 93.6±3.9b 82.2±12.3ab
RD-F 74.8±2.3abc 91.9±0.9ab 80.2±2.0ab 80.9±7.6abc 95.7±2.1ab 85.4±6.5ab
RD-G 73.2±1.9bc 91.8±0.6ab 78.9±1.6b 75.3±6.4bc 95.6±1.3ab 81.4±5.4ab
RD-H 76.2±2.0ab 92.7±0.8ab 82.1±1.7a 85.5±6.6ab 97.7±1.9ab 91.3±5.4a
PSE2 0.35 0.20 0.29 1.31 0.52 1.12
P-value 0.013 0.002 0.003 0.035 0.075 0.030
1 Mean of quadruplicate. Base on Duncan test, Number within the same column with different superscript are significant different (P <0.05). 2 Pooled Standard Error.

33
Table 6 P-values from correlation analysis of apparent digestibility of dry matter (ADMD), energy (ADE), and crude protein (ADP) with the chemical characteristics of the ingredient.
P- Value
ADMD ADE ADP
Cooking Temp 0.155 0.096 0.297
Moisture 0.025 0.009 0.974
Protein (DB1) 0.988 0.815 0.106
Oil (DB) 0.562 0.480 0.092
Crude Fiber (DB) 0.518 0.435 0.729
Acid Detergent Fiber (DB) 0.518 0.469 0.778
Neutral Detergent Fiber (DB) 0.716 0.853 0.342
Trypsin inhibitor (TIU2)3 0.031 0.046 0.027
NSI 0.324 0.301 0.091
PDI 0.238 0.178 0.202
Phosphorus (DB) 0.298 0.136 0.043
Calcium (DB) 0.806 0.973 0.734
Sucrose 0.256 0.306 0.616
Maltose 0.911 0.817 0.614
Stachyose 0.765 0.675 0.444
Raffinose 0.452 0.469 0.204
1 DB = Dry matter basis. 2 TIU = trypsin inhibitor units as defined by Kakade et al. (1969).

34
Figure 1 Relationship between ADCs of crude protein and energy versus trypsin inhibitor for differences soybean meal.
Diet 3
Diet 3
y = 9E-05x + 94.332 R² = 0.5142
P value = 0.027
y = 2E-04x + 79.846 R² = 0.5069
P value = 0.046
70
75
80
85
90
95
100
105
0 10000 20000 30000 40000 50000 60000
Dig
estib
ility
(%)
Trypsin inhibitor
ADP-‐I ADE-‐I

35
CHAPTER III
UTILIZATION OF SORGHUM CO-PRODUCT (S-DDGS) IN AQUATIC ANIMAL
FEED PRODUCTION FOR PACIFIC WHITE SHRIMP Litopenaeus vannamei
Abstract
Increasing cost of fish meal and declining price of shrimp has necessitated the search for
alternative sources of protein, which is the most expensive aquatic feed ingredient. This study
examined the use of distiller dried grain with solubles (DDGS) from sorghum (S-DDGS) in the
production of sinking shrimp feed. Five shrimp feeds were formulated with increasing
percentages of S-DDGS (0 g kg-1, 100 g kg-1, 200 g kg-1, 300 g kg-1 and 400 g kg-1) and then
extruded and pelleted. Various physical properties of feeds were significantly influenced by S-
DDGS inclusion. Specific mechanical energy (SME) generally increased with increasing levels
of S-DDGS in the formulation. Bulk density of extruded and pelleted feed varied from 0.53 –
0.58 g cm-3 and 0.61 – 0.65 g cm-3, respectively. With the exception of the extruded feed with the
highest level of S-DDGS (88% sink) all feeds were characterized as close to 100% sinking.
Pellet durability index (PDI) of extruded and pelleted feed did not show any particular pattern in
the unmodified test, whereas both demonstrated an increasing trend, up to 20 g kg-1 and 30 g kg-1
DDGS for the extruded and pelleted feed, respectively in the modified test. The proximate
content of the feeds shifted as S-DDGS levels increased, particularly with respect to crude fiber
and starch. Degree of gelatinization generally increased with S-DDGS, and extruded feeds were
better gelatinized than pelleted feeds. Water stability for extruded and pelleted feed ranged from
76.2–91.57% and 80.46–85.04%, respectively, and was significantly influenced by duration in
water and level of S-DDGS. The five extruded and pelleted feeds were then evaluated in two

36
growth trials. In the first trial, these treatments were assigned amongst 40 tanks (60 L) with four
replications per treatment for 9 weeks. In the second trial, the same treatments were assigned
amongst 60 tanks (60 L) with six replications per treatment for 6 weeks. In both trials, juvenile
shrimp (initial weight 0.36–0.38g) were stocked at a density of 10 shrimps per tank. In both
growth trials there were no significant differences in final mean weight and survival of the
shrimp due to the level of S-DDGS within extruded or pelleted feeds. Based on pooled data,
extruded feeds produced significantly larger shrimp and lower feed conversion ratio in trial 1;
however, pelleted feeds produced significantly larger shrimp and lower feed conversion ratio in
trial 2. Under the reported conditions there were limited differences in performance of the shrimp
due to processing or level of S-DDGS inclusion of the shrimp feed.

37
1. Introduction
The number of countries engaged in aquaculture production of shrimp has increased from
33 in 1984 to 62 in 2001 (Menon and Paul, 2001). Shrimp culture is the major aquaculture
industry in many countries, accounting for approximately 3.49 million metric tonnes of the
global production with a worldwide value over 14 billion dollars in 2009 (FAO, 2011). Shrimp is
the most consumed seafood in the United States. The projection is that demand will continue to
increase in the US and abroad (Johnson, 2003). Presently, increasing demand has driven up the
cost of protein sources such as fish meal (FM), leading to increased production cost of raising
shrimp, while shrimp prices generally continue to decline due to depressed market or
overproduction (Amaya et al., 2007). Increasing feed costs is often attributed to the cost and
inclusion level of fish meal (El-Sayed, 1999; Garza deYta et al., 2012; Hardy, 2006;). There is a
concerted ongoing effort to replace expensive protein sources such as fish meal with other less
expensive protein sources in shrimp feed production (Amaya et al., 2007; Forster and Dominy,
2006; Garza et al., 2012). Some studies have explored the use of plant ingredients for replacing
expensive animal sources of ingredients (Davis and Arnold, 2000; Gatlin et al., 2007). Soy
protein in the form of defatted soybean meal or soy protein concentrate has been used to replace
fish meal with comparable results (Paripatananont, et al., 2001; Sookying and Davis, 2012).
Clemente and Cahoo (2009) reported that the price of soybean has increased 65% in one decade
from $158.3 per metric tonnes in June 1999 to $445.2 per metric tonnes in June 2009. This has
drawn attention to other sources of plant protein such as sorghum DDGS, a co-product of ethanol
production from sorghum.
Grain sorghum is commonly used as an ingredient in diets for livestock, such as poultry,
cattle and swine, and has been studied widely for these applications (Cohen and Tanksley, 1973;

38
Huck et al., 1998; Kyarisiima et al., 2004; Madacsi et al., 1988). Distillers dried grains with
solubles (DDGS) is a co-product of the ethanol industry that contains moderate quantities of
protein that could serve as replacement for fish meal in aquatic feed. There has been an increase
in the number and capacity of ethanol plants where sorghum DDGS is a major co-product.
Sorghum DDGS compared to DDGS from other grains has a relatively higher level of protein
(30.3%), fat (12.5%) and fiber (10.7%). The use of plant protein as replacement for animal
protein (primarily fish meal) in aquatic feed is often limited by lower digestibility values,
insufficient essential amino acids and possible palatability issues. However, they remain the most
economically viable alternative for use in aquatic feed (Davis and Arnold, 2000).
Garza deYta et al. (2012) reported that DDGS had a similar effect on survival and growth
of redclaw crayfish (Cherax quadricarinatus) as poultry by-product meal or fish meal.
Thompson et al. (2006) completely replaced fish meal with a combination of DDGS and soybean
meal in redclaw crayfish feed and found no significant difference in feed conversion rate,
survival or total yield. Gatlin et al. (2007) documented the use of various plant protein sources,
namely soybean, canola, barley, corn, cottonseed, peas/lupins and wheat, in production of
aquafeed and expressed the pros and cons of different ingredients. Conventional DDGS contains
28-32% protein and a relatively high in fiber content, which limits its use in aquafeeds (Gatlin et
al. 2007)
With regards to commercial feed formulations, feed ingredients are selected and
combined based on their nutritional content, cost and how they affect the physical characteristics
of pellet. Feed manufacturing is the physical process of forming feed ingredient mixture into
particles used to feed shrimp. Commercial feeds are manufactured as pellets using cooked
extrusion, compression pelleting, or cold extrusion processes (NRC, 2011). Pelleting is the most

39
popular method of producing crustacean feeds due to its technological and economic advantages
(Lovell, 1990, 1989). The advantages of pelleted feed include less bridging in bins, dust and feed
waste, increased bulk density, nutrient density and nutrient availability, reduced ingredient
segregation, decreased microbiological activity and improved palatability. While many
processing technologies result in an agglomerated feed, only a few have sufficient energy inputs
to ensure microbiological safety of feed. Feed safety is a major factor in choosing extrusion
methods over traditional pelleting methods (Riaz, 2009). Extruded pellets have advantages over
steam pellets for they generally have superior water stability, and in the case of floating fish
feeds this property allows direct determination of feed consumption (Stickney, 1979). Robinette
(1977) reported that the extrusion processing has much greater levels of heat, moisture and
pressure than steam pelleting. Due to higher temperature, moisture and pressure in extrusion
processing, it may increase the bioavailability of carbohydrate and destroy heat labile
antinutrients. Compared to steam pelleting, extrusion processing can also damage nutrients such
as ascorbic acid (Hilton et al., 1977; Lovell and Lim, 1978). Hilton et al. (1981) indicated that
extruded pellets increased gastric emptying time of trout which was probably responsible for the
reduced total feed consumption and weight gain but may have improved feed efficiency. In the
rainbow trout, extrusion processing appeared to increase carbohydrate digestion and absorption,
increased liver: body weight and percent liver glycogen content as compared with steam
pelleting (Hilton et al. 1981). Although both methods to produce pellets have advantages, there
are few studies to determine if there are actual biological advantages associated with either
process. According to available research, there is a lack of studies evaluating biological response
to typical practical diet produced under various processing technologies.

40
Utilization of S-DDGS in shrimp feed will be an important value-added application.
However, use of this co-product in aquatic feed needs to be thoroughly investigated from
processing, nutritional and functional perspective, especially with respect to shrimp production.
This study was designed to evaluate the effect of processing method (extrusion and pelleting) on
physical and nutritional characteristics of shrimp feed made from different levels of S-DDGS.
2. Materials and Methods
S-DDGS was obtained from Prairie Horizons Agri-Energy (Phillipsburg, Kansas, USA).
Other ingredients used for formulating the shrimp feed diets included menhaden fish meal
(Omega Proteins, Houston, Texas, USA), solvent extracted soybean meal (Kansas State
University Feedmill, Manhattan, Kansas, USA), wheat gluten, wheat starch, menhaden oil, and
Stay C (Lortscher Agri Service, Bern, Kansas, USA), Lecithin (Solae, St. Louis, Missouri USA);
and minerals and vitamins premix (Rangen, Buhl, Idaho USA).
2.1. Feed production using extrusion and pelleting methods
The basal diet (Table 1) was formulated as a typical practical diet for shrimp containing
35% protein and 8% lipid. This diet was modified to contain 100, 200, 300 or 400 g kg-1 of
sorghum distillers dried grain with solubles (S-DDGS) while keeping formulations
isonitrogenous relative to the basal diet. The S-DDGS replaced solvent extracted soybean meal,
whole wheat and menhaden fish oil while maintaining equivalent levels of protein and lipid.
Additionally, DL methionine was supplemented to maintain minimal levels of methionine (Table
1).

41
A pilot-scale single screw extruder (X-20, Wenger Manufacturing, Sabetha, Kansas,
USA) was used for producing extruded diets. The ingredients were mixed in a ribbon blender
and fed into the pre-conditioner using a volumetric feed system, the equivalent of which for this
production was 184 kg hr-1. Steam and water were added in the pre-conditioner at the rate of 5.5–
7.8 kg hr-1 and 21–25 kg hr-1, respectively. Steam injection rate in the extruder was
approximately 26 kg hr-1. This lead to an approximate in-barrel moisture of 30.0-31.8% (wet
basis). The barrel temperature and screw profilw are shown in Figure 1. The extruder was
operated at a screw speed of 307 rpm. A die with 6 circular openings of approximately 3.10 mm
diameter each was used, and product was cut with a knife operating at 997 rpm. Post-extrusion
the feed was dried in a double pass dryer/cooler system (Series 4800, Wenger Manufacturing,
Sabetha, KS, USA) with a retention time of 17.45 min at approximately 104.4°C and a cooling
time of 4.45 min. They were subsequently packed into 3-ply paper sacks for cool dry storage at
ambient temperature (25 ± 2°C) before further analysis.
The total specific mechanical energy (SME) applied to the whole process was calculated
based on motor loads and screw speeds, in relation to the mass flow rate and power rating of the
motor, described by the following equation 1 (Karkle et al. 2012):
(1)
where, is the % torque; is the no load % torque (24% for 200–400 rpm); is the
extruder screw speed (307 rpm); is the rated screw speed (508 rpm); is the rated motor
power (37.29 kW); and is the mass flow rate or throughput.
τ 0τ N
rN rP
m!
m
PNN
kgkJSMEr
r
!
××⎟⎠
⎞⎜⎝
⎛ −
=− 100).(
0
1
ττ

42
A pilot-scale pellet mill (Master Model 1000HD, CPM, Crawfordsville, Indiana) was
used for producing compression pelleted diets. Prior to pelleting, 1% calcium lignosulfonate
(Ameribond 2X, LignoTech USA, Rothschild, Wisconsin, USA) was added to the mash feed in a
double shaft paddle mixer (Forberg, Model F500, Ontario, Canada). The mash feed was then
transferred to a holding bin above the pelleting system. The mash feed was fed into the pelleting
system at a dry rate of approximately 500 kg hr-1. It was then conditioned with a retention time
of approximately 30 s and to a temperature of 85°C in a cylindrical steam conditioner (Custom
built: dimension 30 x 91 cm, Bliss Industries, Ponca City, Oklahoma) prior to pelleting.
Pelleting was accomplished using a ring-die pellet mill (CPM, Master Model 1000HD,
Crawfordsville, Indiana) equipped with a pellet die having the effective dimensions of 0.24 x
3.18 cm, die opening and land length, respectively. Pelleted feed was cooled in a double pass
horizontal perforated bed cooler (Custom built, Wenger Manufacturing, Sabetha, KS, USA) prior
to being sacked off in 50 lb 3-ply paper sacks.
2.2. Feed physical characterization
Bulk density, Radial expansion ratio and Pellets durability index (PDI)
In order to determine bulk density (BD) for each feed, a liter cup was filled with pellets
and weighed. Bulk density was determined as mass per unit volume in duplicate. Expansion ratio
was determined by using a digital caliper to measure the diameter of the pellets after processing.
Measurements were done in 10 replications per treatment. Expansion ratio was calculated as the
square of the mean diameter of pellet, dp divided by the square of the diameter of die hole, dd
(Eq. 2):

43
𝐸𝑥𝑝𝑎𝑛𝑠𝑖𝑜𝑛 𝑅𝑎𝑡𝑖𝑜 (𝐸𝑅) = !!!
!!! (2)
Pellet durability index (PDI) was determined using an adapted version of the ASAE
standard method S269.4 (ASAE 1997). Approximately 500 g of finished diets from each
treatment was placed into two separate compartments of a custom-made tumbling equipment.
One compartment had 5 metal pieces (nuts) to simulate a harsher handling environment, while
the other did not have any. The tumbler was operated for 10 minutes before emptying the
compartments. The tumbled samples were sieved through a US standard sieve No. 270 (0.053
mm) to separate the unbroken feed, which was reweighed. PDI was calculated as follows,
( 3)
where mf is the mass of unbroken feed after tumbling and mi is the initial mass. PDI was
calculated for feed in both the compartment with metal pieces (modified method) and the one
without (unmodified method).
2.3. Sinking property
Fifty pellets were picked randomly from each treatment and dropped into water in a one
liter beaker at room temperature (≈ 25°C). The number of floating pellets was counted after one
minute to obtain the total number of pellets that sank. All experiments were replicated at least
twice, and sinking percentage (S) was determined as follows,
( 4)
where Ns is the number of sinking pellets.
100(%) ×=i
f
mm
PDI
10050
(%) ×= sNS

44
2.4. Water Stability
Water stability of the pellets was determined by slight modification to Jayaram and
Shetty (1981) method. Five grams of pellets were weighed into 100 ml beakers filled with water.
Beakers were placed in a water bath operated at 28°C (Aquacop, 1978) for 1, 3, 5 and 7 hrs.
Water was drained after each time period, and the beaker and feed left were dried in an oven
(Thelco Lab Oven, Precision Scientific Chicago, Il, USA) at 105°C until constant weight. Water
stability was calculated as the difference between mass of beaker (with feed) before and after
water immersion divided by the initial mass of the feed.
2.5. Degree of Gelatinization
Extruded and milled pellets were ground in a kitchen blender (Osterizer Galaxie Cycle
Blend, USA). Water was added to the powdered flakes at a ratio of 2:1, moisture to dry. After
thorough mixing in a beaker with glass paddle, they were left over night to equilibrate.
Approximately 20–30 mg was scooped into a stainless steel high volume pan and closed with a
lid with O-ring insertion. Samples were placed into DSC (Q200, TA Instrument, Delaware,
USA) cell compartment and heated by ramping the temperature at a rate of 10°C min-1 from 10–
130°C. The process was also repeated for the raw ingredients mix used for producing the pellets.
Integration of the endothermic peaks of thermograms from both the raw flour and pellets were
performed on Universal Analysis 2000 software (version 4.7A, TA Instruments Waters-LLC,
USA). The degree of gelatinization was calculated using the following expression in equation 5:
𝐷𝑒𝑔𝑟𝑒𝑒 𝑜𝑓 𝐺𝑒𝑙𝑎𝑡𝑖𝑛𝑖𝑧𝑎𝑡𝑖𝑜𝑛 (𝐷𝐺) = ∆!!"# !"#$%&'%"()!∆!!"##"$∆!!"# !"#$%&!%"'(
𝑋 100% (5)

45
2.6. Growth trials
Dietary treatments were tested in an indoor tank system, located at the E.W. Shell
Fisheries Research Station, Auburn, Alabama. Post-larval L. vannamei were obtained from
GMSB Shrimp Hatchery (Summerland Key, Florida) and maintained in a 220-L polyethylene
nursery tank connected to a biological filter. During the first week PL were intermittently offered
artemia nauplii (200 nauplii per shrimp) and offered a commercial feed daily using automatic
feeders. Food size was increased as the PL grew with the final feed being a commercial 35%
protein diet (Rangen Inc, Buhl, Idaho USA).
Juvenile shrimp were obtained from the nursery system and selected by hand sorting to a
uniform size. In trial 1, juvenile shrimp (0.35 ± 0.032 g) were stocked into 40 tanks (60 L),
which were part of a recirculating system at a density of 10 shrimp per tank with four
replications per treatment over a 63-day growth trial. In trial 2, juvenile shrimp (0.38 ± 0.02 g,
initial weight) were also stocked into 60 tanks (60 L), which were part of a recirculating system
at a density of 10 shrimp per tank with six replicates per treatment over a 42-day growth trial.
Daily feed inputs were calculated, based upon an expected weight gain of 0.8 g per
week and an expected feed conversion ratio of 1.8:1. Dissolved oxygen, temperature, and pH
were measured twice a day using a YSI 556 MPS meter (Yellow Spring Instrument Co., Yellow
Springs, OH, USA). Total ammonia-nitrogen was measured once per week using the Orion
ammonia electrode probe (Thermo Fisher Scientific Inc., Waltham, MA, USA). At the
conclusion of each growth trial, the shrimp were counted and group weighed. Final mean weight,
final biomass, percent survival, and feed conversion ratio (FCR) were determined.

46
2.7. Statistical analysis
Data were analyzed by using a one-way analysis of variance to determine significant (P <
0.05) differences among treatment means. When significant differences were identified, Duncun
multiple range test was used to determine significant differences between treatment means.
Additionally, data from growth trial were analyzed by using two-way analysis of variance to
determine significant (P < 0.05) difference for two different processing methods. The statistical
analyses were performed using SAS software package (SAS Institute Inc., Cary, NC USA).
3. Results and Discussion
3.1. Proximate composition
The proximate composition of S-DDGS is presented in Table 2. The level of protein is
typical for DDGS but the fiber content is high and there is a minimal amount of starch, which
was depleted during the prior fermentation process. Proximate compositions of the extruded and
pelleted feed diets are presented in Table 3. Analysis of variance showed that the effect of S-
DDGS and processing methods was significant (P <0.05) on the variation observed in all the
chemical constituent of the feeds. Protein ranged from 33.6 – 35.5% and fat from 7.77 to 8.75%
across the levels of S-DDGS inclusion, indicating a reasonable replacement strategy. Fiber levels
of the feed increased as S-DDGS increased. The effect of fiber is shown on SME (Fig. 2), with
increase seen with increased level of DDGS, which was due to increased frictional/viscous effect
of fiber flow in the extruder. Ash content was in the range of 6.97–7.50%, which would be
expected as the ash contents of the replacement ingredients were similar. Percent starch
decreased with increased level of S-DDGS in feed, which can be traced back to the low level in
S-DDGS (Table 1) and the decrease in whole wheat that was reduced due to the need to make

47
room in the formulations. Moisture content of the pelleted feed was approximately 8.35%, while
that of extruded feeds ranged from 4.15–9.45% which is probably due to variations in the drying.
3.2. Physical characteristics of the feeds
The SME input during extrusion of S-DDGS based aquatic feeds are shown in Figure 2.
It ranged from 48.75 – 55.47 kJ.kg-1. There was a gradual increase in SME as S-DDGS was
included in the feed, which might be due to increases in frictional force of the melt viscosity with
higher fiber content. Rosentrater et al. (2009) asserted that SME is a function of product
composition. Their study showed a curvilinear trend in SME of extruded feed with increase in
DDGS level from 20 to 30%, temperature from 100 to 150°C and protein from 3 to 32.5%.
Bulk density of extruded and pelleted feed was 0.53–0.58 gcm-3 and 0.61–0.65 gcm-3,
respectively (Fig. 3). There was no particular trend shown for bulk density of extruded feed,
while pelleted feeds showed a decreasing trend with increase in S-DDGS level. However, there
was no significant difference between samples within each processing method, but slightly lower
density was observed for extruded diets compared with the pelleted diets. This can be attributed
to the structural development, which favors a slightly more porous product in extrusion
processing. Extrusion is characterized as using higher mechanical and thermal energy input,
which favors expansion, whereas pellet milling imparts higher compaction forces, which produce
a feed with higher mass per unit volume than in extrusion. Chevanan et al. (2007) observed a
significant increase in bulk density for DDGS-based aquatic feed with adjusted protein content
for all samples to 28%. Bulk density is a function of the feed component and processing
conditions. A slight change in moisture content could result in significant change in density,

48
given other conditions as stable. The variation observed in extruded aquatic feed in this study
could be due to slight changes in extrusion processing conditions.
The radial expansion ratio of the extruded and pelleted feeds is shown in Figure 4, and it
varied from 1.022–1.089 and 0.996–1.010, respectively. There was no particular trend shown
with respect to the level of S-DDGS. The expansion observed in extruded feeds was quite
minimal and could have resulted primarily from die swell. Pelleted feeds showed no expansion
whatsoever, which is typical of pelleting method (Briggs et al., 1999).
The PDI is a major quality index for feeds. It is usually performed to test the strength of
feed and to determine the level of possible disintegration during handling such as packaging and
transportation. PDI from the modified test for extruded and pelleted feed varied from 89.4–
96.3% and 94.1–96.2%, respectively (Fig. 5a). However, PDI for the unmodified extruded and
pelleted feed ranged from 94.9–97.9% and 96.88–97.5%, respectively (Fig. 5b). Modified
method, irrespective of processing, resulted in less durability compared with the unmodified
method for the obvious reason of having additional impact from the nuts included during testing.
PDI of extruded diets was not substantially different from that of pelleted diets, except for the
control diets, which had lower PDI (89.4%) than extruded. The lower PDI for extruded diets
could be attributed to greater porosity and less densely packed feed ingredients. PDI obtained
from unmodified method did not differ substantially with S-DDGS addition, irrespective of the
processing method. PDI from modified method, however, showed a gradual increase with
increased level of S-DDGS (up to 200 g kg-1 for pelleted and 300 g kg-1 for extruded) in the diet
for both extruded and pelleted feeds, before it declined slightly at 40% inclusion. Kannadhason
et al. (2007) had reported an increase in PDI for S-DDGS based aquatic feed for increased level
of S-DDGS from 20 to 40%. Rosentrater et al. (2009) showed a curvilinear effect of S-DDGS

49
addition on aquatic feed PDI in their study. When increase in S-DDGS level from 20 to 25% led
to an increased PDI, however, a further increase to 30% caused a decrease in PDI measured.
Pellets’ composition and heat treatment play important roles in structural development of feed.
What is surprising is the effect of starch on PDI in this study. It was expected that starch would
act as a binder and a decrease in starch content (higher S-DDGS level – Table 1 & 3) would lead
to a lower PDI. However, the interaction of other ingredients of the diet, such as external lipids
(fish oil), protein type and increased fiber content, could be responsible for the PDI pattern
shown by the different processing methods (Chevanan et al. 2007; Kannadhason et al. 2007).
3.3. Sinking percentage
Diets produced by pellet milling were all sinking feed, indicating very densely packed
products. This was also confirmed by the higher bulk density of the pelleted diets compared to
the extruded diets (Fig. 3). All extruded feeds showed sinking characteristics for all treatments
except for the one with 40% S-DDGS that had a sink rate of 88% (Table 4). This treatment also
had the lowest bulk density. However, when the bulk density of the feeds from the two methods
was compared with that of water (1 g cm-3), it was expected that all the feeds should float. The
porous nature of the feeds allowed them to absorb water for the first few minutes after being
poured into water, which increased their overall density above that of water thereby making them
sink.
3.4. Degree of gelatinization
The data for degree of gelatinization are shown in Table 5. DG for pelleted diet ranged
from 13.7 – 52.7%. For extruded diets, it ranged from 11.8–85.6%. Generally, a decreased level

50
of gelatinization was observed as S-DDGS as the formulation increased. Extruded samples
showed higher gelatinization than pelleted feeds, which could be a result of more energy input in
the extruder than in the pellet mill. Since the extrusion and pelleting conditions were constant
during processing, it was expected that gelatinization would remain the same for the different
formulations. However, this was not the case. This result was due to decreased starch (more S-
DDGS and less whole wheat) and increased fiber level in the formulation. That is to say, there
was less starch available for gelatinization. Soluble fiber (especially in ground form as is the case
in S-DDGS) is reported to have a binding effect, thus reducing contact area for other constituent
of the diets such as starch (Loar II and Corzo, 2011).
3.5. Water stability
Pellet feed water stability (WS) is an important quality attribute as it measures the feed’s
ability to withstand disintegration and nutrient leaching while in water before consumption by
aquatic animals. The water stability for the extruded and milled pellets ranged from 76.2–91.57%
and 80.46–85.04%, respectively, factoring the effect of soaking time and S-DDGS level (Table
6A,B). In general, there were limited significant differences with a diet across time from 1 hr to 6
hr. However, there were some differences within a given time across dietary inclusion levels of
S-DDGS. Obaldo et al. (2002) used three different methods for pellets water stability and
reported a decreasing trend in mass retention after 6 hours of soaking in water. Jayaram and
Shetty (1981) also reported a decrease in water stability of two new pelleted fish feed with time
(90.58 to 70.26% and 85.52 to 82.25%) from 1hr to 7hr. Lim and Cuzon (1994) in a review
paper presented dry matter data (82.5–88.0%) for feeds after 8 hours of soaking using different

51
types of binders. The range of WS reported by these authors for experimental feeds were within
the range reported in this study.
3.6. Growth trial
The two laboratory trials were conducted without any noticeable problems with water
quality or disease occurrence. Water quality parameters were within suitable ranges for the
culture of this species. Water quality parameters were as follows: trial 1 temperature, 27.68 ±
0.99°C; DO, 6.28 ± 0.40 mg L-1; salinity, 10.91 ± 3.56 g L-1; trial 2 temperature, 30.34 ± 1.03°C;
DO, 5.45 ± 0.23mg L-1; salinity, 19.22 ± 0.52 g L-1; and TAN, 0.045 ± 0.0.15 mg L-1.
For growth trial 1, results indicated that there were no significant differences in final
mean weight, biomass, survival, percentage weight gain and feed conversion ratio (FCR) of L.
vannamei fed with diets containing increasing percentages of S-DDGS for extruded or pelleted
feed (Table 7a). For the extruded diet, mean final weight ranged between 4.48 and 4.99 g, with
200 g kg-1 S-DDGS treatment having the largest mean final weight; biomass ranged from 36.9
and 43.6 g tank-1; FCR ranged between 2.83 and 3.02; survival ranged from 82.5 to 92.5%; and
percentage weight gain ranged between 1153.3 and 1260.9%. For the milled pelleted diet, mean
final weight ranged between 4.18 and 4.50 g; biomass ranged from 31.3 and 36.4 g tank-1; FCR
ranged between 3.10 and 3.26; survival ranged from 75.0 to 85.0%; and percentage weight gain
ranged between 1060.1 and 1196.7%.
For growth trial 2, results indicated that there were no significant differences in final
mean weight, biomass, survival and percentage weight gain of L. vannamei fed with diets
containing increasing percentages of S-DDGS for extruded or pelleted (Table 7b). For the
extruded diet, there were no significant differences between treatments; however, for pelleted

52
diet, FCR of 200 g kg-1 S-DDGS sorghum treatment was significant lower than FCR of 200 g kg-
1 S-DDGS sorghum treatment. For the extruded diets, mean final weight ranged between 4.02
and 4.69 g; biomass ranged from 36.42 and 43.62 g tank-1; FCR ranged between 1.82 and 2.19;
survival ranged from 90.0 to 93.3%; and percentage weight gain ranged between 971.75.29 and
1171.84%. For the milled pelleted diets, mean final weight ranged between 4.19 and 5.15 g;
biomass ranged from 35.82 and 43.83 g tank-1; FCR ranged between 1.66 and 2.07; survival
ranged from 76.67 to 90.00%; and percentage weight gain ranged between 1002.8 and 1280.8%.
For growth trial 1, based on pooled data, extruded feeds produced significantly larger
shrimp and lower feed conversion. However, for growth trial 2, based on pooled data, extruded
feeds produced significantly higher survival but not larger shrimp or lower FCR. The use of
sorghum S-DDGS up to 400 g kg-1 of the diet resulted in acceptable performance, which was
comparable to the control diet without any S-DDGS.
Due to the increased supply and low price of DDGS, there is considerable interest in the
use of DDGS in aquaculture diets. Recent research has shown that corn DDGS can be used as an
ingredient in a number of species including rainbow trout (Cheng and Hardy, 2004), channel
catfish (Li et al., 2010, 2011; Lim et al., 2009; Robinson and Li, 2008; Tidwell et al., 1990;
Webster et al., 1991, 1992, 1993), sunshine bass (Thompson et al., 2008), tilapia (Coyle et al.,
2004; Lim et al., 2007; Schaeffer et al., 2009; Shelby et al., 2008; Wu et al., 1994, 1996, 1997)
and Pacific white shrimp as well (Lawrence et al., 2011; Roy et al., 2009). Currently, no studies
are available for S-DDGS in feed for L. vannamei. However, the results in this study
demonstrated that inclusion of 400 g kg-1 S-DDGS in feed has negligible effects on shrimp
performance.

53
This result is in agreement with the finding of Robinson and Li (2008) and Lim et al.
(2009) who showed diet inclusion rates of 20–40% DDGS was successfully used in feed for
channel catfish. Lim et al. (2007) demonstrated 20% of DDGS could be included in the diet of
Nile tilapia as a replacement of a combination of soybean meal and corn meal without affecting
the overall growth performance. Wu et al. (1996) evaluated the growth response of Nile tilapia
fry fed all-plant protein diets containing 32, 36 and 40% crude protein, incorporation of 16–49%
DDGS resulted in good weight gain (WG), feed efficiency ratio (FER) and protein efficiency
ratio (PER). Tidwell et al. (1990) and Webster et al. (1991) found that 40 and 35% DDGS,
respectively, can be used in catfish diets containing 8–10% fish meal as substitutes for the
combination of soybean meal (SBM) and corn meal (CM) on an equal protein basis without
requiring lysine supplementation. Webster et al. (1991) showed a diet containing 70% DDGS
appeared to be deficient in lysine because supplementation of lysine at a level to meet lysine
requirement improved the growth of catfish. However, the characteristics of DDGS sorghum
include moderate protein and low lysine and methionine.
The results in our study showed no trend of decreasing growth with increasing levels of
S-DDGS as both lysine and methionine, the two most limiting amino acids were likely replete.
This result was different from Lim et al. (2007), who found that diets containing 8% fish meal
had increasing dietary levels of DDGS to 40% without the addition of lysine significantly
reduced WG and PER relative to those obtained with diets containing lower DDGS levels (0, 10
and 20%). Another study from Lim et al. (2009) suggest that with lysine supplementation to a
level equal to that of the control diet, at least 40% of DDGS can be included in the diet of
juvenile channel catfish as a replacement of a combination of soybean meal and corn meal
without affecting the growth performance, feed utilization efficacy and survival. Lim et al.

54
(2009) could not ascertain whether supplemental lysine can be omitted from 10-40% DDGS
catfish diet containing 8% menhaden fish meal because diets without lysine supplementation
were included in their study. The negative growth from Lim et al. (2007) study may be due to
lysine deficiency in the diets. In contrast, results from the current study indicated the growth was
not significantly affected S-DDGS level up to 40% even without lysine supplementation
although all diets containing S-DDGS were supplemented with methionine.
Limited research was available for comparing the extrusion and pelleting of feed for
aquatic species. The results in trial 1 were similar to those of Hilton et al (1981), who indicated
that extruded pellets have greater weight gain and feed efficiency in rainbow trout. Vens-Cappell
(1984) also showed that the superior conversion of the extruded feed as compared with pelleted
feed is due to its higher content of digestible energy. The results in trial 2 were in agreement with
Booth et al. (2002, who) indicated that feed intake, weight gain and specific growth rate of sliver
perch fed steam-pelleted diets were greater than those of fish fed extruded diets. However,
extruded or pelleted diets in both growth trials had limited significant effect on shrimp
performance.
4. Conclusion
Based on the results of the present study, S-DDGS can be included in practical diets for
the Pacific white shrimp, without negative effects on growth, survival and FCR. Although some
performance differences were observed between extruded or pelleted feed, these were not
consistent across the two trials. The physico-chemical properties of shrimp feed, such as SME,
bulk density, expansion ratio of feed, PDI, degree of gelatinization and water stability, were
significantly influenced by the level of inclusion of S-DDGS. The modified PDI of both pelleted

55
and extruded feeds generally increased up to 200 g kg-1 inclusion and then leveled off. Degree of
gelatinization generally decreased with increasing S-DDGS inclusion for extruded or pelleted.
As expected, some shifts in processing parameters were observed as the formulations were
changed. However, all the feeds were reasonable physical characteristics and supported good
performance of the shrimp. Based on the observed results, the use of S-DDGS products should
be encouraged as an alternative protein source in shrimp feed formulations.
References
Amaya, E.A., Davis, D.A., Rouse, D.B., 2007. Replacement of fish meal in practical diets for the
Pacific white shrimp (Litopenaeus vannamei) reared under pond conditions. Aquaculture
262, 393–401.
ASAE, 1997. Cubes, pellets, and crumbles-definitions and methods for determining density,
durability, and moisture. ASAE Standard S269.4. In: Agricultural Engineers Yearbook of
Standards. American Society of Agricultural and Biological Engineers, St Joseph, MI,
USA.
Aquacop, 1978. Study on nutritional requirements and growth of Penaeus merguiensis in tanks
by means of purified and artificial diets. Proceeding of World Mariculture Society
Annual Meeting 9, 225–234.
Briggs, J.L., Maier, D.E., Watkins, B.A., Behnke, K,C., 1999. Effect of ingredients and
processing parameters on pellet quality. Poult. Sci. 78, 1464–1471.
Booth, M.A., Allan, G.L., Evans, A.J., Gleeson, V.P., 2002. Effects of steam pelleting or
extrusion on digestibility and performance of silver perch Bidyanus bidyanus. Aquac. Res.
33, 1163–1173.

56
Cheng, Z.J., Hardy, R.W., 2004. Effect of microbial phytase supplementation in corn distiller’s
dried grain with solubles on nutrient digestibility and growth performance of rainbow
trout, Oncorhynchus mykiss. J. Appl. Aquac. 15, 83–100.
Chevanan, N., Rosentrater, K.A., Muthukumarappan, K., 2007. Twin-Screw extrusion
processing of feed blends containing distillers dried grains with solubles (DDGS). Cereal.
Chem. 84, 428–436.
Clemente, T.E., Cahoon, E.B., 2009. Soybean oil: genetic approaches for modification of
functionality and total content. Plant. Physiol. 151, 1030–1040.
Cohen, R.S., Tanksley, T.D., 1973. Energy and protein digestibility of sorghum grains with
different endosperm textures and starch types by growing swine. J. Anim. Sci. 37, 931–
935.
Coyle, S.D., Mengel, G.J., Tidwell, J.H., Webster, C.D., 2004. Evaluation of growth, feed
utilization, and economics of hybrid tilapia, Oreocromis niloticus × Oreochromis aureus,
fed diets containing different protein sources in combination with distillers dried grains
with solubles. Aquac. Res. 35, 365–370.
Davis, D.A., Arnold C.R., 2000. Replacement of fish meal in practical diets for the Pacific white
shrimp, Litopenaeus vannamei. Aquaculture 185, 291–298.
Ekanayake, S., Nair, B.M., Asp, N.G., Jansz, E.R., 2006. Effect of processing of sword beans
(Canavalia gladiata) on physicochemical properties of starch. Starch-‐Stärke 58, 215–222.
El-Sayed, A.F.M., 1999. Alternative dietary protein sources for farmed tilapia, Oreochromis spp.
Aquaculture 179, 149–168.
FAO (Food and Agriculture Organization of the United Nations), 2011. http://www.fao.
org/fishery/statistics/global-aquaculture-production/query/en.

57
Forster, I.P., Dominy, W.G., 2006. Efficacy of three methionine sources in diets for Pacific white
shrimp, Litopenaeus vannamei. J. World Aquac. Soc. 35, 357–365.
Garza deYta, A., Davis, D.A., Rouse, D.B., Ghanawi, J., Saoud, I.P., 2012. Evaluation of
practical diets containing various terrestrial protein sources on survival and growth
parameters of redclaw crayfish Cherax quadricarinatus. Aquac. Res. 43, 84–90.
Gatlin, D.M., Barrows, F.T., Brown, P., Dabrowski, K., Gaylord, T.G., Hardy, R.W., Herman,
E., Hu, G., Krogdahl, A., Nelson, R., Overturf, K., Rust, M., Sealey, W., Skonberg, D.,
Souza, E., Stone, D., Wilson, R., Wurtele, E., 2007. Expanding the utilization of
sustainable plant products in aquafeeds: a review. Aquac. Res. 38, 551–579.
Jayaram, M.G., Shetty, H.P.C., 1981. Formulations, processing and water stability of two new
pelleted fish feeds. Aquaculture 23, 355–359.
Hardy, R.W., 2006. Fish meal prices drive changes in fish feed formulations. Aquaculture
Magazine 32, 29–31.
Hilton, J.W., Cho, C.Y., Slinger, S.J., 1977. Factors affecting the stability of supplemental
ascorbic acid in practical diets. J. Fish. Res. Board Can. 34, 683–687.
Hilton, J.W., Cho, C.Y., Slinger, S.J., 1981. Effect of extrusion processing and steam pelleting
diets on pellet durability, pellet water absorption, and the physiological response of
rainbow trout (Salmo gairdneri R.). Aquaculture 25, 185–194.
Huck, G.L., Kreikemeier, K.K., Kuhl, G.L., Eck, T.P., Bolsen, K.K., 1998. Effects of feeding
combinations of steam-flaked grain sorghum and steam-flaked, high-moisture, or dry-
rolled corn on growth performance and carcass characteristics in feedlot cattle. J. Anim.
Sci. 76, 2984–2990.

58
Johnson H.M. (2003) US Seafood Market in 2020: strong demand likely boon to aquaculture.
Global Aquaculture Advocate, November 2003. http://pdf.gaalliance.org/pdf/gaa-
johnson-oct03.pdf.
Kannadhason, S., Muthukumarappan, K., Rosentrater, K.A., 2007. Effect of starch sources on
extruded aquaculture feed containing DDGS (ASABE Paper No. RRV-07149). American
Society of Agricultural and Biological Engineering/Canadian Society of Bioengineering,
Fargo, North Dakota, USA, 12–13 October 2007. St. Joseph, Michigan, USA.
Karkle E.L., Keller L., Dogan H., Alavi S., 2012. Extent of matrix transformation in fiber-added
extruded products under different hydration regimens and its impact on texture,
microstructure and digestibility. J. Food Eng. 108, 171–182.
Kyarisiima, C.C., Okot, M.W., Svihus, B., 2004. Use of wood ash in the treatment of high tannin
sorghum for poultry feeding. S. Afr. J. Anim. Sci. 34, 110–115.
Lawrence, L.A., Patnaik, S., Pratoomthai, B. Karges, K., 2011. Evaluation of corn dried distillers
grains with solubles as feed ingredient in shrimp diet. Biofuels Co-Products workshop.
Hawaii. http://www.oceanicinstitute.org/newsevents/pdf/13LawrenceDDGS.pdf.
Li, M.H., Robinson, E.H., Oberle, D.F., Lucas, P.M., 2010. Effects of various corn distillers by-
products on growth and feed efficiency of channel catfish, Ictalurus punctatus. Aquac.
Nutr. 16, 188–193.
Li, M.H., Oberle, D.F., Lucas, P.M., 2011. Evaluation of corn distillers dried grains with
solubles and brewers yeast in diets for channel catfish, Ictalurus punctatus. Aquac. Res.
42, 1424–1430.
Lim, C., Garcia, J.C., Yildirim-Aksoy, M., Klesius, P.H., Shoemaker, C.A., Evans, J.J., 2007.
Growth response and resistance to Streptococcus iniae of Nile tilapia, Oreochromis

59
niloticus, fed diets containing distiller’s dried grains with solubles. J. World Aquac. Soc.
38, 231–237.
Lim, C., Yildirim-Aksoy, M., Klesius, P.H., 2009. Growth response and resistance to
Edwardsiella ictaluri of channel catfish, Ictalurus punctatus, fed diets containing
distillers dried grains with solubles. J. World Aquac. Soc. 40, 82–193.
Lim, S., Cuzon, G., 1994. Water stability of shrimp pellets: A review. Asian Fish. Sci. 7, 115–
127.
Loar, II R.E., Corzo, A., 2011. Effects of feed formulation on feed manufacturing and pellet
quality characteristics of poultry diets. Worlds Poult. Sci. J. 67, 19–28.
Lovell, R.T., 1989. Nutrition and Feeding of Fish. AVI Publishing, Co., New York, pp 260.
Lovell, R.T., 1990. Nutrition and feeding highlights from the World Aquaculture Society
Meeting. Aquac. Mag. 16. 70–73.
Lovell, R.T., Lim, C., 1978. Vitamin C in pond diets for channel catfish. Trans. Am. Fish. Soc.
107, 321–325.
MacGrath W.S.Jr., 1976. The role of the feed industry in developing formulated feeds for
aquaculture. In K.S. Price, Jr., W.N. Shaw and K.S. Danberg (Eds), Proceedings of the
First International Conference on Aquaculture Nutrition, Oct. 14-15, 1975, Newark, DE,
USA. pp.119–123.
Madacsi, J.P., Parrish F.W., McNaughton, J.L., 1988. Treatment of low-tannin sorghum grain for
broiler feed. Anim. Feed. Sci. Tech. 20, 69–78.
Menon, N.R., Paul, M., 2001. Shrimp culture - its ecological imperatives and eco ethical
wlutions. In Proceeding of International Symposium on Fish for Nutritional Security in

60
the 21" Century held at Central Institute of Fisheries Education (Deemed University –
ICAR) Mumbai, India from December 4–6, 2001.
NRC, (National Research Council) 2011. Nutrient requirements of fish and shrimp. National
Academies press, Washington, DC. p: 301–324
Obaldo, L.G., Divakaran, S., Tacon, A.G., 2002. Method for determining the physical stability of
shrimp feed in water. Aquac. Res. 33, 369–377.
Riaz, M.N., 2009. The Role of Extrusion Technology on Feed Safety and Hygiene. Presented at
the 17th Annual ASAIM Southeast Asian Feed Technology and Nutrition Workshop, The
Imperial Hotel, Hue, Vietnam, June 17.
Robinette, H.R., 1977. Feed manufacture. In: Stickney, R.R., Lovell, R.T., (Eds.), Nutrition and
Feeding of Channel Catfish. South. Coop. Ser. Bull. 36, 84–96.
Roy, L.A., Bordinhon, A., Sookying, D., Davis, D.A., Brown, T.W., Whitis, G.N., 2009.
Demonstration of alternative feeds for the Pacific white shrimp, Litopenaeus vannamei,
reared in low salinity waters of west Alabama. Aquac. Res. 40, 496–503.
Paripatananont, T., Boonyaratpalin, M., Pengseng, P., Chotipuntu, P., 2001. Substitution of soy
protein concentrate for fishmeal in diets of tiger shrimp. Penaeus monodon. Aquac. Res.
32 (Suppl. 1), 369–374.
Robinson, E.H., Li, M.H., 2008. Replacement of Soybean Meal in Channel Catfish, Ictalurus
punctatus, Diets with Cottonseed Meal and Distiller's Dried Grains with Solubles. J.
World Aquac. Soc. 39, 521–527.
Rosentrater, K.A., Muthukumarappan, K., Kannadhason, S., 2009. Effects of ingredients and
extrusion parameters on properties of aquafeeds containing DDGS and corn starch. J.
Aquac. Feed Sci. Nutr. 1, 44–60.

61
Schaeffer, T.W., Brown, M.L., Rosentrater, K.A., 2009. Performance characteristics of Nile
tilapia (Oreochromis niloticus) fed diets containing graded levels of fuel-based distillers
dried grains with solubles. J. Sci. Food Agric. 1, 78–83.
Shelby, R.A., Lim, C., Yildrim-Aksoy, M., Klesius, P.H., 2008. Effect of distillers dried grains
with solubles-incorporated diets on growth, immune function and disease resistance in
Nile tilapia (Oreochromis niloticus). Aquac. Res. 39, 1351–1353.
Sookying, D., Davis, D.A., 2012. Use of soy protein concentrate in practical diets for Pacific
white shrimp (Litopenaeus vannamei) reared under field conditions. Aquac. Int. 20, 357–
371.
Stickney R.R., 1979. Feeds, nutrition and growth. In: Principles of Warmwater Aquaculture.
John Wiley, Toronto, Ontario., pp. 198–202.
Thompson, K.R., Metts, L.S., Muzinic, L.A., Dasgupta, S., Webster, C.D., 2006. Effects of
feeding practical diets containing different protein levels, with or without fish meal, on
growth, survival, body composition and processing traits of male and female Australian
red claw crayfish (Cherax quadricarinatus) grown in ponds. Aquac. Nutr. 12, 227–238.
Thompson, K.R., Rawles, S.D., Metts, L.S., Smith, R., Wimsatt, A., Gannam, A.L., Twibell,
R.G., Johnson, R.B., Webster, C.D., 2008. Digestibility of dry matter, protein, lipid, and
organic matter of two fish meals, two poultry by-product meals, soybean meal, and
distiller’s dried grains with solubles in partial diets for sunshine bass, Morone chrysops ×
M. saxatilis. J. World Aquac. Soc. 39, 352–363.
Tidwell, J. H., Webster, C.D., Yancey, D.H., 1990. Evaluation of distiller’s grains with solubles
in prepared channel catfish diets. Trans. Ky. Acad. Sci. 52,135–138.

62
Vens-Cappell, B., 1984. The effects of extrusion and pelleting of feed for trout on the
digestibility of protein, amino acids and energy and on feed conversion. Aquac. Eng. 3,
71–89.
Webster, C.J., Tidwell, J.H., Yancey, D.H., 1991. Evaluation of distiller’s grains with solubles as
a protein source in diets for channel catfish. Aquaculture 96, 179–190.
Webster, C.J., Tidwell, J.H., Goodgame, L.S., Clark, J.A., Yancey, D.H., 1992. Use of soybean
meal and distiller’s grains with solubles as partial or total replacement of fish meal in
diets of channel catfish (Ictalurus punctatus). Aquaculture 106, 301–309.
Webster, C.J., Tidwell, J.H., Goodgame, L.S., Johnsen, P.B., 1993. Growth, body composition,
and organoleptic evaluation of channel catfish fed diets containing different percentages
of distiller’s grain with solubles. Prog. Fish-Cult. 55, 95–100.
Wu, Y.V., Rosati, R.R., Sessa, D.J., Brown, P.B., 1994. Utilization of protein-rich ethanol co-
products from corn in tilapia feed. J. Am. Oil. Chem. Soc. 71,1041–1043.
Wu, Y.V., Rosati, R.R., Brown, P.B., 1996. Effect of diets containing various levels of protein
and ethanol coproducts from corn on growth of tilapia fry. J. Agri. Food Chem. 44, 1491–
1493.
Wu, Y.V., Rosati, R.R., Brown, P.B., 1997. Use of corn-derived ethanol coproducts and
synthetic lysine and typtophan for growth of tilapia (Oreochromis niloticus) fry. J. Agri.
Food Chem. 45, 2174–2177.

63
Table 1 Composition (g kg-1 as is basis) of five practical diets formulated with different levels of distillers dried grains with solubles from sorghum (S-DDGS) as a partial replacement for solvent extracted soybean meal and whole wheat. S-DDGS level
0 100 200 300 400
Menhaden fishmeal1 50.0 50. 0 50.0 50.0 50.0
Soybean meal solvent extracted2 550.0 491.0 433.0 375.0 317.0
DDGS Sorghum3 0.0 100.0 200.0 300.0 400.0
Menhaden Fish Oil4 55.7 48.6 41.4 34.2 27.0
Whole wheat4 304.2 270.1 235.0 199.9 164.9
Mineral premix5 1.9 1.9 1.9 1.9 1.9
Vitamin premix5 3.3 3.3 3.3 3.3 3.3
Choline chloride4 2.0 2.0 2.0 20 2.0
Stay C 250 mg/kg (25% active)4 1.0 1.0 1.0 1.0 1.0
Calcium phosphate dibasic4 22.0 22.0 22.0 22.0 22.0
Lecithin6 10.0 10.0 10.0 10.0 10.0
Methionine–DL4 0.20 0.45 0.70 0.95
1 Omega Proteins, Houston, TX, USA 2 Kansas State University Feedmill, Manhattan, KS, USA 3 Prairie Horizons Agri-Energy, Phillipsburg, KS, USA 4 Lortschre Agri Service, Bern, KS, USA 5Rangen, Buhl, ID, USA 6 Solae, St. Louis, MI, USA

64
Table 2 Proximate composition of the sorghum based distillers dried grains.
Nutrient g kg-1 Amino Acid g kg-1
Dry matter 911.2 Alanine 26.26
Protein 339.2 Arginine 5.44
Lipid 87.6 Aspartate 20.51
Crude Fiber 102.1 Cysteine 5.02
Ash 44.1 Glutamate 57.10
Phosphorus 9.0 Glycine 11.25
Starch 23.9 Histidine 7.30
Isoleucine 14.52
Leucine 38.06
Lysine 10.07
Methionine 4.67
Phenylalanine 16.63
Serine 14.66
Threonine 10.50
Tyrosine 10.07
Valine 15.28
Total 267.33

65
Table 3 Proximate composition of extruded and pelleted S-DDGS based aquatic feeds (g kg–1).
S-DDGS level Protein Fat Crude Fiber Ash Starch Moisture
Extruded Feed
0 355 85 20 75 169 41
100 353 85 24 75 151 42
200 342 78 26 73 135 77
300 336 67 31 70 113 95
400 355 79 35 73 106 42
Pelleted Feed
0 341 78 21 72 156 82
100 340 81 24 72 140 84
200 340 83 28 73 126 79
300 339 85 33 72 117 88
400 336 88 36 71 101 84

66
Table 4 Sinking characteristics of extruded and pelleted S-DDGS based aquatic feeds.
S-DDGS Level, g kg-1 Sink %
Extruded Pellets Milled Pellets
0 100 100
100 98 100
200 98 100
300 100 100
400 88 100

67
Table 5 Degree of gelatinization (DG) of extruded and pelleted S-DDGS based aquatic feeds
Level S-DDGS, g
kg-1
Temperature at
Gelatinization Peak, °C Enthalpy, J/°C DG, %
Raw
Ingredient 0 70.18 0.986 -
100 70.45 1.096 -
200 70.33 0.784 -
300 70.85 0.695 -
400 70.75 0.642 -
Pelleted 0 70.03 0.467 52.66
100 74.27 0.597 45.53
200 69.72 0.661 15.68
300 69.63 0.599 13.74
400 70.16 0.522 18.73
Extruded 0 72.24 0.142 85.59
100 80.12 0.241 77.99
200 61.28 0.277 64.62
300 59.41 0.519 25.35
400 65.29 0.566 11.84

68
Table 6 Water stability property of extruded and pelleted S-DDGS based aquatic feeds A: Extruded Feed S-DDGS level, % 3 hr 5 hr 7 hr
0 88.02 (a) 87.84 (a) 91.57 (a)
10 85.53 (ab) 85.54 (a) 85.78 (b)
20 82.93 (bc) 81.87 (bc) 81.09 (c)
30 81.62 (c) 80.71 (c) 76.20 (c)
40 85.66 (ab) 85.09 (ab) 86.22 (a)
P-value 0.016 0.014 0.0001
B: Pelleted Feed S-DDGS level, % 3 hr 5 hr 7 hr
0 81.83 (a) 80.46 (a) 81.17 (a)
10 82.94 (b) 83.15 (a) 82.64 (a)
20 84.16 (c) 83.32 (a) 83.06 (a)
30 83.89 (bc) 83.18 (a) 82.61 (a)
40 83.64 (bc) 83.25 (a) 82.04 (a)
P-value 0.014 0.199 0.052
Different letters in bracket in the same column for each feed type are significantly different at P<0.05 (tested effect of DDGS level); the same letter in the same row are not significantly different P>0.05 (tested effect of soaking time).

69
Table 7a Response of juvenile L. vannamei (0.35 ± 0.032 g) to the test diets after a 63-day growth trial. Diets were either extruded (E) or pelleted (P).
S-DDGS,
g kg-1
Mean
Weight (g)
Final Biomass
(g) FCR
Survival
(%)
Weight
Gain (%)
Extruded
0 4.59 37.40 2.99 82.50 1226.08
100 4.48 36.90 3.02 82.50 1175.50
200 4.99 43.60 2.72 87.50 1190.63
300 4.69 43.40 2.87 92.50 1260.90
400 4.82 42.00 2.83 87.50 1153.29
P value 0.6011 0.0350 0.6296 0.2959 0.5258
Pelleted
0 4.50 36.40 3.10 82.50 1196.70
100 4.28 33.60 3.22 80.00 1171.10
200 4.22 35.60 3.24 85.00 1062.60
300 4.43 34.70 3.10 80.00 1163.80
400 4.18 31.30 3.26 75.00 1060.10
P value 0.9045 0.5410 0.9668 0.8938 0.7167
Pooled Data
Extruded 4.71 40.67 2.89 86.50 1201.28
Pelleted 4.32 34.35 3.18 80.50 1130.90
P value 0.0135 0.0001 0.0106 0.0842 1.8226
Based on Student-Newman-Keuls Test, no significant differences (P > 0.05) were found among treatment means (n = 4). FCR, feed conversion ratio = feed offered per shrimp/ weight gain per shrimp.

70
Table 7 b Response of juvenile L. vannamei (0.38 ± 0.02 g) to the test diets after a 42-day growth trial (Trial 2). Diets were either extruded (E) or pelleted (P).
S-DDGS,
g kg-1
Mean
Weight (g)
Final
Biomass (g)
FCR Survival
(%)
Weight
Gain (%)
Extruded
0 4.14 37.10 2.12 90.00 971.80
100 4.02 36.42 2.19 90.00 974.40
200 4.66 42.78 1.84 91.67 1171.80
300 4.69 43.62 1.82 93.33 1174.80
400 4.33 40.98 1.99 93.33 1077.10
P value 0.0802 0.0822 0.0592 0.9549 0.0971
Pelleted
0 4.86 37.56 1.78ab 78.00 1177.30
100 4.99 39.00 1.71ab 78.00 1247.20
200 5.15 43.83 1.66b 85.00 1280.80
300 4.68 35.82 1.84ab 76.67 1130.40
400 4.19 37.62 2.07a 90.00 1002.80
P value 0.0587 0.3391 0.0469 0.1699 0.0579
Pooled
data
Extruded 4.37 40.18 1.99 91.67 1073.98
Pelleted 4.77 38.76 1.81 81.53 1167.69
P value 0.0169 0.2629 0.02 0.0005 0.0881
Based on Student-Newman-Keuls Test, no significant differences (P > 0.05) were found among treatment means (n = 6). FCR, feed conversion ratio = feed offered per shrimp/ weight gain per shrimp.

71
Figure 1 Schematic diagram of single screw elements for X-20 extruder with barrel temperature
profile.
Barrel Temperature
60°C 70°C 80°C
Product entry point Discharge point
1 2 3 4 5 6 7 8 9 10
Element Numbers
1-2 =single flight screws; 3=small steamlock; 4=single flight screw; 5=small steamlock;
6=single flight screw; 7=medium steamlock; 8=double flight screw; 9=large steamlock and
10=double cut cone.

72
Figure 2 Specific mechanical energy input during extrusion of S-DDGS based aquatic feeds.
44
46
48
50
52
54
56
0 10 20 30 40
Specific mechn
aical en
ergy, kJkg-‐
1
DDGS level, %

73
Figure 3 Bulk density of extruded and pelleted S-DDGS based aquatic feeds.
0.40
0.45
0.50
0.55
0.60
0.65
0.70
0 10 20 30 40
Bulk den
sity, gcm
-‐3
DDGS, %
Extruded Pelleted
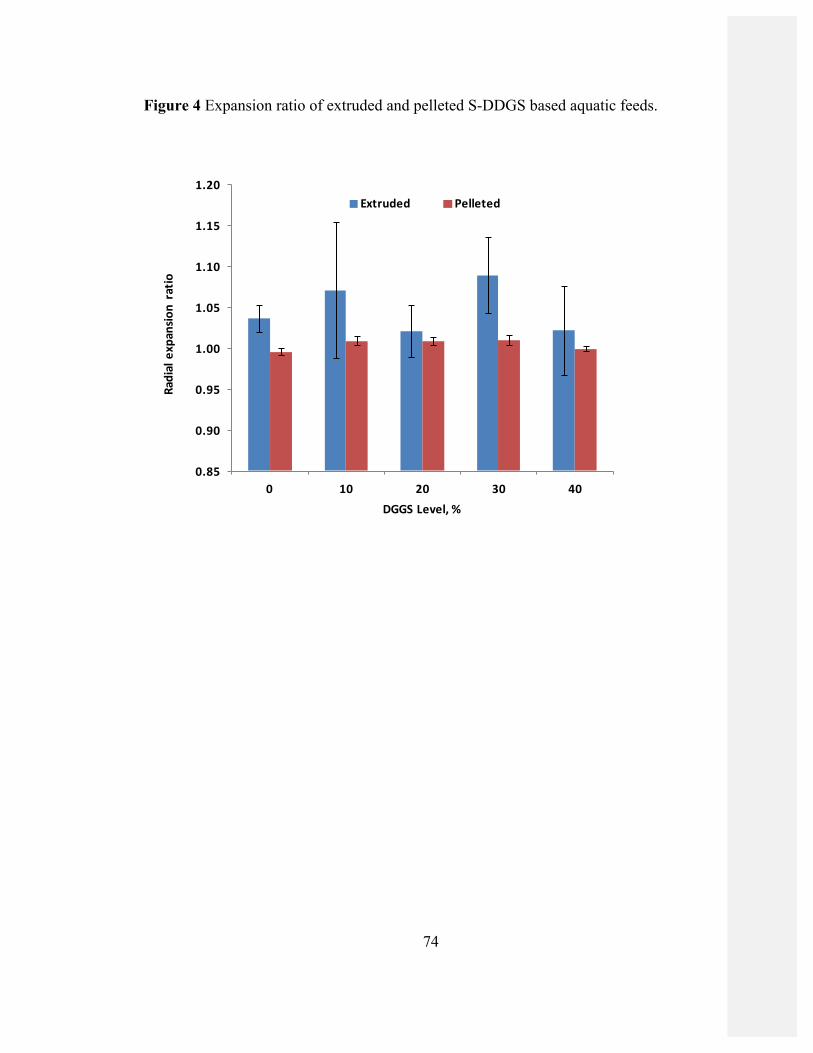
74
Figure 4 Expansion ratio of extruded and pelleted S-DDGS based aquatic feeds.
0.85
0.90
0.95
1.00
1.05
1.10
1.15
1.20
0 10 20 30 40
Radial expansio
n ratio
DGGS Level, %
Extruded Pelleted

75
Figure 5 Pellet durability index of S-DDGS based extruded and pelleted diets using both (a)
unmodified and (b) modified (more rigorous, with metal pieces) testing methods.
82
84
86
88
90
92
94
96
98
100
102
0 10 20 30 40
Pellet D
urability In
dex, %
DDGS Level, %
Unmodified Extruded Unmodified Pelleted
84
86
88
90
92
94
96
98
0 10 20 30 40
Pellet d
urabilit
y inde
x, %
DDGS Level, %
Modified Extruded Modified Pelleted

76
CHAPTER IV
COMPARATIVE EVALUATION OF COPPER SULFATE AND TRIBASIC COPPER
CHLORIDE ON GROWTH PERFORMANCE AND TISSUE RESPONSE IN PACIFIC
WHITE SHRIMP Litopenaeus vannamei FED PRACTICAL DIETS
Abstract
Three trials were conducted to evaluate the response of Pacific white shrimp Litopenaeus
vannamei to dietary copper sulfate containing 25.45% copper (Cu) and tri-basic copper chloride
(TBCC) containing 58.81% Cu. The basal diet used in each trial was primarily composed of
fishmeal, soybean meal, corn starch, whole wheat and corn gluten meal, and was formulated to
contain Cu about 10 mg Cu kg–1. In trial 1, two sets of diets, one supplemented with copper
sulfate (6, 12, and 24 mg Cu kg–1) and the other with TBCC (6, 12, and 24 mg Cu kg–1) were
conducted in clear water recirculating system at a salinity of 21.01‰, with four replications per
treatment of shrimp (initial mean weight 0.31 ± 0.01 g) for 8-weeks. In trial 2, shrimp (initial
mean weight 0.39 ± 0.01 g) was fed the same six diets as trial 1 for a period of 6 weeks at a
salinity of 15.51% in an outdoor green water recirculating system. In trial 3, six diets containing
supplemented graded levels of dietary copper (0, 5, 10, 20, 40, and 60 mg Cu kg–1) from TBCC
were fed to juvenile shrimp (initial mean weight 0.28 g) at a salinity of 19.00%, with four
replications per treatment for 8-week in a clear water recirculating system. At the conclusion of
the trials, final mean weight, percent weight gain, final biomass, feed conversion ratio (FCR),
and survival were determined. There were no significant effects from copper supplemental levels
or source on final mean weight, final biomass, FCR, and survival in all three trials. However, in
trial 3, there was a trend for positive response of percent weight gain to copper supplementation

77
with TBCC. Copper analysis of select tissues (carapace, hepatopancreas, and hemolymph) of
shrimp from trial 1 and 2 indicated some significant difference among the treatments. In trial 1
and 2, when the tissues’ concentrations are pooled across dietary levels for each copper source,
copper levels of the tissues from shrimp fed TBCC were significantly lower than those of shrimp
fed diets supplemented with copper sulfate. In trial 3, the concentration of copper in the
carapace, hemolymph, and hepatopancreas in general increased with increasing TBCC
supplementation. Linear regression of log10 transformed select tissues copper concentration on
analyzed copper intake resulted in a slope ratio estimate for bioavailability of copper from TBCC
that was lower to copper sulfate. The results of the present study demonstrate that TBCC is an
effective copper source. Given the lower solubility of TBCC, it may be a more appropriate
copper source for shrimp feeds.

78
1. Introduction
Copper (Cu) is an essential trace element for all living organisms (Burgess et al., 1999;
Cervantes and Gutiérrez-Corona, 1994; Davis and Gatlin, 1996; Lall, 2002; Lorentzen et al.,
1998; Shiau and Bai, 2009; Underwood and Suttle, 1999; Watanabe et al., 1997). Copper was
first shown to be essential for growth and hemoglobin production in rats (Hart et al., 1928).
Copper is important for animals as it is involved in the activity of functions in numerous copper
dependent enzymes such as lysyl oxidase, cytochrome c oxidase (CCO), ferroxidase, tyrosinase
and superoxide dismutase (SOD) (O'Dell, 1976). In addition, copper proteins and chelates also
have metabolic roles (Watanabe et al., 1997). Copper is of particular importance in malacostraca
crustacean where hemocyanin – an analogue of red-blooded animals’ hemoglobin – is utilized as
the oxygen-carrying pigment (Lovell, 1989). Rao and Anjaneyulu (2008) and Rao et al. (2008)
provided strong evidence that copper is essential for both molting and reproduction in Pacific
white shrimp (Litopenaeus vannamei). Depledge (1989) documented that 40% of the whole-body
copper load in shrimp on a fresh weight basis is found in hemocyanin. This suggests a
considerable increase in the physiological demand for copper by crustaceans above that required
by vertebrates (NRC, 2011). Several studies have documented the dietary copper requirement in
fish (Gatlin and Wilson, 1986; Lin et al., 2008; Tan et al., 2011). The dietary copper requirement
of Pacific white shrimp (L. vannamei), tiger shrimp (Penaeus monodon), and fleshy prawn
(Fenneropenaeus chinensis) has been reported as 16–32 mg kg–1, 10–30 mg kg–1, and 25 mg kg–
1, respectively (Davis et al., 1993; Lee and Shiau, 2002; Wang et al., 1997).
Knowledge of the bioavailability of supplemental copper sources is critical for the
selection of a copper source in feed production (Luo et al., 2005; Miles et al., 1998; Spears et al.,
2004). Sources of copper differ in their ability to be metabolized and utilized by cattle and

79
broilers, especially in the presence of copper antagonists (Arias and Koutsos, 2006; Kegley and
Spears, 1994). Copper sulfate (CuSO4) is the most common form of copper used in feeds for
growth promotion. Tri-basic copper chloride (TBCC) is a more concentrated form of copper than
copper sulfate (58% vs 25% Cu). Compared to copper sulfate, TBCC has good characteristics
such as low hygroscopicity, very low chemical reactivity, and low activity in catalyzing the
destruction of certain vitamins and other organic compounds when concentrated in premixes or
diets (Cromwell et al., 1998; Luo et al., 2005; Miles et al., 1998). Cromwell et al. (1998)
indicated that TBCC was as effective as copper sulfate to improve growth for weanling pigs.
Shao et al. (2010) reported that TBCC was more bioavailable to crucian carp (Carassius auratus
gibelio) than copper sulfate. Luo et al. (2005) reported that TBCC was a safer product and was
more available than copper sulfate for broilers, and similar results were found in steers (Spears et
al., 2004). Cheng et al. (2008) documented that TBCC is of similar availability based on
performance, carcass characteristics and fat metabolism in lambs. Bharadwaj et al. (2014)
suggested that chelated copper is safe, effective and highly available source of copper in L.
vannamei. However, there is presently no information available on the use of TBCC in shrimps.
In the present study, three trials were conducted to evaluate the growth performance and
bioavailability of two copper sources - copper sulfate and TBCC for L. vannamei. Two trials
were conducted in two different types of recirculating systems (clear water or green water) using
the same diets to evaluate the effects of different copper sources and levels. The third trial was
designed to determine the shrimp’s response to graded dietary copper levels from TBCC.

80
2. Materials and Methods
2.1. Experimental Design and Diets
In trial 1 and 2, tri-basic copper chloride (Micronutrients, Div. of Heritage Technologies,
LCC, Indianapolis, IN, USA) and copper sulfate pentahydrate (CuSO4·5H2O; Sigma Chemical
Co., St. Louis, MO, USA), were added to a basal diet (containing 10 mg Cu kg–1, mainly from
soybean meal, fish meal, whole wheat, and corn gluten meal) at 6, 12, and 24 mg Cu kg–1 (Table
1). In trial 3, the basal diet was formulated to contain 10 mg Cu kg–1. This diet was then
supplemented with 0, 5, 10, 20, 40, and 60 mg Cu kg–1 from TBCC (Table 2). Therefore, the total
analyzed dietary copper concentrations were 10, 15, 19, 29, 48, and 66 mg Cu kg–1(Table 3).
Research test diets (360 g kg–1 protein, 80 g kg–1 lipid) were prepared in the Aquatic
Animal Nutrition Laboratory at the School of Fisheries, Aquaculture, and Aquatic Sciences,
Auburn University (Auburn, AL, USA) using standard procedures for the laboratory production
of shrimp feeds. Pre-ground dry ingredients and oil were mixed in a food mixer (Hobart
Corporation, Troy, OH, USA) for 10–15 min. Hot water was then blended into the mixture to
obtain a consistency appropriate for pelleting. Diets were pressure-pelleted using a meat grinder
with a 3-mm die, air dried (< 50 °C) to a moisture content of 8–10%. After drying, pellets were
crumbled, packed in sealed plastic bags and stored in a freezer until needed.
Post larval shrimp, L. vannamei, were obtained from Shrimp Improvement Systems
(Islamorada, Florida, USA) and nursed for two weeks in an indoor recirculating system. All trials
were conducted at the Claude Peteet Mariculture Center in Gulf Shores, Alabama, USA.

81
2.2. Growth trial 1 (Clear water system)
Juvenile shrimp were obtained from the nursery system and selected by hand sorting to a
uniform size. Juvenile shrimp (initial mean weight 0.31 ± 0.01 g) were stocked at a density of 15
shrimp per tank into a recirculating system containing 24 square tanks (0.6 x 0.6 x 0.6 m, 216 L
volume). The recirculating system consisted of a biological filter, reservoir, supplemental
aeration and a circulation pump. Make up water was renewed twice per week at a rate of 40% of
the system volume at each exchange.
Six dietary treatments containing increasing level of dietary copper supplements (6, 12
and 24 mg kg–1) from CuSO4 containing 25.45% copper or TBCC containing 58.81% copper
were randomly assigned among 24 tanks with four replications per treatment (Table 1). Test
diets were offered four times daily at 0800, 1000, 1400, and 1600 h for an 8-week period. Feed
inputs were pre-calculated on a weekly basis using an expected feed conversion ratio of 2:1 and a
doubling in size until individual shrimp weighs one gram. Thereafter, a growth rate of 0.8 gram
per week was assumed. Each tank was covered with netting and was continuously aerated with
two air stones. Shrimp were counted every week to adjust feed input based on the mortality. At
the conclusion of the 8-week growth trial, shrimp were counted and group weighed. Final
biomass, final mean weight, FCR and survival were determined.
2.2. Growth trial 2 (Green water system)
The outdoor tank system was a semi-closed recirculating system consisting of a central
reservoir (800 L) with a biological filter, a 0.33 hp sump pump, and 24 circular polyethylene
tanks (0.85 m height x 1.22 m upper diameter, 1.04 m lower diameter). Another sump pump was

82
used to move water from one of the production ponds to the central reservoir at a rate of 8 L min–
1 during the study period between 0800 h and 1400 h to mimic a production pond setting.
Juvenile L. vannamei (initial weight 0.39 ± 0.01 g) were collected from the nursery tank.
Juvenile shrimp were randomly selected and stocked at a density of 40 shrimp m–2. Each tank
and central reservoir was provided with two air stones connected to a 0.5 hp regenerative blower
(Sweetwater Aquaculture Inc., Lapwai, ID, USA) to supply aeration. All tanks were covered by
netting to prevent the shrimp from jumping out.
Shrimps were offered the same six diets as trial 1 four times per day at 0800, 1000, 1400
and 1600 h. Daily feed input was calculated based upon an expected growth of 1.3 g wk–1 and an
estimated FCR of 1.2. At the conclusion of the 6-week growth trial, shrimp were counted and
group-weighed. Final mean weight, final biomass, survival, and FCR were determined.
2.3. Growth trial 3 (clear water system)
Six dietary treatments containing increasing levels of supplemental dietary copper (0, 5,
10, 20, 40 and 60 mg kg–1) from TBCC containing 58.81% copper were randomly assigned
among 24 tanks with four replications per treatment (Table 2). The experimental diets were
conducted in the same recirculating system as the trial 1; therefore, the daily management was
the same as previously described for trial 1.
2.4. Water quality monitoring
In all trials, dissolved oxygen (DO), temperature, pH, and salinity were monitored twice
daily in two of the rearing tanks at 0800h and 1600h using YSI Professional Plus meter (Yellow
Spring Instrument Co., Yellow Spring, OH, USA). Total ammonia nitrogen was measured once

83
weekly. Total ammonia nitrogen was analyzed with an Orion ammonia electrode probe (Thermo
Fisher Scientific Inc., Waltham, MA, USA). Water samples were collected every week and
immediately frozen for subsequent copper analysis. All glassware in this analysis was carefully
washed with 1:1 nitric acid solution and rinsed with deionized water. Copper samples were
filtered through Whatman paper No. 42. Samples were measured by using the Hach Porphyrin
Method (Hach Chemical Company, Loveland, CO, USA) to develop a copper-induced color. The
color was evaluated with an Aquamate 9423 AQA 2000E standard spectrophotometer (Thermo
scientific, England).
2.5. Sample collection and analytical methods
At the conclusion of the growth trial, shrimps were group-weighed per tank. After
weighing, hemolymph samples from all shrimps per tank were collected utilizing 250 µl
capillary tubes to pierce the abdominal segment near carapace. After bleeding, the shrimp and
hemolymph samples were immediately frozen for subsequent mineral analyses. The individual
shrimp were weighed, and then the heart, carapace and hepatopancreas were removed and
weighed. The heart and hepatopancreatic indices [wet organ weight (mg)/ wet shrimp weight (g)]
were determined for 30 shrimp per treatment.
Frozen shrimp were rinsed with deionized water, and then the carapace and
hepatopancreas were dissected from 6–8 shrimp per tank and oven dried at 90 ˚C to a constant
weight. Hepatopancreas, carapace, and hemolymph samples were wet-ashed, and copper was
analyzed by atomic absorption spectrophotometry according to procedures described by
Association of Official Analytical Chemists (AOAC).

84
2.6. Statistical analysis
Statistical analyses were performed using SAS 9.2 (SAS Institute, Cary, NC, USA). Data
from trial 1 and 2 were analyzed using two-way analysis of variance to determine if significant
differences existed among treatment means. The Student-Newman-Keuls multiple comparison
tests were used to identify significant differences between treatments means (Steel and Torrie,
1980). Outliers in copper tissues data were deleted using the method of Leys et al. (2013). Data
from trial 3 were analyzed using one-way ANOVA. All statistical tests were considered
significant at P < 0.05.
Multiple linear regression equations were calculated by least squares using the GLM
procedure of SAS. Relative bioavailability values were determined using copper sulfate as the
standard source by slope ratio comparisons from multiple linear regression (Littell, et al., 1997;
Littell, et al., 1995). Slope ratios and their standard errors were estimated using the method of
error propagation as described by Littell et al. (1995). Tissues copper concentrations exhibited
variance heterogeneity and were subjected to log10 transformation prior to analysis. Differences
among sources were determined by differences in their respective regression coefficients.
3. Results
3.1. Water quality
In trial 1, water quality parameters (mean ± standard deviation) for the following water
quality were observed: temperature, 27.36 ± 1.45°C; pH, 7.86 ± 0.09; salinity, 21.01 ± 1.01 ‰;
DO, 6.28 ± 0.47 mg L–1; and total ammonia nitrogen (TAN), 0.07 ± 0.08 mg L–1. Water quality
parameters for trial 2 were monitored: temperature, 28.09 ± 2.19°C; pH, 8.04 ± 0.15; salinity,
15.51 ± 3.12 ‰; DO, 6.69 ± 0.37 mg L–1; and TAN 0.03 ± 0.02 mg L–1. In trial 3, water quality

85
parameters were observed: temperature 27.40 ± 1.48°C; pH, 7.63 ± 0.10; salinity, 19.00 ± 0.60
‰, and DO, 6.19 ± 0.31 mg L–1 and TAN 0.04 ± 0.02 mg L–1. The copper concentrations of
water samples from all three trials remained below 2 µg L¯1 during the culture period. Water
quality conditions in the trials were suitable for the normal growth and survival of this species.
3.2. Growth performance
In trial 1, final mean weight of the shrimp ranged from 6.75 to 7.42 g, final biomass was
between 98.5 and 102.0 g, percent weight gain ranged from 2033.0 to 2281.1%, FCR varied
from 1.63 to 1.75, and survival ranged between 90.0 and 95.0% (Table 4). In trial 2, final mean
weight of shrimp ranged from 7.87 to 8.45 g, final biomass was between 234.1 and 253.5 g,
percent weight gain ranged from 1944.2 to 2087.1%, FCR varied from 0.97 to 1.05, and survival
ranged between 99.2 and 100.0%. In trial 3, final mean weight of shrimp ranged from 8.47 to
9.08 g, final biomass was between 111.1 and 127.2 g, percent weight gain ranged from 2903.2 to
3127.8%, FCR varied from 1.31 to 1.44, and survival ranged between 86.7 and 100.0% (Table
4). There were no significant differences with regards to the effect of copper level or source on
the shrimp’s final mean weight, final biomass, FCR, and survival in any of the three trials. The
two-way ANOVA indicates that growth performance was not significantly affected by the
sources of copper. In trial 2 there was a slightly significant interaction between the copper source
and dietary level: shrimp fed the diet supplemented with 24 mg kg–1 of copper sulfate (C34) had
significantly higher percent weight gain than shrimp fed the diet supplemented with 12 mg kg–1
of copper sulfate (C22). However, this was not seen in the shrimps fed TBCC supplemented
feeds. In trial 3, there was a positive correlation between percent weight gain and increasing
copper supplementation with TBCC.

86
3.3. Tissue Copper Concentration
Dietary copper levels influenced tissues copper concentrations (Table 5). In trial 1, no
significant difference occurred in carapace copper concentrations for either source of copper.
The hepatopancreas and hemolymph copper concentrations in treatment with copper sulfate
(C34) were significantly higher than the treatment C22. The same diets were utilized in both
clear water tanks (Trial 1) and green water tanks (Trial 2). The results for hepatopancreas copper
concentrations in both trials were very similar. In trial 2, the carapace copper concentrations of
shrimp offered diets with copper sulfate (C34) had significantly higher levels than other
treatments. In trial 2, the hemolymph copper concentrations were not significantly different
among treatments utilizing either copper sulfate or TBCC. However, copper levels of the
hemolymph from shrimp reared on diets with copper sulfate were significantly higher than those
reared on TBCC. In trials 1 and 2, when the data were pooled across supplemental levels, the
tissues’ copper concentrations of the carapace, hepatopancreas and hemolymph for shrimp reared
on TBCC were significantly lower than those of shrimp reared on diets with copper sulfate (Fig.
1.). In trial 3, the copper content of analyzed tissues (carapace, hepatopancreas and hemolymph)
generally increased with supplementation (Table 5). The carapace copper concentrations of
shrimp maintained on diets T50 and T70 were significant higher than that of shrimp reared on
T20. The copper concentration of the hepatopancreas of shrimp reared on diets T50 and T70
were significantly higher than that of shrimp reared on the other treatments. The hemolymph
copper concentrations of shrimp maintained on T30, T50, and T70 diets were significantly
higher than other treatments.

87
Dietary copper sources and levels on copper concentrations of heart index and
hepatopancreas index (Table 5). In trial 1, no significant difference occurred in heart index for
either source of copper. Heart index ranged from 1.68 to 1.89 for shrimp fed diets containing 21
mg total analyzed Cu kg¯1 diet to 45 mg total analyzed Cu kg¯1 diet. There was significantly
difference in hepatopancreas index between copper sources. Hepatopancreas index ranged from
50.1 for shrimp fed the diet containing 28 mg total analyzed Cu kg¯1 diet from copper sulfate to
57.4 for shrimp fed the diet containing 27 mg total analyzed Cu kg¯1 from TBCC.
3.4 Estimate relative bioavailability of copper sources
Regression equations of log10 transformed tissues copper concentration on analyzed
copper intake are presented in Table 6. Linear regression of carapace, hepatopancreas and
hemolymph copper concentration on analyzed copper levels indicated that TBCC and copper
sulfate had similar bioavailabilities. When the response to copper sulfate was set at 100.0%, in
trial 1 relative bioavailability values (RBV) of TBCC were 85.8%, 77.8% and 93.0%. In trial 2
relative bioavailability values (RBV) of TBCC were 86.1%, 78.2% and 90.8%, based on
carapace, hepatopancreas and hemolymph, respectively.
4. Discussion
The dietary essentiality of copper has been reported for fresh water species such as
Atlantic salmon (Salmo salar), common carp (Cyprinus carpio), tilapia (Oreochromis spp.),
channel catfish (Ictalurus punctatus), yellow catfish (Pelteobagrus fulvidraco), rainbow trout
(Oncorhynchus mykiss), grass carp (Ctenopharyngodon idella), blunt snout bream
(Megalobrama amblycephala) and marine species such as grouper (Epinephelus spp.), tiger

88
shrimp (P. monodon), fleshy prawn (F. chinensis), Pacific white shrimp (L. vannamei) using the
traditional copper source – copper sulfate (NRC, 2011; Shao et al., 2012; Tan et al., 2011; Tang
et al., 2013). Tri-basic copper chloride as a potential copper source used in the commercial feed
industry should be studied for bioavailability as well as safety. There are no studies with shrimp
that have compared or demonstrated difference in availability from TBCC or copper sulfate.
However, there are studies that demonstrate it to be a more bioavailable source than copper
sulfate in pigs (Cromwell et al., 1998), broilers (Luo et al., 2005), steers (Spears et al., 2004) and
crucian carp (Shao et al., 2010).
Unlike terrestrial animals, aquatic animals may be able to utilize, to some extent, mineral
dissolved in the water to meet physiological requirements (Davis and Gatlin, 1996). Several
studies demonstrated that water-borne copper could influence growth, survival, and tissues of
shrimp (Djangmah and Grove, 1970; Frías-Espericueta et al., 2008; Li et al., 2005, 2007; Manyin
and Rowe, 2009). As anthropogenic inputs of copper can influence environmental levels and
consequently copper intake, it is important to evaluate levels in the rearing water. In the present
study, the copper concentrations in the brackish water used in the three trials remained below 2
µg L¯1 and mostly below detection levels during the culture period. These values were similar to
Fabricand et al. (1962) who reported 2.2 µg L¯1 of total copper in all sampled areas of the
Atlantic and Pacific Ocean. Slowey and Hood (1971) documented that copper concentration in
Gulf of Mexico waters range from 0.12 to 4.9 µg L¯1 in the depth range from 10 to 300 m. The
water copper concentration in this study was low (< 2 µg L¯1), while the system exchanged water
at a rate of approximately 80% of total volume per week. Therefore, the problem associated with
the potential contribution of mineral from the water should be negligible.

89
Across all three trials, the growth performance of L. vannamei was not significantly
affected by dietary copper level or source. A limited response in terms of growth was also
observed in rainbow trout (Knox et al., 1982, 1984), channel catfish (Gatlin and Wilson, 1986),
and abalone (Ogino and Yang, 1980; Wang, et al., 2009). Davis et al. (1993) reported that weight
gain of Pacific white shrimp increased in response to copper supplementation up to 32 mg Cu
kg¯1 (34 mg total Cu kg¯1 diet). In the present study, the percent weight gain of shrimp did not
increase with copper supplementation from copper sulfate in trial 1 and trial 2. However, there
was a general increase in percent weight gain in shrimp offered diets with increasing copper
supplementation from TBCC in trials 2 and trial 3. Interestingly, in other studies with L.
vannamei, Davis et al. (1993) did not document any significant differences for weight gain
among treatments from 18 mg total calculated Cu kg¯1 diet to 66 mg total calculated Cu kg¯1 diet
from copper sulfate. Bharadwaj et al. (2014) reported no significant difference for final mean
weight and growth rate per week after observing the treatment of 9 mg total analyzed Cu kg¯1
diet to 135 mg total analyzed Cu kg¯1 diet from copper sulfate. The results within our research
trials are in agreement with Davis et al. (1993) and Bharadwaj et al. (2014), as there was no
significant difference for shrimp growth performance from the treatment 24 mg total analyzed
Cu kg¯1 to 42 total analyzed Cu kg¯1 diet from copper sulfate in trial 1 and trial 2.
A comparison of the growth data of trial 1 and trial 2 (Table 4) indicated that the shrimp
growth performance in trial 2 (green water system, 6-week) was much better than in trial 1 (clear
water system, 8-week) using the same diets with the same source of shrimp with similar initial
weight (0.32 g in trial 1 vs 0.39 g in trial 2) and temperature. Shrimp often grow faster and
survive well in the green water system due to the presence of natural foods such as algae. Based
on the growth results in both trials 1 and 2 (Table 4), the shrimp growth performances from diets

90
with copper sulfate were similar to those of shrimp maintained on diets with TBCC either in
clear water system or green water system. Similarly, trials 1 and 3 can be compared as they were
also conducted on equivalent conditions. In this case, shrimp in trial 3 exhibited higher final
biomass, final mean weight, percent weight gain and lower FCR than shrimp in trial 1. These
results indicate that TBCC is an effective copper source as compared to copper sulfate for L.
vannamei.
Bharadwaj et al. (2014) conducted a similar study with L. vannamei in which graded
levels of dietary copper from copper sulfate (9–430 mg total analyzed Cu kg–1) or chelated
copper (30–96 mg total analyzed Cu kg–1) were evaluated in a semi-purified diet. Juvenile
shrimp (initial weight 0.39 g) were reared at 29.5 ± 0.3 °C with a reported weight gain from
8.36–9.74 g and percent weight gain at 2143.2–2494.9% fed by dietary copper from copper
sulfate or chelated sources. These results were slightly higher than the results in trial 2 (initial
weight 0.39 g, Temp 28.09 ± 2.19 °C) with gained shrimp weight at 7.87–8.45 g and weight gain
at 1944–2087% from copper sulfate or TBCC for the same culture period (6-week). The slight
difference in growth performance might be influenced by the temperature, as the temperature in
the study by Bharadwaj et al. (2014) was higher than the temperature in the present study with
similar levels of protein (35%–36%) and 8% lipid. However, these growth results from L.
vannamei appear to be greater than those reported for P. monodon (Lee and Shiau 2002). Lee
and Shiau (2002) reported that grass shrimp P. monodon (initial weight 0.29 g, Temp 26–28 °C)
exhibited low percent weight gain of 65.8–207.5% over an 8-week period when fed purified diets
with seven copper levels from copper sulfate (0.92–152.80 total analyzed mg Cu kg¯1 diet).
Therefore, the high growth response of L. vannamei might better represent current commercial
growth rates of genetically improved stocks of this species.

91
To quantify mineral requirements in shrimp or fish, growth may not be a good or
sufficient indicator of nutrient status; in such cases, the element analyses of tissues should be
followed (Baker, 1986; Cowey, 1992; Davis and Gatlin, 1996). Several studies demonstrated that
the carapace, hepatopancreas, and hemolymph of crustacean were a significant portion of the
body burden of copper (Davis et al., 1993; Depledge, 1989; Icely and Nott, 1980; Johnston and
Barber, 1969; White and Rainbow, 1985). In other studies with cattle (Nockels et al., 1993),
ewes (Hatfield et al., 2001; Pal et al., 2010), pigs (Apgar et al., 1995), rats (Du et al., 1996),
steers (Spear et al., 2004), and rainbow trout (Apines-Amar et al., 2004), tissue concentrations of
copper were higher or similar for organic compared to inorganic sources. The cellular processes
for isolating copper from general circulation in the hepatopancreas begin isare only beginning to
be understood. Very little is currently known about the roles of other tissues such as gill, kidney,
intestine, and integument for copper regulation (Ahearn et al., 2004). However, Spears et al.
(2004) documented that TBCC and copper sulfate were similar in their ability to increase copper
status in copper-depleted steers fed a diet low in molybdenum.
In trials 1 and 2, it is interesting to note that when the selected tissues (carapace,
hepatopancreas and hemolymph) concentrations are pooled across dietary levels for each copper
source, copper levels of the tissues from shrimp fed TBCC were significantly lower than those of
shrimp fed diets supplemented with copper sulfate (Fig. 1). This result is similar to Zhang et al.
(2009), who reported that smaller quantities of copper levels in liver were gained using TBCC
compared to feeding with copper sulfate for broilers. Meanwhile, Miles et al. (1998) reported
that copper sulfate had a greater percentage of larger particles than TBCC and TBCC had a better
uniformity of particle size. For this reason, shrimp might have better copper absorption of TBCC
than copper sulfate.

92
In trial 3, the carapace, hemolymph, and hepatopancreas copper contents increased with
dietary TBCC levels, suggesting that TBCC also could accumulate excess copper in tissues as
well as copper sulfate. This trend was also reported by Davis et al. (1993), albeit hepatopancreas
copper concentrations were much higher than those seen in L. vannamei. Hepatopancreas copper
contents in trial 3 were 16.4–33.0 µg g¯1 in shrimp fed with 10–66 total analyzed mg Cu kg¯1 diet
from TBCC. This amount was lower than found by Davis et al (1993) who reported that 30.1–
170.0 µg g¯1 fed with 2–130 total calculated mg Cu kg¯1 diet from copper sulfate. This might
indicate that metabolism of the two forms of Cu are different. This species has less copper
accumulation in the tissues from TBCC as compared to copper sulfate.
The term “bioavailability” is defined as the degree to which an ingested nutrient in a
particular source is absorbed in a form that can be utilized in metabolism by the animal
(Ammerman, et al., 1995). In the present study, it indicated that the tissues value of relative
bioavailability for TBCC was lower than copper sulfate. This result is not consistent with other
studies (Luo, et al., 2005; Miles, et al., 1998; Shao, et al., 2010). Shao et al. (2010) determined
the relative bioavailability values of TBCC were 118%, 131% and 173% relative to copper
sulfate (100%) for crucian carp, C. auratus gibelio. Miles et al. (1998) obtained a value of 106%
for TBCC compared to 100% copper sulfate based on liver copper concentration of chicks. Luo
et al. (2005) showed that the linear regression of log10 transformed liver copper concentration on
added total copper intake resulted in the slope ratio estimate of 109.0%, 108.4% and 106.9%
respectively, for bioavailability of copper from TBCC compared with 100 for that in copper
sulfate. However, it should be kept in mind that bioavailability is not an inherent characteristic of
a specific source of any mineral element (Fairweather-Tait, 1987). It is an experimentally
determined value that is dependent on conditions during a specific test situation. Therefore, there

93
is no single correct value to assign to any particular source of an element, although this is a
common perception among researchers and the feed industry (Cao, et al., 2000).
In conclusion, the growth performance results demonstrated that TBCC was available as
a copper source as well as copper sulfate to shrimp from diets. Analysis of the tissues showed
that TBCC resulted in lower levels of accumulation of copper in the tested tissues. The study
showed that TBCC was a safe, effective and available source of copper in the Pacific white
shrimp L. vannamei.
References
Ahearn, G.A., Mandal, P.K., Mandal, A., 2004. Mechanisms of heavy-metal sequestration and
detoxification in crustaceans: a review. J. Comp. Physiol. 174B, 439–452.
Ammerman, C.B., Baker, D.P., Lewis, A.J., 1995. Bioavailability of nutrients for animals:
Amino acids, minerals, vitamins. Academic Press.
Apgar, G.A., Kornegay, E.T., Lindemann, M.D., Notter, D.R., 1995. Evaluation of copper
sulfate and a copper lysine complex as growth promoters for weanling swine. J. Anim.
Sci. 73, 2640–2646.
Apines-Amar, M.J.S., Satoh, S., Caipang, C.M.A., Kiron, V., Watanabe, T., Aoki, T., 2004.
Amino acid chelates: a better source of Zn, Mn and Cu for rainbow trout Oncorhynchus
mykiss. Aquaculture 240, 345–358.
Arias, V.J., Koutsos, E.A., 2006. Effects of copper source and level on intestinal physiology and
growth of broiler chickens. Poult. Sci. 85, 999–1007.
Association of Official Analytical chemists (AOAC), 1984. Official Methods of Analysis,
Association of Official Analytical chemists, Arlington, Virginia, USA.

94
Baker, D.H., 1986. Problems and pitfalls in animal experiments designed to establish dietary
requirements for essential nutrients. J. Nutr. 116, 2339–2349.
Bharadwaj, A.S., Patnaik, S., Browdy, C.L., Lawrence, A.L., 2014. Comparative evaluation of
an inorganic and a commercial chelated copper source in Pacific white shrimp
Litopenaeus vannamei (Boone) fed diets containing phytic acid. Aquaculture 422, 63–68.
Burgess, J.E., Quarmby J., Stephenson T., 1999. Role of micronutrients in activated sludge-
based biotreatment of industrial effluents. Biotechnol. Adv. 17, 49–70.
Cao, J., Henry, P., Guo, R., Holwerda, R., Toth, J., Littell, R., Miles, R., Ammerman, C., 2000.
Chemical characteristics and relative bioavailability of supplemental organic zinc sources
for poultry and ruminants. J. Anim. Sci. 78, 2039-2054.
Cervantes, C., Gutiérrez-Corona, F., 1994. Copper resistance mechanisms in bacteria and fungi.
FEMS Microbiol. Rev. 14, 121–138.
Cheng, J., Fan, C., Zhang, W., Zhu, X., Yan, X., Wang, R., Jia, Z., 2008. Effects of dietary
copper source and level on performance, carcass characteristics and lipid metabolism in
lambs. Asian-Aust. J. Anim. Sci. 21, 685–691.
Cowey, C.B., 1992. Nutrition: estimating requirements of rainbow trout. Aquaculture 100, 177–
189.
Cromwell, G.L., Lindemann, M.D., Monegue, H.J., Hall, D.D., Orr, D.E., 1998. Tribasic copper
chloride and copper sulfate as copper sources for weanling pigs. J. Anim. Sci. 76, 118–
123.
Davis, D.A., Gatlin III., D.M., 1996. Dietary mineral requirements of fish and marine
crustaceans. Rev. Fish. 4, 75–99.

95
Davis, D.A., Lawrence, A.L., Gatlin III, D.M., 1993. Dietary copper requirement of Penaeus
vannamei. Nippon Suisan Gakkaishi 59, 117–122.
Depledge, M.H., 1989. Re-evaluation of metabolic requirements for copper and zinc in decapod
crustaceans. Mar. Environ. Res. 27, 115–126.
Djangmah, J.S., Grove, D.J, 1970. Blood and hepatopancreas copper in Crangon vulgaris
(Fabricus). Comp. Biochem. Physiol. 32, 733–742.
Du, Z., Hemken, R.W., Jackson, J.A., Trammell, D.S., 1996. Utilization of copper in copper
proteinate, copper lysine, and cupric sulfate using the rat as an experimental model. J.
Anim. Sci. 74, 1657–1663.
Fabricand, B.P., Sawyer, R.R., Ungar, S.G., Adler, S., 1962. Trace metal concentrations in the
ocean by atomic absorption spectroscopy. Geochim. Cosmochim. Acta. 26, 1023–1027.
Fairweather-Tait, S.J., 1987. The concept of bioavailability as it relates to iron nutrition. Nutr.
Res. 7, 319-325.
Frías-Espericueta, M.G., Castro-Longoria, R., Barrón-Gallardo, G.J., Osuna-López, J.I., Abad-
Rosales, S.M., Páez-Osuna, F., Voltolina, D., 2008. Histological changes and survival of
Litopenaeus vannamei juveniles with different copper concentrations. Aquaculture 278,
97–100.
Gatlin III, D. M., Wilson, R.P., 1986. Dietary copper requirement of fingerling channel catfish.
Aquaculture 54, 277–285.
Hart, E.B., Steenbock, H., Waddell, J., Elvehjem, C.A., 1928. Iron in nutrition VII. Copper as a
supplement to iron for hemoglobin building in the rat. J. Biol. Chem. 77, 797–812.

96
Hatfield, P.G., Swenson, C.K., Kott, R.W., Ansotegui, R.P., Roth, N.J., Robinson, B. L., 2001.
Zinc and copper status in ewes supplemented with sulfate- and amino acid-complexed
forms of zinc and copper. J. Anim. Sci. 79, 261–266.
Icely, J.D., Nott, J.A., 1980. Accumulation of copper within the “hepatopancreatic” caeca of
Corophium volutator (Crustacea: Amphipoda). Mar. Biol. 57, 193–199.
Johnston, W., Barber, A.A., 1969. Reconstitution of functional hemocyanin from
apohemocyanin: the hepatopancreas as copper donor. Comp. Biochem. Physiol. 28,
1259–1273.
Kegley, E.B., Spears, J.W., 1994. Bioavailability of feed-grade copper sources (oxide, sulfate, or
lysine) in growing cattle. J. Anim. Sci. 72, 2728–2734.
Knox, D., Cowey, C.B., Adron, J.W., 1982. Effects of dietary copper and copper: Zinc ratio on
rainbow trout Salmo gairdneri . Aquaculture 27, 111–119.
Knox, D., Cowey, C.B., Adron, J.W., 1984. Effects of dietary zinc intake upon copper
metabolism in rainbow trout Salmo gairdneri. Aquaculture 40, 199–207.
Lall, S.P., 2002. The minerals. In: Halver, J.E., Hardy, R.W. (Eds.), Fish nutrition. Academic
Press, San Diego, pp. 260–301.
Lee, M.-H., Shiau, S.-Y., 2002. Dietary copper requirement of juvenile grass shrimp, Penaeus
monodon, and effects on non-specific immune responses. Fish Shellfish Immunol. 13,
259–270.
Leys, C., Ley, C., Klein, O., Bernard, P., Licata, L., 2013. Detecting outliers: Do not use
standard deviation around the mean, use absolute deviation around the median. J. Exp.
Soc. Psychol. 49, 764–766.

97
Li, N., Zhao, Y., Yang, J., 2007. Impact of waterborne copper on the structure of gills and
hepatopancreas and its impact on the content of metallothionein in juvenile giant
freshwater prawn Macrobrachium rosenbergii (Crustacea: Decapoda). Arch. Environ.
Contam. Toxicol. 52, 73–79.
Li, N., Zhao, Y.L., Yang, J., 2005. Accumulation, distribution, and toxicology of copper sulfate
in juvenile giant freshwater prawns, Macrobrachium rosenbergii. Bull. Environ. Contam.
Toxicol. 75, 497–504.
Littell, R., Henry, P., Lewis, A., Ammerman, C., 1997. Estimation of relative bioavailability of
nutrients using SAS procedures. J. Anim. Sci. 75, 2672-2683.
Littell, R.C., Lewis, A.J., Henry, P.R., Ammerman, C.B., Baker, D.H., 1995. Statistical
evaluation of bioavailability assays. In: Ammerman, C.B. (Ed.), Bioavailability of
nutrients for animals: amino acids, minerals, and vitamins. Academic Press, San Diego,
CA, pp. 5-35.
Lin, Y.H., Shie, Y.Y., Shiau, S.Y., 2008. Dietary copper requirements of juvenile grouper,
Epinephelus malabaricus. Aquaculture 274, 161–165.
Lorentzen, M., Maage, A., Julshamn, K., 1998. Supplementing copper to a fish meal based diet
fed to Atlantic salmon parr affects liver copper and selenium concentrations. Aquacult.
Nutr. 4, 67–77.
Lovell, T., 1989. Nutrition and Feeding of Fish. Van Nostrand Reinhold, New York.
Luo, X.G., Ji, F., Lin, Y.X., Steward, F.A., Lu, L., Liu, B., Yu, S. X., 2005. Effects of dietary
supplementation with copper sulfate or tribasic copper chloride on broiler performance,
relative copper bioavailability, and oxidation stability of vitamin E in feed. Poult. Sci. 84,
888–893.

98
Manyin, T., Rowe, C.L., 2009. Bioenergetic effects of aqueous copper and cadmium on the grass
shrimp, Palaemonetes pugio. Comp. Biochem. Physiol. 150C, 65–71.
Miles, R.D., O'keefe, S.F., Henry, P.R., Ammerman, C.B., Luo, X.G., 1998. The effect of dietary
supplementation with copper sulfate or tribasic copper chloride on broiler performance,
relative copper bioavailability, and dietary prooxidant activity. Poult. Sci. 77, 416–425.
National Research Council (NRC), 2011. Nutrient Requirements of Fish and Shrimp. National
Academies Press, Washington, DC, pp. 172–173.
Nockels, C.F., DeBonis, J., Torrent, J., 1993. Stress induction affects copper and zinc balance in
calves fed organic and inorganic copper and zinc sources. J. Anim. Sci. 71, 2539–2545.
O'Dell, B.L., 1976. Biochemistry of copper. Symposium on trace elements. Med. Clin. N. Am.
60, 697–703.
Ogino, C., Yang, G.Y., 1980. Requirements of carp and rainbow trout for dietary manganese and
copper. Bull. Jap. Soc. Sci. Fish. 46, 455–458.
Pal, D.T., Gowda, N.K.S., Prasad, C.S., Amarnath, R., Bharadwaj, U., Suresh Babu, G.,
Sampath, K.T., 2010. Effect of copper-and zinc-methionine supplementation on
bioavailability, mineral status and tissue concentrations of copper and zinc in ewes. J.
Trace Elem. Med. Biol. 24, 89–94.
Rao, M.S., Anjaneyulu, N., 2008. Effect of copper sulfate on molt and reproduction in shrimp
Litopenaeus vannamei. Int. J. Biol. Chem. 2, 35–41.
Rao, M.S., Rajitha, B., Pavitra, E., Anjaneyulu, N., 2008. Changes of copper and protein profiles
in hepatopancreas and hemolymph tissues during different molt stages of white shrimp,
Litopenaeus vannamei (Boone, 1931). Biotechnology 7, 153–156.

99
Shao, X., Liu, W., Xu, W., Lu, K., Xia, W., Jiang, Y., 2010. Effects of dietary copper sources
and levels on performance, copper status, plasma antioxidant activities and relative
copper bioavailability in Carassius auratus gibelio. Aquaculture 308, 60–65.
Shao, X.P., Liu, W.B., Lu, K.L., Xu, W.N., Zhang, W.W., Wang, Y., Zhu, J., 2012. Effects of
tribasic copper chloride on growth, copper status, antioxidant activities, immune
responses and intestinal microflora of blunt snout bream Megalobrama amblycephala fed
practical diets. Aquaculture 338, 154–159.
Shiau, S.-Y., Bai, S.-C., 2009. Micronutrients in shrimp diets. In: Browdy, C.L., Jory, D.E.
(Eds.), The Rising Tide, Proceedings of the Special Session on Sustainable Shrimp
Farming, World Aquaculture 2009. The World Aquaculture Society, Baton Rouge,
Louisiana, USA.
Slowey, J.F., Hood, D.W., 1971. Copper, manganese and zinc concentrations in Gulf of Mexico
waters. Geochim. Cosmochim. Acta. 35, 121–138.
Spears, J.W., Kegley, E.B., Mullis, L.A., 2004. Bioavailability of copper from tribasic copper
chloride and copper sulfate in growing cattle. Anim. Feed Sci. Technol. 116, 1c13.
Steel, R.G., Torrie, J.H., 1980. Principles and Procedures of Statistics: A Biometrical Approach,
2nd edition. McGraw-Hill, New York, USA.
Syed, M.A., Coombs, T.L., 1982. Copper metabolism in the plaice Pleuronectes platessa (L.). J.
Exp. Mar. Biol. Ecol. 63, 281–296.
Tan, X.Y., Luo, Z., Liu, X., Xie, C.X., 2011. Dietary copper requirement of juvenile yellow
catfish Pelteobagrus fulvidraco. Aquac. Nutr. 17, 170–176.
Tang, Q.Q., Feng, L., Jiang, W.D., Liu, Y., Jiang, J., Li, S.H., Kuang S.Y., Zhou, X.Q., 2013.
Effects of Dietary Copper on Growth, Digestive, and Brush Border Enzyme Activities

100
and Antioxidant Defense of Hepatopancreas and Intestine for Young Grass Carp
(Ctenopharyngodon idella). Biol. Trace. Elem. Res. 155, 370–380.
Underwood, E.J., Suttle, N.F., 1999. The Mineral Nutrition of Livestock. CABI Publishing,
Wallingford, UK.
Wang, W., Mai, K., Zhang, W., Ai, Q., Yao, C., Li, H., Liufu, Z., 2009. Effects of dietary copper
on survival, growth and immune response of juvenile abalone, Haliotis discus hannai
Ino. Aquaculture 297, 122–127.
Wang, W., Wang, A., Liu, C., Wang, S., Wang, R., Ma, Z., 1997. Effects of copper
concentrations in diets on the growth and copper, zinc and iron contents of Penaeus
chinensis. J. Fish. China. 21, 259–262.
Watanabe, T., Kiron, V., Satoh. S., 1997. Trace minerals in fish nutrition. Aquaculture 151, 185–
207.
White, S., Rainbow, R., 1985. On the metabolic requirements for copper and zinc in mollusk and
crustacean. Mar. Environ. Res. 16, 215–229.
Zhang, X.Q., Zhang, K.Y., Ding, X.M., Bai, S.P., 2009. Effects of dietary supplementation with
copper sulfate or tribasic copper chloride on carcass characteristics, tissular nutrients
deposition and oxidation in broilers. Pakistan J. Nutr. 8, 1114–1119.

101
Table 1 Composition of six practical diets formulated with increasing percentages of dietary copper 5, 10 and 20 mg kg–1 from CuSO4 containing 254.5 g kg–1 copper or TBCC containing 588.1 g kg–1 copper. The diets were formulated to be isonitrogenous at 360 g kg–1 protein and 80 g kg–1 lipid Ingredients (As is basis g kg–1) C16 C22 C34 T16 T22 T34
Fish meal1 50.0 50.0 50.0 50.0 50.0 50.0
Soybean meal2 483.5 483.5 483.5 483.5 483.5 483.5
Menhaden Fish Oil1 57.9 57.9 57.9 57.9 57.9 57.9
Corn Starch3 36.0 36.0 36.0 36.0 36.0 36.0
Whole wheat4 250.1 250.1 250.1 250.1 250.1 250.1
Mineral premix Cu-free5 5.0 5.0 5.0 5.0 5.0 5.0
Vitamin premix6 18.0 18.0 18.0 18.0 18.0 18.0
Choline chloride4 2.0 2.0 2.0 2.0 2.0 2.0
Stay C7 1.0 1.0 1.0 1.0 1.0 1.0
CaP-diebasic8 25.0 25.0 25.0 25.0 25.0 25.0
Lecithin9 10.0 10.0 10.0 10.0 10.0 10.0
Cholesterol10 0.5 0.5 0.5 0.5 0.5 0.5
Empyreal 75 CGM11 60.0 60.0 60.0 60.0 60.0 60.0
Cellulose12 0.976 0.952 0.905 0.990 0.980 0.959
CuSO4·5H2O 0.024 0.048 0.095
TBCC 0.010 0.020 0.041
Proximate composition
Crude protein
Moisture
368.3
80.1
358.9
91.9
359.7
86.8
365.6
74.2
359.4
90.6
357.2
92.4
Lipid 84.8 81.4 82.9 85.0 83.2 83.4
Ash 72.1 70.7 70.3 71.6 71.2 70.7 1 Omega Protein Inc., Reedville, VA, USA. 2 Faithway Feed Co., Guntersville, AL, USA. 3 Grain Processing Corporation, Muscatine, IA, USA. 4 MP Biochemicals Inc., Solon, OH, USA.

102
5 Trace mineral premix Cu free (g kg-1): cobalt chloride 0.04, ferrous sulfate 40.0, magnesium sulfate heptahydrate 283.98, manganous sulphate monohydrate 6.50, potassium iodide 0.67, sodium selenite 0.10, zinc sulfate heptahydrate 131.93, filler 534.28. 6 Vitamin premix (g kg-1): thiamin HCl 0.5, riboflavin 3.0, pyridoxine HCl 1.0, DL Ca-pantothenate 5.0, nicotinic acid 5.0. 7 Stay C®, (L-ascorbyl-2-polyphosphate 35%), Roche Vitamins Inc., Parsippany, NJ, USA. 8 Fisher Scientific, Fair Lawn, NJ, USA. 9 Solae Company, St. Louis, MO, USA. 10 USB Biochemicals, Cleveland, OH, USA. 11Cargill Corn Milling, Cargill, Inc., Blair, NE, USA 12 Sigma Chemical Co., St. Louis, MO, USA

103
Table 2 Composition of six practical diets formulated with different dietary copper level (0, 5, 10, 20, 40 and 60 mg kg–1) from TBCC containing 588.1 g kg–1 copper. The diets were formulated to be isonitrogenous at 360 g kg–1 protein and 80 g kg–1 lipid. Ingredients (As is basis) T10 T15 T20 T30 T50 T70 Fish Meal1 45.0 45.0 45.0 45.0 45.0 45.0 Soybean meal2 495.5 495.5 495.5 495.5 495.5 495.5 Menhaden Fish Oil1 58.4 58.4 58.4 58.4 58.4 58.4 Corn Starch3 32.0 32.0 32.0 32.0 32.0 32.0 Whole wheat4 250.1 250.1 250.1 250.1 250.1 250.1 Trace Mineral premix Cu-free5 5.0 5.0 5.0 5.0 5.0 5.0 Vitamin premix6 18.0 18.0 18.0 18.0 18.0 18.0 Choline cloride4 2.0 2.0 2.0 2.0 2.0 2.0 Stay C7 1.0 1.0 1.0 1.0 1.0 1.0 CaP-diebasic8 25.0 25.0 25.0 25.0 25.0 25.0 Lecethin9 10.0 10.0 10.0 10.0 10.0 10.0 Cholesterol10 0.5 0.5 0.5 0.5 0.5 0.5 Empyreal 75 CGM11 56.5 56.5 56.5 56.5 56.5 56.5 Cellulose12 1.000 0.992 0.983 0.966 0.932 0.898 TBCC 0.000 0.009 0.017 0.034 0.068 0.102 Proximate composition (g kg–1) Crude protein Moisture
356.0 65.7
340.0 78.9
339.0 73.3
361.0 78.0
354.0 76.2
357.0 68.6
Lipid 91.7 86.9 86.2 85.3 86.1 89.2 Ash 70.2 69.8 71.9 67.4 70.0 68.2 1 Omega Protein Inc., Reedville, VA, USA. 2 Faithway Feed Co., Guntersville, AL, USA. 3 Grain Processing Corporation, Muscatine, IA, USA. 4 MP Biochemicals Inc., Solon, OH, USA. 5 Trace mineral premix Cu free (g kg–1): cobalt chloride 0.04, ferrous sulfate 40.0, magnesium sulfate heptahydrate 283.98, manganous sulphate monohydrate 6.50, potassium iodide 0.67, sodium selenite 0.10, zinc sulfate heptahydrate 131.93, filler 534.28. 6 Vitamin premix (g kg–1): thiamin HCl 0.5, riboflavin 3.0, pyridoxine HCl 1.0, DL Ca-pantothenate 5.0, nicotinic acid 5.0. 7 Stay C®, (L-ascorbyl-2-polyphosphate 35%), Roche Vitamins Inc., Parsippany, NJ, USA. 8 Fisher Scientific, Fair Lawn, NJ, USA. 9 Solae Company, St. Louis, MO, USA. 10 USB Biochemicals, Cleveland, OH, USA.

104
11Cargill Corn Milling, Cargill, Inc., Blair, NE, USA. 12 Sigma Chemical Co., St. Louis, MO, USA.

105
Table 3 The treatments in three trials used to evaluate the efficacy of different sources of copper in Pacific white shrimp Litopenaeus vannamei. Copper Source Trial Diet Supplemental
Cu (mg kg–1) Dietary Cu (mg kg–1)1
Analyzed Cu (mg kg–1)2
Copper Sulfate (CuSO4·5 H2O)
1& 2 C16 6 16 24 1& 2 C22 12 22 28 1& 2 C34 24 34 42
Tribasic Copper Chloride (TBCC) TBCC
1& 2 T16 6 16 21 1& 2 T22 12 22 27 1& 2 T34 24 34 45
3 T10 0 10 10 3 T15 5 15 15 3 T20 10 20 19 3 T30 20 30 29 3 T50 40 50 48 3 T70 60 70 66
1 The dietary copper concentrations containing either copper source were calculated in the diet formulation. 2 The diets containing the level of either copper source were analyzed for copper.

106
Table 4 Effect of dietary copper sources and levels on performance of Litopenaeus vannamei.
Trial Diet Analyzed Cu
Final Biomass
Final Weight
Weight Gain
FCR2 Survival
(mg kg–1) (g) (g) (%)1 (%) Trial 1 C16 24 101.8 7.12 2181.5 1.69 95.0 C22 28 102.0 7.42 2281.1 1.63 90.0 C34 42 91.2 6.75 2033.0 1.70 90.0 T16 21 98.5 6.93 2053.4 1.75 95.0 T22 27 100.4 7.17 2206.3 1.69 93.3 T34 45 101.2 6.99 2142.1 1.73 95.0 PSE3 10.54 0.09 34.78 0.02 1.44 Two-way
ANOVA
Model 0.6977 0.4521 0.3373 0.4969 0.7845 Source 0.7030 0.7169 0.6582 0.6601 0.3484 Level 0.6133 0.2059 0.1789 0.2441 0.6242 Source ×
Level 0.4116 0.5214 0.3645 0.5358 0.7740
Trial 2 C16 24 253.5 8.45 2087.1ab 0.97 100.0 C22 28 234.1 7.87 1944.2b 1.05 99.2 C34 42 249.3 8.38 2084.4a 0.98 99.2 T16 21 243.6 8.12 1957.6ab 1.01 100.0 T22 27 243.0 8.16 2018.6ab 1.01 99.2 T34 45 246.8 8.30 2056.6ab 0.99 99.2 PSE3 8.91 0.01 13.48 0.01 0.28 Two-way
ANOVA
Model 0.0991 0.0661 0.0215 0.1408 0.8424 Source 0.7555 0.7321 0.3226 1.0000 1.0000 Level 0.0650 0.0561 0.0488 0.0392 0.3874 Source ×
Level 0.1327 0.0817 0.0229 0.4241 1.0000
Trial 3 T10 10 123.0 8.47 2903.2 1.41 96.7 T15 15 127.2 8.48 2906.3 1.44 100.0 T20 19 120.2 8.70 2960.1 1.31 91.7 T30 29 111.1 8.54 2954.8 1.40 86.7 T50 48 124.7 8.77 3002.6 1.36 95.0 T70 66 121.4 9.08 3127.8 1.32 90.0 PSE3 2.56 0.11 49.09 0.01 1.74 P-value 0.5694 0.6104 0.7879 0.6524 0.3130

107
Values are means of four replicates. Means within columns with the same letter are not significant different (P > 0.05) based on analysis of variance followed by Student Newman-Keuls multiple range test. 1 Weight gain (%) = (Final weight – Initial weight)/Initial weight × 100%. 2 Feed conversion ratio (FCR) = Feed intake/(Final weight – Initial weight). 3 Pooled Standard Error.

108
Table 5 Effects of dietary copper sources and levels on copper concentrations of carapace, hepatopancreas, hemolymph, heart index and hepatopancreas index in Litopenaeus vannamei. Trial Diet Analyzed
Cu (mg kg–1)
Carapace (µg g¯1)
Hepatopancreas (µg g¯1)
Hemolymph (µg g¯1)
Heart index1
Hepatopancreas Index2
Trial 1
C16 24 15.3 17.2b 160.0b 1.89 52.5abc
C22 28 15.8 16.5b 151.6b 1.68 50.1c C34 42 16.3 34.1a 185.8a 1.70 51.2bc T16 21 13.1 14.4b 139.8b 1.77 56.1ab T22 27 10.3 13.2b 137.7b 1.80 57.4a T34 45 12.1 13.2b 149.3b 1.85 56.0ab PSE3 1.6 1.3 7.0 0.13 0.5 Two-way ANOVA P-value Model 0.1141 0.0001 0.0025 0.5088 0.0012 Source 0.0082 0.0001 0.0013 0.5022 0.0001 Level 0.7449 0.0001 0.0129 0.5825 0.8755 Source ×
Level 0.6124 0.0001 0.2792 0.2538 0.4431
Trial 2
C16 24 19.4b 26.8b 101.9a
C22 28 19.4b 34.0b 106.5a C34 42 31.1a 52.6a 113.5a T16 21 18.6b 21.2b 83.3b T22 27 20.2b 18.1b 82.0b T34 45 17.1b 17.6b 85.3b PSE3 2.5 4.5 3.8 Two-way ANOVA P-value Model 0.0134 0.0013 0.0001 Source 0.0416 0.0002 0.0001 Level 0.1309 0.0917 0.1987 Source ×
Level 0.0192 0.0277 0.4526
Values are means of four replicates. Means within columns with the same letter are not significant different (P > 0.05) based on analysis of variance followed by Student Newman-Keuls multiple range test. 1 The heart index= wet heart (mg)/wet weight shrimp (g) 2 The hepatopancreas index= wet hepatopancreas (mg)/wet weight shrimp (g) 3 Pooled Standard Error

109
Table 6 Relative bioavailability values (RBV) of Cu based on multiple linear regression of log10 Cu concentrations in carapace, hepatopancreas and hemolymph of shrimp on dietary analyzed Cu during the culture period.
Trial Dependent variable Cu sources Slope1 ± SE RBV%2
Trial 1 Carapace Cu3 CuSO4 0.032 ± 0.0031 100
TBCC 0.028 ± 0.0031 85.8
Hepatopancreas Cu4 CuSO4 0.038 ± 0.0031 100
TBCC 0.030 ± 0.0029 77.8
Hemolymph Cu5 CuSO4 0.058 ± 0.0055 100
TBCC 0.054 ± 0.0054 93
Trial 2 Carapace Cu6 CuSO4 0.037 ± 0.0034 100
TBCC 0.032 ± 0.0033 86.1
Hepatopancreas Cu7 CuSO4 0.044 ± 0.0037 100
TBCC 0.035 ± 0.0036 78.2
Hemolymph Cu8 CuSO4 0.054 ± 0.0051 100
TBCC 0.049 ± 0.0050 90.8
1 Slopes of the fitted regression lines. 2 RBV%: relative bioavailability values of copper from copper sulfate and TBCC were estimated by slope ratio model, based on linear regression of log10 copper concentration in carapace, hepatopancreas and hemolymph on daily analyzed copper level, using copper sulfate as the standard source. 3 Intercept=0.15, R2=0.80, P=0.0001 4 Intercept=0.14, R2=0.85, P=0.0001 5 Intercept=0.25, R2=0.83, P=0.0001 6 Intercept=0.16, R2=0.82, P=0.0001 7 Intercept=0.15, R2=0.84, P=0.0001 8 Intercept=0.26, R2=0.81, P=0.0001

110
Figure 1 Effects of dietary copper sources with levels pooled, on carapace, hepatopancreas, and hemolymph in Litopenaeus vannamei in trial 1 (A) and trial 2 (B).
a a
a
b b
b
0.0 20.0 40.0 60.0 80.0 100.0 120.0 140.0 160.0 180.0 200.0
Carapace Hepatopancreas Hemolymph
Cu µg
g–1
Tissues
A CuSO4
TBCC
a
a
a
b b
b
0.0
20.0
40.0
60.0
80.0
100.0
120.0
140.0
Carapace Hepatopancreas Hemolymph
Cu µg
g–1
Tissues
B CuSO4
TBCC

111
CHAPTER V
SUMMARY AND CONCLUSIONS
Continued rapid growth and intensification of aquaculture production depends upon the
development of sustainable feed formulations to support the long-term expansion of the industry.
. One of the primary challenges facing the feed industry is to identify economically viable and
environmentally friendly alternative ingredients to replace fishmeal and fish oil in feed
formulations. Many researchers have focused on the goal of increasing the use of plant-based
ingredients and reducing the use of marine ingredients in shrimp feed formulations. Toward this
goal, high levels of soybean meal can be used as major protein sources in shrimp formulations.
Soybean meal is considered an economical and nutritious feedstuffs with moderate protein
content, high digestibility, relatively well-balanced amino acid profile, and steady supply with a
reasonable price. The overall goal of this study was to advance our understanding of plant-based
feed formulations through a better knowledge of various sources and nutrients that may be
limiting. More specifically, the goal was to evaluate new varieties of soybean meal to determine
if the efficacy of Dried Distillers Grains with Soluble (DDGS) from sorghum (S-DDGS) as an
alternative protein source in shrimp feed formulation would improve the sustainable
development of aquaculture. To further optimize plant-based feeds, trace mineral supplements
may also be needed; hence, Cu supplements were also evaluated.
Commodity soybean meal has a number of anti-nutritional factors, which limit its
inclusion in feed formulations. New strains of selectively bred, non-genetically modified (non-
GM) soybeans can have reduced levels of oligosaccharides, lectins, trypsin inhibitors and/or
enhanced levels of protein, which may afford fewer problems and allow for higher substitutions

112
in formulations for marine shrimp. Based on this study, there were no significant differences in
survival or percent weight gain among treatments using a range of new soy lines. In the
digestibility trial, soybean meal C displayed the highest ADMD and ADP values compared to the
other experimental meals and also exhibited a significant higher ADP value than conventional
soybean meal A. This finding indicates that new lines of soybean meal can be used to improve
digestibility coefficients in shrimp feeds.
DDGS is a by-product of ethanol production that is a potential protein source for shrimp
feed due to its lower feed cost. Based on the results of the present study, S-DDGS can be
included in practical diets at the inclusion rate up to 40% for the Pacific white shrimp, without
negative effects on growth, survival and FCR. Although some performance differences were
observed between extruded or pelleted feed, these were not consistent across the two trials. As
expected, some shifts in processing parameters were observed as the formulations were changed.
However, all the feeds produced were reasonable in terms of the physical characteristics and
supported good performance of the shrimp. Thus, the use of S-DDGS products should be
encouraged as an alternative protein source in shrimp feed formulations.
The use of plant-based sources in feeds may result in the reduced availability of trace
minerals, such as copper, due to the presence of the antagonists in plant meals. The effect of
supplemental two copper sources (copper sulfate pentahydrate and tri-basic copper chloride) in
the practical diets for L. vannamei was evaluated on growth performance and tissues’ responses.
Based on the results of this study, there was no significant effect of copper supplemental level
and source on final mean weight, final biomass, FCR, and survival in three growth trials. Shrimp
growth performance across three trials did not respond to dietary copper supplements. This study

113
showed that TBCC was a safe, effective and available source of copper in the Pacific white
shrimp L. vannamei.
These studies have indicated that new varieties of soybean should be pursued and that
ethanol byproducts such as S-DDGS can be used effectively in practical diets for L. vannamei.
The soybean meal C may hold a high potential as a shrimp feed ingredient. Thus, its use can be
encouraged in shrimp feed. The S-DDGS can be included in practical diets and generally
increased up to 40% for extruded or pelleted feed without negative growth performance and with
good physical characteristics. This study also improved the knowledge of copper sources in
shrimp diets. The use of TBCC should be encouraged as an alternative copper source in shrimp
feed formulation.

114
LITERATURE CITED
Akiyama, D.M., Coelho, S.R., Lawrence, A.L., Robison E.H., 1989. Apparent digestibility of
feedstuffs by the marine shrimp Penaeus vannamei Boone. Nippon Suisan Gakkaishi 55,
91–98.
Álvarez, J.S., Hernández-Llamas, A., Galindo, J., Fraga, L., García, T., Villarreal, H., 2007.
Substitution of fishmeal with soybean meal in practical diets for juvenile white shrimp
Litopenaeus schmitti (Pérez-Farfante & Kensley 1997). Aquac. Res. 38, 689–695.
Amaya, E.A., Davis, D.A., Rouse, D.B., 2007a. Alternative diets for the Pacific white shrimp
Litopenaeus vannamei. Aquaculture 262, 419–425.
Amaya, E.A., Davis, D.A., Rouse, D.B., 2007b. Replacement of fish meal in practical diets for
the Pacific white shrimp (Litopenaeus vannamei) reared under pond conditions.
Aquaculture 262, 393–401.
Apines-Amar, M.J.S., Satoh, S., Caipang, C.M.A., Kiron, V., Watanabe, T., Aoki, T., 2004.
Amino acid-chelate: a better source of Zn, Mn and Cu for rainbow trout, Oncorhynchus
mykiss. Aquaculture 240, 345–358.
Apines-Amar, M.J., Satoh, S., Kiron, V., Watanabe, T., Fujita, S., 2003. Bioavailability and
tissue distribution of amino acid-chelated trace elements in rainbow trout, Oncorhynchus
mykiss. Fish. Sci. 69, 722–730.
Baker, D.H., 2000. Nutritional constraints to use of soy products by animals. In: Drackley, J.K.
(Ed.), Soy in Animal Nutrition. Federation of Animal Societies, Savoy, IL, pp. 1–12.
Brunson, J.F., Romaire, R.P., Reigh, R.C., 1997. Apparent digestibility of selected ingredients in
diets for white shrimp Penaeus setiferus L. Aquac. Nutr. 3, 9–16.

115
Clark, D.J., Lawrence, A.L., Swakon, D.H.D., 1993. Apparent chitin digestibility in penaeid
shrimp. Aquaculture 109, 51–57.
Cromwell, G.L., Herkelman, K.L., Stahly, T.S., 1993. Physical, chemical, and nutritional
characteristics of distillers dried grain with solubles for chicks and pigs. J. Anim. Sci. 71,
679–686.
Cromwell, G.L., Lindemann, M.D., Monegue, H.J., Hall, D.D., Orr Jr, D.E., 1998. Tribasic
copper chloride and copper sulfate as copper sources for weanling pigs. J. Anim. Sci. 76,
118–123.
Cruz-Suárez, L.E., Tapia-Salazar, M., Villareal-Cavazos, D., Beltran-Rocha, J., Nieto-López,
M.G., Lemme, A., Ricque-Marie, D., 2009. Apparent dry matter, energy, protein and
amino acid digestibility of four soybean ingredients in white shrimp Litopenaeus
vannamei juveniles. Aquaculture 292, 87–94.
Davis D.A., Arnold C.R., 2000. Replacement of fish meal in practical diets for the Pacific white
shrimp Litopenaeus vannamei. Aquaculture 185, 291–298.
FAO (Food and Agriculture Organization of the United Nations), 2011. Online Query Panel:
Global Aquaculture Production 1950–2009. Food and Agriculture Organiza- tion of the
United Nations, Fisheries and Aquaculture Department. http://www.fao.
org/fishery/statistics/global-aquaculture-production/query/en.
Forster, I.P., Dominy, W.G., Obaldo, L., Tacon, A.G.J., 2003. Rendered meat and bone meals as
ingredients of diets for shrimp Litopenaeus vannamei. Aquaculture 219, 655–670.
Hardy, R.W., 1999. Aquaculture's rapid growth requirements for alternate protein sources. Feed
Manage. 50, 25–28.

116
Hilton, J.W., Cho, C.Y., Slinger, S.J., 1977. Factors affecting the stability of supplemental
ascorbic acid in practical diets. J. Fish. Res. Board Can. 34, 683–687.
Hilton, J.W., Cho, C.Y., Slinger, S.J., 1981. Effect of extrusion processing and steam pelleting
diets on pellet durability, pellet water absorption, and the physiological response of
rainbow trout (Salmo gairdneri R.). Aquaculture 25, 185–194.
Lawrence, A.L., Castille, F.L., Sturmer, L.N., Akiyama, D.M., 1986. Nutritional response of
marine shrimps to different levels of soybean meal in feeds. In: USA-ROC and ROC-
USA Economic Councils’ Tenth Anniversary Joint Business Conference, Taipei, Taiwan,
pp. 18-22.
Liener, I.E., 2000. Non-nutritive factors and bioactive compunds in soy. In: Soy in animal
nutrition (Drackley, J.K. ed.), pp. 1–12. Federation of Animal Societies, Savoy, IL, USA.
Lim, C., Dominy, W., 1990. Evaluation of soybean meal as a replacement for marine animal
protein in diets for shrimp (Penaeus vannamei). Aquaculture 87, 53–56.
Lim, C., Dominy, W., 1991. Utilization of plant proteins by warm water fish. In: Akiyama, D.M.,
Tan, R.K.H. (Eds.), Proceedings of the aquaculture feed processing and nutrition
workshop, September 19–25. American Soybean Association, Singapore, pp. 245–251.
Lim, C., Dominy, W., 1992. Substitution of full-fat soybeans for commercial soybean meal in
diets for shrimp, Penaeus vannamei. J. Appl. Aquac. 1, 35–45.
Liu, K., Rosentrater, K.A., 2012. Distillers grains: Production, properties, and utilization. CRC
Press, Baca Raton, Florida, pp. 147.
Lorentzen, M., Maage, A., Julshamn, K., 1998. Supplementing copper to a fish meal based diet
fed to Atlantic salmon parr affects liver copper and selenium concentrations. Aquac.
Nutr. 4, 67–77.

117
Lovell, R.T., Lim, C., 1978. Vitamin C in pond diets for channel catfish. Trans. Am. Fish. Soc.
107, 321–325.
Lovell, R.T., 1989. Nutrition and Feeding of Fish. AVI Publishing, Co., New York, pp. 260.
Lovell, R.T., 1990. Nutrition and feeding highlights from the World Aquaculture Society
Meeting. Aquac. Mag. 16. 70–73.
Luo, X.G., Ji, F., Lin, Y.X., 2005. Effects of dietary supplementation with copper sulfate or
tribasic copper chloride on broiler performance, relative copper bioavailability, and
oxidation stability of vitamin E in feed. Poult. Sci. 84, 888–893.
MacGrath W.S.Jr., 1976. The role of the feed industry in developing formulated feeds for
aquaculture. In K.S. Price, Jr., W.N. shaw and K.S. Danberg (Eds), Proceedings of the
First International Conference on Aquaculture Nutrition, Oct. 14-15, 1975, Newark, DE,
USA. pp.119-123.
Mendoza-Alfaro, R., De Dios, A., Vázquez, C., Cruz-Suárez, E., Ricque-Marie, D., Aguilera, C.,
Montemayor, J., 2001. Fishmeal replacement with feather-enzymatic hydrolyzates co-
extruded with soya-bean meal in practical diets for the Pacific white shrimp (Litopenaeus
vannamei). Aquac. Nutr. 7, 143–151.
Miles, R.D., O'Keefe, S.F., Henry, P.R., 1998. The effect of dietary supplementation with copper
sulfate or tribasic copper chloride on broiler performance, relative copper bioavailability,
and dietary prooxidant activity. Poult. Sci. 77, 416–425.
Moyle, P.B., Cech, J.J., 2000. Hydromineral balance. In: Fishes: An Introduction to Ichthyology,
fourth ed. Prentice Hall, Upper Saddle River, NJ, pp. 77–93.
NRC, 2011. Nutrient requirements of fish and shrimp. National Academies Press, Washington
D.C., USA, pp. 1–376.

118
O'Dell, B.L., 1976. Biochemistry of copper. Symposium on trace elements. Med. Clin. North
Am. 60, 697–703.
Paripatananont, T., Boonyaratpalin, M., Pengseng, P., Chotipuntu, P., 2001. Substitution of soy
protein concentrate for fishmeal in diets of tiger shrimp Penaeus monodon. Aquac. Res.
32, 369–374.
Paripatananont, T., Lovell, R.T., 1995. Chelated zinc reduces the dietary zinc requirement of
channel catfish, Ictalurus punctatus. Aquaculture 133, 73–82.
Paripatananont, T., Lovell, R.T., 1997. Comparative net absorption of chelated and inorganic
trace minerals in channel catfish Ictalurus punctatus diets. J. World Aquac. Soc. 28, 62–
67.
Piedad-Pascual, F., Cruz, E.M., Sumalangcay Jr, A., 1990. Supplemental feeding of Penaeus
monodon juveniles with diets containing various levels of defatted soybean meal.
Aquaculture 89, 183–191.
Ponce-Palafox, J., Martine-Palacios, C.A., Ross, L.G., 1997. The effects of salinity and
temperature on the growth and survival rates of juvenile white shrimp, Penaeus vannamei
Boone, 1931. Aquaculture 157, 107–115.
Riaz, M.N., 2009. The Role of Extrusion Technology on Feed Safety and Hygiene. Presented at
the 17th Annual ASAIM Southeast Asian Feed Technology and Nutrition Workshop, The
Imperial Hotel, Hue, Vietnam, June 17.
Robinette, H.R., 1977. Feed manufacture. In: Stickney, R.R., Lovell, R.T., (Eds.), Nutrition and
Feeding of Channel Catfish. South. Coop. Ser. Bull. 36, 84–96.

119
Smith L.L., Lee P.G., Lawrence A.L., Strawn K., 1985. Growth and digestibility by three sizes
of Penaeus vannamei Boone: effects of dietary protein level and protein source,
Aquaculture 46, 85–96.
Sookying, D., Davis, D.A., 2011. Pond production of Pacific white shrimp (Litopenaeus
vannamei) fed high levels of soybean meal in various combinations. Aquaculture 319,
141–149.
Sookying, D., Davis, D.A., 2012. Use of soy protein concentrate in practical diets for Pacific
white shrimp (Litopenaeus vannamei) reared under field conditions. Aquac. Int. 20, 357–
371.
Spears, J.W., Kegley, E.B., Mullis, L.A., 2004. Bioavailability of copper from tribasic copper
chloride and copper sulfate in growing cattle. Anim. Feed. Sci. Technol. 116, 1–13.
Spiehs, M.J., Whitney, M.H., Shurson, G.C., 2002. Nutrient database for distillers dried grains
with solubles produced from new ethanol plants in Minnesota and South Dakota. J.
Anim. Sci. 80, 2639–2645.
Tacon, A.G.J., Metian, M., 2008. Global overview on the use of fish meal and fish oil in
industrially compounded aquafeeds: Trends and future prospects. Aquaculture 285, 146–
158.
Watanabe, T., Kiron, V., Satoh, S., 1997. Trace minerals in fish nutrition. Aquaculture 151, 185–
207.
Williams, A.S., Davis, D.A., Arnold, C.R., 1996. Density-dependent growth and survival of
Penaeus setiferus and Penaeus vannamei in semi-closed recirculating system. J. World
Aquac. Soc. 27, 107–112.

120
Yang, Q.H., Zhou, X.Q., Zhou, Q.C., Tan, B.P., Chi, S.Y., Dong, X.H., 2009. Apparent
digestibility of selected feed ingredients for white shrimp Litopenaeus vannamei, Boone.
Aquac. Res. 41, 78–86.
Related Documents