Asian Journal of Research in Banking and Finance Asian Journal of Research in Banking and Finance Vol. 5, No. 12, December 2015, pp. 13-25. ISSN 2249-7323 13 www.aijsh.org Asian Research Consortium Optimization of MACD and RSI indicators: An Empirical Study of Indian Equity Market for Profitable Investment Decisions Dr. Yogesh D Mahajan* *Associate Professor, Symbiosis International University. Dr. Krishnamurthy Inumula Symbiosis institute of International Business, Pune Abstract Technical analysis has been continuously used by traders and investors to make investment decisions in both developed and developing markets. The main important tools of technical analysis are MACD (Moving Average Convergence Divergence) and RSI (Relative Strength Index) used to determine the future trend of the stock prices. In developing market like India, use of technical analysis by investors is limited to the use of standard MACD and other indicators developed by respective technicians. The research covers the sample representing the equity stocks which are continually traded on the National Stock Exchange of India. This research is helpful to determine the applicability of MACD and RSI indicators for a Profitable investment decision making on Indian Financial Market. The main objective of the research is to identify the potential contribution of standard MACD and RSI indicators vis-à-vis optimized MACD and RSI indicators. The main hypotheses of the research is that the application of standard MACD and RSI indicators contribute to profitable investments than buy and hold strategy (Efficient Market Hypotheses). The tools of data analysis includeMetastock trading simulation software and Excel Mathematical calculations. Research results indicate that the buy and hold strategy results in profitable investments than standard MACD and RSI indicators. According to the obtained results it is concluded that Optimized MACD and RSI indicators are more profitable than buy and hold strategy and Standard MACD and RSI indicators. And hence Optimized MACD and RSI indicators defy Efficient Market Hypotheses. Keywords: MACD, RSI, Optimization, Buy and Hold Strategy, Indian Equity Market. ________________________________________________________________________________

Welcome message from author
This document is posted to help you gain knowledge. Please leave a comment to let me know what you think about it! Share it to your friends and learn new things together.
Transcript

Asian Journal
of Research in
Banking
and
Finance Asian Journal of Research in Banking and Finance Vol. 5, No. 12, December 2015, pp. 13-25.
ISSN 2249-7323
13
www.aijsh.org
Asian Research Consortium
Optimization of MACD and RSI indicators:
An Empirical Study of Indian Equity Market for
Profitable Investment Decisions
Dr. Yogesh D Mahajan*
*Associate Professor,
Symbiosis International University.
Dr. Krishnamurthy Inumula
Symbiosis institute of International Business, Pune
Abstract
Technical analysis has been continuously used by traders and investors to make investment
decisions in both developed and developing markets. The main important tools of technical analysis
are MACD (Moving Average Convergence Divergence) and RSI (Relative Strength Index) used to
determine the future trend of the stock prices. In developing market like India, use of technical
analysis by investors is limited to the use of standard MACD and other indicators developed by
respective technicians. The research covers the sample representing the equity stocks which are
continually traded on the National Stock Exchange of India. This research is helpful to determine
the applicability of MACD and RSI indicators for a Profitable investment decision making on
Indian Financial Market. The main objective of the research is to identify the potential contribution
of standard MACD and RSI indicators vis-à-vis optimized MACD and RSI indicators. The main
hypotheses of the research is that the application of standard MACD and RSI indicators contribute
to profitable investments than buy and hold strategy (Efficient Market Hypotheses). The tools of
data analysis includeMetastock trading simulation software and Excel Mathematical calculations.
Research results indicate that the buy and hold strategy results in profitable investments than
standard MACD and RSI indicators. According to the obtained results it is concluded that
Optimized MACD and RSI indicators are more profitable than buy and hold strategy and Standard
MACD and RSI indicators. And hence Optimized MACD and RSI indicators defy Efficient Market
Hypotheses.
Keywords: MACD, RSI, Optimization, Buy and Hold Strategy, Indian Equity Market.
________________________________________________________________________________
Mahajan (2015). Asian Journal of Research in Banking and Finance,
Vol. 5, No.12, pp. 13-25.
14
Introduction
India heavily relies on Foreign Institutional Investors(FII) to support its equity markets. Daily FII
data released by NSE and BSE affect the trend of Indian equity market.A strong financial market
with broader participation of small Indian investors is essential for a sustainable economic growth
of country. India's household savings, one of the highest in the world at 31%, can be brought in
equity market. India though with a population of approximately 125 crores is hardly invested in
share market either directly or indirectly through Mutual funds. Out of 8000 companies listed on
the Indian stock markets, less than 2500 are actively traded. Since the entire structure has a
speculative culture, it exposes investors to greater risks and restricts real capital formation.
Investors pay a very high cost of transaction, which can be pruned by approximately 50%.
Technical analysis has been continuously used by traders and investors to make investment
decisions in developed markets. But in India, its use is relatively very less. Small Indian investor
suffers losses in trading due to lack of knowledge of fundamental analysis and technical analysis.
Fundamental analysis is difficult for an investor to understand. Also it is very difficult for Indian
investor to decide which stock to buy. But technical analysis is relatively simpler. The tools of
technical analysis are easy to understand and can be implemented by Indian investors. MACD and
RSI as a technical tool can be of great help to an Indian investor. But in developing market like
India, use of technical analysis by small investors is limited to use of standard MACD and other
indicators developed by respective technicians. The paper studies these tools and uses it in Indian
market to prove its viability in the Indian Market. Due to inefficiency of these standard tools,
optimized MACD and RSI tools can be of great help to Indian investors.
The market for other forms of financial instruments, such as bonds and interest-rates, has not
developed in India. The equity segment currently accounts for more than 81% of market activity in
India. In developed countries, the trend is the opposite, with bonds accounting for more than 80%
of trading in some markets.There's clearly a lack of broader participation. Of a population of over
125 crores, barely 20 million invest in equity markets. According to SEBI data, 10 cities
contributed over 80% of trading volume in 2014. The volatile behavior in the equity markets also
indicates that these are not only highly speculative but also lacks support from a large number of
people. The Indian market is highly dependent on foreign institutional investors (FII) movement.
Thus, any change in FII inflows and outflows lead to extreme changes in market indicators, despite
no change in fundamentals.
There have been two main methods to analyzethe securities market - the fundamental approach and
the technical approach. The fundamentalapproach studies the firm’s basic earningsand risk on the
market price of its shares, whereas thetechnical approach concentrates on the patterns of
stockmarket prices. The technical approach states that pastshare prices and volumes tend to follow
a pattern andthey can be used to predict future price movements.Forces of demand and supply
determine the share prices. Fundamental analyst thinks that they are afunction of rational factors,
while technicians attributeit to psychological factors.The technical analysis approach to capital
marketevaluation has received little attention and acceptanceas compared to fundamental analysis.
But in recent yearsthe popularity of technical analysis is increasingamongst academicians and
practitioners. There has beensome empirical research on technical analysis, fordeveloped capital

Mahajan (2015). Asian Journal of Research in Banking and Finance,
Vol. 5, No.12, pp. 13-25.
15
markets. However similar empiricalwork for developing markets especially India is limited.So, an
empirical testing of technical indicatorsfor Indian stock market is considered important. It
ispossible that the efficacy of technical tools may varyacross mature and emerging market settings
owing todifferences in their relative efficiency.
Review of Literature
In Chong and Ng (2008) it is indicated that abuy sign is produced when the MACD isgreater than
0.A sell sign is generated when theMACDsign is less than 0.In our study, the buy and sale orders
ofMACD are generating as follows: When the fast signal line crosses the slow signal line from
below zero and also if it crosses above zero. A sell signal is generated when the fast signal line
crosses the slow signal line from above zero and also if it crosses from below zero. R Rosilli et
al(2013) studies the use of MACD in Spanish market and concludes the effectiveness of MACD as
a powerful indicator. They have developed software which gives buy/sell signal on the basis of
MACD and other technical tools. The application of the optimized MACD andRVI indicators of
technical analysis in decision making process on investing on thefinancial market significantly
contributes maximization of profitability on investments in equity markets (Dejan Eric et al
(2009)).The results imply that the MACD and RVIindicators are effective upon formulating and
optimizing investment strategy onfinancial market in transitional country.V Subramanian et al
(2014) in their paper concluded thatwith the help of technical analysis and by adopting simple
trading rules, there arepossibilities for an ordinary investor to earn more returns than returns under
simple buy and hold policy.Hung-Wei Lai et al (2010) found that the “disposition,” “information
cascade,” and “anchoring” effects each have significantimpacts on trading signals in equity
markets.
Technical analysis has become an interesting field among academics and chartists since the
publication ofEfficient Market Hypothesis (EMH) by Fama (1970). According to EMH, in an
efficientmarket, stock price reflects fully all the available information and rational investors
makebetter price discovery. Hence no strategy will give higher than simple buy-and-hold return
inan efficient market. On the other hand, authors like Irwin and Park (2007) and Lento (2008)
substantiated technical analysis and reported excess returns over simple buy-and-hold policy by
applying technical rules.
ImadMoosa and Larry Li(2011)concluded that somespecial features of the Chinese market give
technicians the upper hand, in the sensethat their activities have a more significant impact on stock
prices than those of thefundamentalists.Sanjay Sehgal and MeenakshiGupta (2007) concludethat
technical indicators do not outperform Simple Buy and Hold strategy on net return basis for
individualstocks. But technical indicators seem to do better during market upturns compared to
market downturns.Thus compared to SBH strategy the technicalanalysis is not found economically
feasible during thestudy period, as trading costs erodes most of the profits.
A. Antoniou et al(1997) have argued that technical analysis which incorporatesdata on volume as
well as returns may provide evidence ofreturn predictability that technical analysis on returns
alonewill not. The rationale for this is based on the premise thatvolume contains information
regarding the quality and arrivalof information which is not contained in prices. Zoran Grubisic et
al (2012) concluded that technical analysis is an excellent tool forevaluation of price patterns, but
Mahajan (2015). Asian Journal of Research in Banking and Finance,
Vol. 5, No.12, pp. 13-25.
16
that the possibility of its use is limited to subjectiveway of forecasting future price movement of
securities. Given the subjectivity,signals for purchase or sales may differ from the actual (future),
which affectswrong investment decisions. Therefore, it is often used as an additional techniquewith
the use of fundamental analysis. Moving averages are used primarily within the methods of
technical analysis, because the analysis of existing trendsprovides the most accurate signals to buy
or sell.
Terence Mills (1997) investigates the predictive ability of various simple technical trading rules
byanalyzing daily data on the London Stock Exchange FT30 index for the period 1935-1994.The
results for the first forty years of sampleare thus consistent, in almost every respect, withthose of
Brock et al. (1992) for the Dow in New York. It is in the last of sub-samples that theperformance of
the trading rules deteriorates badly.Indeed, it could be argued that it isonly from the early 1980s
that a buyand holdstrategy begins clearly to dominate.
DedhySulistiawan et al (2014) study examines whether technical analysis signals can detecttrading
opportunities in declining market. They found that technical analysis produces bigger returns than
buy and hold returns in the bad time.
Data and Methodology
The main objective of the research is to identify the potential contribution of standard MACD and
RSI indicators vis-à-vis optimized MACD and RSI indicators. The study is based on secondary data
collected from various sources like SEBI manuals, NSE,BSE annual reports, journals and books on
the subject. The research is historical in nature as it studies past data to analyze and interpret. The
scope of study is limited to study and applicability of two technical analysis tools i.e. MACD and
RSI on stocks trading on equity market in India and to suggest how it will help Indian investor to
earn returns in excess of Index returns. The period of the study is three years from April 2012 to
March 2015.Metastock trading simulation software and Microsoft excel has been used to analyze
the data. The paired t test is used to test the difference between different investment
strategies.Transaction costs are considered as Rs 50 per trade which includes brokerage, taxes etc
which was prevalent in India during the course of study period.
The paper selects 30 stocks of 5 different sectors from Indian equity which are continuously traded
on National Stock exchange and some of them are part of Index of NSE (Nifty). They are as
follows-
1) Financials- Sate Bank of India, HDFC Bank, Yes Bank, ICICI Bank, Axis Bank, Bank of
Baroda
2) Pharmaceuticals- Lupin, Sun Pharma, Cipla, Glenmark, Dr Reddy Laboratories,
Aurobindo Pharma
3) Automobiles- Tata Motors, Maruti, Hero Motocorp, Eicher, Ashok Leyland, TVS Motors
4) Information Technology- Infosys, TCS, Wipro, Tech Mahindra, HCL Technologies ltd,
Hexaware

Mahajan (2015). Asian Journal of Research in Banking and Finance,
Vol. 5, No.12, pp. 13-25.
17
5) FMCG- Marico, ITC, Godrej Industries, Dabur, Colgate Palmolive, Mcleod Russel
On the basis of characteristics of MACD and RSI indicators, following hypotheses are proposed to
be tested:
Hypothesis 1- Application of standard MACD and RSI indicators contribute to profitable
investments than buy and hold strategy.
Hypothesis 2- Optimized MACD and RSI indicators leads to successful investment strategy in
Indian equity market.
Hypothesis 3 – There is no significant difference in profit results of optimized MACD and RSI
indicators for different sectors under study.
Technical Analysis Tools
Technical analysis is the analysis of market price movements and trading volume for the stock
under investigation. The general goal of technical analysis is to identify regularities in the time
series of prices by extracting nonlinear patterns from noisy data. Technical indicators are one of the
main important segments of technical analysis. There are two main types of indicators: leading and
lagging. Lagging indicators identify the movement and strength of the trend, while leading
indicators identify the level of overbought and oversold of stock prices. MACD is a lagging
indicator and RSI is a leading indicator.
Moving Average Convergence/Divergence (MACD)
Developed by Gerald Appel in the late seventies, the Moving Average Convergence/Divergence
oscillator (MACD) is one of the simplest and most effective momentum indicators available. The
MACD turns two trend-following indicators, moving averages, into a momentum oscillator by
subtracting the longer moving average from the shorter moving average. The MACD Line is the
12-day Exponential Moving Average (EMA) less the 26-day EMA. Closing prices are used for
these moving averages. A 9-day EMA of the MACD Line is plotted with the indicator to act as a
signal line and identify turns. The MACD fluctuates above and below the zero line as the moving
averages converge, cross and diverge. Traders can look for signal line crossovers, centerline
crossovers and divergences to generate signals. Because the MACD is unbounded, it is not
particularly useful for identifying overbought and oversold levels.
MACDS = 9 day exponential moving average (EMA)– “Signal line”
MACD = Difference between 26 and 12 day EMA
Relative Strength Index
Developed J. Welles Wilder, Relative Strength Index (RSI) is another oscillators examined here.A
stock is considered overbought when its RSI is above 70, while it is regarded as oversold when the
RSI is below 30. When the RSI is above 50, it indicates a bullish signal, while the security is
considered bearish when the RSI is below 50. In this article, the 14-day RSI, a popular length
Mahajan (2015). Asian Journal of Research in Banking and Finance,
Vol. 5, No.12, pp. 13-25.
18
utilized by traders, will be studied. To implement the trading rule, a buy signal is triggered when
the RSI crosses the center line from below, while a sell signal is triggered when the RSI crosses the
center line from above.
Calculating the RSI requires the calculation of the RS.
o RS = [EMA(Upwards)/EMA (Downwards)] over some common trading period (normally 14
days).
o EMA(Upwards) and EMA(Downwards) are calculated on the basis of the differences between
indices/rates/yields/prices between the closing of trading days.
o RSI = 100 – 100/(1+RS)
Optimization of MACD and RSI Indicators
In order to improve efficiency of MACD and RSI indicators, simulation of the two indicators was
done in MetaStock, technical analysis software.
For MACD, following range of values were taken for 12,26 and 9 lines-
1) Short Moving Average (12 line) -2 to 25
2) Long Moving Average (26 line)- 2 to 50
3) Signal Line (9 line) - 2 to 15
For RSI,following range of values were taken for 14 day period, 30 and 70 lines-
1) RSI period- 2 to 20
2) RSI low- 5 to 40
3) RSI high- 41 to 100
Results and Discussion
The selected stocks are continuously traded on NSE which are also traded in futures and options
market as there is ample liquidity in such stocks. The period selected for analyzing the data is
selected randomly so as to understand the applicability of this tools in any type of trend i.e. uptrend,
downtrend, and lateral trend. The data analysis results are presented in tabular form according to
different sectors.
Results of Table 1 shows stocks from financial sectors, table 2 shows data from pharma sectors,
table 3 shows data from automobiles sector, table 4 shows data from IT sector and table 5 shows
data from FMCG sector. In all this tables column one is name of stock, column 2 is optimized 12
line value, column 3 is optimized 26 line value, column 4 is optimized signal 9 line value. Column
5 is number of trading cycles for optimized MACD. Column 6 represents trading results of

Mahajan (2015). Asian Journal of Research in Banking and Finance,
Vol. 5, No.12, pp. 13-25.
19
optimized MACD. Column 7 represents trading results of MACD. Column 8 is number of trading
cycles for optimized MACD. Column 9 represents trading results for standard RSI indicator.
Column 10 represents number of trading cycles for standard RSI indicator. Column 11 represents
trading results for optimized RSI indicator, Column 12 represents number of trading cycles for
optimized RSI. Column 13 represents optimized RSI period. Column 14 represents lowest value for
optimized RSI. . Column 15 represents highest value for optimized RSI. Column 16 represents
trading results of buy and hold strategy.
Table 1: Profitability of Banking Sector
From the table 1, it is found that only in case of Axis Bank standard MACD is able to outperform
buy and hold. In all other banking stocks, buy and hold is outperforming standard MACD. In case
of Standard RSI, buy and hold strategy is outperforming Standard RSI. Optimized MACD and
Optimized RSI is outperforming buy and hold strategy in all banks. Also the number of trading
cycles has been reduced due to optimized MACD and Optimized RSI.
Table 2: Profitability of Pharma Sector
From the table 2, in all pharma stocks, buy and hold strategy is outperforming standard MACD and
Standard RSI. In case of optimized MACD, only in case of Sun Pharma, optimized MACD is
outperforming buy and hold strategy. In all other pharma stocks, buy and hold is outperforming
optimized MACD. Optimized RSI is outperforming buy and hold strategy in all pharma stocks.
Also the number of trading cycles has been reduced due to optimized MACD and Optimized RSI.
Stock Namesma lma signal matc macd opt result %12,26,9 resulttc rsi result tc rsiopt resulttc rsi opt periodrsi opt lowrsi opt highbuy&hold
Axis Bank 10 22 14 22 240.8 152.38 99 -1.25 16 232.17 2 20 27 83 142.85
Yes Bank 6 26 20 17 213.13 -48.12 95 -20.8 17 369.13 5 20 35 53 114.85
SBI 24 32 4 26 158.78 -80.81 80 131.98 14 92.31 5 12 23 55 25.25
HDFC Bank 20 22 8 11 89.13 -42.87 75 45.63 8 145.35 2 18 35 75 88.73
BOB 14 32 16 16 135.73 -59.5 86 0.34 11 113.18 15 8 33 51 27.67
ICICI Bank 16 14 12 19 203.36 -73.92 81 -30.59 10 109.41 8 6 23 83 77
Average 15 24.7 12.333 18.5 173.4883 -25.4733 86 20.885 12.67 176.925 6.167 14 29.33333 66.66667 79.39167
Stock Namesma lma signal matc macd opt result %12,26,9 resulttc rsi result tc rsiopt resulttc rsi opt periodrsi opt lowrsi opt highbuy&hold
Lupin 20 42 8 9 207.96 -61.68 99 -67.48 16 264.95 1 16 39 87 264.34
sunpharma 20 36 8 20 210.98 -46.4 76 3.8 15 268.87 9 6 37 89 76.33
cipla 24 42 4 35 80.55 -57.01 80 -0.43 15 200.41 19 6 37 75 128.81
glenmark 18 30 4 18 116.13 -43.31 89 -43.04 18 174.24 7 6 37 89 153.67
Dr reddy 20 44 2 14 77.53 -56.91 76 -18.17 13 137.18 3 20 39 71 87.28
Aurobindo 14 32 16 15 618.29 -49.56 125 -52.19 21 1048.21 1 20 39 89 961.32
Average 19.33 37.7 7 18.5 218.5733 -52.4783 90.8 -29.585 16.33 348.9767 6.667 12.33333 38 83.33333 278.625

Mahajan (2015). Asian Journal of Research in Banking and Finance,
Vol. 5, No.12, pp. 13-25.
20
Table 3: Profitability of Auomoble Sector
From the table 3, in all auto stocks, buy and hold strategy is outperforming standard MACD and
Standard RSI. In case of optimized MACD, only in case of Maruti Ltd and Eicher Motors, buy and
hold is outperforming optimized MACD. In all other stocks, optimized MACD is outperforming
buy and hold strategy. Optimized RSI is outperforming buy and hold strategy in all auto stocks.
Also the number of trading cycles has been reduced due to optimized MACD and Optimized RSI.
Table 4: Profitability of IT Sector
From the table 4, in all IT stocks, buy and hold strategy is outperforming standard MACD. In case
of Standard RSI, except Infosys, buy and hold strategy is outperforming Standard RSI. Optimized
MACD and Optimized RSI is outperforming buy and hold strategy in all IT stocks except TCS.
Also the number of trading cycles has been reduced due to optimized MACD and Optimized RSI.
Table 5: Profitability of FMCG Sector
From the table 5, in all FMCG stocks, buy and hold strategy is outperforming standard MACD and
standard RSI. Optimized MACD is outperforming buy and hold strategy in all FMCG stocks except
COLPAL. Optimized RSI is outperforming buy and hold strategy in all IT stocks except Godrej.
Also the number of trading cycles has been reduced due to optimized MACD and Optimized RSI.
Stock Namesma lma signal matc macd opt result %12,26,9 resulttc rsi result tc rsiopt resulttc rsi opt periodrsi opt lowrsi opt highbuy&hold
Tatamotors 24 34 2 21 137.48 -88.53 97 96.73 6 212.47 4 12 39 79 98.17
maruti 10 34 2 13 113.61 -33.61 83 -11.67 9 245.66 3 14 27 83 164.87
herom 8 32 2 27 62.98 -52.62 72 -34.63 11 54.13 14 6 29 75 20.79
eicherm 12 40 2 9 250.78 -61.26 71 -70.87 10 583.09 2 18 37 85 551.87
ashokley 12 26 8 49 551.57 62.21 110 -70.35 16 323.68 1 20 27 83 146.69
tvs 12 36 14 11 671.47 -54.23 126 46.39 6 779.7 1 18 31 85 509.57
Average 13 33.7 5 21.67 297.9817 -38.0067 93.2 -7.4 9.667 366.455 4.167 14.66667 31.66667 81.66667 248.66
Stock Namesma lma signal matc macd opt result %12,26,9 resulttc rsi result tc rsiopt resulttc rsi opt periodrsi opt lowrsi opt highbuy&hold
infy 14 24 10 19 108.78 -3.92 72 49.81 12 39.22 7 6 23 79 -19.21
tcs 16 2 14 33 98.02 -41.04 78 25.43 16 85 4 12 39 79 108.53
wipro 8 32 2 13 84.67 -34.08 56 -8.11 15 89.4 1 18 23 79 40.6
tech m 22 16 10 25 153.56 -63.1 93 37.25 6 269 2 16 31 81 73.04
hclt 20 22 14 18 139.06 -58.88 100 -37.9 18 303.33 2 8 37 87 90.79
hexaware 20 38 10 12 234.62 -18.13 105 -46.67 14 150.11 2 8 37 87 166.01
Average 16.67 22.3 10 20 136.4517 -36.525 84 3.30166667 13.5 156.01 3 11.33333 31.66667 82 76.62667
Stock Namesma lma signal matc macd opt result %12,26,9 resulttc rsi result tc rsiopt resulttc rsi opt periodrsi opt lowrsi opt highbuy&hold
itc 20 32 12 23 132.05 -10.98 61 29.48 9 144.26 14 6 23 79 42.28
marico 20 34 2 24 196.7 -77.59 82 17.03 7 137.49 13 6 35 79 124.51
godrej 24 40 2 52 116.1 -91.75% 84 12.66 14 41.21 1 18 37 85 102.49
dabur 24 42 4 35 149.55 -55.61 77 -24.02 10 184.19 11 6 37 83 149.77
colpal 12 20 2 26 55.9 -33.39 74 -3.8 16 126.69 13 6 37 83 69.31
mcleodrus 24 32 4 36 92.56 -12.72 76 5.53 12 36.37 3 12 23 55 -14.57
Average 20.67 33.3 4.3333 32.67 123.81 -31.8679 75.7 6.14666667 11.33 111.7017 9.167 9 32 77.33333 78.965
Mahajan (2015). Asian Journal of Research in Banking and Finance,
Vol. 5, No.12, pp. 13-25.
21
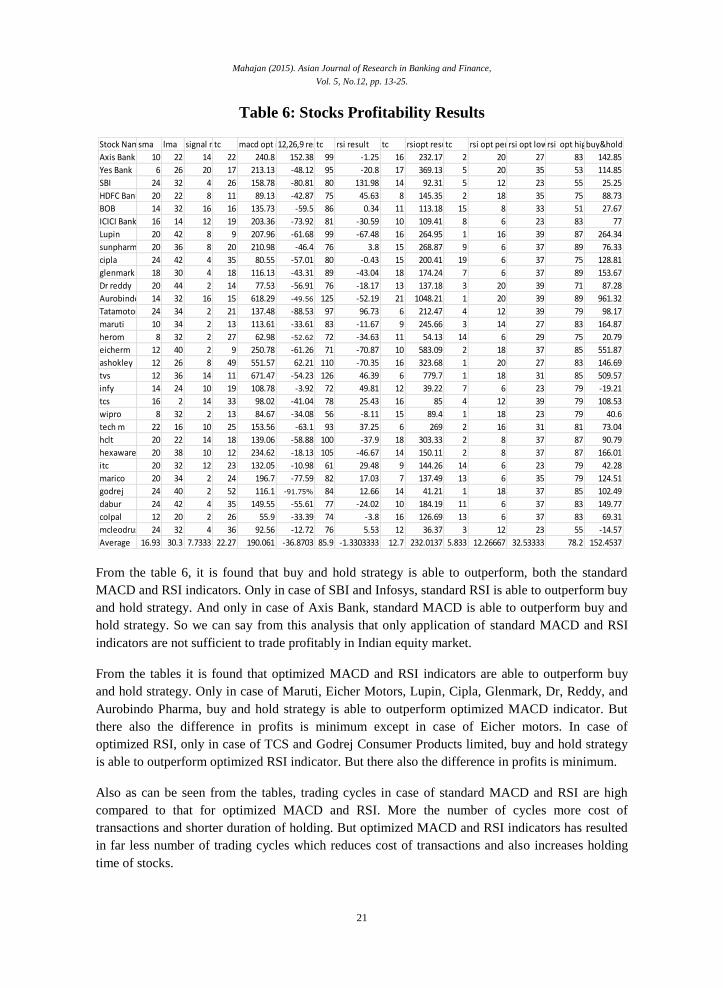
Table 6: Stocks Profitability Results
From the table 6, it is found that buy and hold strategy is able to outperform, both the standard
MACD and RSI indicators. Only in case of SBI and Infosys, standard RSI is able to outperform buy
and hold strategy. And only in case of Axis Bank, standard MACD is able to outperform buy and
hold strategy. So we can say from this analysis that only application of standard MACD and RSI
indicators are not sufficient to trade profitably in Indian equity market.
From the tables it is found that optimized MACD and RSI indicators are able to outperform buy
and hold strategy. Only in case of Maruti, Eicher Motors, Lupin, Cipla, Glenmark, Dr, Reddy, and
Aurobindo Pharma, buy and hold strategy is able to outperform optimized MACD indicator. But
there also the difference in profits is minimum except in case of Eicher motors. In case of
optimized RSI, only in case of TCS and Godrej Consumer Products limited, buy and hold strategy
is able to outperform optimized RSI indicator. But there also the difference in profits is minimum.
Also as can be seen from the tables, trading cycles in case of standard MACD and RSI are high
compared to that for optimized MACD and RSI. More the number of cycles more cost of
transactions and shorter duration of holding. But optimized MACD and RSI indicators has resulted
in far less number of trading cycles which reduces cost of transactions and also increases holding
time of stocks.
Stock Namesma lma signal matc macd opt result %12,26,9 resulttc rsi result tc rsiopt resulttc rsi opt periodrsi opt lowrsi opt highbuy&hold
Axis Bank 10 22 14 22 240.8 152.38 99 -1.25 16 232.17 2 20 27 83 142.85
Yes Bank 6 26 20 17 213.13 -48.12 95 -20.8 17 369.13 5 20 35 53 114.85
SBI 24 32 4 26 158.78 -80.81 80 131.98 14 92.31 5 12 23 55 25.25
HDFC Bank 20 22 8 11 89.13 -42.87 75 45.63 8 145.35 2 18 35 75 88.73
BOB 14 32 16 16 135.73 -59.5 86 0.34 11 113.18 15 8 33 51 27.67
ICICI Bank 16 14 12 19 203.36 -73.92 81 -30.59 10 109.41 8 6 23 83 77
Lupin 20 42 8 9 207.96 -61.68 99 -67.48 16 264.95 1 16 39 87 264.34
sunpharma 20 36 8 20 210.98 -46.4 76 3.8 15 268.87 9 6 37 89 76.33
cipla 24 42 4 35 80.55 -57.01 80 -0.43 15 200.41 19 6 37 75 128.81
glenmark 18 30 4 18 116.13 -43.31 89 -43.04 18 174.24 7 6 37 89 153.67
Dr reddy 20 44 2 14 77.53 -56.91 76 -18.17 13 137.18 3 20 39 71 87.28
Aurobindo 14 32 16 15 618.29 -49.56 125 -52.19 21 1048.21 1 20 39 89 961.32
Tatamotors 24 34 2 21 137.48 -88.53 97 96.73 6 212.47 4 12 39 79 98.17
maruti 10 34 2 13 113.61 -33.61 83 -11.67 9 245.66 3 14 27 83 164.87
herom 8 32 2 27 62.98 -52.62 72 -34.63 11 54.13 14 6 29 75 20.79
eicherm 12 40 2 9 250.78 -61.26 71 -70.87 10 583.09 2 18 37 85 551.87
ashokley 12 26 8 49 551.57 62.21 110 -70.35 16 323.68 1 20 27 83 146.69
tvs 12 36 14 11 671.47 -54.23 126 46.39 6 779.7 1 18 31 85 509.57
infy 14 24 10 19 108.78 -3.92 72 49.81 12 39.22 7 6 23 79 -19.21
tcs 16 2 14 33 98.02 -41.04 78 25.43 16 85 4 12 39 79 108.53
wipro 8 32 2 13 84.67 -34.08 56 -8.11 15 89.4 1 18 23 79 40.6
tech m 22 16 10 25 153.56 -63.1 93 37.25 6 269 2 16 31 81 73.04
hclt 20 22 14 18 139.06 -58.88 100 -37.9 18 303.33 2 8 37 87 90.79
hexaware 20 38 10 12 234.62 -18.13 105 -46.67 14 150.11 2 8 37 87 166.01
itc 20 32 12 23 132.05 -10.98 61 29.48 9 144.26 14 6 23 79 42.28
marico 20 34 2 24 196.7 -77.59 82 17.03 7 137.49 13 6 35 79 124.51
godrej 24 40 2 52 116.1 -91.75% 84 12.66 14 41.21 1 18 37 85 102.49
dabur 24 42 4 35 149.55 -55.61 77 -24.02 10 184.19 11 6 37 83 149.77
colpal 12 20 2 26 55.9 -33.39 74 -3.8 16 126.69 13 6 37 83 69.31
mcleodrus 24 32 4 36 92.56 -12.72 76 5.53 12 36.37 3 12 23 55 -14.57
Average 16.93 30.3 7.7333 22.27 190.061 -36.8703 85.9 -1.3303333 12.7 232.0137 5.833 12.26667 32.53333 78.2 152.4537
Mahajan (2015). Asian Journal of Research in Banking and Finance,
Vol. 5, No.12, pp. 13-25.
22
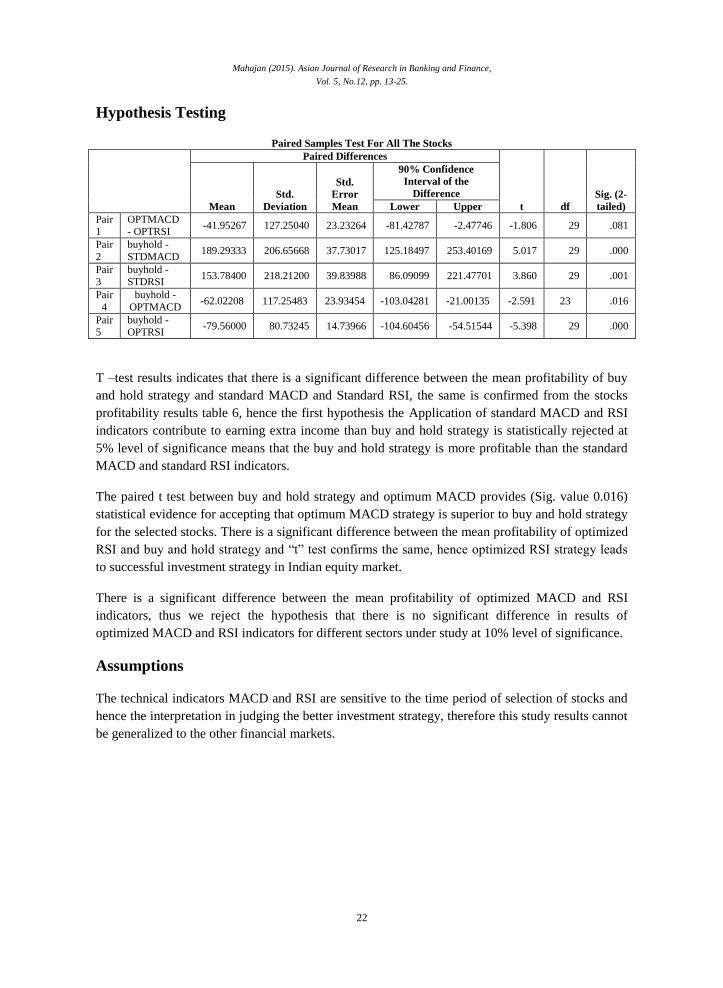
Hypothesis Testing
Paired Samples Test For All The Stocks
Paired Differences
t df
Sig. (2-
tailed) Mean
Std.
Deviation
Std.
Error
Mean
90% Confidence
Interval of the
Difference
Lower Upper
Pair 1
OPTMACD - OPTRSI
-41.95267 127.25040 23.23264 -81.42787 -2.47746 -1.806 29 .081
Pair
2
buyhold -
STDMACD 189.29333 206.65668 37.73017 125.18497 253.40169 5.017 29 .000
Pair 3
buyhold - STDRSI
153.78400 218.21200 39.83988 86.09099 221.47701 3.860 29 .001
Pair
4
buyhold -
OPTMACD -62.02208 117.25483 23.93454 -103.04281 -21.00135 -2.591 23 .016
Pair 5
buyhold - OPTRSI
-79.56000 80.73245 14.73966 -104.60456 -54.51544 -5.398 29 .000
T –test results indicates that there is a significant difference between the mean profitability of buy
and hold strategy and standard MACD and Standard RSI, the same is confirmed from the stocks
profitability results table 6, hence the first hypothesis the Application of standard MACD and RSI
indicators contribute to earning extra income than buy and hold strategy is statistically rejected at
5% level of significance means that the buy and hold strategy is more profitable than the standard
MACD and standard RSI indicators.
The paired t test between buy and hold strategy and optimum MACD provides (Sig. value 0.016)
statistical evidence for accepting that optimum MACD strategy is superior to buy and hold strategy
for the selected stocks. There is a significant difference between the mean profitability of optimized
RSI and buy and hold strategy and “t” test confirms the same, hence optimized RSI strategy leads
to successful investment strategy in Indian equity market.
There is a significant difference between the mean profitability of optimized MACD and RSI
indicators, thus we reject the hypothesis that there is no significant difference in results of
optimized MACD and RSI indicators for different sectors under study at 10% level of significance.
Assumptions
The technical indicators MACD and RSI are sensitive to the time period of selection of stocks and
hence the interpretation in judging the better investment strategy, therefore this study results cannot
be generalized to the other financial markets.
Mahajan (2015). Asian Journal of Research in Banking and Finance,
Vol. 5, No.12, pp. 13-25.
23
Implications
Investors always try to beat the market in their own way, though there is a saying of there is no
profitable trading rule exists for traders in the market. Technical analysis using MACD and RSI
indicators enables investor to know the current trend and direction of stock prices, trading cycles
and profit percentage compared to conventional buy and hold strategy.Experimenting with the
optimum MACD and RSI indicators results in a real time outlook of profitable trading strategies
Vis a Vis with buy and hold approach, hence MACD and RSI can be taken as best tools of
technical analysis for profitable investment strategy.
Conclusion
Application of standard MACD and RSI indicators contribute to earning extra income than buy and
hold strategy is statistically rejected at 5% level of significance means that the buy and hold
strategy is more profitable than the standard MACD and standard RSI indicators.There is a
significant difference between the mean profitability of optimized MACD and RSI indicators, thus
we reject the hypothesis that there is no significant difference in results of optimized MACD and
RSI indicators for different sectors under study at 10% level of significance.This research
empirically proves that both the optimum MACD and optimum RSI indicators are useful for
profitable investment strategy and accepts the hypothesis that optimized MACD and RSI indicators
are more profitable than the conventional buy and hold strategy (EMH). Results indicate that the
number of trading cycles has been significantly reduced by using optimized MACD and RSI
Indicators.
References
Andrew, W. Lo, Mamaysky, Harry and Wang, Jiang (2000) “Foundations of Technical Analysis:
Computational Algorithms, Statistical Inference, And Empirical Implementation”, Journal
of Finance, Vol. 55, No. 4, pp. 1705-1765.
Antoniou, Antonios (1997), “Technical analysis, trading volume and market efficiency : evidence
from an emerging market”, Applied financial economics.- Routledge, ISSN 0960-3107,
ZDB-ID 10779735. - Vol. 7.1997, 4, p. 361-365
Appel, Gerald (2005) Technical Analysis: Power Tools For Active Investors, Financial Times/
Prentice Hall
Brock, W., Lakonishok, J., and LeBaron, B. (1992) “Simple Technical Trading Rules and the
Stochastic Properties of Stock Returns”, Journal of Finance, Vol. 47, Issue 5,
pp. 1731-1764
Chong, T.TL. and Ng, WK. (2008) “Technical analysis and the London stock exchange: testing the
MACD and RSI rules using the FT30”, Applied Economics Letter, Vol. 15, Issue 14,
pp. 1111-1114

Mahajan (2015). Asian Journal of Research in Banking and Finance,
Vol. 5, No.12, pp. 13-25.
24
Dejan Eric, Goran A, Srdjan R (2009) “Application of MACD and RVI indicators as functions of
investment strategy optimization on the financial market”, Journal of Economics and
Business, Vol. 27, No. 1, 2009, pp. 171-196
DedhySulistaiwan, JogiyantoHartona (2014) “Performance of Technical Analysis In Declining
Global Markets”, International Journal of Business and Finance Research”, Vol. 8, Issue 1,
pp. 113-122
Dorsey, Donald (1993) Technical Analysis of Stocks and Commodities, New York Gencay, R.
(1998) “Optimization of technical trading strategies and the profitability in security
markets”, Economics Letters, Vol. 59, pp. 249–254
Hung-Wei Lai, Cheng-Wei Chen, and Chin-Sheng Huang (2010) “Technical analysis, investment
psychology, and liquidity provision : evidence from Taiwan stock market “,Emerging
markets finance & trade, Vol. 46.2010, 5, p. 18-38
Lento, Camillo (2008) “A combined signal approach to technical analysis on the S&P 500”, Journal
of business & economics research.- ISSN 1542-4448, ZDB-ID 24421042. - Vol. 6.2008, 8,
p. 41-51
Murphy, John. J, (1999) Technical Analysis of the Financial Markets: AComprehensive Guide to
Trading Methods and Applications, New York: New York Institute of Finance
Moosa, Imad A, Li, Larry (2011) “Technical and Fundamental Trading in the Chinese Stock
Market: Evidence Based on Time-Series and Panel Data”, Emerging markets finance &
trade : a journal of the Society for the Study of Emerging Markets.- ME Sharpe, Inc, ISSN
1540-496X, ZDB-ID 20894727. - Vol. 47.2011, Suppl.1, p. 23-31
Park, Cheol-Ho; Irwin, Scott H.(2007) “What do we know about the profitability of technical
analysis? “, Journal of Economic Surveys.- Wiley Blackwell. - Vol. 21.2007, 4, p. 786-826
R. Rosillo, Fuente, Brugos (2013) Technical Analysis and the Spanish stock exchange: Testing the
RSI, MACD, Momentum indicator and stochastic rules using Spanish Market companies”,
Applied Economics, Vol 45,1541-1550
Sanjay Sehgal, Meenakshi Gupta, (2007) “Tests of Technical Analysis in India”, Vision: The
Journal of Business Perspective,vol. 11 no. 3 11-23
Terence C. Mills (1997) “Technical analysis and the London Stock Exchange: testing trading rules
using the FT30”, International Journal of Finance & Economics, Volume 2, Issue 4, pages
319–331
V. Subramanian, K. P. Balakrishnan, (2014) “Efficacy of refined MACD indicators: Evidence from
Indian Stock Market, The IUP Journal of Applied Finance, Vol. 20, No. 1, January 2014,
pp. 76-91

Mahajan (2015). Asian Journal of Research in Banking and Finance,
Vol. 5, No.12, pp. 13-25.
25
Vuković, Darko; Grubišić, Zoran; Jovanović, Ana (2012), “The use of moving averages in
technical analysis of securities”, Megatrend review : the international review of applied
economics.- ISSN 1820-3159, ZDB-ID 2209782X. - Vol. 9.2012, 1, p. 301-316
Related Documents


