64 International Journal of Engineering & Technology Research Volume-1, Issue-1, July – September, 2013, pp. 64-76, © IASTER 2013 www.iaster.com, ISSN Online: 2347-4904, Print: 2347-8292 Optimization of Injection Moulding Process for Multiple Quality Characteristics of Reprocessed ABS Products via the Integration of Taguchi Method and Grey Relational Analysis Ng Chin Fei 1 , Nik Mizamzul Mehat 1,2 , Shahrul Kamaruddin 1 1 School of Mechanical Engineering, Universiti Sains Malaysia, Engineering Campus, 14300, Nibong Tebal, Penang, Malaysia 2 Department of Mould Technology, Kolej Kemahiran Tinggi MARA, Balik Pulau,Genting, 11000, Balik Pulau, Penang, Malaysia ABSTRACT Determining the optimal parameters setting is performed routinely in the plastic injection moulding industry as it has a direct and dramatic influence on product quality and costs. This study emphasizes on the optimization of processing parameters to enhance multiple quality characteristics of the injection-moulded ring stopper, including hoop tensile strength, elongation at break and shrinkage. The specimens were prepared under different injection moulding conditions according to the design of experiments based on the Taguchi’s L 9 orthogonal array, by varying the melt temperature, packing switchover, injection pressure and packing pressure at second progressive stroke. Grey relational analysis is integrated with main effects analysis to obtain the optimal parameters setting. From the analysis, the optimal parameters setting which statistically result in the maximum hoop tensile strength and elongation at break, as well as minimum shrinkage for the ring stopper, are predicted to be the combination of melt temperature of 240°C, 80% of packing switchover, 1600MPa of injection pressure and 800MPa of packing pressure at second progressive stroke. On the other hand, the results also revealed that the melt temperature was found to be the most decisive factor whereas the packing pressure at second progressive stroke has the least influence in affecting the hoop tensile strength, elongation at break and shrinkage of the ring stopper in this study. Keywords: Grey Relational Analysis, Taguchi Method, Optimization, Multiple Quality Characteristics, Hoop Tensile Strength. 1. INTRODUCTION Injection moulding is the most important manufacturing process in the plastics industry as more than 1/3 of all thermoplastic materials are injection moulded and more than half of all polymer processing equipments are for injection moulding [1]. This is because the injection moulding process has the highest efficiency, largest yield, and highest dimensional accuracy among all the processing methods [2]. In addition, the injection-moulded products which exhibit good dimensional accuracy and excellent surface finish, has further proven the value of injection moulding process [3]. However, the complexity of injection moulding process has created a very intense effort to keep the quality characteristics under control. There are many factors contributing to the occurrence of defects that affect the quality of injection-moulded parts during the production such as material selection, part and mould designs and processing parameters. Inappropriate combination of material selection, part and mould design and the processing parameters can cause numerous production problems (e.g. product defects, long lead time, much scrap, high production costs, etc.), reduce the competitive price advantage, and decrease the company’s profitability.

Welcome message from author
This document is posted to help you gain knowledge. Please leave a comment to let me know what you think about it! Share it to your friends and learn new things together.
Transcript
64
International Journal of Engineering & Technology Research
Volume-1, Issue-1, July – September, 2013, pp. 64-76, © IASTER 2013
www.iaster.com, ISSN Online: 2347-4904, Print: 2347-8292
Optimization of Injection Moulding Process for Multiple
Quality Characteristics of Reprocessed ABS Products via the
Integration of Taguchi Method and Grey Relational Analysis
Ng Chin Fei1, Nik Mizamzul Mehat
1,2, Shahrul Kamaruddin
1
1School of Mechanical Engineering, Universiti Sains Malaysia,
Engineering Campus, 14300, Nibong Tebal, Penang, Malaysia 2Department of Mould Technology, Kolej Kemahiran Tinggi MARA,
Balik Pulau,Genting, 11000, Balik Pulau, Penang, Malaysia
ABSTRACT
Determining the optimal parameters setting is performed routinely in the plastic injection
moulding industry as it has a direct and dramatic influence on product quality and costs. This
study emphasizes on the optimization of processing parameters to enhance multiple quality
characteristics of the injection-moulded ring stopper, including hoop tensile strength, elongation
at break and shrinkage. The specimens were prepared under different injection moulding
conditions according to the design of experiments based on the Taguchi’s L9 orthogonal array, by
varying the melt temperature, packing switchover, injection pressure and packing pressure at
second progressive stroke. Grey relational analysis is integrated with main effects analysis to
obtain the optimal parameters setting. From the analysis, the optimal parameters setting which
statistically result in the maximum hoop tensile strength and elongation at break, as well as
minimum shrinkage for the ring stopper, are predicted to be the combination of melt temperature
of 240°C, 80% of packing switchover, 1600MPa of injection pressure and 800MPa of packing
pressure at second progressive stroke. On the other hand, the results also revealed that the melt
temperature was found to be the most decisive factor whereas the packing pressure at second
progressive stroke has the least influence in affecting the hoop tensile strength, elongation at
break and shrinkage of the ring stopper in this study.
Keywords: Grey Relational Analysis, Taguchi Method, Optimization, Multiple Quality
Characteristics, Hoop Tensile Strength.
1. INTRODUCTION
Injection moulding is the most important manufacturing process in the plastics industry as more
than 1/3 of all thermoplastic materials are injection moulded and more than half of all polymer
processing equipments are for injection moulding [1]. This is because the injection moulding
process has the highest efficiency, largest yield, and highest dimensional accuracy among all the
processing methods [2]. In addition, the injection-moulded products which exhibit good
dimensional accuracy and excellent surface finish, has further proven the value of injection
moulding process [3]. However, the complexity of injection moulding process has created a very
intense effort to keep the quality characteristics under control. There are many factors contributing
to the occurrence of defects that affect the quality of injection-moulded parts during the production
such as material selection, part and mould designs and processing parameters. Inappropriate
combination of material selection, part and mould design and the processing parameters can cause
numerous production problems (e.g. product defects, long lead time, much scrap, high production
costs, etc.), reduce the competitive price advantage, and decrease the company’s profitability.
International Journal of Engineering & Technology Research
Volume-1, Issue-1, July – September, 2013, www.iaster.com
ISSN (O) 2347- 4904
(P) 2347-8292
65
Therefore, determining the optimal parameters setting is performed routinely in the plastic
injection moulding industry as it has a direct and dramatic influence on product quality and costs.
Previously, the traditional method of multi-factorial experimentation is the ‘‘change-one-factor-at-
a-time’’ method. It is that only one factor is varied, while keeping all the other factors fixed at a
specific set of conditions. This method is popular due to its simplicity. However, in a fiercely
competitive market, the practice of the ‘‘change-one-factor-at-a-time’’ method is no longer
sufficient to meet the challenges of globalization especially at the point where the disadvantages
outweigh its advantages.
To date, Taguchi method as a robust experimental design is commonly used by the researchers to
obtain the best combination set of factors/levels with lowest cost solution to achieve the product
quality requirements. It consists of several functional elements that can provide the necessary
contribution needed to enhance the optimization implementation especially the Taguchi’s
orthogonal array. From the review of Ilzarbe et al [4], Taguchi’s orthogonal matrices achieved the
highest usage in engineering application with 31% outweighing other types of experimental design
due to its practicality. Liu and Chang [5] employed the Taguchi method to optimize seven
processing parameters, including melt temperature, mould temperature, injection speed, injection
pressure, short-shot size, gas injection pressure, gas injection delay time, to improve surface
roughness in gas assisted injection moulding. Li et al [6] also exploited the L9 experimental design
to study the effect of four processing parameters on the weld-line of the right door of copy
machine which was modelled with three gates. In another study, Wu and Liang [7] further
improved the weld-line strength of an injection-moulded part by utilizing the Taguchi optimization
method. Ozcelik et al [8] conducted experiments adopting a L9 orthogonal array to optimize the
processing parameters of ABS mouldings on multiple quality characteristics such as elasticity
module, tensile strength at yield, tensile strain at yield, tensile strain at break, flexural modules and
Izod impact strength. However, the results generated one optimal combination of processing
parameters for different performance measure, indicating that the multi-response optimization was
ineffective as it is impractical to obtain so many optimal parameters setting to improve multiple
quality characteristics simultaneously.
Taguchi’s contribution to the processing optimization has been far ranging as it provides a
considerable reduction of time and effort needed to determine the important factors affecting
product quality as well as obtain the optimal process conditions. Nevertheless, the Taguchi method
is initially designed to be used for a single response optimization. Unfortunately, it is widely
known that most industrial products manufactured today possess more than one quality response
and their quality characteristics are considered by the customers [9]. There are some obvious
shortcomings in performing the Taguchi method single-handedly when more than one quality
characteristic is considered in the optimization. An engineering judgement is required to define a
weight for each quality characteristic but it will increase uncertainty during the decision-making
process. Therefore, in view of the fact that the distinction of grey relational analysis (GRA) is
attempted to integrate multiple responses, it is feasible to combine Taguchi method with GRA to
provide an optimal constitute of processing parameters for the cases with multiple quality
characteristics to accomplish the prerequisites of optimization effectively.
The grey relational analysis (GRA) was first proposed by Deng [10] to optimize the multi-response
problem by making use of the grey relational coefficient and grey relational grade. The grey
relational coefficient can express the relationship between the desired and actual experimental
results and the grey relational grade is simultaneously computed corresponding to each quality
International Journal of Engineering & Technology Research
Volume-1, Issue-1, July – September, 2013, www.iaster.com
ISSN (O) 2347- 4904
(P) 2347-8292
66
characteristic. Few works have studied the optimization of injection moulding process parameters
by using the integration of Taguchi method and GRA. Fung [11] utilized the Taguchi based
orthogonal array and GRA to improve the wear volume losses in two sliding directions which are
parallel and perpendicular. Similar to the previous work, two studies were carried out by Fung et al
[2] and Yang [13] using the same procedures to optimize the processing parameters for multiple
quality characteristics. The former study focused on the concurrent improvement of yield stress
and elongation of PC/ABS blend whereas the latter study examined the effect of processing
parameters on the mechanical and tribological properties of PC composites, including ultimate
stress, surface roughness and friction coefficient. Kuo and Su [14] optimized the processing
parameters to improve the V cut depth and angle of a LCD light-guide plate and analyzed the
results thoroughly based on the Taguchi method. They performed the main effects analysis and
ANOVA to evaluate the effect of processing parameters on multiple quality characteristics instead
of referring to the comparability sequence as shown in GRA. It was found that the percentage
errors for the confirmation experiment values and the predicted performance values at optimal
process conditions were less than 5% for both depth and angle of the LCD light-guide plate.
Therefore, this study emphasized on the optimization of processing parameters via the integration
of the Taguchi method and grey relational analysis to improve the product quality of a ring stopper
which is made from an ABS blend comprising 40% of recyclates. Four parameters of melt
temperature, packing switchover, injection pressure and packing pressure at second progressive
stroke, each at three levels were selected as the control conditions. On the other hand, three quality
characteristics of the mechanical properties and dimensional stability are selected, including hoop
tensile strength, elongation at break and shrinkage for the injection-moulded ring stopper.
Simultaneously, the grey relational analysis was applied to determine the optimal combination of
process parameters and the most influential factor for the injection moulding process can be
determined in this study.
2. GREY RELATIONAL ANALYSIS
2.1 Data Pre-processing
Let the original reference sequence and comparability sequences are represented as and
, i = 1, 2,…, m; k = 1, 2,…, n, respectively. A data preprocessing is required in view of the
fact that the range and unit in one data may differ from the others. Moreover, it is necessary when
the sequence scatter range is too large or the target sequence directions are different. The data
preprocessing involves the transfer of the original sequence to a comparable sequence. There are
four methodologies of data preprocessing available for the grey relational analysis based on the
characteristics of the data sequence as follows:
The-larger-the better characteristic:
(1)
The-smaller-the-better characteristic:
(2)
International Journal of Engineering & Technology Research
Volume-1, Issue-1, July – September, 2013, www.iaster.com
ISSN (O) 2347- 4904
(P) 2347-8292
67
The-nominal-the-better characteristic:
(3)
Alternatively, the original sequence can be normalized using the simplest methodology in which
the values of the original sequence can be divided by the first value of the sequence.
(4)
where = the original sequence
= the sequence after the data preprocessing
= the largest value of
= the smallest value of
2.2 Grey Relational Coefficient and Grey Relational Grade
Following data pre-processing, a grey relational coefficient can be calculated with the pre-
processed sequences. The grey relational coefficient is defined as follows:
0 < 1 (5)
where is the deviation sequence of the reference sequence, and the comparability
sequence, , namely
= distinguishing coefficient .
On the other hand, the grey relational grade is a weighting sum of the grey relational coefficient
and is defined as follows:
(6)
Here, the gray relational grade represents the level of correlation between the reference
sequence and the comparability sequence. If the two sequences are identically coincidence, then
the value of grey relational grade is equal to one. The grey relational grade also indicates the
degree of influence that the comparability sequence could exert on the reference sequence.
Therefore, if a particular comparability sequence is more important to the reference sequence than
the other comparability sequences, the grey relational grade for that comparability sequence and
reference sequence will exceed that for other grey relational grades. Grey relational analysis is
actually a measurement of absolute value of data difference between sequences and could be used
to measure approximation correlation between sequences.
International Journal of Engineering & Technology Research
Volume-1, Issue-1, July – September, 2013, www.iaster.com
ISSN (O) 2347- 4904
(P) 2347-8292
68
3.0 EXPERIMENTAL
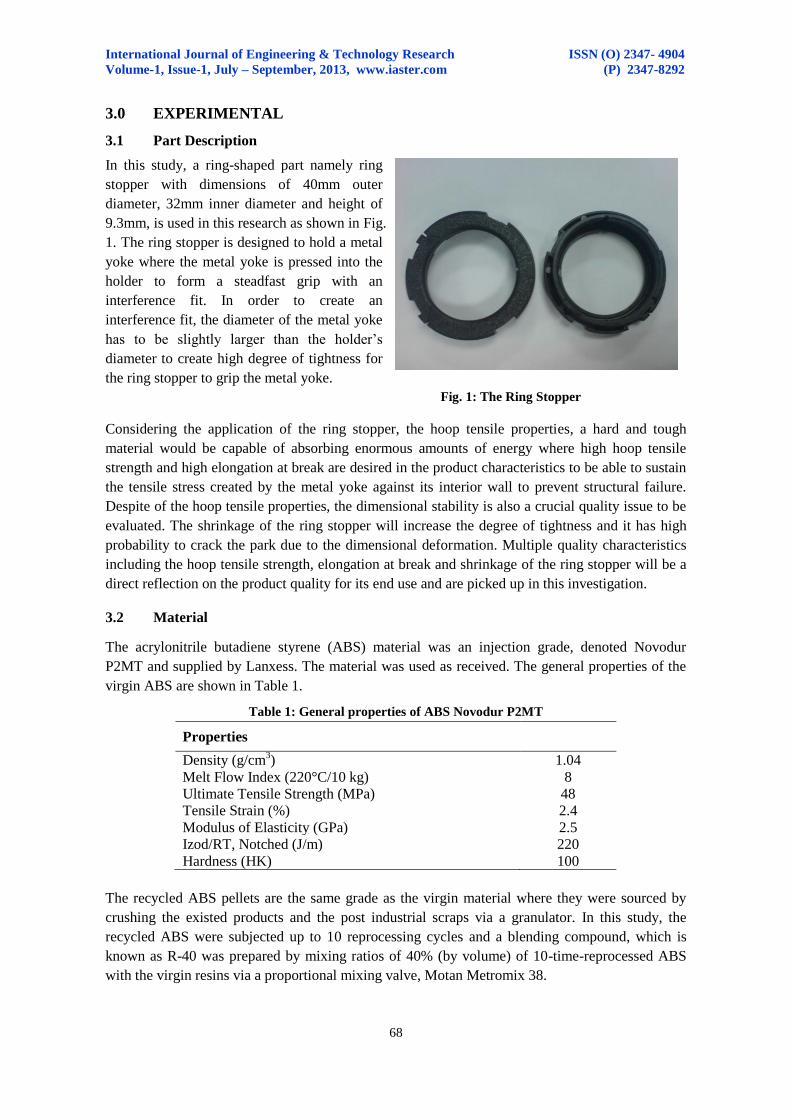
3.1 Part Description
In this study, a ring-shaped part namely ring
stopper with dimensions of 40mm outer
diameter, 32mm inner diameter and height of
9.3mm, is used in this research as shown in Fig.
1. The ring stopper is designed to hold a metal
yoke where the metal yoke is pressed into the
holder to form a steadfast grip with an
interference fit. In order to create an
interference fit, the diameter of the metal yoke
has to be slightly larger than the holder’s
diameter to create high degree of tightness for
the ring stopper to grip the metal yoke.
Fig. 1: The Ring Stopper
Considering the application of the ring stopper, the hoop tensile properties, a hard and tough
material would be capable of absorbing enormous amounts of energy where high hoop tensile
strength and high elongation at break are desired in the product characteristics to be able to sustain
the tensile stress created by the metal yoke against its interior wall to prevent structural failure.
Despite of the hoop tensile properties, the dimensional stability is also a crucial quality issue to be
evaluated. The shrinkage of the ring stopper will increase the degree of tightness and it has high
probability to crack the park due to the dimensional deformation. Multiple quality characteristics
including the hoop tensile strength, elongation at break and shrinkage of the ring stopper will be a
direct reflection on the product quality for its end use and are picked up in this investigation.
3.2 Material
The acrylonitrile butadiene styrene (ABS) material was an injection grade, denoted Novodur
P2MT and supplied by Lanxess. The material was used as received. The general properties of the
virgin ABS are shown in Table 1.
Table 1: General properties of ABS Novodur P2MT
Properties
Density (g/cm3) 1.04
Melt Flow Index (220°C/10 kg) 8
Ultimate Tensile Strength (MPa) 48
Tensile Strain (%) 2.4
Modulus of Elasticity (GPa) 2.5
Izod/RT, Notched (J/m) 220
Hardness (HK) 100
The recycled ABS pellets are the same grade as the virgin material where they were sourced by
crushing the existed products and the post industrial scraps via a granulator. In this study, the
recycled ABS were subjected up to 10 reprocessing cycles and a blending compound, which is
known as R-40 was prepared by mixing ratios of 40% (by volume) of 10-time-reprocessed ABS
with the virgin resins via a proportional mixing valve, Motan Metromix 38.
International Journal of Engineering & Technology Research
Volume-1, Issue-1, July – September, 2013, www.iaster.com
ISSN (O) 2347- 4904
(P) 2347-8292
69
3.3 Experimental Parameters and Design
A preliminary experiment was carried out by using Cadmould 3D-F to determine adequate values
of the processing parameters that are able to produce a part without any aesthetic defect such as
short shot, flash, sink mark, silver streaks and etc. Based on the simulation results, the adequate
values of the processing parameters were set and it was found out that using two progressive
strokes in packing process can significantly lower the probability of the sink marks defect. The
optimization experiment was carried out using an Arburg injection moulding machine model
270M Allrounder 350-90. Four processing parameters including melting temperature, packing
switchover, injection pressure, packing pressure at second stroke, were selected for optimization
with the aim of enhancing the hoop tensile strength, elongation at break and shrinkage of
reprocessed ABS products. Other parameters such as mould temperature (60 °C), packing pressure
at first stroke (600 bars), packing time at first and second stroke (2 and 3 seconds), cooling time
(10 seconds) and stroke distance (200 mm) were kept constant during the experimentation. The
processing parameters and their effects on the performance characteristics, each parameter was set
at three levels. Table 2 shows the injection moulding parameters and their levels.
Table 2: Processing parameters and parameter levels
Column Parameter Level 1 Level 2 Level 3
A Melting temperature (°C) 240 250 260
B Packing Switchover (%) 75 80 85
C Injection Pressure (bar) 1400 1500 1600
D Packing Pressure – Stroke 2 (bar) 600 700 800
After determining the number of processing parameters and their levels, an appropriate orthogonal
array has to be established for laying out the design of experiments that need to be carried out. For
the optimization experiment of four processing parameters each at three levels, a L9 OA was
chosen to allocate the processing parameters including melting temperature, packing switchover,
injection pressure, holding pressure at second stroke. Table 3 shows the layout of L9 OA in the
design of experiment.
Table 3: Design of experiment using L9 orthogonal array
Trial No. A B C D
1 1 1 1 1
2 1 2 2 2
3 1 3 3 3
4 2 1 2 3
5 2 2 3 1
6 2 3 1 2
7 3 1 3 2
8 3 2 1 3
9 3 3 2 1
As illustrated in Table 3, melting temperature was designated as factor A, packing switchover was
assigned as factor B, injection pressure and packing pressure at second stroke were designated as
factor C and D correspondingly. There are total nine experimental trials to be conducted under
different combination of process conditions as shown in the L9 OA, in order to obtain the optimal
processing parameters for the injection-moulded ring stopper.
International Journal of Engineering & Technology Research
Volume-1, Issue-1, July – September, 2013, www.iaster.com
ISSN (O) 2347- 4904
(P) 2347-8292
70
3.4 Quality Testing
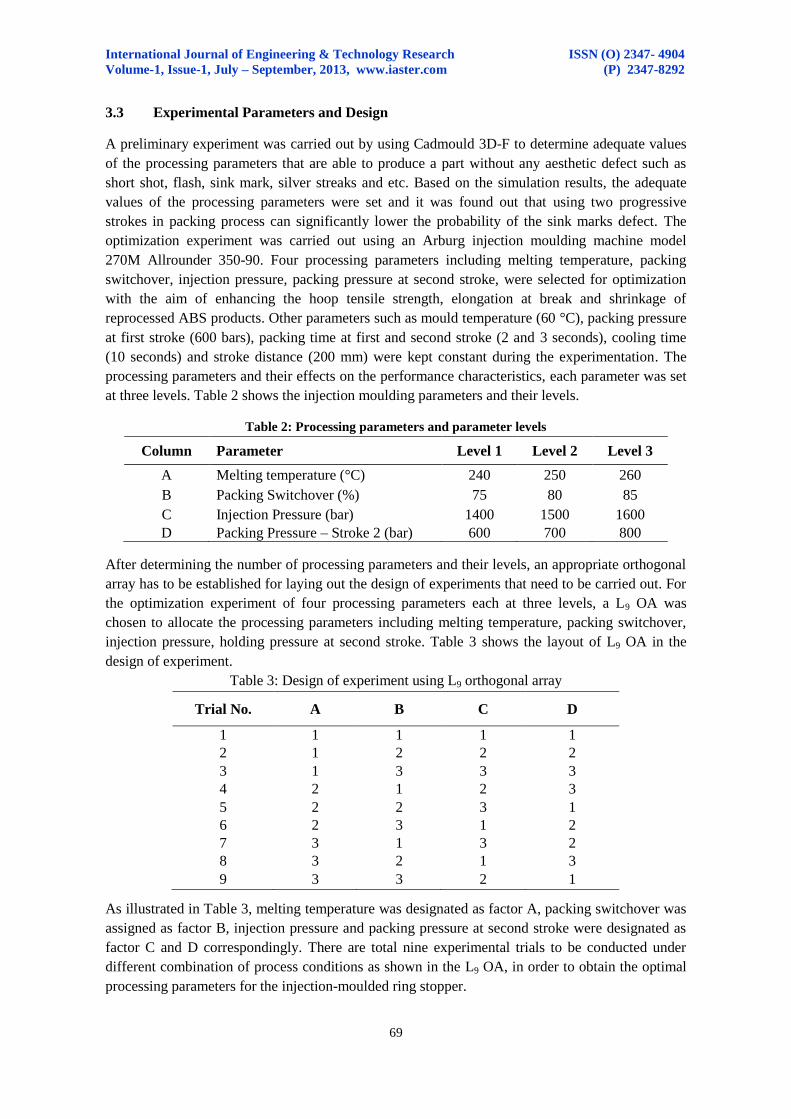
3.4.1 Hoop Tensile Test
Due to the limitations of the dimension and shape of the component, the hoop tensile strength and
elongation at break, were measured in accordance with ASTM D2290-04, using an Instron 3367
series table-mounted universal testing machine. A split-disc test fixture was fabricated accordingly,
as shown in Fig. 2. The test specimen was mounted on the test fixture where the reduced sections
were placed at the side of split. This ensured that the specimen was centered on the line joining the
fixture’s points of attachment with the test machine (refer Fig. 3). The crosshead speed was 2.54
mm/min and five specimens were tested for each reprocessing cycle. The hoop tensile strength at
yield of the specimens was calculated using the appropriate equation as stated in ASTM D2290-04:
1 1 2 2/ ( )a bP d b d b (7)
where: σa = hoop yield or ultimate tensile stress of the specimen, MPa
Pb = maximum or breaking load, N
d1, d2 = thickness at reduced or test section, mm
b1, b2 = width of reduced or test section, mm
On the other hand, the elongation at break of the specimens was computed by taking the
percentage of the elongated displacement at maximum load over the inner diameter of the test
specimen.
ez = (lz – lo)/lo x 100% (8)
where ez is elongation at break in percentage, lz is the final length of the specimen after the hoop
tensile test and lo is the original length of the specimen.
Fig. 2: Split disk test fixture Fig. 3: Setup of split disk test fixture
3.4.2 Shrinkage Test
Rax Vision DC 3000 Mitutoyo profile projector was used to measure the outer diameter of the part.
The profile projector is used for measuring two-dimensional contours of the specimens. With large
magnifications and micrometer readouts, this profile projector could ensure fairly accurate
measurements compared to vernier calliper and micrometer. The geometrical measurement was
made by a micrometer with the assistance of a magnifier lens of a ten-time magnification using
International Journal of Engineering & Technology Research
Volume-1, Issue-1, July – September, 2013, www.iaster.com
ISSN (O) 2347- 4904
(P) 2347-8292
71
diascopic illumination. In order to ensure the integrity of the comparison procedure, four injection-
moulded parts which come from the same batch were measured to determine the repeatability of
the part geometry. Finally, the relative shrinkage of the part was calculated with the following
equation:
S = (D – Dm)/Dm x 100% (9)
where S is shrinkage, D is the reading of diameter measurement using profile projector and Dm is
the mould dimension.
4. RESULTS AND DISCUSSION
4.1 The best experimental run
The experimental run and experimental results from on-line performance were listed in Table 4.
Typically, higher values of the hoop tensile strength and elongation at break in the ring stopper as
the target values are desirable. Thus, the data sequences have the-larger-the-better characteristic.
On the other hand, the lower values of the shrinkage in the ring stopper as the target values are
desirable and the data sequences have the-smaller-the-better characteristic.
Table 4: Experimental results of multiple quality characteristics for ring stopper
Experimental
run
Factor
Result
A B C D
X (MPa) Y (%) Z (%)
1 240 75 1400 600 49.701 3.829 0.184
2 240 80 1500 700 50.333 3.772 0.052
3 240 85 1600 800 49.307 3.832 0.015
4 250 75 1500 800 49.486 3.831 0.075
5 250 80 1600 600 49.636 3.759 0.005
6 250 85 1400 700 48.506 3.731 0.147
7 260 75 1600 700 48.392 3.768 0.116
8 260 80 1400 800 48.405 3.758 0.160
9 260 85 1500 600 48.008 3.688 0.133
The values of the hoop tensile strength, elongation at break and shrinkage are set to be the
reference sequence , k = 1–3. Moreover, the results of nine experiments were the
comparability sequences , i = 1, 2, 3,…, 9, k = 1–3. Table 5 lists all of the sequences
following data preprocessing using Equation (1) and (2), where the reference and comparability
sequences are denoted as and , respectively.
The deviation sequences can be calculated as follows:
So, = (0.2718, 0.0208, 1.0000)
The same calculating method was performed for i = 1–9 and the results of all for i = 1–9 are
listed in Table 5.
International Journal of Engineering & Technology Research
Volume-1, Issue-1, July – September, 2013, www.iaster.com
ISSN (O) 2347- 4904
(P) 2347-8292
72
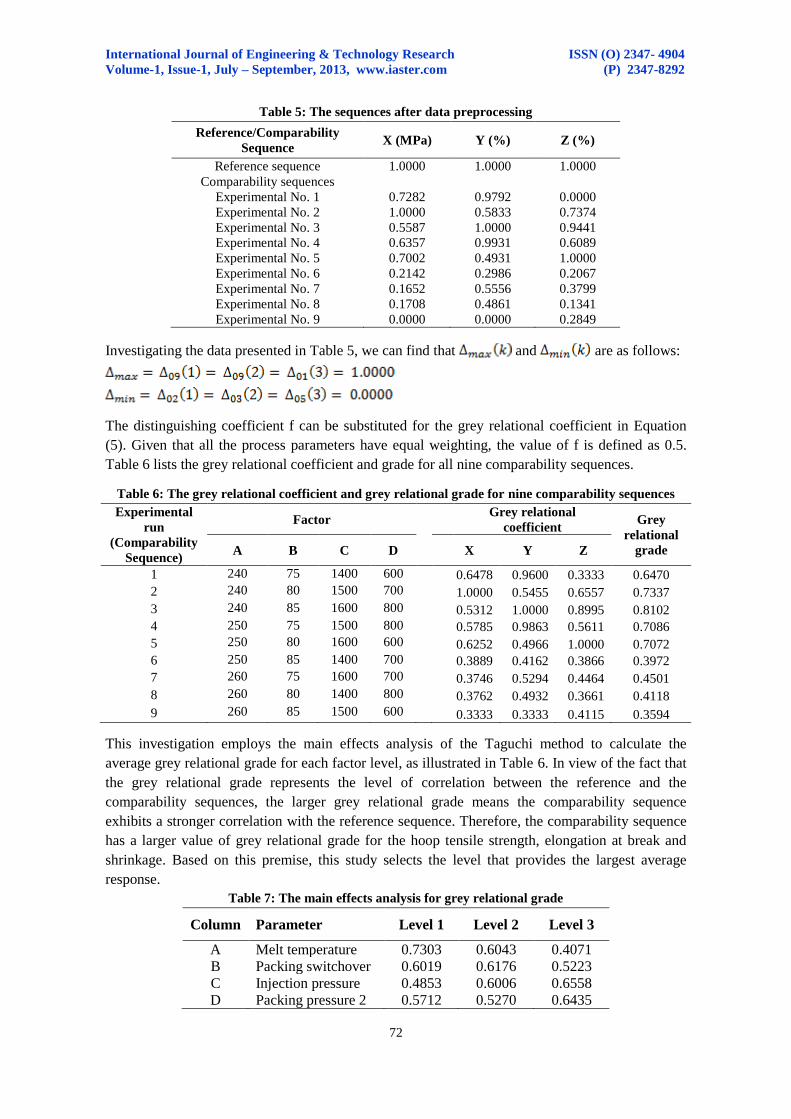
Table 5: The sequences after data preprocessing
Reference/Comparability
Sequence X (MPa) Y (%) Z (%)
Reference sequence 1.0000 1.0000 1.0000
Comparability sequences
Experimental No. 1 0.7282 0.9792 0.0000
Experimental No. 2 1.0000 0.5833 0.7374
Experimental No. 3 0.5587 1.0000 0.9441
Experimental No. 4 0.6357 0.9931 0.6089
Experimental No. 5 0.7002 0.4931 1.0000
Experimental No. 6 0.2142 0.2986 0.2067
Experimental No. 7 0.1652 0.5556 0.3799
Experimental No. 8 0.1708 0.4861 0.1341
Experimental No. 9 0.0000 0.0000 0.2849
Investigating the data presented in Table 5, we can find that and are as follows:
The distinguishing coefficient f can be substituted for the grey relational coefficient in Equation
(5). Given that all the process parameters have equal weighting, the value of f is defined as 0.5.
Table 6 lists the grey relational coefficient and grade for all nine comparability sequences.
Table 6: The grey relational coefficient and grey relational grade for nine comparability sequences
Experimental
run
(Comparability
Sequence)
Factor Grey relational
coefficient Grey
relational
grade A B C D
X Y Z
1 240 75 1400 600 0.6478 0.9600 0.3333 0.6470
2 240 80 1500 700 1.0000 0.5455 0.6557 0.7337
3 240 85 1600 800 0.5312 1.0000 0.8995 0.8102
4 250 75 1500 800 0.5785 0.9863 0.5611 0.7086
5 250 80 1600 600 0.6252 0.4966 1.0000 0.7072
6 250 85 1400 700 0.3889 0.4162 0.3866 0.3972
7 260 75 1600 700 0.3746 0.5294 0.4464 0.4501
8 260 80 1400 800 0.3762 0.4932 0.3661 0.4118
9 260 85 1500 600 0.3333 0.3333 0.4115 0.3594
This investigation employs the main effects analysis of the Taguchi method to calculate the
average grey relational grade for each factor level, as illustrated in Table 6. In view of the fact that
the grey relational grade represents the level of correlation between the reference and the
comparability sequences, the larger grey relational grade means the comparability sequence
exhibits a stronger correlation with the reference sequence. Therefore, the comparability sequence
has a larger value of grey relational grade for the hoop tensile strength, elongation at break and
shrinkage. Based on this premise, this study selects the level that provides the largest average
response.
Table 7: The main effects analysis for grey relational grade
Column Parameter Level 1 Level 2 Level 3
A Melt temperature 0.7303 0.6043 0.4071
B Packing switchover 0.6019 0.6176 0.5223
C Injection pressure 0.4853 0.6006 0.6558
D Packing pressure 2 0.5712 0.5270 0.6435
International Journal of Engineering & Technology Research
Volume-1, Issue-1, July – September, 2013, www.iaster.com
ISSN (O) 2347- 4904
(P) 2347-8292
73
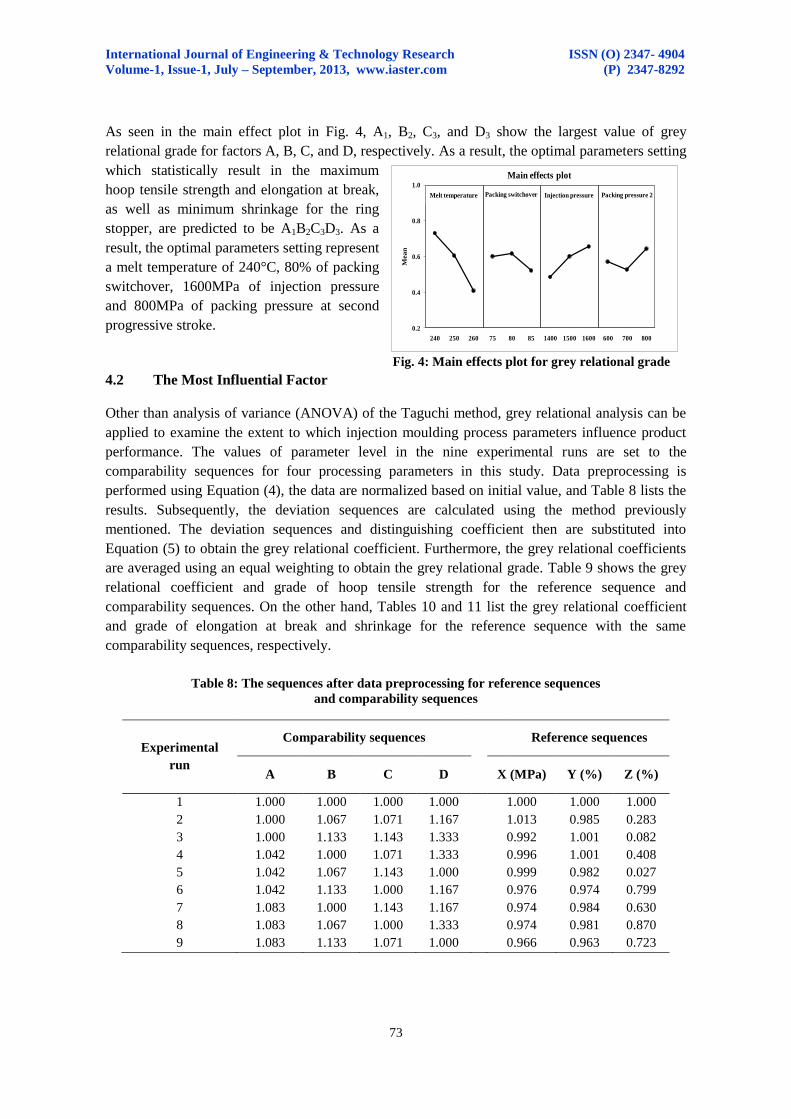
As seen in the main effect plot in Fig. 4, A1, B2, C3, and D3 show the largest value of grey
relational grade for factors A, B, C, and D, respectively. As a result, the optimal parameters setting
which statistically result in the maximum
hoop tensile strength and elongation at break,
as well as minimum shrinkage for the ring
stopper, are predicted to be A1B2C3D3. As a
result, the optimal parameters setting represent
a melt temperature of 240°C, 80% of packing
switchover, 1600MPa of injection pressure
and 800MPa of packing pressure at second
progressive stroke.
Fig. 4: Main effects plot for grey relational grade
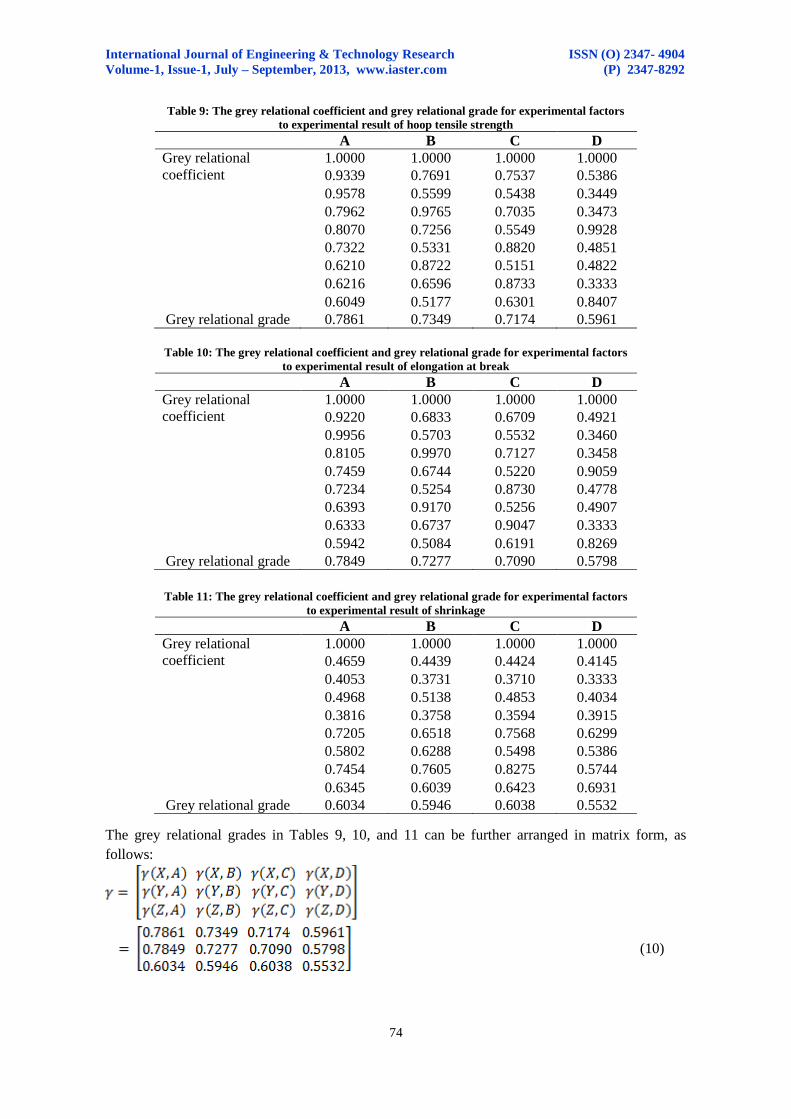
4.2 The Most Influential Factor
Other than analysis of variance (ANOVA) of the Taguchi method, grey relational analysis can be
applied to examine the extent to which injection moulding process parameters influence product
performance. The values of parameter level in the nine experimental runs are set to the
comparability sequences for four processing parameters in this study. Data preprocessing is
performed using Equation (4), the data are normalized based on initial value, and Table 8 lists the
results. Subsequently, the deviation sequences are calculated using the method previously
mentioned. The deviation sequences and distinguishing coefficient then are substituted into
Equation (5) to obtain the grey relational coefficient. Furthermore, the grey relational coefficients
are averaged using an equal weighting to obtain the grey relational grade. Table 9 shows the grey
relational coefficient and grade of hoop tensile strength for the reference sequence and
comparability sequences. On the other hand, Tables 10 and 11 list the grey relational coefficient
and grade of elongation at break and shrinkage for the reference sequence with the same
comparability sequences, respectively.
Table 8: The sequences after data preprocessing for reference sequences
and comparability sequences
Experimental
run
Comparability sequences
Reference sequences
A B C D
X (MPa) Y (%) Z (%)
1 1.000 1.000 1.000 1.000 1.000 1.000 1.000
2 1.000 1.067 1.071 1.167 1.013 0.985 0.283
3 1.000 1.133 1.143 1.333 0.992 1.001 0.082
4 1.042 1.000 1.071 1.333 0.996 1.001 0.408
5 1.042 1.067 1.143 1.000 0.999 0.982 0.027
6 1.042 1.133 1.000 1.167 0.976 0.974 0.799
7 1.083 1.000 1.143 1.167 0.974 0.984 0.630
8 1.083 1.067 1.000 1.333 0.974 0.981 0.870
9 1.083 1.133 1.071 1.000 0.966 0.963 0.723
0.2
0.4
0.6
0.8
1.0
240 250 260 75 80 85 1400 1500 1600 600 700 800
Mea
n
Main effects plot
Melt temperature Packing pressure 2Injection pressurePacking switchover
International Journal of Engineering & Technology Research
Volume-1, Issue-1, July – September, 2013, www.iaster.com
ISSN (O) 2347- 4904
(P) 2347-8292
74
Table 9: The grey relational coefficient and grey relational grade for experimental factors
to experimental result of hoop tensile strength
A B C D
Grey relational
coefficient
1.0000 1.0000 1.0000 1.0000
0.9339 0.7691 0.7537 0.5386
0.9578 0.5599 0.5438 0.3449
0.7962 0.9765 0.7035 0.3473
0.8070 0.7256 0.5549 0.9928
0.7322 0.5331 0.8820 0.4851
0.6210 0.8722 0.5151 0.4822
0.6216 0.6596 0.8733 0.3333
0.6049 0.5177 0.6301 0.8407
Grey relational grade 0.7861 0.7349 0.7174 0.5961
Table 10: The grey relational coefficient and grey relational grade for experimental factors
to experimental result of elongation at break
A B C D
Grey relational
coefficient
1.0000 1.0000 1.0000 1.0000
0.9220 0.6833 0.6709 0.4921
0.9956 0.5703 0.5532 0.3460
0.8105 0.9970 0.7127 0.3458
0.7459 0.6744 0.5220 0.9059
0.7234 0.5254 0.8730 0.4778
0.6393 0.9170 0.5256 0.4907
0.6333 0.6737 0.9047 0.3333
0.5942 0.5084 0.6191 0.8269
Grey relational grade 0.7849 0.7277 0.7090 0.5798
Table 11: The grey relational coefficient and grey relational grade for experimental factors
to experimental result of shrinkage
A B C D
Grey relational
coefficient
1.0000 1.0000 1.0000 1.0000
0.4659 0.4439 0.4424 0.4145
0.4053 0.3731 0.3710 0.3333
0.4968 0.5138 0.4853 0.4034
0.3816 0.3758 0.3594 0.3915
0.7205 0.6518 0.7568 0.6299
0.5802 0.6288 0.5498 0.5386
0.7454 0.7605 0.8275 0.5744
0.6345 0.6039 0.6423 0.6931
Grey relational grade 0.6034 0.5946 0.6038 0.5532
The grey relational grades in Tables 9, 10, and 11 can be further arranged in matrix form, as
follows:
(10)
International Journal of Engineering & Technology Research
Volume-1, Issue-1, July – September, 2013, www.iaster.com
ISSN (O) 2347- 4904
(P) 2347-8292
75
By comparing Row 1, Row 2 and Row 3, the magnitude of the grey relational grade of four
processing parameters on multiple quality characteristics of the ring stopper is determined. In Row
1, γ(X, A) > γ(X, B) > γ(X, C) > γ(X, D), which means that the sequential order of significance of
the processing parameters to the hoop tensile strength was parameter A, B, C and D in sequence.
In Row 2, it is also γ(X, A) > γ(X, B) > γ(X, C) > γ(X, D). The sequential order of significance of
the processing parameters to the elongation at break was found to be similar to the previous
performance measure. On the other hand, in Row 3, the result shows that γ(X, C) > γ(X, A) > γ(X,
B) > γ(X, D). Therefore, the significance ranking of the processing parameters to shrinkage was
determined as factor C, A, B and D in order.
The degree of influence of the processing parameters on the multiple quality characteristics can be
calculated and the most decisive factor will be given the maximum value of the row for each quality
characteristics. As shown in grey relational grade matrix (10), it can be observed that the melt
temperature is the most influential processing parameter which demonstrates the strongest
comparability sequence among the injection moulding processing parameters, with the highest values
for overall grey relational grades, [γ (X, A) > γ(Y, A) > γ(Z, A)] = (0.7861, 0.7849, 0.6034). The
analysis revealed that the melt temperature had the strongest correlation to the hoop tensile strength,
elongation at break and shrinkage. In addition, γ (X, A) = 0.7861 is also the maximum entries of the
matrix, indicating that it is the most evident that the injection moulding parameters changed for hoop
tensile strength effect. Nevertheless, packing pressure at second progressive stroke was found to have
the least importance on hoop tensile strength, elongation at break and shrinkage simultaneously with
the lowest grey relational grades [γ (X, D) > γ(Y, D) > γ(Z, D)] = (0.5961, 0.5798, 0.5532). As a result,
the melt temperature was the most influential parameter to the product quality of the ring stopper
whereas the result was vice versa for the packing pressure at second progressive stroke.
5. CONCLUSION
The grey relational analysis based on the Taguchi method’s orthogonal array and main effects
analysis was proposed as a way of effectively optimizing the processing parameters for injection
moulding process to the ring stopper of a case study. Considering the functionality of the ring
stopper, the mechanical properties of hoop tensile strength and elongation at break and the
dimensional stability of shrinkage are selected to be the performance measure of the part. Through
a series of analysis and optimization, the results are summarized as follows:
1. From the main effects analysis of the average grey relational grade, it was found that the largest
value of grey relational grade for melt temperature, packing switchover, injection pressure and
packing pressure at second progressive stroke was 240°C, 80%, 1600MPa and 800MPa,
respectively. Therefore, the optimal combination of processing parameters for the ring stopper
to achieve maximum hoop tensile strength and elongation at break, as well as minimum
shrinkage was determined as A1B2C3D3 when multiple quality characteristics are
simultaneously considered.
2. Grey relational analysis can be applied to determine the significance of the processing
parameters and arrange them according to the sequential order of importance. For hoop tensile
strength and elongation at break, the significance of the processing parameters lies in the
sequential order of melt temperature, packing switchover, injection pressure and packing
pressure at second progressive stroke for both performance measures. On the other hand, the
importance of the processing parameters to shrinkage, in sequence, is injection pressure, melt
temperature, packing switchover and packing pressure at second progressive stroke.
International Journal of Engineering & Technology Research
Volume-1, Issue-1, July – September, 2013, www.iaster.com
ISSN (O) 2347- 4904
(P) 2347-8292
76
3. The melt temperature showed the strongest comparability sequence among the four important
injection moulding process parameters investigated in this study whereas the result is vice versa
for the packing pressure at second progressive stroke. It means that the melt temperature had
the strongest correlation to hoop tensile strength, elongation at break and shrinkage while the
packing pressure at second progressive stroke showed the least correlation to all the
performance measures. The melt temperature was determined as the most influential factor to
the product quality of the ring stopper.
REFERENCES
[1] C. Shen, L. Wang, W. Cao, L. Qian, Investigation of the Effect of Molding Variables on
Sink Marks of Plastic Injection Molded Parts Using Taguchi DOE Technique, Polymer-
Plastics Technology and Engineering, 46, 2007, 219-225.
[2] F.C. Kung, Y.J. Weng, Optimizations of the Processing Parameters of High-Performance
Engineering Plastic in Injection Molding, Polymer-Plastics Technology and Engineering, 47,
2008, 1154-1161.
[3] H.Y. Wong, K.T. Fung, F. Gao, Development of a transducer for in-line and through cycle
monitoring of key process and quality variables in injection molding, Sensors and Actuators
A: Physical, 141(2), 2008, 712-722.
[4] L. Ilzarbe, M.J. Álvare, E. Viles, M. Tanco, Practical Applications of Design of
Experiments in the Field of Engineering: A Bibliographical Review, Quality and Reliability
Engineering International, 24, 2008, 417-428.
[5] S.J. Liu, J.H. Chang, Application of the Taguchi Method to Optimize the Surface Quality of
Gas Assist Injection Molded Composites, Journal of Reinforced Plastics and Composites,
19, 2000, 1352-1362.
[6] H. Li, Z. Guo, D. Li, Reducing the effects of weldlines on appearance of plastic products by
Taguchi experimental method, International Journal of Advanced Manufacturing
Technology, 32(9-10), 2007, 927-931.
[7] C.H. Wu, W.J. Liang, Effects of Geometry and Injection-Molding Parameters on Weld-Line
Strength, Polymer Engineering and Science, 45, 2005, 1021-1030.
[8] B. Ozcelik, A. Ozbay, E. Demirbas, Influence of injection parameters and mold materials on
mechanical of ABS in plastic injection molding, International Communications in Heat and
Mass Transfer, 37, 2010, 1359-1365.
[9] H.C. Liao, Y.K. Chen, Optimizing multi-response problem in the Taguchi method by DEA based
ranking method, International Journal of Quality and Reliability Management, 19(7), 2002, 825-837.
[10] J.L. Deng, Introduction to Grey System Theory, The Journal of Grey System, 1, 1989, 1-24.
[11] C.P. Fung, Manufacturing process optimization for wear property of fiber-reinforced polybutylene
terephthalate composites with grey relational analysis, Wear, 254, 2003, 298-306.
[12] C.P. Fung, C.H. Hwang, J.L. Doong, The Study on the Optimization of Injection Molding
Process Parameters with Gray Relational Analysis, Journal of Reinforced Plastics and
Composites, 22, 2003, 51-66.
[13] Y.K. Yang, Optimization of Injection-Molding Process for Mechanical and Tribological
Properties of Short Glass Fiber and Polytetrafluoroethylene Reinforced Polycarbonate
Composites with Grey Relational Analysis: A Case Study, Polymer-Plastics Technology
and Engineering, 45, 2006, 769-777.
[14] C.F.J. Kuo, T.L. Su, Optimization of Injection Molding Processing Parameters for LCD Light-Guide
Plates, Journal of Materials Engineering and Performance, 16(5), 2007, 539-548.
[15] S. Kedr, Y. Aaachi, Y. Fghdi, and N. Ishii, Application of logic theory to writer recognition of English
Characters, International Journal of Modelling and Simulation, 13 (1), 1999, 112-116.
Related Documents


