OPTIMIZATION OF ENVIRONMENTALLY FRIENDLY SOLAR ASSISTED ABSORPTION COOLING SYSTEMS Berhane Hagos Gebreslassie ISBN: 978-84-693-7673-7 Dipòsit Legal: T-1752-2010 ADVERTIMENT. La consulta d’aquesta tesi queda condicionada a l’acceptació de les següents condicions d'ús: La difusió d’aquesta tesi per mitjà del servei TDX (www.tesisenxarxa.net ) ha estat autoritzada pels titulars dels drets de propietat intel·lectual únicament per a usos privats emmarcats en activitats d’investigació i docència. No s’autoritza la seva reproducció amb finalitats de lucre ni la seva difusió i posada a disposició des d’un lloc aliè al servei TDX. No s’autoritza la presentació del seu contingut en una finestra o marc aliè a TDX (framing). Aquesta reserva de drets afecta tant al resum de presentació de la tesi com als seus continguts. En la utilització o cita de parts de la tesi és obligat indicar el nom de la persona autora. ADVERTENCIA. La consulta de esta tesis queda condicionada a la aceptación de las siguientes condiciones de uso: La difusión de esta tesis por medio del servicio TDR (www.tesisenred.net ) ha sido autorizada por los titulares de los derechos de propiedad intelectual únicamente para usos privados enmarcados en actividades de investigación y docencia. No se autoriza su reproducción con finalidades de lucro ni su difusión y puesta a disposición desde un sitio ajeno al servicio TDR. No se autoriza la presentación de su contenido en una ventana o marco ajeno a TDR (framing). Esta reserva de derechos afecta tanto al resumen de presentación de la tesis como a sus contenidos. En la utilización o cita de partes de la tesis es obligado indicar el nombre de la persona autora. WARNING. On having consulted this thesis you’re accepting the following use conditions: Spreading this thesis by the TDX (www.tesisenxarxa.net ) service has been authorized by the titular of the intellectual property rights only for private uses placed in investigation and teaching activities. Reproduction with lucrative aims is not authorized neither its spreading and availability from a site foreign to the TDX service. Introducing its content in a window or frame foreign to the TDX service is not authorized (framing). This rights affect to the presentation summary of the thesis as well as to its contents. In the using or citation of parts of the thesis it’s obliged to indicate the name of the author.

Welcome message from author
This document is posted to help you gain knowledge. Please leave a comment to let me know what you think about it! Share it to your friends and learn new things together.
Transcript
OPTIMIZATION OF ENVIRONMENTALLY FRIENDLY SOLAR ASSISTED ABSORPTION COOLING SYSTEMS
Berhane Hagos Gebreslassie
ISBN: 978-84-693-7673-7 Dipòsit Legal: T-1752-2010
ADVERTIMENT. La consulta d’aquesta tesi queda condicionada a l’acceptació de les següents condicions d'ús: La difusió d’aquesta tesi per mitjà del servei TDX (www.tesisenxarxa.net) ha estat autoritzada pels titulars dels drets de propietat intel·lectual únicament per a usos privats emmarcats en activitats d’investigació i docència. No s’autoritza la seva reproducció amb finalitats de lucre ni la seva difusió i posada a disposició des d’un lloc aliè al servei TDX. No s’autoritza la presentació del seu contingut en una finestra o marc aliè a TDX (framing). Aquesta reserva de drets afecta tant al resum de presentació de la tesi com als seus continguts. En la utilització o cita de parts de la tesi és obligat indicar el nom de la persona autora. ADVERTENCIA. La consulta de esta tesis queda condicionada a la aceptación de las siguientes condiciones de uso: La difusión de esta tesis por medio del servicio TDR (www.tesisenred.net) ha sido autorizada por los titulares de los derechos de propiedad intelectual únicamente para usos privados enmarcados en actividades de investigación y docencia. No se autoriza su reproducción con finalidades de lucro ni su difusión y puesta a disposición desde un sitio ajeno al servicio TDR. No se autoriza la presentación de su contenido en una ventana o marco ajeno a TDR (framing). Esta reserva de derechos afecta tanto al resumen de presentación de la tesis como a sus contenidos. En la utilización o cita de partes de la tesis es obligado indicar el nombre de la persona autora. WARNING. On having consulted this thesis you’re accepting the following use conditions: Spreading this thesis by the TDX (www.tesisenxarxa.net) service has been authorized by the titular of the intellectual property rights only for private uses placed in investigation and teaching activities. Reproduction with lucrative aims is not authorized neither its spreading and availability from a site foreign to the TDX service. Introducing its content in a window or frame foreign to the TDX service is not authorized (framing). This rights affect to the presentation summary of the thesis as well as to its contents. In the using or citation of parts of the thesis it’s obliged to indicate the name of the author.
DOCTORAL THESIS
Berhane Hagos Gebreslassie
Optimization of environmentally friendly solarassisted absorption cooling systems
Department of Mechanical Engineering
UNIVERSITAT ROVIRA I VIRGILI OPTIMIZATION OF ENVIRONMENTALLY FRIENDLY SOLAR ASSISTED ABSORPTION COOLING SYSTEMS Berhane Hagos Gebreslassie ISBN: 978-84-693-7673-7/DL:T-1752-2010

Berhane Hagos Gebreslassie
Optimization of environmentally friendly solarassisted absorption cooling systems
Doctoral Thesis
Supervised by: Dr. Dieter T. Boer
Dr. Gonzalo Guillen Gosalbez
Dr. Laureano Jimenez Esteller
Department of Mechanical Engineering
Tarragona
2010
UNIVERSITAT ROVIRA I VIRGILI OPTIMIZATION OF ENVIRONMENTALLY FRIENDLY SOLAR ASSISTED ABSORPTION COOLING SYSTEMS Berhane Hagos Gebreslassie ISBN: 978-84-693-7673-7/DL:T-1752-2010

Acknowledgements
First, I am heartily thankful to my supervisors, Dr. Dieter Boer, Dr. Gonzalo
Guillen Gosalbez and Dr. Laureano Jimenez Esteller whose encouragement,
guidance and support throughout the whole course enabled me to develop
my research ability tremendously. They have made available their support in
numerous ways. I would like to thank all members of the SUSCAPE research
group who helped me in different forms. It was a great opportunity to study
in such a multidisciplinary research group. Thank you so much indeed.
I would like to acknowledge the University of Rovira i Virgili for providing
me a four year scholarship to realize my masters and the PhD study.
I am grateful to all members of all Mechanical Engineering Department
especially the dean Dr. Ildefonso Cuesta, the secretary Samuel Garcia, the
PhD students Jerko Labus and Ivan Andres Montero and the postgraduate
coordinators Ms. Nuria Juanpere and Ms. Laura Cortes for their adminis-
trative help from the beginning to the end of my study.
I am thankful to the committee of the tribunals of PhD thesis presentation
Dr. Luisa Cabeza, Dr. Montse Meneses, Dr. Antonio Mortal, Dr. Moises
Graells, Dr. Jose Caballero, Dr. Ildefonso Cuesta and Dr. Francesc Castells
for their cooperation and the precious time they spent to read and evaluate
my work.
I offer my regards and blessings for the help I received from Ms. Pilar
Secanell, Ethiopian URV students, and to all of those who supported me in
any respect during the completion of the thesis.
Lastly, my wife presence during my study was important and my greatest
and sincere appreciation goes to my wife Hidat Hagos, to my father, mother,
brothers and sisters for their continued support. Liwamey just thank you. I
love you all.
i
UNIVERSITAT ROVIRA I VIRGILI OPTIMIZATION OF ENVIRONMENTALLY FRIENDLY SOLAR ASSISTED ABSORPTION COOLING SYSTEMS Berhane Hagos Gebreslassie ISBN: 978-84-693-7673-7/DL:T-1752-2010

Resumen
Tanto las limitadas reservas de combustibles fosiles como su impacto ambi-
ental han motivado, entre otras causas, la optimizacion de los sistemas de
generacion de energıa. Los equipos de refrigeracion y otros sistemas de enfri-
amiento tienen un elevado consumo energetico y contribuyen al incremento
de las emisiones de CO2. Existen alternativas mas sostenibles a los ciclos
de compresion convencionales. Estos sistemas requieren mejoras para ser
competitivos.
El objetivo de esta tesis doctoral es la mejora de sistemas de refrigeracion
por absorcion mediante optimizacion y modelizacion matematica. Se incluye,
por un lado el analisis energetico, exergetico y termoeconomico y por otro
la optimizacion multiobjetivo, incluyendo el efecto de la incertidumbre del
precio de la energıa en el diseno del ciclo de absorcion.
Se ha realizado el analisis termodinamico para varias configuraciones de
los ciclos por absorcion incluyendo el analisis energetico, exergetico y estruc-
tural [1, 2]. En concreto, en [1] se ha comparado el coeficiente de rendimiento
y la eficiencia exergetica de diferentes configuraciones de los ciclos de ab-
sorcion de agua-LiBr. En [2] se lleva a cabo un analisis energetico, exergetico
y estructural de ciclos de absorcion de amoniaco-agua de simple efecto con
diferentes grados de integracion de calor. A partir del analisis de exergetico
se determinan las irreversibilidades de las diferentes unidades y de todo el
ciclo. Como las irreversibilidades por sı solos no indican la manera de mejo-
rar el ciclo, se ha integrado el analisis estructural mediante los coeficientes
de interaccion estructural (CSB).
A partir del analisis estructural se ha estudiado la optimizacion termoe-
conomica. Se ha formulado una ecuacion relativamente que determina el
ii
UNIVERSITAT ROVIRA I VIRGILI OPTIMIZATION OF ENVIRONMENTALLY FRIENDLY SOLAR ASSISTED ABSORPTION COOLING SYSTEMS Berhane Hagos Gebreslassie ISBN: 978-84-693-7673-7/DL:T-1752-2010

area optima de los intercambiadores de calor en sistemas termicos. Para una
descripcion detallada consultar [3].
La optimizacion termoeconomica unicamente considera una unica funcion
objetivo y examina un subconjunto de posibles alternativas. Para superar
esta limitacion se introduce un metodo riguroso basado en programacion
matematica. La metodologıa sistematica para el diseno de sistemas de re-
frigeracion por absorcion mas sostenibles se describe en [4]. El metodo se
basa en la formulacion de un problema de programacion no lineal (PNL)
bi-criteria que considera la minimizacion del coste total y del impacto ambi-
ental.
El impacto ambiental se evalua a partir del analisis del ciclo de vida, que
incluye los danos causados en todas las etapas del ciclo de vida del sistema de
refrigeracion. El metodo de solucion para la optimizacion multiobjetivo (re-
striccion ε ) y los conceptos de la frontera de Pareto se describen en [4]. Solo
hemos considerado el impacto ambiental durante la operacion suponiendo
que el impacto debido a la fabricacion es insignificante en comparacion con
el impacto debido a la operacion. Los resultados muestran que se puede re-
ducir el impacto ambiental si el se esta dispuesto a sacrificar parcialmente el
rendimiento economico del sistema.
Basado en la formulacion matematica en [4] se ha considerado el efecto
de la variabilidad de los precios de la energıa. El problema se formulo como
un modelo de PNL bi-criterio estocastico. En [5] se describen el escenario
multiple bi-criteria de formulacion del modelo estocastico, el modelo del coste
total previsto y el de riesgo financiero. En este trabajo el riesgo financiero
se mide mediante el downside risk, evitando ası la definicion de variables
binarias y obteniendo un mejor rendimiento numerico.
En [6] el diseno del sistema de refrigeracion por absorcion se completa
incluyendo el subsistema de produccion de calor. Se han sido considerados
dos fuentes alternativas de calor: gas natural y energıa solar termica. Se han
considerado los siguientes tipos de colectores: tres de placa plana, tres de
tubos evacuados y uno del tipo de compuesto parabolico. En este trabajo,
ademas del impacto durante la operacion del sistema, se ha incluido el debido
a la fabricacion de las unidades. La seleccion del colector y del numero de
iii
UNIVERSITAT ROVIRA I VIRGILI OPTIMIZATION OF ENVIRONMENTALLY FRIENDLY SOLAR ASSISTED ABSORPTION COOLING SYSTEMS Berhane Hagos Gebreslassie ISBN: 978-84-693-7673-7/DL:T-1752-2010

colectores en cada modulo se representan mediante una disyuncion utilizando
la formulacion big-M. El enfoque propuesto se ilustra mediante estudios de
casos teniendo en cuenta los datos meteorologicos de Barcelona y Tarragona.
Los resultados muestran que se puede lograr una reduccion significativa en
el impacto ambiental con una mayor inversion en el subsistema de captacion
solar, aumentando ası la fraccion solar del sistema de refrigeracion. La se-
leccion del tipo de colector solar depende de las condiciones especıficas de
funcionamiento y de los datos meteorologicos considerados en el analisis.
Finalmente se ha evaluado el impacto de ciclos de absorcion apoyados con
energıa solar para la reduccion del calentamiento global. Hemos estudiado
como afectan las diferentes tecnologıas, la tasa de emision de gases de efecto
invernadero y que efecto tiene el precio del combustible en la seleccion del
sistema [7]. El estudio incluye como estos parametros favorecen el reemplaza-
miento del gas natural por la energıa solar. Los resultados revelan que en
situaciones de precios altos del combustible y considerando el impuesto sobre
las emisiones de CO2 los ciclos de absorcion apoyados con energıa solar son
tecnica y economicamente viables.
iv
UNIVERSITAT ROVIRA I VIRGILI OPTIMIZATION OF ENVIRONMENTALLY FRIENDLY SOLAR ASSISTED ABSORPTION COOLING SYSTEMS Berhane Hagos Gebreslassie ISBN: 978-84-693-7673-7/DL:T-1752-2010

Summary
Optimization of energy conversion systems becomes more important due to
limitations of fossil fuels and the environmental impact during their use.
Among these systems cooling and refrigeration devices have an increasing
share in the total energy consumption and the contribution to CO2 emissions.
There exist more sustainable cooling systems, which represent an alternative
to conventional compression cycles. However, they still have to be improved
in order to become competitive.
This thesis focuses on mathematical modeling and optimization of en-
vironmentally friendly absorption cooling systems. We include on the one
hand energy, exergy and structural analysis and thermoeconomic optimiza-
tion, and on the other hand optimization of the cooling system considering
two contradicting objective functions, and optimization of absorption cycles
under uncertainty of energy prices.
The thermodynamic analysis has been performed for different configu-
rations of the absorption cooling cycles. The detailed description of energy,
exergy and the structural analysis of the different configurations are presented
in [1, 2]. Specifically, in [1] different configurations of water-LiBr absorption
cycles have been compared based on the coefficient of performance and the
exergetic efficiency. Moreover, in [2] energy, exergy and structural analysis of
single effect ammonia-water absorption cooling cycles with different degree of
heat integration are performed. From the exergy analysis irreversibilities of
the units and the cycle are determined. Since the irreversibilities do not in-
dicate how to improve the cycle, the structural analysis using the coefficients
of structural bonds (CSB) has been applied.
Based on the structural analysis presented in [2] the thermoeconomic
optimization is studied. An equation that determines the optimal area of the
v
UNIVERSITAT ROVIRA I VIRGILI OPTIMIZATION OF ENVIRONMENTALLY FRIENDLY SOLAR ASSISTED ABSORPTION COOLING SYSTEMS Berhane Hagos Gebreslassie ISBN: 978-84-693-7673-7/DL:T-1752-2010

heat exchangers in thermal systems is formulated. A detailed description is
presented in [3].
The thermoeconomic optimization relays only in a single economic objec-
tive function and examines a subset of feasible alternatives. To overcome this
short coming a rigorous mathematical programming method is introduced.
The systematic approach for the design of sustainable absorption cooling
systems is described in [4]. The method relies on formulating a bi-criteria
nonlinear programming (NLP) problem that accounts for the minimization
of the total annualized cost and the environmental impact of the cycle.
The environmental performance is measured according to the principles
of life cycle assessment (LCA), which accounts for the damage caused in
all the stages of the life cycle of the cooling system. The solution method
for the multi-objective optimization ((the ε − constraint)) and the Pareto
frontier concepts are described in [4]. We have considered initially only the
environmental impact during the operation of the cooling system assuming
that the impact due to manufacturing is negligible compared to the impact
due to operation. The results show that a reduction in the environmental
impact caused by the cycle can be attained if the decision maker is willing
to compromise the economic performance of the system.
Based on the mathematical formulation in [4] a systematic approach for
the design of absorption cooling cycles considering the variability of the en-
ergy price is studied. This is achieved by formulating the design task as a
bi-criteria stochastic NLP model. In [5] the multi-scenario bi-criteria stochas-
tic model formulation, the expected total cost, and the financial risk are
described. In this work the financial risk is measured using the downside
risk, which avoids the definition of binary variables, thus leading to better
numerical performance.
In [6] the design of absorption cooling cycle is modified to include the
heat production subsystem. Two heat sources are considered: natural gas
and solar energy. Three types of flat plate, three types of evacuated tube
and one type of compound parabolic collectors are considered. In this work
in addition to the environmental impact during operation of the system we
vi
UNIVERSITAT ROVIRA I VIRGILI OPTIMIZATION OF ENVIRONMENTALLY FRIENDLY SOLAR ASSISTED ABSORPTION COOLING SYSTEMS Berhane Hagos Gebreslassie ISBN: 978-84-693-7673-7/DL:T-1752-2010

include the environmental impact during manufacturing of the units. The se-
lection of module of the collector and the number of collectors in each module
are represented by a disjunction, reformulated using the big-M formulation.
The proposed approach was illustrated through case studies considering the
weather data of Barcelona and Tarragona. The results show that significant
reductions in the environmental impact can be achieved if the decision-maker
is willing to invest on the solar collector’s subsystem. These reductions are
achieved by increasing the number of collectors installed, which increases the
solar fraction of the cooling system. The type of solar collector dependents
on the particular operating conditions and weather data considered in the
analysis.
Finally, solar assisted absorption cycles have been considered for the re-
duction of the global warming impact of the cooling system. We have studied
how greenhouse gas emissions tax and the fuel price affect the greenhouse
gas emissions reduction by giving preference to different technologies [7]. The
study includes how these parameters force the model to shift the energy con-
sumption from natural gas to solar energy. The optimization results reveal
that with high fuel prices including the CO2 emissions tax, solar assisted
absorption cooling systems are technically and economically feasible.
vii
UNIVERSITAT ROVIRA I VIRGILI OPTIMIZATION OF ENVIRONMENTALLY FRIENDLY SOLAR ASSISTED ABSORPTION COOLING SYSTEMS Berhane Hagos Gebreslassie ISBN: 978-84-693-7673-7/DL:T-1752-2010
Table of contents
Acknowledgements i
Resumen ii
Summary v
1 Introduction 1
1.1 General objective . . . . . . . . . . . . . . . . . . . . . . . . . 4
1.2 Problem statement . . . . . . . . . . . . . . . . . . . . . . . . 5
2 Optimization methods 6
2.1 Exergy based methods . . . . . . . . . . . . . . . . . . . . . . 6
2.1.1 Exergy analysis . . . . . . . . . . . . . . . . . . . . . . 7
2.1.2 Thermoeconomic optimization . . . . . . . . . . . . . . 9
2.2 Mathematical programming methods . . . . . . . . . . . . . . 9
2.2.1 Mathematical model . . . . . . . . . . . . . . . . . . . 9
2.2.2 Selection of the appropriate solvers . . . . . . . . . . . 11
2.2.3 Solution techniques for multi-objective optimization ap-
plications . . . . . . . . . . . . . . . . . . . . . . . . . 12
3 Applications of optimization 13
3.1 Economic performance . . . . . . . . . . . . . . . . . . . . . . 13
3.2 Life Cycle Assessment of thermal systems . . . . . . . . . . . . 13
3.3 Financial risk . . . . . . . . . . . . . . . . . . . . . . . . . . . 14
4 Conclusions and perspectives 17
viii
UNIVERSITAT ROVIRA I VIRGILI OPTIMIZATION OF ENVIRONMENTALLY FRIENDLY SOLAR ASSISTED ABSORPTION COOLING SYSTEMS Berhane Hagos Gebreslassie ISBN: 978-84-693-7673-7/DL:T-1752-2010

Future works 20
Nomenclature 21
References 23
A Appendices 32
A.1 List of publications . . . . . . . . . . . . . . . . . . . . . . . . 32
A.2 Congress contributions . . . . . . . . . . . . . . . . . . . . . . 33
A.3 Book chapters . . . . . . . . . . . . . . . . . . . . . . . . . . . 35
ix
UNIVERSITAT ROVIRA I VIRGILI OPTIMIZATION OF ENVIRONMENTALLY FRIENDLY SOLAR ASSISTED ABSORPTION COOLING SYSTEMS Berhane Hagos Gebreslassie ISBN: 978-84-693-7673-7/DL:T-1752-2010

Chapter 1
Introduction
The design of energy conversion systems becomes more important due to lim-
itations of fossil fuels and the environmental impact during their use. Energy
systems are complex as they involve in economic, technical, environmental,
legal and political factors and supporting our daily life and economic develop-
ment [8, 9]. Nowadays, 94 % of the CO2 emissions in Europe are attributed
to the energy sector, due to the combustion of fossil fuels (oil: 50 %, natural
gas: 22 % and coal: 28 % [10]).
The building sector represents 40 % of the total primary energy demand
in European Union countries and one third of the GHG emissions [11]. A
significant part of the emissions attributed to the building sector are due to
air conditioning (AC) systems, which are based mainly on electricity driven
compression cycles. Particularly, during the last years there has been a prolif-
eration of vapor compression air conditioning [11–13]. The cooling demand
has been increasing rapidly during the last decade, especially in moderate
climates [12, 13]. As a result, the electricity demand threatens the stability
of electricity grids and increases the environmental problems associated with
the generation of electricity. In Spain, the summer peak electricity consump-
tion became higher than the winter peak electricity demand. The summer
peak in the southern part of the country increased by 20 % in 2003 and by
another 20 % in 2004 [11].
Hence, it seems clear that a durable change in the energy structure should
be made in order to adopt more sustainable solutions to fulfill the increasing
1
UNIVERSITAT ROVIRA I VIRGILI OPTIMIZATION OF ENVIRONMENTALLY FRIENDLY SOLAR ASSISTED ABSORPTION COOLING SYSTEMS Berhane Hagos Gebreslassie ISBN: 978-84-693-7673-7/DL:T-1752-2010
cooling demand. Mainly, environmentally friendly and energy efficient tech-
nologies have to be promoted so that the environmental impact of cooling
applications is minimized without compromising their economic performance.
In this line, there has been a growing interest on thermal energy activated
cooling machines. They provide an environmentally friendly alternative to
standard compression chillers [14–16]. The most common types of thermally
driven chillers are absorption and adsorption chillers. The benefits of absorp-
tion systems are [17]:
• Absorption chillers can be driven by low grade thermal energy, as waste
heat, biomass, solar thermal energy or heat from cogeneration.
• Absorption chillers are silent and vibration free.
• Absorption chillers do not pose a threat to ozone layer depletion as
they don’t use CFC’s or HCFC’s and may have less impact on global
warming.
• Absorption chillers are economically attractive if the fuel costs are sub-
stantially lower than the electricity costs.
Absorption cycles use a mixture of a refrigerant and an absorbent. The
most widely employed mixtures are water-lithium-bromide (water as refrig-
erant) and ammonia-water (ammonia as refrigerant). H2O − LiBr has cer-
tain merits over the NH3 −H2O supported chillers. For example, they have
higher performance, and do not require rectification to purify the refrigerant.
However, its working range is limited by the freezing point of the refriger-
ant (water) and the crystallization risk of the solution. Especially at higher
temperatures it is corrosive. The ammonia-water system is used typically for
low temperature cooling or freezing and it does not have crystallization prob-
lems. The need of further rectification after desorption reduces the chiller
efficiency.
Even though, these technologies can use renewable energy, thus decreas-
ing the associated environmental impact, they need a higher number of units
(absorber, desorber and heat recovery units). This leads to higher capital
2
UNIVERSITAT ROVIRA I VIRGILI OPTIMIZATION OF ENVIRONMENTALLY FRIENDLY SOLAR ASSISTED ABSORPTION COOLING SYSTEMS Berhane Hagos Gebreslassie ISBN: 978-84-693-7673-7/DL:T-1752-2010
costs than those associated with conventional cooling systems (i.e., vapor
compression system). Hence, optimization strategies based on both, thermo-
dynamic and economic insights are needed to improve their operational and
economic performance.
In this regard, the thermoeconomic optimization which merges the ther-
modynamic and economic analysis within a single framework has been ap-
plied to thermal systems [18–24]. In the process system engineering commu-
nity, the mathematical programming approach is extensively used. However,
for thermal systems, and in particular for cooling systems its use is rather
limited. Recently, mathematical programming has been used in the opti-
mization of cooling systems [25–27]. This approach is based on formulating
optimization problems that can be solved via the standard techniques for lin-
ear, nonlinear, mixed integer linear and mixed integer non linear problems.
This method offers a suitable framework to address the environmental per-
formance of different design alternatives, energy resources and also permit to
include the uncertainties of the design parameters at the design stage.
To my knowledge works that integrate the environmental and the eco-
nomic performance measure in the framework of multi objective optimization
have not been addressed yet for cooling systems. Therefore, this PhD thesis
is aimed at filling this gap. The main novelties of this dissertation lie in: 1)
comparison of the performance of different configuration of absorption cycles
considering only the unavoidable exergy destruction rates. 2) The thermoe-
conomic optimization based on the structural method for ammonia-water
absorption cycles. 3) The integration of the life cycle analysis methodologies
to evaluate the design of the solar assisted absorption cooling system alter-
natives that are systematically generated by the mathematical programming
optimization tools in the framework of multi-objective optimization; 4) The
integration of the financial risk management to evaluate the design of the
absorption cooling system alternatives, which are systematically generated
by the optimization tools considering the uncertainties of the future energy
price.
This PhD thesis is structured in four main sections. Next the objective of
the PhD thesis is presented followed by the problem statement. The section
3
UNIVERSITAT ROVIRA I VIRGILI OPTIMIZATION OF ENVIRONMENTALLY FRIENDLY SOLAR ASSISTED ABSORPTION COOLING SYSTEMS Berhane Hagos Gebreslassie ISBN: 978-84-693-7673-7/DL:T-1752-2010

that follows will discus the optimization methods based on exergy analysis
and the mathematical programming. The third section presents the objective
functions considered. Last, the conclusions of the work are drawn and future
works are included.
1.1 General objective
The overall objective of the PhD thesis is the optimization of environmentally
friendly solar assisted absorption cooling cycle in the framework of multi-
objective, robust and multi-period optimization problem.
Specific objectives
• Exergy analysis of different configurations of absorption cycles and
comparison based on the coefficient of performance, irreversibilities and
the exergetic efficiency.
• Thermoeconomic optimization of single effect NH3 −H2O absorption
cycles using coefficients of structural bonds (CSB).
• Multi-objective optimization of environmentally friendly single effect
NH3 −H2O absorption cycle using mathematical programming.
• Include uncertainty of the energy prices to improve the robustness of the
optimization problem of the aforementioned mathematical program-
ming.
• Modify the model of the absorption cycle to include the heat production
subsystem, which includes the solar thermal collectors, and optimize
the modified problem.
• Study how solar assisted absorption cooling cycles can be real alterna-
tives, if a carbon dioxide tax is introduced. Also, study how fuel prices
affect the competitiveness of the more sustainable technologies.
4
UNIVERSITAT ROVIRA I VIRGILI OPTIMIZATION OF ENVIRONMENTALLY FRIENDLY SOLAR ASSISTED ABSORPTION COOLING SYSTEMS Berhane Hagos Gebreslassie ISBN: 978-84-693-7673-7/DL:T-1752-2010
1.2 Problem statement
This PhD thesis addresses the optimal design of solar assisted absorption
cooling cycle following two approaches.
1. Thermoeconomic optimization method which merges the thermody-
namic and the economic analysis to a single objective function. En-
ergy, exergy and structural analysis for different configurations of the
absorption cycles have been performed.
2. Mathematical programming method is employed to optimize the cool-
ing system in the framework of multi-objective optimization. Two con-
tradicting objective functions are used: cost and environmental perfor-
mance or cost and financial risk.
In both approaches the given data are the cooling capacity of the system, the
inlet and outlet temperatures of the external fluids (heat source temperature
for the second approach is a variable), the overall heat transfer coefficients
of the heat exchangers and capital and operating cost parameters. For the
second approach LCA related information is given (i.e., life cycle inventory of
emissions and feedstocks, parameters of the damage model, global warming
potential parameters for the greenhouse gas emissions). It is assumed that
the energy cost cannot be perfectly forecasted, and its variability can be
represented by a set of scenarios with a given probability of occurrence.
Monthly weather data (ambient temperature and global daily solar radiation)
and performance equations of the solar collectors are also given data. The
goal is to determine the optimal design and associated operating conditions
at minimum total cost for the thermoeconomic optimization and in the case
of multi-objective optimization at the optimal trade-off designs. Moreover,
quantified environmental benefits, by incorporating the solar energy to the
cooling system is evaluated.
5
UNIVERSITAT ROVIRA I VIRGILI OPTIMIZATION OF ENVIRONMENTALLY FRIENDLY SOLAR ASSISTED ABSORPTION COOLING SYSTEMS Berhane Hagos Gebreslassie ISBN: 978-84-693-7673-7/DL:T-1752-2010
Chapter 2
Optimization methods
Optimization of thermal systems is the modification of structure and design
variables to minimize (maximize) a given objective function (e.g, the pro-
duction cost, profit, environmental impact, environmental benefit, reliability,
flexibility, etc) that simultaneously fulfills the process constraints. Typical
constraints are the physical laws, the boundary conditions associated with
material availability, financial resources, protection of environment, govern-
mental regulation, safety, maintainability, etc. A widely used method is
based on the thermoeconomic optimization [18–24]. Details of this method
can be found in [3, 28, 29] and a brief description is given in section 2.1.
Using mathematical programming several compromise solutions (a multi-
objective) that represent the optimal trade-off between the objective func-
tions can be provided at the design stage. Hence, the decision maker can
make a rational decision based on this information. Details of this method
can be found [4–6, 30] and a brief description could be found in section 2.2.
2.1 Exergy based methods
Absorption cycles are generally evaluated according to their coefficient of
performance (COP). Starting with the basic single effect cycle, more complex
and efficient cycles can be obtained. Multi-stage cycles have higher COP’s;
however, they need higher driving temperatures. The triple effect has the
highest energetic efficiency followed by double and single effect cycles. The
6
UNIVERSITAT ROVIRA I VIRGILI OPTIMIZATION OF ENVIRONMENTALLY FRIENDLY SOLAR ASSISTED ABSORPTION COOLING SYSTEMS Berhane Hagos Gebreslassie ISBN: 978-84-693-7673-7/DL:T-1752-2010
half effect cycle (also called double lift) has the lowest COP but can work
with lower driving temperatures. Thus the quality of the driving energy of
these cycles differs considerably.
The energy conservation law does not differentiate between different forms
of energy to evaluate the coefficient of performance. A convenient way of in-
troducing and quantifying the quality of energy is based on the maximum
possible work that can be obtained from a given form of energy using en-
vironmental parameters as reference state. This standard energy quality is
commonly called exergy [28]. In other words, exergy is the maximum possible
reversible work obtainable in bringing the state of a system to equilibrium
with the environment. It enables us to compare different types of energy for
example heat and work, and it takes into account the different quality of heat
at different temperature levels.
2.1.1 Exergy analysis
A detailed discussion of exergy analysis and thermoeconomic optimization in
thermal systems can be found [28, 29]. In particular, exergy destruction anal-
ysis and evaluation of the exergetic efficiency of water-LiBr absorption cycles
can be found in [31–35]. Ammonia-water absorption cycle are considered in
[36, 37].
First law analysis of water-LiBr multiple effect absorption cycles was car-
ried out by Grossman et al. [38]. However, for high temperature range
the thermodynamic properties are evaluated by extrapolating the existing
thermodynamic property correlations. Lee et al. [39] made the first and
second law thermodynamic analysis of triple effect cycles. However, the ex-
ergy destruction rates were evaluated without distinguishing the avoidable
and unavoidable parts. Morosuk and Tsatsaronis [40] proposed splitting the
exergy destruction rate into avoidable and unavoidable parts. The exergy
destruction rates which can not be further reduced by design improvement
represent unavoidable exergy destruction. Therefore, a designer has to focus
on the exergy destruction rates with potential room for improvement. To
my knowledge, the energy and exergy analysis that compares half, single,
7
UNIVERSITAT ROVIRA I VIRGILI OPTIMIZATION OF ENVIRONMENTALLY FRIENDLY SOLAR ASSISTED ABSORPTION COOLING SYSTEMS Berhane Hagos Gebreslassie ISBN: 978-84-693-7673-7/DL:T-1752-2010
double, and triple effect on rational base and that does not depend on the
design specifications are not covered. Hence, to fill this gap a comparison
of multiple effect cycles based on the coefficient of performance and exergy
efficiency which considers only the unavoidable exergy destruction rate are
performed in Gebreslassie et al. [1]. As expected, the coefficient of perfor-
mance increases from half effect to the multiple effects. However, the increase
in exergetic efficiency is not as pronounced as the coefficient of performance.
The maximum coefficient of performance and the exergetic efficiency are ob-
tained close to the cut off temperature of the generator, which represents the
lowest feasible temperature.
Exergy analysis include the evaluation of exergy of each stream, the ir-
reversibility, exergy loses and exergy efficiency of each unit and the system.
Furthermore, exergy analysis enable us to determine the coefficients of struc-
tural bonds (CSB) of each unit [28, 41, 42]. The CSB is used in making
decisions where the thermoeconomic optimization has to be performed.
Coefficients of structural bonds can be determined as function of the
variable (x) that influence the efficiency of the unit, irreversibility rate of the
unit k (Ik) and the system (It) as given in eqn. (2.1)
CSBk =
(∂It∂x
∂It∂x
)
x=var
(2.1)
Structural coefficients consider how the irreversibility of the whole system
changes when the irreversibility of one component is modified by modifying
its efficiency. If a slight decrease of the irreversibility of one component
due to a higher efficiency causes an important improvement in the total
irreversibility of the cycle, it will be wise to put much of the design effort
to improve the efficiency of this component. In the case of a high coefficient
of structural bonds, the benefit of a more efficient (i.e., more expensive)
unit on the performance of the whole cycle is considerable. Otherwise, if the
coefficient of structural bonds is low (i.e., near unity), an improvement of the
efficiency of the unit is not economically worthwhile. Details can be found
in [2, 28, 43].
8
UNIVERSITAT ROVIRA I VIRGILI OPTIMIZATION OF ENVIRONMENTALLY FRIENDLY SOLAR ASSISTED ABSORPTION COOLING SYSTEMS Berhane Hagos Gebreslassie ISBN: 978-84-693-7673-7/DL:T-1752-2010

2.1.2 Thermoeconomic optimization
The thermoeconomic optimization is a discipline that combines exergy and
economic analysis. This work follows the structural method introduced by
Beyer [41, 42] which is based on the coefficients of structural bonds explained
in section 3.2 of Gebreslassie et al. [3] and the local cost of the irreversibil-
ity. The main goal of a thermoeconomic optimization is to give a balance
between the expenditure on investment costs and exergy costs which results
in minimum total cost of the system under a given structure of the system.
This method was applied for a vapor compression refrigerator by Dingec et
al. [21], for a condenser of compression cycle by Dentice d’Accadia et al.
[22] and recently for water-LiBr absorption cycle by Kizllkan et al. [24]. The
key point of this approach is the selection of an appropriate efficiency related
variable x. The variable x should be directly related to the efficiency and
the investment cost of the unit under consideration. This is because the final
optimization problem depends on the capital and irreversibility cost of this
unit.
2.2 Mathematical programming methods
Mathematical programming is the study of a problem in which one has to
minimize or maximize a function by systematically choosing the value of a
real or integer variable from the allowed set of variables. The previous opti-
mization method may leads to sub-optimal solution, while the mathematical
programming method is a rigorous approach and systematically evaluates all
alternatives of the feasible solutions.
2.2.1 Mathematical model
The mathematical model describes the system behavior in terms of relations
of physical laws. The model should describe the manner in which all relations
are connected and the way in which variables affect the performance measures
[29, 30]. The mathematical model for an optimization problem should include
an objective function and constraints (equality or inequality).
9
UNIVERSITAT ROVIRA I VIRGILI OPTIMIZATION OF ENVIRONMENTALLY FRIENDLY SOLAR ASSISTED ABSORPTION COOLING SYSTEMS Berhane Hagos Gebreslassie ISBN: 978-84-693-7673-7/DL:T-1752-2010

The objective function can be the total cost, the environmental impact or
the financial risk due to energy price variability of the cooling system. There
are set of variables that control the value of the objective functions as the
thermodynamic properties of each streams and the capacity of each unit of
the cooling system.
Constraints are expressions which allow that variables can take certain
values but exclude others. The equality and inequality constraints should
be provided by appropriate thermodynamic, economic, and environmental
models with boundary conditions. These models generally include mass and
energy conservation equations, relations associated to engineering designs
(e.g, minimum and maximum temperature, pressure, minimum temperature
approaches, etc), environmental impacts and thermodynamic properties of
the streams. The model also include inequalities that specify the allowable
operating ranges, the minimum and maximum performance requirements,
the bounds on the availability of resources, etc
An optimization problem can be stated as shown in eqn. (2.2).
(M) minx
U (x) = {f1 (x) , f2 (x) , ..}s.t. h(x) = 0
g(x) ≤ 0
x ∈ <
(2.2)
Here, U(x) refers to the objective function. This can include single ob-
jective function (if only f1(x) is minimized) or multiple objective functions.
h(x) and g(x) represents the equality and inequality constraints respectively.
x refers to the set of design variables. Optimization problems can be clas-
sified based on the nature the equations involved in eqn. (2.2) (linear and
nonlinear), based on the nature of the permissible design variables (continues
or integer), based on the nature of the design variables (static or dynamic),
based on the nature of constraints (constraint or unconstrained), based on
the nature of the variables (stochastic or deterministic), based on the number
of objective functions (single or multiple), and so on.
10
UNIVERSITAT ROVIRA I VIRGILI OPTIMIZATION OF ENVIRONMENTALLY FRIENDLY SOLAR ASSISTED ABSORPTION COOLING SYSTEMS Berhane Hagos Gebreslassie ISBN: 978-84-693-7673-7/DL:T-1752-2010

2.2.2 Selection of the appropriate solvers
The General Algebraic Modeling System (GAMS) is a modeling environ-
ment [44]. It is integrated with different external solvers. These solvers are
capable of solving linear, nonlinear, and mixed-integer optimization prob-
lems. The most widely used solvers of NLP problems are CONOPT, MINOS
and SNOPT. These algorithms attempt to find local optimum unless the
NLP problem is convex. If the NLP problem is convex the local minimum
becomes a global minimum. As rule of thumb, if the model under consider-
ation has highly nonlinear constraints, as in this thesis, CONOPT is more
suitable. However, if the model involves less nonlinearity outside the objec-
tive function, either MINOS, or SNOPT are probably more adequate. For
constrained nonlinear systems (CNS), for models with few degrees of free-
doms, and if the model has roughly the same number of constraints and
variables it is recommended to start with CONOPT (i.e., CONOPT3, but
not CONOPT1 or CONOPT2). CONOPT is designed for large and sparse
models which are like the type of models that can be encountered in this
work, hence for the NLP models of this work CONOPT is used [44].
The NLP solvers can not be used for Mixed Integer Nonlinear Program-
ming (MINLP) problems. In the thesis this type of problems are encountered
when the heat production sub-system is integrated to the absorption cycle
as discussed in Gebreslassie et al. [6]. In these systems the type of collector
and the number of collectors are represented as integer variables while the
rest of variables represent linear or nonlinear variables. For solving such type
of problems DICOPT and SBB solvers are used [44].
The MINLP algorithm inside DICOPT solves a series of NLP and Mixed
Integer Programming (MIP) sub-problems. DICOPT is the local optimizer.
However, it has provisions to handle non-convexities [44]. In this work the
NLP sub-problem is solved with CONOPT and the MIP sub-problem we use
CPLEX. SBB supports all type of discrete variables and it is based on the
combination of the standard Branch and Bound known from MILP. For the
NLP sub-problems CONOPT, MINOS and SNOPT can be used [44].
11
UNIVERSITAT ROVIRA I VIRGILI OPTIMIZATION OF ENVIRONMENTALLY FRIENDLY SOLAR ASSISTED ABSORPTION COOLING SYSTEMS Berhane Hagos Gebreslassie ISBN: 978-84-693-7673-7/DL:T-1752-2010

In both solvers, the Relaxed Mixed Integer Nonlinear Programming (RMINLP)
is initially solved using the starting point provided. In this work, the same
model is simulated in Engineering Equation Solver (EES) [45] and the re-
sults are used as starting point in GAMS. The solver will stop if it gives
unbounded or infeasible solutions. However, if the solution of the RMINLP
is an integer, the solver will return this solution as optimal integer solution.
Otherwise, the current solution is stored and for DICOPT solver the outer
approximation procedure will start. However, if the solver is SBB the Branch
and Bound procedure will start [44].
2.2.3 Solution techniques for multi-objective optimiza-
tion applications
The bi-criteria optimization problem results a set of efficient or Pareto opti-
mal points representing alternative process designs, each achieving a unique
combination of environmental and economic performances [4, 6, 7] or Down-
side Risk and the expected total cost performance [5].
The general concept of Pareto frontier is explained in section 4 of Gebres-
lassie et al. [4–6]. The mathematical definition of Pareto optimality states
that a design objective vector f ∗ is Pareto optimal if there does not exist an-
other design objective vector f in the feasible design space such that fi ≤ f ∗i
for all i ∈ {i = 1, 2, ..., n} and fi < f ∗i for at least one i ∈ {i = 1, 2, ..., n}.
Thus, given a Pareto solution A, it is impossible to find another solution
B that performs better than A for each objective. For the calculation of
the Pareto set, two main methods exist in the literature. These are the
weighted− sum and ε− constraint. The weighted-sum method is only rig-
orous for the case of convex problems, whereas the ε − constraint method
is rigorous for convex and non-convex problems. In general, the thermody-
namic correlations, the capital cost correlations, the minimum temperature
difference constraints introduce non-convexities to the model. Thus, the
ε − constraint method is better suited to the problems formulated in this
work.
12
UNIVERSITAT ROVIRA I VIRGILI OPTIMIZATION OF ENVIRONMENTALLY FRIENDLY SOLAR ASSISTED ABSORPTION COOLING SYSTEMS Berhane Hagos Gebreslassie ISBN: 978-84-693-7673-7/DL:T-1752-2010
Chapter 3
Applications of optimization
The objective functions we have considered in the PhD thesis are presented in
this section. This includes the economic performance indicator, the environ-
mental performance indicator and the financial risk performance indicator.
3.1 Economic performance
To measure the economic performance we use the total cost of the cooling
system. It encompasses the capital cost and the operation cost. The total
investment amortization cost is considered in this case based on the capital
recovery factor. The Chemical Engineering Plant Cost Index (CEPCI) [46] is
used to consider the inflation of the investment cost. For the operation cost
we considered the cost of steam, natural gas, electricity, and cooling water.
A detailed discussion can be found in [4] (section 3.3.1), [5] (section 3.2.1),
[6], (section 3.3.1), and [7] (appendix B).
3.2 Life Cycle Assessment of thermal systems
LCA is used to assess the environmental performance of the process, whereas
optimization techniques are used for generating in a systematic way different
technological alternatives and identifying the best ones in terms of economic
and environmental criteria. Examples on the application can be found in
[47–49].
13
UNIVERSITAT ROVIRA I VIRGILI OPTIMIZATION OF ENVIRONMENTALLY FRIENDLY SOLAR ASSISTED ABSORPTION COOLING SYSTEMS Berhane Hagos Gebreslassie ISBN: 978-84-693-7673-7/DL:T-1752-2010
In this thesis, the environmental performance of the system is measured
by the Eco-indicator 99 [4, 6], and Global Warming Potential (GWP) [7]
metrics. The Eco-indicator 99 accounts for 11 impact categories that are
aggregated into three types of damages: human health, ecosystem quality
and resource depletion. Eco-indicator 99 is described in detail in [50]. GWP
is a relative scale which compares the impact of a given chemical with that of
the same impact of carbon dioxide (whose GWP by convention is equivalent
to 1). The GWP is calculated over a specific time interval that must be
stated beforehand [51, 52]. We follow the Intergovernmental Panel on Cli-
mate Change (IPCC) 2007 and the Kyoto Protocol [52] considering a time
horizon of 100 years. Details about the LCA methodology can be found
elsewhere [53].
The calculation of the Eco-indicator 99 and GWP follows the main LCA
stages [53]: (1) goal and scope definition, (2) inventory analysis, (3) damage
assessment and (4) interpretation. These stages are described in the context
of the PhD work in section 3.3.2 of [4–6].
3.3 Financial risk
Most of the strategies that address the optimal design and modeling of ther-
mal systems such as compression refrigeration and absorption cooling are
mainly deterministic, that is, based on nominal values for design parame-
ters [20, 54–57]. Deterministic optimization assumes that all parameters are
known with certainty or fail to recognize the presence of probable situations
other than the most likely one. However, resource availability, technology
development, unit cost of energy, end user demand, cooling and heating de-
mand are fraught with uncertainty. This affects the optimization result and
has to be taken into account in the decision making process [8, 9, 58].
The sources of uncertainties and their classification are explained in [59].
First the uncertainties are classified as short term which includes day to day
process and parameter variations such as flow rates and temperatures. The
system responds the variability within short period of time. The long term
uncertainty includes product demand, product sales, raw material purchase
14
UNIVERSITAT ROVIRA I VIRGILI OPTIMIZATION OF ENVIRONMENTALLY FRIENDLY SOLAR ASSISTED ABSORPTION COOLING SYSTEMS Berhane Hagos Gebreslassie ISBN: 978-84-693-7673-7/DL:T-1752-2010
and equipment purchase uncertainty. These uncertainties occur over an ex-
tended time horizon.
Alternatively, they are classified by Pistikopoulos [60] into four categories:
i. Model inherent uncertainty: include kinetic constants, physical prop-
erties, transfer coefficients. They can be described either by range or
by probability distribution function.
ii. Process inherent uncertainty : include flow rate and temperature varia-
tions which are usually described by a probability distribution function.
iii. External uncertainty: include feed stream availability, product demands,
prices and environmental conditions. They are described based on his-
torical data and customer orders are usually used to obtain a probabil-
ity distribution.
iv. Discrete uncertainty: include uncertainties such as equipment avail-
ability and other random discrete events. A (discrete) probability dis-
tribution function can commonly be obtained from available data and
manufacturer’s specifications.
A number of approaches have been proposed in the literatures for the quantifi-
cation of uncertainty in the design, planning, and scheduling of process plants
and energy systems. These approaches have contributed to a better under-
standing of how uncertainty affects the design and planning performances.
The main approaches to optimization under uncertainty are reviewed in detail
by Sahinidis [58]. These are: i). Stochastic programming which is extensively
used in process system engineering planning and scheduling by considering
the uncertainties such as product demand, customer satisfaction, and the
environmental metrics [61–66]. It can be expressed as recourse models, ro-
bust models and probabilistic models. ii). Fuzzy programming examples
can be found in energy sector planning under uncertainty [8, 9, 67–69]. It
could be possibilistic and flexible programming. iii). Stochastic dynamic
programming [70].
15
UNIVERSITAT ROVIRA I VIRGILI OPTIMIZATION OF ENVIRONMENTALLY FRIENDLY SOLAR ASSISTED ABSORPTION COOLING SYSTEMS Berhane Hagos Gebreslassie ISBN: 978-84-693-7673-7/DL:T-1752-2010

Optimization under uncertainty have followed a variety of modeling philoso-
phies, including the minimization of expected total cost which is the one
adopted in this work [5], maximization of expected net present value [64],
minimization of deviations from goals, and optimization over soft constraints
[58]. Usually, designs with minimum expected total cost performs better for
higher financial risk, so they tend to have a trade-off between the objectives.
16
UNIVERSITAT ROVIRA I VIRGILI OPTIMIZATION OF ENVIRONMENTALLY FRIENDLY SOLAR ASSISTED ABSORPTION COOLING SYSTEMS Berhane Hagos Gebreslassie ISBN: 978-84-693-7673-7/DL:T-1752-2010
Chapter 4
Conclusions and perspectives
Aligned with the objectives optimization of environmentally friendly solar
assisted absorption cooling cycle in the framework of multi-objective, ro-
bust and multi-period optimization problem is performed. The methodology
presented in this work is intended to promote a more sustainable design of
cooling applications by guiding the decision-makers towards the adoption
of alternatives that promote less environmental impact and reduce the con-
sumption of primary energy resources. The conclusions withdrawn from the
successive work to accomplish the specific objectives are listed below.
• From the results of energy and exergy analysis of the different configu-
rations of water-LiBr absorption cycles an increase in COP is observed
from half (0.458) to triple effect (2.32) cycles. However, the increase
in exergetic efficiency from effect to effect is not as pronounced as the
COP which varies from 0.359 (half effect) to 0.473 (triple effect cycle).
The results show that the maximum COP and the exergetic efficien-
cies are near to the minimum feasible generator temperature (cut-off
temperature). As the generator temperature increases COP decrease
slowly however, exergetic efficiencies decrease drastically. In all cycles,
the effect of the heat source temperature on the exergy destruction
rates is similar for the same type of components.
• Results of the structural analysis confirm that, it is more important to
improve the efficiency of units with high 4Tmin ( or low UA− values)
17
UNIVERSITAT ROVIRA I VIRGILI OPTIMIZATION OF ENVIRONMENTALLY FRIENDLY SOLAR ASSISTED ABSORPTION COOLING SYSTEMS Berhane Hagos Gebreslassie ISBN: 978-84-693-7673-7/DL:T-1752-2010

rather than units which already operate with low 4Tmin (or high
UA−values). The unit with highest value of the CSB is the refrigerant
heat exchanger. The CSB’s of the refrigerant heat exchanger, the evap-
orator, the condenser, the generator and the absorber are higher than
one and therefore, an improvement of these units will improve the cycle
performance. The dephlegmator shows a different behaviour due to its
strong interactions with the rest of the cycle. Differences between the
cycle configurations are generally small. However, the optimum values
of the efficiency of each component depend also on the energy cost and
the capital investment and the annual operation time.
• Using the thermoeconomic optimization based on structural method
an equation is formulated that enables to estimate the optimal heat
exchanger area. This optimal area leads to minimum total cost and
the equation is generally valid for thermal systems (i.e., not limited to
absorption cycles). The optimum result agrees very well with the one
obtained from the integrated optimization algorithm of Engineering
Equation Solver (EES). In particular for a high operation cost (i.e, if
the operation time is high, 6000 h/year) the error between the proposed
equation and the numerical optimum is only 1.1 %. If the operation
time is less (2000 h/year) the results show about 3 % error. Because of
its easy application the proposed equation is useful at the design stage
of the thermal system.
• A bi-criteria nonlinear programming optimization problem that inte-
grates the environmental performance based on Eco-indicator 99 and
the total cost of an ammonia-water absorption cycle is developed. The
results reveal that a reduction by 5.5 % environmental impact (i.e.,
relative to the minimum total cost design) caused by the cycle can be
attained if the decision maker is willing to compromise the economic
performance of the system. These reductions are achieved by decreasing
the energy consumption, which on the other hand requires an increase
in the total cost of the cycle.
18
UNIVERSITAT ROVIRA I VIRGILI OPTIMIZATION OF ENVIRONMENTALLY FRIENDLY SOLAR ASSISTED ABSORPTION COOLING SYSTEMS Berhane Hagos Gebreslassie ISBN: 978-84-693-7673-7/DL:T-1752-2010
• The solar assisted absorption cooling system formulation and solution
approach is illustrated through a case study. A significant reduction
in the environmental impact (70.5 %) can be achieved if the decision-
maker is willing to invest on the solar collector’s subsystem. These
reductions can be attained by increasing the number of collectors in-
stalled, which increases the solar fraction of the cooling system. It
has also been shown that the type of collector selected depends on
the particular operating conditions and weather data considered in the
analysis. For Barcelona weather data the results show that the Syd-
ney type evacuated tube collector is selected for all Pareto alternatives.
However, for Tarragona weather data flat plates collectors are selected
in higher environmental impact Pareto alternative designs.
• Even though, the results of the optimization problem shows that tech-
nically reducing the global warming potential is viable at the current
energy prices and without considering governmental subsidies on solar
technologies, the use of solar energy in cooling applications is not prof-
itable. The method presented in this study is aimed in facilitating the
task of policy makers when deciding on the tax rates to promote more
sustainable technological alternatives. For example the case study re-
sults reveal that if the GHG emissions tax rate is increased beyond
58 C /tonCO2−eq, and the fuel cost beyond 0.0635 C /kWh the so-
lar assisted absorption cycles are not only attractive in environmental
performance but also economically becomes attractive.
19
UNIVERSITAT ROVIRA I VIRGILI OPTIMIZATION OF ENVIRONMENTALLY FRIENDLY SOLAR ASSISTED ABSORPTION COOLING SYSTEMS Berhane Hagos Gebreslassie ISBN: 978-84-693-7673-7/DL:T-1752-2010

Future works
• The absorption cycle model in GAMS can be modified to include the
detail distillation column models, different type of heat exchangers, and
H20− LiBr absorption cycles.
• The exergy and thermoeconomic analysis of the system could be inte-
grated in the GAMS model and used in the optimization.
• The solar assisted absorption cooling system assumes a steady state
for each month of the year. However, this could be improved to hourly
steady state operation. In this case the use of thermal storages could
improve the performance of the solar assisted absorption cycle. There-
fore, at this stage the model could be modified in order to include the
thermal storages. Moreover, the monthly cooling load was assumed
as constant parameter for the whole time horizon but this could be
modified to monthly/hourly cooling load.
• The uncertainty of the energy price is considered in the design of an
absorption cycle. This could be extended to the solar assisted absorp-
tion cooling system. The uncertainties in the environmental metrics,
design parameters, cooling demand, and weather data can be included
following the same procedures.
• The collector type and the number of collectors are determined based
on the collector performance equations and the module area. However,
the arrangement of the collectors is not studied. Therefore, the model
could be extended considering possible configurations.
20
UNIVERSITAT ROVIRA I VIRGILI OPTIMIZATION OF ENVIRONMENTALLY FRIENDLY SOLAR ASSISTED ABSORPTION COOLING SYSTEMS Berhane Hagos Gebreslassie ISBN: 978-84-693-7673-7/DL:T-1752-2010

Nomenclature
Abbreviations
AC Air conditioning
CFC Chlorofluorocarbon
CPC Compound parabolic collector
CSB Coefficients of structural bonds
ETC Evacuated tube collector
FPC Flat plate collector
GHG Greenhouse gas emissions
GWP Global warming potential
HCFC Hydro chlorofluorocarbon
IPCC Intergovernmental Panel on Climate Change
LCA Life cycle assessment
LP Linear programming problem
MINLP Mixed integer nonlinear programming problem
NLP Nonlinear programming problem
RMINLP Relaxed mixed integer nonlinear programming problem
Variables and parameters
UA Thermal conductance [kW/K]
4Tmin Heat exchanger minimum temperature difference (K)
ECO99 Eco-indicator 99 [points]
COP Coefficient of performance [-]
Ik Irreversibility rate of unit k [kW]
21
UNIVERSITAT ROVIRA I VIRGILI OPTIMIZATION OF ENVIRONMENTALLY FRIENDLY SOLAR ASSISTED ABSORPTION COOLING SYSTEMS Berhane Hagos Gebreslassie ISBN: 978-84-693-7673-7/DL:T-1752-2010

It Total irreversibility rate of the cooling system [kW]
x Set of design variables
Subscripts
k Unit (equipment) of the cooling system
t The whole cooling system
22
UNIVERSITAT ROVIRA I VIRGILI OPTIMIZATION OF ENVIRONMENTALLY FRIENDLY SOLAR ASSISTED ABSORPTION COOLING SYSTEMS Berhane Hagos Gebreslassie ISBN: 978-84-693-7673-7/DL:T-1752-2010

References
23
UNIVERSITAT ROVIRA I VIRGILI OPTIMIZATION OF ENVIRONMENTALLY FRIENDLY SOLAR ASSISTED ABSORPTION COOLING SYSTEMS Berhane Hagos Gebreslassie ISBN: 978-84-693-7673-7/DL:T-1752-2010
References
[1] Gebreslassie BH, Medrano M, Boer D. Exergy analysis of multi-effect
water-libr absorption systems: From half to triple effect. Renewable
Energy 2010;35(8):1773 –82.
[2] Boer D, Gebreslassie BH, Medrano M, Miquel N. Effect of internal heat
recovery in ammonia-water absorption cooling cycles: Exergy and struc-
tural analysis. International Journal of Thermodynamics 2009;12:17–27.
[3] Gebreslassie BH, Medrano M, Mendes F, Boer D. Optimum heat ex-
changer area estimation using coefficients of structural bonds: Appli-
cation to an absorption chiller. International Journal of Refrigeration
2010;33:529–37.
[4] Gebreslassie BH, Guillen-Gosalbez G, Jimenez L, Boer D. Design of en-
vironmentally conscious absorption cooling systems via multi-objective
optimization and life cycle assessment. Applied Energy 2009;86:1712–22.
[5] Gebreslassie BH, Guillen-Gosalbez G, Jimenez L, Boer D. Economic
performance optimization of an absorption cooling system under uncer-
tainity. Applied Thermal Engineering 2009;29:3491–500.
[6] Gebreslassie BH, Guillen-Gosalbez G, Jimenez L, Boer D. A systematic
tool for the minimization of the life cycle impact of solar assisted absorp-
tion cooling systems. Energy 2010;DOI: 10.1016/j.energy.2010.05.039.
[7] Gebreslassie BH, Guillen-Gosalbez G, Jimenez L, Boer D. Solar as-
sisted absorption cooling cycles for reduction of global warming: a multi-
24
UNIVERSITAT ROVIRA I VIRGILI OPTIMIZATION OF ENVIRONMENTALLY FRIENDLY SOLAR ASSISTED ABSORPTION COOLING SYSTEMS Berhane Hagos Gebreslassie ISBN: 978-84-693-7673-7/DL:T-1752-2010

objective optimization approach. Renewable Energy 2010;Under revision
.
[8] Cai YP, Huang GH, Yang ZF, Tan Q. Identification of optimal strategies
for energy management systems planning under multiple uncertainties.
Applied Energy 2009;86(4):480–95.
[9] Lin QG, Huang GH, Bass B, Qin XS. Iftem: An interval-fuzzy two-
stage stochastic optimization model for regional energy systems planning
under uncertainty. Energy Policy 2009;37:868–78.
[10] Commission of the European Communities C. Towards a european
strategy for the security of energy supply. Tech. Rep.; 2000.
[11] Casals XG. Solar absorption cooling in spain: Perspectives and out-
comes from the simulation of recent instalations. Renewable Energy
2006;31:1371–89.
[12] Balaras CA, Grossman G, Henning HM, Ferreira CAI, Podesser E, Wang
L, et al. Solar air conditioning in Europe–an overview. Renewable and
Sustainable Energy Reviews 2007;2:299 – 314.
[13] Henning HM. Solar assisted air conditioning of buildings - an overview.
Applied Thermal Engineering 2007;27:1734–49.
[14] Rosiek S, Batlles FJ. Integration of the solar thermal energy in the con-
struction: Analysis of the solar-assisted air-conditioning system installed
in ciesol building. Renewable Energy 2009;34:1423–31.
[15] Doukas H, Patlitzianas KD, Kagiannas AG, Psarras J. Renewable en-
ergy sources and rationale use of energy development in the countries of
GCC: Myth or reality? Renewable Energy 2006;34:755–70.
[16] Jaruwongwittaya T, Chen G. A review: Renewable energy with absorp-
tion chillers in thailand. Renewable and Sustainable Energy Reviews
2009;14:1437–44.
25
UNIVERSITAT ROVIRA I VIRGILI OPTIMIZATION OF ENVIRONMENTALLY FRIENDLY SOLAR ASSISTED ABSORPTION COOLING SYSTEMS Berhane Hagos Gebreslassie ISBN: 978-84-693-7673-7/DL:T-1752-2010
[17] Dorgan CB, Leight SP, Dorgan CE. Application guide for absorption
cooling/refrigeration using recovered heat. 1995.
[18] Misra RD, Sahoo PK, Sahoo S, Gupta A. Thermoeconomic otimiza-
tion of a single effect water/libr vapour absorption refrigeration system.
International Journal of Refrigeration 2003;26(2):158–69.
[19] Misra RD, Sahoo PK, Gupta A. Thermoeconomic evaluation and op-
timization of a double-effect h 2o/libr vapour-absorption refrigeration
system. International Journal of Refrigeration 2005;28(3):331–43.
[20] Misra R, Sahoo P, Gupta A. Thermoeconomic evaluation and opti-
mization of an aqua-ammonia vapour-absorption refrigeration system.
International Journal of Refrigeration 2006;29(1):47–59.
[21] Dingec H, Ileri A. Thermoeconomic optimization of simple refrigerators.
International Journal of Energy Research 1999;23(11):949–62.
[22] Dentice M, Vanoli L. Thermoeconomic optimisation of the condenser in
a vapour compression heat pump. International Journal of Refrigeration
2004;27(4):433–41.
[23] Selbas R, Kizilkan O, Sencan A. Thermoeconomic optimization of sub-
cooled and superheated vapor compression refrigeration cycle. Energy
2006;31:2108–28.
[24] Kizilkan O, Sencan A, Kalogirou SA. Thermoeconomic optimization
of a libr absorption refrigeration system. Chemical Engineering and
Processing: Process Intensification 2007;46(12):1376–84.
[25] Chavez-Islas LM, Heard CL. Design and analysis of an ammonia-water
absorption refrigeration cycle by means of an equation-oriented method.
Industrial & Engineering Chemistry Research 2009;48(4):1944–56.
[26] Chavez-Islas LM, Heard CL. Optimization of a simple ammonia-
water absorption refrigeration cycle by application of mixed-integer
nonlinear programming. Industrial & Engineering Chemistry Research
2009;48(4):1957–72.
26
UNIVERSITAT ROVIRA I VIRGILI OPTIMIZATION OF ENVIRONMENTALLY FRIENDLY SOLAR ASSISTED ABSORPTION COOLING SYSTEMS Berhane Hagos Gebreslassie ISBN: 978-84-693-7673-7/DL:T-1752-2010
[27] Chavez-Islas LM, Heard CL, Grossmann IE. Synthesis and optimiza-
tion of an ammonia-water absorption refrigeration cycle considering dif-
ferent types of heat exchangers by application of mixed-integer non-
linear programming. Industrial & Engineering Chemistry Research
2009;48(6):2972–90.
[28] Kotas TJ. The exergy method of thermal plant analysis. Krieger Pub-
lishing Company; 1995.
[29] Bejan A, Tsatsaronis G, Moran M. Thermal Design & Optimization.
John Wiley & Sons Inc.; 1996.
[30] Edgar TF, Himmelblau DM, Lasdon LS. Optimization of chemical pro-
cesses. McGraw-Hill; 2001.
[31] Anand DK, Lindler KW, Schweitzer S, Kennish WJ. Second law analysis
of solar powered absorption cooling cycles and systems. Journal of Solar
Energy Engineering, Transactions of the ASME 1984;106(3):291–8.
[32] Koehler WJ, Ibele WE, Soltes J, Winter ER. Availability simulation of
a lithium bromide absorption heat pump. Heat Recovery Systems and
CHP 1988;8(2):157–71.
[33] Aphornratana S, Eames I. Thermodynamic analysis of absorption re-
frigeration cycles using the second law of thermodynamics method. In-
ternational Journal of Refrigeration 1994;18(4):244–52.
[34] Talbi M, Agnew B. Exergy analysis: An absorption refrigerator using
lithium bromide and water as the working fluids. Applied Thermal
Engineering 2000;20:619–30.
[35] Kilic M, Kaynakli O. Second law-based thermodynamic analysis
of water-lithium bromide absorption refrigeration system. Energy
2007;32(8):1505–12.
27
UNIVERSITAT ROVIRA I VIRGILI OPTIMIZATION OF ENVIRONMENTALLY FRIENDLY SOLAR ASSISTED ABSORPTION COOLING SYSTEMS Berhane Hagos Gebreslassie ISBN: 978-84-693-7673-7/DL:T-1752-2010

[36] Ataer E, Gogus Y. Comparative study of irreversibilities in an aqua-
ammonia absorption refrigeration system. International Journal of Re-
frigeration 1991;14(2):86–92.
[37] Best R, Islas J, Martınez M. Exergy efficiency of an ammonia-water
absorption system for ice production. Applied Energy 1993;45:241–56.
[38] Grossman G, Wilk M, De Vault RC. Simulation and performance
analysis of triple-effect absorption cycles. ASHRAE Transactions 1994
1994;100(1):452–62.
[39] Lee SF, Sherif S. Second-law analysis of multi-effect lithium bro-
mide/water absorption chillers. In: ASHRAE Transactions; vol. 105.
1999,.
[40] Morosuk T, Tsatsaronis G. A new approach to the exergy analysis of
absorption refrigeration machines. Energy 2008;33(6):890–907.
[41] Beyer J. Strukturuntersuchungen-notwendiger bestandteil der effek-
tivita tsanalyse von waermeverbrauchersystemen. Energieanwendung
1970;19(12):358–61.
[42] Beyer J. Struktur waermetechnischer systeme und oekonomische opti-
mierung der systemparameter. Energieanwendung 1974;23(9):274–9.
[43] Boer D, Medrano M, Nogues M. Exergy and structural analysis of an
absorption cooling cycle and the effect of efficiency parameters. Inter-
national Journal of Thermodynamics 2005;8(4):191–8.
[44] Brooke A, Kendrik D, Meeraus A, Raman R, Rosenthal RE. GAMS -
A User’s Guide. GAMS Development Corporation, Washington; 1998.
[45] F-Chart Software . Engineering Equation Solver, (EES).
www.fchart.com 2008.
[46] Chemical Engineering . Chemical Engineering Plant Cost Index
(CEPCI). Tech. Rep. 2009.
28
UNIVERSITAT ROVIRA I VIRGILI OPTIMIZATION OF ENVIRONMENTALLY FRIENDLY SOLAR ASSISTED ABSORPTION COOLING SYSTEMS Berhane Hagos Gebreslassie ISBN: 978-84-693-7673-7/DL:T-1752-2010
[47] Guillen-Gosalbez G, Grossmann IE. A global optimization strategy for
the environmentally conscious design of chemical supply chains under
uncertainty in the damage assessment model. Computers & Chemical
Engineering 2010;34(1):42–58.
[48] Hugo A, Ciumei C, Buxton A, Pistikopoulos EN. Environmental impact
minimization through material substitution: a multi-objective optimiza-
tion approach. Green Chemistry 2004;6:407–17.
[49] Azapagic A. Life cycle assessment and its application to process selec-
tion, design and optimisation. Chemical Engineering Journal 1999;73:1–
21.
[50] PRe-Consultants . The eco-indicator 99, a damage oriented method
for life cycle impact assessment. methodology report and manual for
designers. Tech. Rep.; PRe Consultants, Amersfoort, The Netherlands;
2000.
[51] PRe-Consultants . SimaPro 7 LCA software. The Netherlands
(www.pre.nl/simapro/default.htm); 2008.
[52] Metz B, Davidson O, Bosch P, Dave R, Meyer L. IPCC, 2007: Summary
for Policymakers. In: Climate Change 2007: Mitigation. Contribution of
Working Group III to the Fourth Assessment Report of the International
Panel on Climate Change. Cambridge University Press, Cambridge,
United Kingdom and Newyork, NY, USA.; 2007.
[53] IRAM-ISO 14040 . Environmental management-Life cycle assessment-
Principles and frame work. 2006.
[54] Tveit TM, Savola T, Gebremedhin A, Fogelholm CJ. Multi-period
MINLP model for optimising operation and structural changes to CHP
plants in district heating networks with long-term thermal storage. En-
ergy Conversion and Management 2009;50:639–47.
29
UNIVERSITAT ROVIRA I VIRGILI OPTIMIZATION OF ENVIRONMENTALLY FRIENDLY SOLAR ASSISTED ABSORPTION COOLING SYSTEMS Berhane Hagos Gebreslassie ISBN: 978-84-693-7673-7/DL:T-1752-2010

[55] Savola T, Fogelholm CJ. MINLP optimisation model for increased
power production in small-scale CHP plants. Applied Thermal Engi-
neering 2007;27(1):89–99.
[56] Wang J, Dai Y, Gao L. Parametric analysis and optimization for a com-
bined power and refrigeration cycle. Applied Energy 2008;85(11):1071–
85.
[57] Zhao Y, Shigang Z, Haibe Z. Optimization study of combined refriger-
ation cycles driven by an engine. Applied Energy 2003;76(4):379 –89.
[58] Sahinidis NV. Optimization under uncertainty: state-of-the-art and
opportunities. Computers & Chemical Engineering 2004;28(6-7):971–
83.
[59] Subrahmanyam S, Pekny JF, Reklaitis GV. Design of batch chemical
plants under market uncertainty. Industrial & Engineering Chemistry
Research 1994;33(11):2688–701.
[60] Pistikopoulos EN. Uncertainty in process design and operations. Com-
puters & Chemical Engineering 1995;19(Supplement 1):553–63.
[61] Lahdelma R, Makkonen S, Salminen P. Two ways to handle dependent
uncertainties in multi-criteria decision problems. Omega 2009;37(1):79–
92.
[62] Durbach IN, Stewart TJ. Using expected values to simplify decision
making under uncertainty. Omega 2009;37(2):312–30.
[63] Azaron A, Brown KN, Tarim SA, Modarres M. A multi-objective
stochastic programming approach for supply chain design considering
risk. International Journal of Production Economics 2008;116:129–38.
[64] Guillen G, Mele FD, Bagajewicz MJ, Espuna A, Puigjaner L. Multi-
objective supply chain design under uncertainty. Chemical Engineering
Science 2005;60(6):1535–53.
30
UNIVERSITAT ROVIRA I VIRGILI OPTIMIZATION OF ENVIRONMENTALLY FRIENDLY SOLAR ASSISTED ABSORPTION COOLING SYSTEMS Berhane Hagos Gebreslassie ISBN: 978-84-693-7673-7/DL:T-1752-2010

[65] Barbaro A, Bagajewicz MJ. Managing financial risk in planning under
uncertainty. Aiche Journal 2004;50(5):963–89.
[66] Gupta A, Maranas CD. Managing demand uncertainty in supply chain
planning. Computers & Chemical Engineering 2003;27(8-9):1219–27.
[67] Mavrotas G, Demertzis H, Meintani A, Diakoulaki D. Energy planning
in buildings under uncertainty in fuel costs: The case of a hotel unit in
greece. Energy Conversion and Management 2003;44(8):1303–21.
[68] Sadeghi M, Mirshojaeian Hosseini H. Energy supply planning in iran
by using fuzzy linear programming approach (regarding uncertainties of
investment costs). Energy Policy 2006;34(9):993–1003.
[69] Yokoyama R, Ito K. Optimal design of energy supply systems based
on relative robustness criterion. Energy Conversion and Management
2002;43(4):499–514.
[70] Petkov SB, Maranas CD. Design of multiproduct batch plants under
demand uncertainty with staged capacity expansions. Computers &
Chemical Engineering 1998;22:S789–92.
31
UNIVERSITAT ROVIRA I VIRGILI OPTIMIZATION OF ENVIRONMENTALLY FRIENDLY SOLAR ASSISTED ABSORPTION COOLING SYSTEMS Berhane Hagos Gebreslassie ISBN: 978-84-693-7673-7/DL:T-1752-2010

Appendix A
Appendices
A.1 List of publications
five published, one accepted and one under revision
1. B. H. Gebreslassie, M. Medrano, and D. Boer. Ex-
ergy analysis of multi-effect water-LiBr absorption systems:
From half to triple effect. Renewable Energy, 35(8):1773-
1782 , 2010.
2. D. Boer, B. H. Gebreslassie, M. Medrano, M. Nogues.
Effect of internal Heat Recovery in Ammonia-Water Ab-
sorption Cooling Cycles: Exergy and structural Analysis.
International Journal of Thermodynamics, 12(1):17–27, 2009.
3. B. H. Gebreslassie, M. Medrano, L.F. Mendes and D.
Boer. Thermoeconomic Optimization of Absorption Cool-
ing Cycle Using Structural Coefficient. International Jour-
nal of Refrigeration, 33(3):529-537, 2010.
4. B. H. Gebreslassie, G. Guillen-Gosalbez, L. Jimenez, D.
Boer. Design of environmentally conscious absorption cool-
32
UNIVERSITAT ROVIRA I VIRGILI OPTIMIZATION OF ENVIRONMENTALLY FRIENDLY SOLAR ASSISTED ABSORPTION COOLING SYSTEMS Berhane Hagos Gebreslassie ISBN: 978-84-693-7673-7/DL:T-1752-2010
ing systems via multi-objective optimization and life cycle
assessment. Applied Energy, 86(9):1712-1722, 2009.
5. B. H. Gebreslassie, G. Guillen-Gosalbez, L. Jimenez, D.
Boer. Economic performance optimization of an absorp-
tion cooling system under uncertainty. Applied Thermal
Engineering, 29(17-18):3491-3500, 2009.
6. B. H. Gebreslassie, G. Guillen-Gosalbez, L. Jimenez, D.
Boer. A systematic tool for the minimization of the life
cycle impact of solar assisted absorption cooling systems.
Energy, DOI: 10.1016/j.energy.2010.05.039, 2010.
7. B. H. Gebreslassie, G. Guillen-Gosalbez, L. Jimenez, D.
Boer. Solar assisted absorption cooling cycles for reduc-
tion of global warming: a multi-objective optimization ap-
proach. Submitted to Renewable Energy, 2010.
A.2 Congress contributions
1. B. H. Gebreslassie, M. Jimenez, G. Guillen-Gosalbez,
L. Jimenez, D. Boer. Multi-objective optimization of solar
assisted absorption cooling system. 20th European Sympo-
sium on Computer Aided Chemical Engineering (ESCAPE20)
Ischia, Italy, June 2010.
2. B. H. Gebreslassie, G. Guillen-Gosalbez, L. Jimenez,
D. Boer. Optimization of the Economic and Environmen-
tal Performance of an Ammonia-Water Absorption Cool-
ing Cycle. 2009 AIChE Annual Meeting. Nashville, TN
33
UNIVERSITAT ROVIRA I VIRGILI OPTIMIZATION OF ENVIRONMENTALLY FRIENDLY SOLAR ASSISTED ABSORPTION COOLING SYSTEMS Berhane Hagos Gebreslassie ISBN: 978-84-693-7673-7/DL:T-1752-2010
(USA), November 2009.
3. B. H. Gebreslassie, G. Guillen-Gosalbez, L. Jimenez, Di-
eter Boer,. Optimizacion economica de sistemas de refrig-
eracion por absorcion considerando el impacto medioambi-
ental y la incertidumbre de los parametros. VI Jornadas
de Ingenier Termodinamica, Cordoba (Spain), 2009.
4. B. H. Gebreslassie, G. Guillen-Gosalbez, L. Jimenez, D.
Boer. Design of environmentally friendly absorption cool-
ing systems via multi-objective optimization. ESCAPE 19
Cracow, Poland, June 2009.
5. B. H. Gebreslassie, G. Guillen-Gosalbez, L. Jimenez, D.
Boer. A systematic method for the environmentally con-
scious design of absorption cooling cycles. 11th Mediter-
ranean Congress of Chemical Engineering, Barcelona (SPAIN),
2008.
6. G. Guillen-Gosalbez, F.D. Mele, B. H. Gebreslassie, L.
Jimenez. Strategic planning of supply chains for biofuels
production via multi-objective optimization and life cycle
assessment. 11th Mediterranean Congress of Chemical En-
gineering, Barcelona (SPAIN), 2008.
7. Mendes L.F, J.P. Cardoso, A.Mortal, Boer, D, B.H. Ge-
breslassie, M. Medrano. Thermoeconomic optimization
of a solar absorption cooling system. Solar Air Condition-
ing 2nd International Conference of Solar Air-Conditioning.
Tarragona (Spain), Pages: 172-177, 2007.
34
UNIVERSITAT ROVIRA I VIRGILI OPTIMIZATION OF ENVIRONMENTALLY FRIENDLY SOLAR ASSISTED ABSORPTION COOLING SYSTEMS Berhane Hagos Gebreslassie ISBN: 978-84-693-7673-7/DL:T-1752-2010

8. Mendes L.F, J.P. Cardoso, A.Mortal, Boer, D, B. H. Ge-
breslassie, M. Medrano. Exergy analysis of a solar absorp-
tion cooling system”. Presentation of a communication. 2nd
International Conference of Solar Air-Conditioning. Tar-
ragona (Spain), Pages :166-171, 2007.
A.3 Book chapters
1. B. H. Gebreslassie, M. Jimenez, G. Guillen-Gosalbez,
L. Jimenez, D. Boer. Multi-objective optimization of so-
lar assisted absorption cooling system. Computer Aided
Chemical Engineering , Elsevier, Vol. 28: 1033-1038, ISBN:
978-0-444-53569-6, 2010.
2. B. H. Gebreslassie, G. Guillen-Gosalbez, L. Jimenez, D.
Boer. Design of environmentally friendly absorption cool-
ing systems via multi-objective optimization. Computer
Aided Chemical Engineering, Elsevier, Vol. 26: 1099-1103,
ISBN: 978-0-444-53441-5, 2009.
35
UNIVERSITAT ROVIRA I VIRGILI OPTIMIZATION OF ENVIRONMENTALLY FRIENDLY SOLAR ASSISTED ABSORPTION COOLING SYSTEMS Berhane Hagos Gebreslassie ISBN: 978-84-693-7673-7/DL:T-1752-2010

lable at ScienceDirect
Renewable Energy 35 (2010) 1773–1782
UNIVERSITAT ROVIRA I VIRGILI OPTIMIZATION OF ENVIRONMENTALLY FRIENDLY SOLAR ASSISTED ABSORPTION COOLING SYSTEMS Berhane Hagos Gebreslassie ISBN: 978-84-693-7673-7/DL:T-1752-2010
Contents lists avai
Renewable Energy
journal homepage: www.elsevier .com/locate/renene
Exergy analysis of multi-effect water–LiBr absorption systems:From half to triple effect
Berhane H. Gebreslassie a, Marc Medrano b, Dieter Boer a,*
a Departament d’Enginyeria Mecanica, Universitat Rovira i Virgili, Av. Paısos Catalans 26, 43007 Tarragona, Spainb GREA Innovacio Concurrent, Edifici CREA, Universitat de Lleida, Pere de Cabrera s/n, 25001 Lleida, Spain
a r t i c l e i n f o
Article history:Received 3 September 2009Accepted 8 January 2010Available online 8 February 2010
Keywords:Absorption cycleWater–Lithium bromideExergy analysisDouble effectTriple effectHalf effect
* Corresponding author. Fax: þ34 977559691.E-mail address: [email protected] (D. Boer).
0960-1481/$ – see front matter � 2010 Elsevier Ltd.doi:10.1016/j.renene.2010.01.009
a b s t r a c t
An exergy analysis, which only considers the unavoidable exergy destruction, is conducted for single,double, triple and half effect Water–Lithium bromide absorption cycles. Thus, the obtained performancesrepresent the maximum achievable performance under the given operation conditions.
The coefficient of performance (COP), the exergetic efficiencies and the exergy destruction rates aredetermined and the effect of the heat source temperature is evaluated. As expected, the COP increasessignificantly from double lift to triple effect cycles. The exergetic efficiency varies less among thedifferent configurations. In all cycles the effect of the heat source temperature on the exergy destructionrates is similar for the same type of components, while the quantitative contributions depend on cycletype and flow configuration. Largest exergy destruction occurs in the absorbers and generators, espe-cially at higher heat source temperatures.
� 2010 Elsevier Ltd. All rights reserved.
1. Introduction
The thermal refrigeration or thermally activated refrigeration, isbased on the use of a heat driven absorption unit [1]. In this coolingsystem the energy input to the generator can be heat fromrenewable energies such as solar thermal energy and biomass(Fig. 1). Depending on the available temperature level differentcycle configurations can be used. These cycles are generally eval-uated in terms of their Coefficient of Performance (COP).Compression cycles have significant higher COP’s than absorptioncycles. Among the absorption cycles, multi-stage cycles have higherCOP’s than the basic configuration, but need higher driving heattemperatures. Best energetic efficiency is obtained by triple effectconfigurations, followed by double effect and single effect. For verylow heat input temperatures the half effect (also called double lift)configuration can be applied, but it presents the lowest COP.
This change in driving temperature and thus quality of the inputenergy is not taken into account by the COP, but it is considered inthe exergy analysis [2–4]. Using exergy efficiencies we can compareon a rational basis cycles with different types of energy input, inform of heat at different temperature levels or work. The exergyanalysis of absorption cycles started in the eighties with publica-tions describing the methodology and the evaluation of the exergy
All rights reserved.
destruction rates and exergy efficiencies [5–7]. Studies focussing onthe effect of operation temperatures and heat exchangers effec-tiveness has been done for single effect cycles with both the water–LiBr [8–10] or the ammonia-water working pair [11,12]. Theworking pairs have also been directly compared [5,13]. Anand et al.[5] considered the influence of the effectiveness of the heatexchangers on the cycle, and found the highest increase of theexergetic efficiency by improving solution and refrigerant heatexchangers. Koehler et al. [6] reported for a water–LiBr cycle a largeeffect of the solution heat exchanger, while the refrigerant heatexchanger was less important. They also stated a high interde-pendence between various components. Meunier et al. [14]compared for different sorption systems, namely, adsorption,chemical reaction and liquid absorption heat pumps, the maincontributions to entropy generation.
Besides the single effect configuration different authors deter-mined also for double effect [5,15–20] and triple effect cycles [16]exergy destruction rates and exergetic efficiencies. Jeong et al. [21]used the exergy analysis to obtain an optimum design for anabsorption cycle. Sencan et al. [22] evaluated for a water–LiBr singleeffect cycle the effect of the operating conditions on COP andexergetic efficiency and discussed the main factors which cause theexergy destruction in absorption systems.
Results of the different studies are often difficult to compare anddiffer in the conclusions obtained, especially if different cycleconfigurations are analyzed. Basically this is due to the differentmethodologies and assumptions considered in each analysis. An

Nomenclature
COP Coefficient of performance [–]eph Specific physical exergy [kJ/kg]h Specific enthalpy [kJ/kg]_ED Exergy destruction rate [kW]_EF Exergy input (Fuel F) [kW]_EP Exergy output (Product P) [kW]_m Mass flow rate [kJ/s]
P Pressure [kPa]_Q Heat transfer rate [kW]
s Specific entropy [kJ/kg K]T Temperature [�C or K]_Wpump Mechanical power of the pump [kW]
x Mass concentration of Lithium bromide [%]UA Product of overall heat transfer coefficient and heat
exchanger area [kW/K]
Greek symbolsJ Exergetic efficiency [–]s Dimensionless exergetic temperature [–]
Subscriptse exit
h highi inletk componentl lowm middle0 thermodynamic environment
AbbreviationsA AbsorberC CondenserCG Condenser-GeneratorDS Double effect series flowDP Double effect parallel flowDR Double effect reverse flowE EvaporatorG GeneratorH Half effectHE Solution heat exchangerLiBr Lithium bromideS Single effectTS Triple effect series flowTP Triple effect parallel flow
B.H. Gebreslassie et al. / Renewable Energy 35 (2010) 1773–17821774
UNIVERSITAT ROVIRA I VIRGILI OPTIMIZATION OF ENVIRONMENTALLY FRIENDLY SOLAR ASSISTED ABSORPTION COOLING SYSTEMS Berhane Hagos Gebreslassie ISBN: 978-84-693-7673-7/DL:T-1752-2010
approach comparing three different cycles has been proposed by[16]. Their study evaluates for a single, a double and a triple effectcycle COP’s and exergetic efficiencies for given UA value of thecomponents. The results obtained are valid for these designs, butmay change for other design specifications.
Indeed, in the former analysis the exergy destruction rates werealways evaluated without distinguishing the avoidable andunavoidable part. Morosuk and Tsatsaronis [23] proposed splittingthe exergy destruction into endogenous/exogenous and unavoid-able/avoidable parts, in order to facilitate the understanding andthe improvement of the considered systems. The exergy destruc-tion rate, which cannot be further reduced by design improve-ments, represents the unavoidable part. The designer has to focuson the avoidable part, which represents the potential forimproving. In thermoeconomic analysis its cost can be comparedwith the avoidable investment costs, and improvements can center
Fig. 1. Basic absorption cycle.
on the most relevant components [24]. Parameters as the modifiedexergoeconomic factor based on the avoidable costs can be intro-duced [25].
The purpose of this paper is to compare different configurationsof absorption cycles taking into account only the unavoidable exergydestruction. Thus, the results represent the maximum obtainableperformance and are not affected by design specifications. Theexergy analysis of seven different multi-stage absorption cycles(Table 1) has been achieved applying the same methodology andassumptions for all cycles. The exergetic efficiencies for the differentcycles and exergy destruction rates in the main componentsdepending on the heat source temperature have been obtained.Thus, the origin of the exergy destruction in the different cycles canbe quantified and compared. The analysis will consider typicalcooling conditions with fixed temperatures of the chilled water andcooling water, while the heat source temperature will be varied.
2. Description of the absorption cycle configurations
The operation and the configuration of absorption cycles alreadyhave been described in detail elsewhere [1]. Therefore, only theschematics of the different configurations will be presented (Figs.2–8), starting with the basic single effect configuration. The cyclesare presented in pressure–temperature diagrams. Based on thesingle effect cycle, more complicated cycles can be obtained inorder to improve the energy efficiency or the achievable
Table 1Considered multi-effect water–LiBr cycles.
Cycle Abbreviations
Half effect HSingle effect SDouble effect series flow DSDouble effect parallel flow DPDouble effect reverse flow DRTriple effect series flow TSTriple effect parallel flow TP
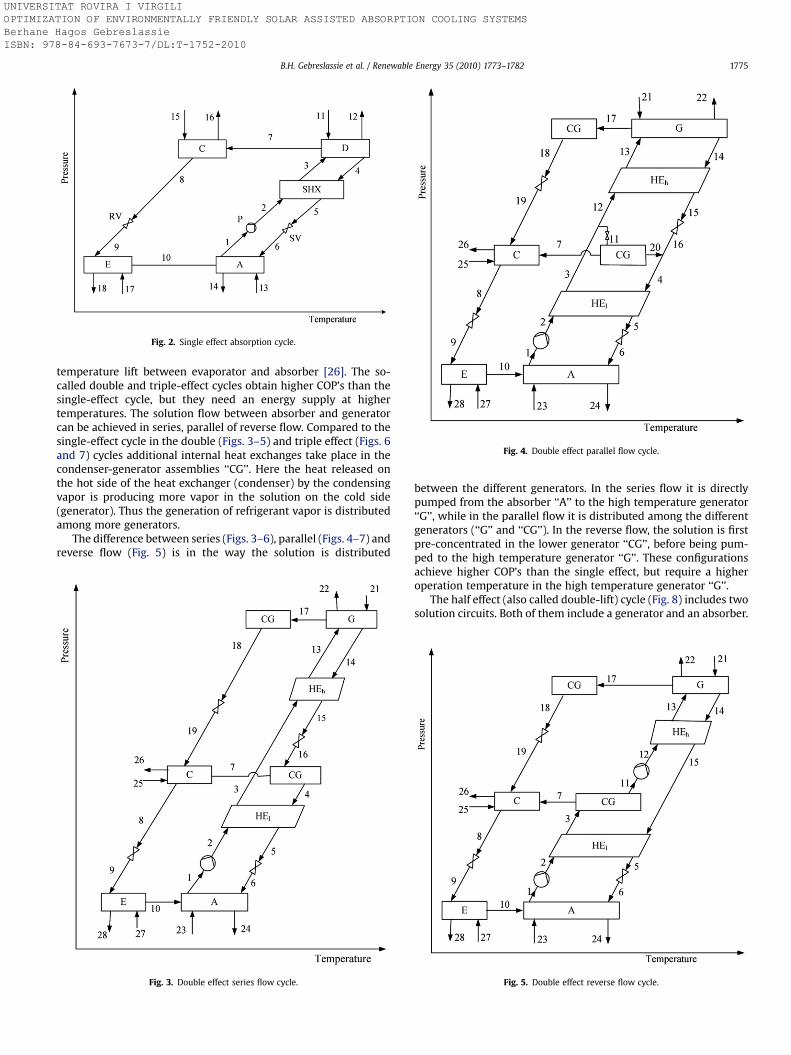
Fig. 2. Single effect absorption cycle.
Fig. 4. Double effect parallel flow cycle.
B.H. Gebreslassie et al. / Renewable Energy 35 (2010) 1773–1782 1775
UNIVERSITAT ROVIRA I VIRGILI OPTIMIZATION OF ENVIRONMENTALLY FRIENDLY SOLAR ASSISTED ABSORPTION COOLING SYSTEMS Berhane Hagos Gebreslassie ISBN: 978-84-693-7673-7/DL:T-1752-2010
temperature lift between evaporator and absorber [26]. The so-called double and triple-effect cycles obtain higher COP’s than thesingle-effect cycle, but they need an energy supply at highertemperatures. The solution flow between absorber and generatorcan be achieved in series, parallel of reverse flow. Compared to thesingle-effect cycle in the double (Figs. 3–5) and triple effect (Figs. 6and 7) cycles additional internal heat exchanges take place in thecondenser-generator assemblies ‘‘CG’’. Here the heat released onthe hot side of the heat exchanger (condenser) by the condensingvapor is producing more vapor in the solution on the cold side(generator). Thus the generation of refrigerant vapor is distributedamong more generators.
The difference between series (Figs. 3–6), parallel (Figs. 4–7) andreverse flow (Fig. 5) is in the way the solution is distributed
Fig. 3. Double effect series flow cycle.
between the different generators. In the series flow it is directlypumped from the absorber ‘‘A’’ to the high temperature generator‘‘G’’, while in the parallel flow it is distributed among the differentgenerators (‘‘G’’ and ‘‘CG’’). In the reverse flow, the solution is firstpre-concentrated in the lower generator ‘‘CG’’, before being pum-ped to the high temperature generator ‘‘G’’. These configurationsachieve higher COP’s than the single effect, but require a higheroperation temperature in the high temperature generator ‘‘G’’.
The half effect (also called double-lift) cycle (Fig. 8) includes twosolution circuits. Both of them include a generator and an absorber.
Fig. 5. Double effect reverse flow cycle.

Fig. 6. Triple effect series flow cycle.
Fig. 7. Triple effect parallel flow cycle.
Fig. 8. Half effect cycle.
B.H. Gebreslassie et al. / Renewable Energy 35 (2010) 1773–17821776
UNIVERSITAT ROVIRA I VIRGILI OPTIMIZATION OF ENVIRONMENTALLY FRIENDLY SOLAR ASSISTED ABSORPTION COOLING SYSTEMS Berhane Hagos Gebreslassie ISBN: 978-84-693-7673-7/DL:T-1752-2010
The vapor generated in the generator of the low pressure circuit‘‘Gl’’ enters in the absorber of the high pressure circuit ‘‘Ah’’. Heat issupplied at the same temperature to both generators and dissi-pated at an intermediate temperature in the condenser and the lowand high absorber. This configuration can work at a considerablylower generator temperature, than the single-effect cycle, but at thecost of a lower COP.
3. Methodology of the simulation
A computer code for simulating the cycles has been establishedusing the program Engineering Equation Solver [27]. Properties forwater–LiBr have been evaluated by the correlations from [28].These correlations are valid for temperatures up to 210 �C, asrequired in the triple effect cycles. Properties for all state point havebeen evaluated.
The input data, output data and main assumptions are pre-sented below. For this study, typical cooling operating conditionshave been chosen [29,30]. In order to consider only unavoidableirreversibilities the minimum temperature difference in the heatexchangers is fixed to a value of 0.2 K [23] and heat and pressurelosses are not considered. The characteristic parameters are givenin Table 2. The generator temperature is varied in the feasible range.The lowest temperature (cut-off temperature) corresponds toa concentration difference between the entering and leavingsolution in one of the absorbers or generators of the cycle, whichapproaches zero and thus leads to very high solution flow rates. The
Table 2Characteristic parameters.
Evaporator cooling capacity _QE 1000 kWTemperaturesChilled water inlet/outlet (E) 11.7/7.2 �CCooling water inlet/outlet (parallel flow through A and C) 29.4 �C/32 �CMinimum temperature difference in heat exchangers 0.2 KEnvironmental temperature T0 298 KEnvironmental pressure p0 100 kPa
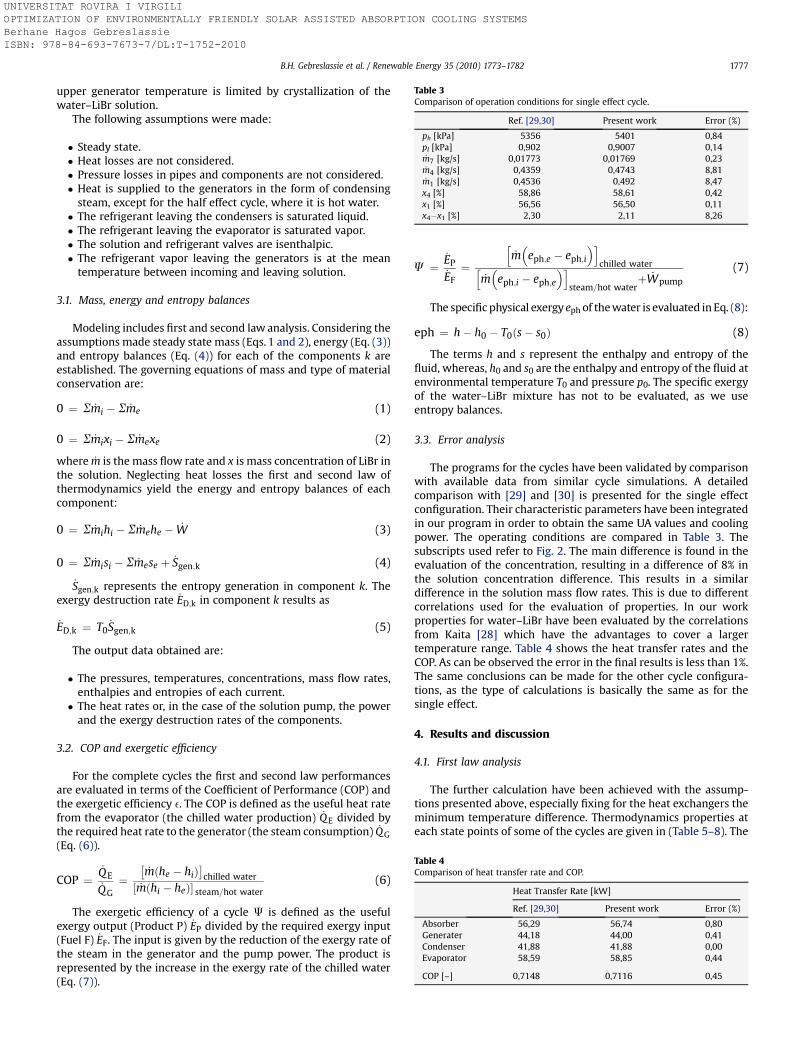
Table 3Comparison of operation conditions for single effect cycle.
Ref. [29,30] Present work Error (%)
ph [kPa] 5356 5401 0,84pl [kPa] 0,902 0,9007 0,14_m7 [kg/s] 0,01773 0,01769 0,23_m4 [kg/s] 0,4359 0,4743 8,81_m1 [kg/s] 0,4536 0,492 8,47
x4 [%] 58,86 58,61 0,42x1 [%] 56,56 56,50 0,11x4�x1 [%] 2,30 2,11 8,26
Table 4Comparison of heat transfer rate and COP.
Heat Transfer Rate [kW]
Ref. [29,30] Present work Error (%)
Absorber 56,29 56,74 0,80Generater 44,18 44,00 0,41Condenser 41,88 41,88 0,00Evaporator 58,59 58,85 0,44
COP [–] 0,7148 0,7116 0,45
B.H. Gebreslassie et al. / Renewable Energy 35 (2010) 1773–1782 1777
UNIVERSITAT ROVIRA I VIRGILI OPTIMIZATION OF ENVIRONMENTALLY FRIENDLY SOLAR ASSISTED ABSORPTION COOLING SYSTEMS Berhane Hagos Gebreslassie ISBN: 978-84-693-7673-7/DL:T-1752-2010
upper generator temperature is limited by crystallization of thewater–LiBr solution.
The following assumptions were made:
� Steady state.� Heat losses are not considered.� Pressure losses in pipes and components are not considered.� Heat is supplied to the generators in the form of condensing
steam, except for the half effect cycle, where it is hot water.� The refrigerant leaving the condensers is saturated liquid.� The refrigerant leaving the evaporator is saturated vapor.� The solution and refrigerant valves are isenthalpic.� The refrigerant vapor leaving the generators is at the mean
temperature between incoming and leaving solution.
3.1. Mass, energy and entropy balances
Modeling includes first and second law analysis. Considering theassumptions made steady state mass (Eqs. 1 and 2), energy (Eq. (3))and entropy balances (Eq. (4)) for each of the components k areestablished. The governing equations of mass and type of materialconservation are:
0 ¼ S _mi � S _me (1)
0 ¼ S _mixi � S _mexe (2)
where _m is the mass flow rate and x is mass concentration of LiBr inthe solution. Neglecting heat losses the first and second law ofthermodynamics yield the energy and entropy balances of eachcomponent:
0 ¼ S _mihi � S _mehe � _W (3)
0 ¼ S _misi � S _mese þ _Sgen;k (4)
_Sgen;k represents the entropy generation in component k. Theexergy destruction rate _ED;k in component k results as
_ED;k ¼ T0_Sgen;k (5)
The output data obtained are:
� The pressures, temperatures, concentrations, mass flow rates,enthalpies and entropies of each current.� The heat rates or, in the case of the solution pump, the power
and the exergy destruction rates of the components.
3.2. COP and exergetic efficiency
For the complete cycles the first and second law performancesare evaluated in terms of the Coefficient of Performance (COP) andthe exergetic efficiency e. The COP is defined as the useful heat ratefrom the evaporator (the chilled water production) _QE divided bythe required heat rate to the generator (the steam consumption) _QG(Eq. (6)).
COP ¼_QE_QG¼
�_mðhe � hiÞ
�chilled water
½ _mðhi � heÞ� steam=hot water(6)
The exergetic efficiency of a cycle J is defined as the usefulexergy output (Product P) _EP divided by the required exergy input(Fuel F) _EF. The input is given by the reduction of the exergy rate ofthe steam in the generator and the pump power. The product isrepresented by the increase in the exergy rate of the chilled water(Eq. (7)).
J ¼_EP ¼
_m eph;e � eph;i chilled waterh � �i (7)
_EFh � �i
_m eph;i � eph;e steam=hot waterþ _Wpump
The specific physical exergy eph of the water is evaluated in Eq. (8):
eph ¼ h� h0 � T0ðs� s0Þ (8)
The terms h and s represent the enthalpy and entropy of thefluid, whereas, h0 and s0 are the enthalpy and entropy of the fluid atenvironmental temperature T0 and pressure p0. The specific exergyof the water–LiBr mixture has not to be evaluated, as we useentropy balances.
3.3. Error analysis
The programs for the cycles have been validated by comparisonwith available data from similar cycle simulations. A detailedcomparison with [29] and [30] is presented for the single effectconfiguration. Their characteristic parameters have been integratedin our program in order to obtain the same UA values and coolingpower. The operating conditions are compared in Table 3. Thesubscripts used refer to Fig. 2. The main difference is found in theevaluation of the concentration, resulting in a difference of 8% inthe solution concentration difference. This results in a similardifference in the solution mass flow rates. This is due to differentcorrelations used for the evaluation of properties. In our workproperties for water–LiBr have been evaluated by the correlationsfrom Kaita [28] which have the advantages to cover a largertemperature range. Table 4 shows the heat transfer rates and theCOP. As can be observed the error in the final results is less than 1%.The same conclusions can be made for the other cycle configura-tions, as the type of calculations is basically the same as for thesingle effect.
4. Results and discussion
4.1. First law analysis
The further calculation have been achieved with the assump-tions presented above, especially fixing for the heat exchangers theminimum temperature difference. Thermodynamics properties ateach state points of some of the cycles are given in (Table 5–8). The
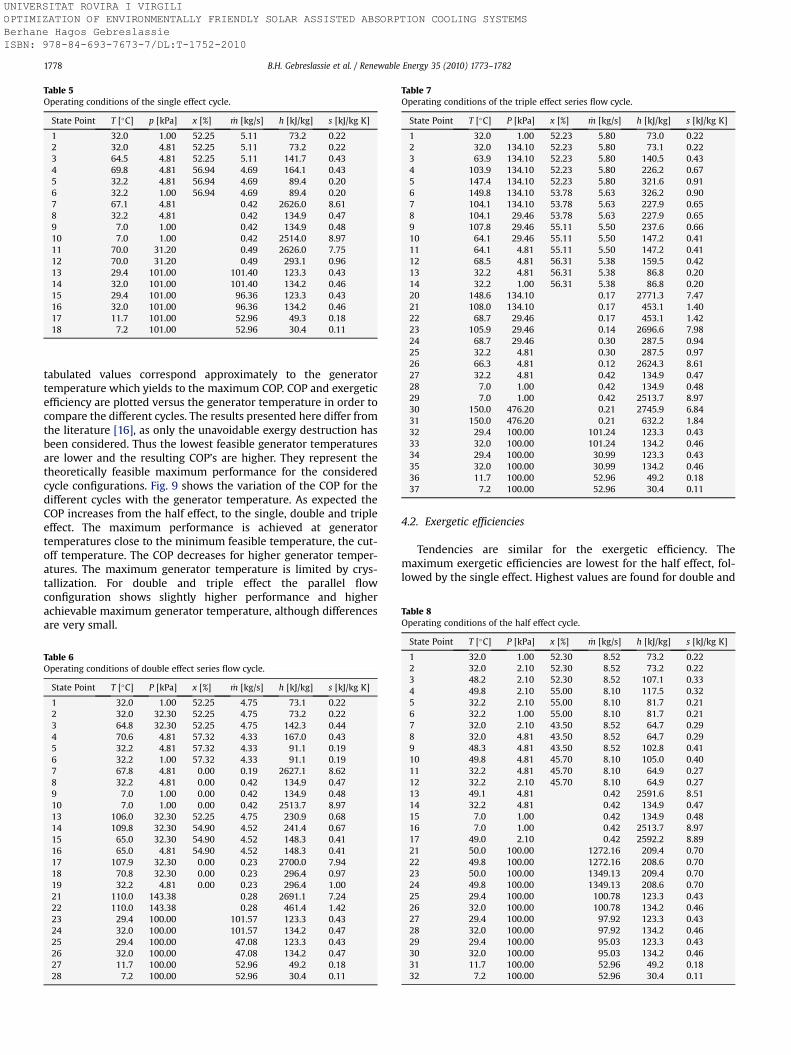
Table 5Operating conditions of the single effect cycle.
State Point T [�C] p [kPa] x [%] _m [kg/s] h [kJ/kg] s [kJ/kg K]
1 32.0 1.00 52.25 5.11 73.2 0.222 32.0 4.81 52.25 5.11 73.2 0.223 64.5 4.81 52.25 5.11 141.7 0.434 69.8 4.81 56.94 4.69 164.1 0.435 32.2 4.81 56.94 4.69 89.4 0.206 32.2 1.00 56.94 4.69 89.4 0.207 67.1 4.81 0.42 2626.0 8.618 32.2 4.81 0.42 134.9 0.479 7.0 1.00 0.42 134.9 0.4810 7.0 1.00 0.42 2514.0 8.9711 70.0 31.20 0.49 2626.0 7.7512 70.0 31.20 0.49 293.1 0.9613 29.4 101.00 101.40 123.3 0.4314 32.0 101.00 101.40 134.2 0.4615 29.4 101.00 96.36 123.3 0.4316 32.0 101.00 96.36 134.2 0.4617 11.7 101.00 52.96 49.3 0.1818 7.2 101.00 52.96 30.4 0.11
Table 7Operating conditions of the triple effect series flow cycle.
State Point T [�C] P [kPa] x [%] _m [kg/s] h [kJ/kg] s [kJ/kg K]
1 32.0 1.00 52.23 5.80 73.0 0.222 32.0 134.10 52.23 5.80 73.1 0.223 63.9 134.10 52.23 5.80 140.5 0.434 103.9 134.10 52.23 5.80 226.2 0.675 147.4 134.10 52.23 5.80 321.6 0.916 149.8 134.10 53.78 5.63 326.2 0.907 104.1 134.10 53.78 5.63 227.9 0.658 104.1 29.46 53.78 5.63 227.9 0.659 107.8 29.46 55.11 5.50 237.6 0.6610 64.1 29.46 55.11 5.50 147.2 0.4111 64.1 4.81 55.11 5.50 147.2 0.4112 68.5 4.81 56.31 5.38 159.5 0.4213 32.2 4.81 56.31 5.38 86.8 0.2014 32.2 1.00 56.31 5.38 86.8 0.2020 148.6 134.10 0.17 2771.3 7.4721 108.0 134.10 0.17 453.1 1.4022 68.7 29.46 0.17 453.1 1.4223 105.9 29.46 0.14 2696.6 7.9824 68.7 29.46 0.30 287.5 0.9425 32.2 4.81 0.30 287.5 0.9726 66.3 4.81 0.12 2624.3 8.6127 32.2 4.81 0.42 134.9 0.4728 7.0 1.00 0.42 134.9 0.4829 7.0 1.00 0.42 2513.7 8.9730 150.0 476.20 0.21 2745.9 6.8431 150.0 476.20 0.21 632.2 1.8432 29.4 100.00 101.24 123.3 0.4333 32.0 100.00 101.24 134.2 0.4634 29.4 100.00 30.99 123.3 0.4335 32.0 100.00 30.99 134.2 0.4636 11.7 100.00 52.96 49.2 0.1837 7.2 100.00 52.96 30.4 0.11
Table 8Operating conditions of the half effect cycle.
B.H. Gebreslassie et al. / Renewable Energy 35 (2010) 1773–17821778
UNIVERSITAT ROVIRA I VIRGILI OPTIMIZATION OF ENVIRONMENTALLY FRIENDLY SOLAR ASSISTED ABSORPTION COOLING SYSTEMS Berhane Hagos Gebreslassie ISBN: 978-84-693-7673-7/DL:T-1752-2010
tabulated values correspond approximately to the generatortemperature which yields to the maximum COP. COP and exergeticefficiency are plotted versus the generator temperature in order tocompare the different cycles. The results presented here differ fromthe literature [16], as only the unavoidable exergy destruction hasbeen considered. Thus the lowest feasible generator temperaturesare lower and the resulting COP’s are higher. They represent thetheoretically feasible maximum performance for the consideredcycle configurations. Fig. 9 shows the variation of the COP for thedifferent cycles with the generator temperature. As expected theCOP increases from the half effect, to the single, double and tripleeffect. The maximum performance is achieved at generatortemperatures close to the minimum feasible temperature, the cut-off temperature. The COP decreases for higher generator temper-atures. The maximum generator temperature is limited by crys-tallization. For double and triple effect the parallel flowconfiguration shows slightly higher performance and higherachievable maximum generator temperature, although differencesare very small.
Table 6Operating conditions of double effect series flow cycle.
State Point T [�C] P [kPa] x [%] _m [kg/s] h [kJ/kg] s [kJ/kg K]
1 32.0 1.00 52.25 4.75 73.1 0.222 32.0 32.30 52.25 4.75 73.2 0.223 64.8 32.30 52.25 4.75 142.3 0.444 70.6 4.81 57.32 4.33 167.0 0.435 32.2 4.81 57.32 4.33 91.1 0.196 32.2 1.00 57.32 4.33 91.1 0.197 67.8 4.81 0.00 0.19 2627.1 8.628 32.2 4.81 0.00 0.42 134.9 0.479 7.0 1.00 0.00 0.42 134.9 0.4810 7.0 1.00 0.00 0.42 2513.7 8.9713 106.0 32.30 52.25 4.75 230.9 0.6814 109.8 32.30 54.90 4.52 241.4 0.6715 65.0 32.30 54.90 4.52 148.3 0.4116 65.0 4.81 54.90 4.52 148.3 0.4117 107.9 32.30 0.00 0.23 2700.0 7.9418 70.8 32.30 0.00 0.23 296.4 0.9719 32.2 4.81 0.00 0.23 296.4 1.0021 110.0 143.38 0.28 2691.1 7.2422 110.0 143.38 0.28 461.4 1.4223 29.4 100.00 101.57 123.3 0.4324 32.0 100.00 101.57 134.2 0.4725 29.4 100.00 47.08 123.3 0.4326 32.0 100.00 47.08 134.2 0.4727 11.7 100.00 52.96 49.2 0.1828 7.2 100.00 52.96 30.4 0.11
4.2. Exergetic efficiencies
Tendencies are similar for the exergetic efficiency. Themaximum exergetic efficiencies are lowest for the half effect, fol-lowed by the single effect. Highest values are found for double and
State Point T [�C] P [kPa] x [%] _m [kg/s] h [kJ/kg] s [kJ/kg K]
1 32.0 1.00 52.30 8.52 73.2 0.222 32.0 2.10 52.30 8.52 73.2 0.223 48.2 2.10 52.30 8.52 107.1 0.334 49.8 2.10 55.00 8.10 117.5 0.325 32.2 2.10 55.00 8.10 81.7 0.216 32.2 1.00 55.00 8.10 81.7 0.217 32.0 2.10 43.50 8.52 64.7 0.298 32.0 4.81 43.50 8.52 64.7 0.299 48.3 4.81 43.50 8.52 102.8 0.4110 49.8 4.81 45.70 8.10 105.0 0.4011 32.2 4.81 45.70 8.10 64.9 0.2712 32.2 2.10 45.70 8.10 64.9 0.2713 49.1 4.81 0.42 2591.6 8.5114 32.2 4.81 0.42 134.9 0.4715 7.0 1.00 0.42 134.9 0.4816 7.0 1.00 0.42 2513.7 8.9717 49.0 2.10 0.42 2592.2 8.8921 50.0 100.00 1272.16 209.4 0.7022 49.8 100.00 1272.16 208.6 0.7023 50.0 100.00 1349.13 209.4 0.7024 49.8 100.00 1349.13 208.6 0.7025 29.4 100.00 100.78 123.3 0.4326 32.0 100.00 100.78 134.2 0.4627 29.4 100.00 97.92 123.3 0.4328 32.0 100.00 97.92 134.2 0.4629 29.4 100.00 95.03 123.3 0.4330 32.0 100.00 95.03 134.2 0.4631 11.7 100.00 52.96 49.2 0.1832 7.2 100.00 52.96 30.4 0.11
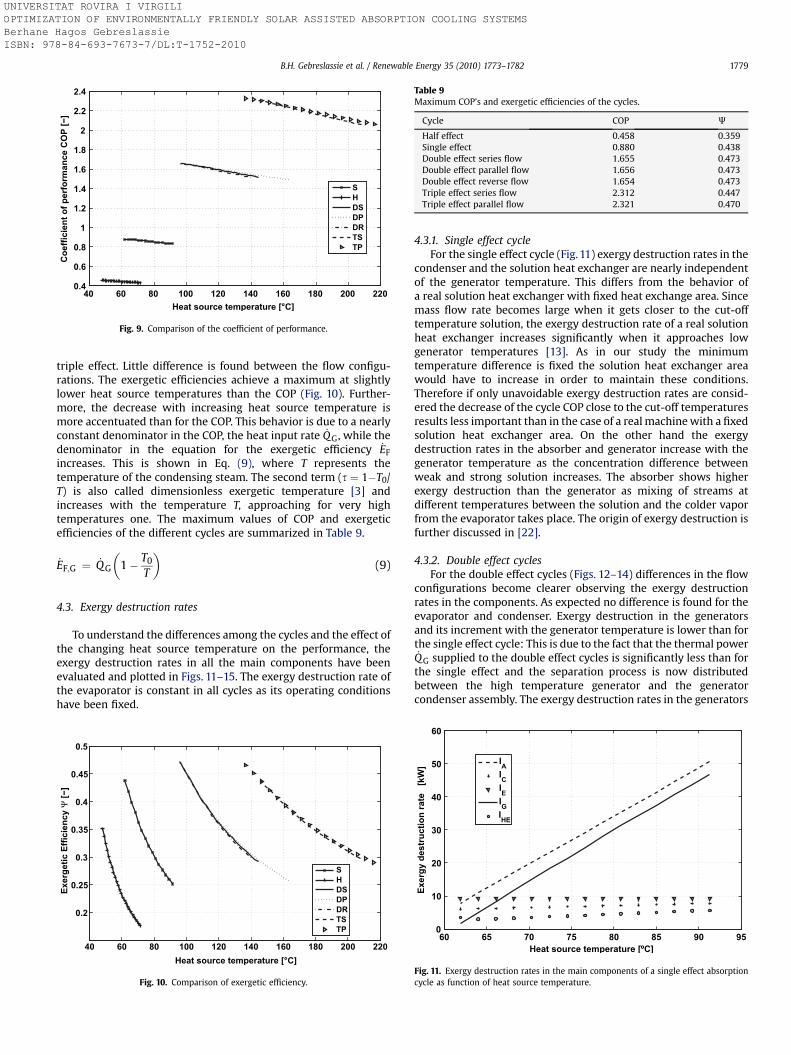
40 60 80 100 120 140 160 180 200 220
0.4
0.6
0.8
1
1.2
1.4
1.6
1.8
2
2.2
2.4
Heat source temperature [°C]
C
oefficien
t o
f p
erfo
rm
an
ce C
OP
[−
]
S
H
DS
DP
DR
TS
TP
Fig. 9. Comparison of the coefficient of performance.
Table 9Maximum COP’s and exergetic efficiencies of the cycles.
Cycle COP J
Half effect 0.458 0.359Single effect 0.880 0.438Double effect series flow 1.655 0.473Double effect parallel flow 1.656 0.473Double effect reverse flow 1.654 0.473Triple effect series flow 2.312 0.447Triple effect parallel flow 2.321 0.470
B.H. Gebreslassie et al. / Renewable Energy 35 (2010) 1773–1782 1779
UNIVERSITAT ROVIRA I VIRGILI OPTIMIZATION OF ENVIRONMENTALLY FRIENDLY SOLAR ASSISTED ABSORPTION COOLING SYSTEMS Berhane Hagos Gebreslassie ISBN: 978-84-693-7673-7/DL:T-1752-2010
triple effect. Little difference is found between the flow configu-rations. The exergetic efficiencies achieve a maximum at slightlylower heat source temperatures than the COP (Fig. 10). Further-more, the decrease with increasing heat source temperature ismore accentuated than for the COP. This behavior is due to a nearlyconstant denominator in the COP, the heat input rate _QG, while thedenominator in the equation for the exergetic efficiency _EFincreases. This is shown in Eq. (9), where T represents thetemperature of the condensing steam. The second term (s ¼ 1�T0/T) is also called dimensionless exergetic temperature [3] andincreases with the temperature T, approaching for very hightemperatures one. The maximum values of COP and exergeticefficiencies of the different cycles are summarized in Table 9.
_EF;G ¼ _QG
�1� T0
T
�(9)
4.3. Exergy destruction rates
To understand the differences among the cycles and the effect ofthe changing heat source temperature on the performance, theexergy destruction rates in all the main components have beenevaluated and plotted in Figs. 11–15. The exergy destruction rate ofthe evaporator is constant in all cycles as its operating conditionshave been fixed.
40 60 80 100 120 140 160 180 200 220
0.2
0.25
0.3
0.35
0.4
0.45
0.5
Heat source temperature [°C]
E
xerg
etic E
fficien
cy Ψ
[−
]
S
H
DS
DP
DR
TS
TP
Fig. 10. Comparison of exergetic efficiency.
4.3.1. Single effect cycleFor the single effect cycle (Fig. 11) exergy destruction rates in the
condenser and the solution heat exchanger are nearly independentof the generator temperature. This differs from the behavior ofa real solution heat exchanger with fixed heat exchange area. Sincemass flow rate becomes large when it gets closer to the cut-offtemperature solution, the exergy destruction rate of a real solutionheat exchanger increases significantly when it approaches lowgenerator temperatures [13]. As in our study the minimumtemperature difference is fixed the solution heat exchanger areawould have to increase in order to maintain these conditions.Therefore if only unavoidable exergy destruction rates are consid-ered the decrease of the cycle COP close to the cut-off temperaturesresults less important than in the case of a real machine with a fixedsolution heat exchanger area. On the other hand the exergydestruction rates in the absorber and generator increase with thegenerator temperature as the concentration difference betweenweak and strong solution increases. The absorber shows higherexergy destruction than the generator as mixing of streams atdifferent temperatures between the solution and the colder vaporfrom the evaporator takes place. The origin of exergy destruction isfurther discussed in [22].
4.3.2. Double effect cyclesFor the double effect cycles (Figs. 12–14) differences in the flow
configurations become clearer observing the exergy destructionrates in the components. As expected no difference is found for theevaporator and condenser. Exergy destruction in the generatorsand its increment with the generator temperature is lower than forthe single effect cycle: This is due to the fact that the thermal power_QG supplied to the double effect cycles is significantly less than for
the single effect and the separation process is now distributedbetween the high temperature generator and the generatorcondenser assembly. The exergy destruction rates in the generators
60 65 70 75 80 85 90 95
0
10
20
30
40
50
60
Heat source temperature [ºC]
Exerg
y d
estru
ctio
n rate [kW
]
IA
IC
IE
IG
IHE
Fig. 11. Exergy destruction rates in the main components of a single effect absorptioncycle as function of heat source temperature.
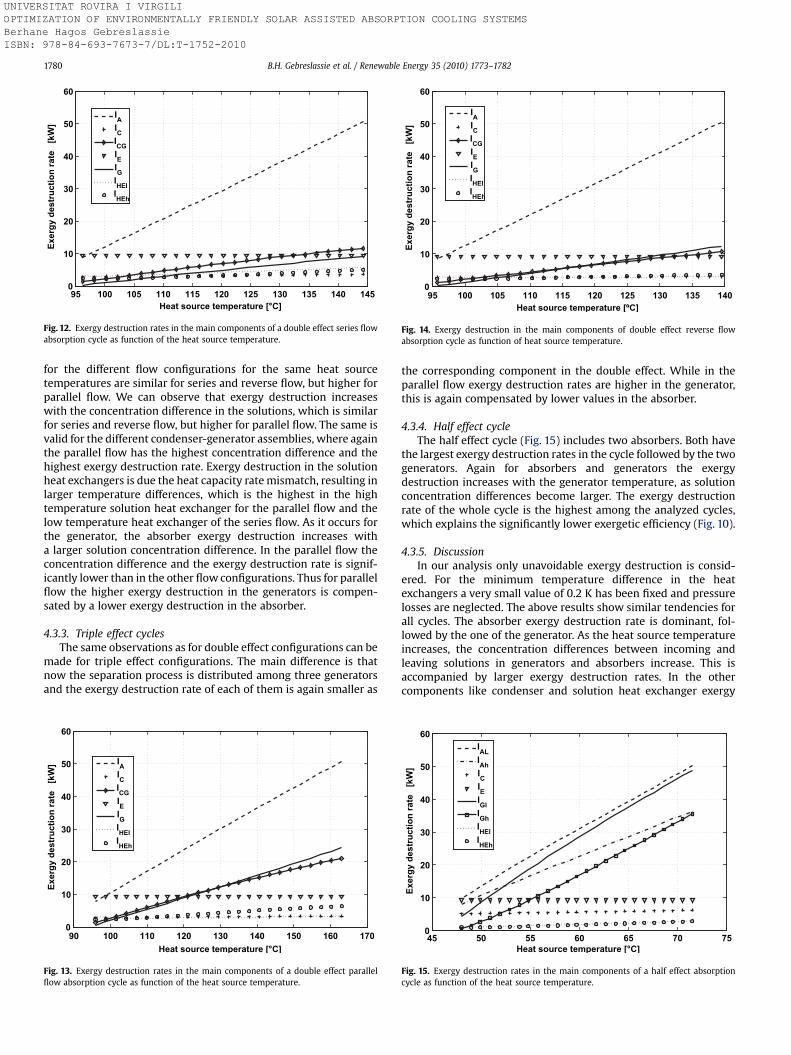
95 100 105 110 115 120 125 130 135 140 145
0
10
20
30
40
50
60
Heat source temperature [°C]
E
xerg
y d
estru
ctio
n rate [kW
]
IA
IC
ICG
IE
IG
IHEl
IHEh
Fig. 12. Exergy destruction rates in the main components of a double effect series flowabsorption cycle as function of the heat source temperature.
95 100 105 110 115 120 125 130 135 140
0
10
20
30
40
50
60
Heat source temperature [ºC]
E
xe
rg
y d
es
tru
ctio
n ra
te
[k
W]
IA
IC
ICG
IE
IG
IHEl
IHEh
Fig. 14. Exergy destruction in the main components of double effect reverse flowabsorption cycle as function of heat source temperature.
B.H. Gebreslassie et al. / Renewable Energy 35 (2010) 1773–17821780
UNIVERSITAT ROVIRA I VIRGILI OPTIMIZATION OF ENVIRONMENTALLY FRIENDLY SOLAR ASSISTED ABSORPTION COOLING SYSTEMS Berhane Hagos Gebreslassie ISBN: 978-84-693-7673-7/DL:T-1752-2010
for the different flow configurations for the same heat sourcetemperatures are similar for series and reverse flow, but higher forparallel flow. We can observe that exergy destruction increaseswith the concentration difference in the solutions, which is similarfor series and reverse flow, but higher for parallel flow. The same isvalid for the different condenser-generator assemblies, where againthe parallel flow has the highest concentration difference and thehighest exergy destruction rate. Exergy destruction in the solutionheat exchangers is due the heat capacity rate mismatch, resulting inlarger temperature differences, which is the highest in the hightemperature solution heat exchanger for the parallel flow and thelow temperature heat exchanger of the series flow. As it occurs forthe generator, the absorber exergy destruction increases witha larger solution concentration difference. In the parallel flow theconcentration difference and the exergy destruction rate is signif-icantly lower than in the other flow configurations. Thus for parallelflow the higher exergy destruction in the generators is compen-sated by a lower exergy destruction in the absorber.
4.3.3. Triple effect cyclesThe same observations as for double effect configurations can be
made for triple effect configurations. The main difference is thatnow the separation process is distributed among three generatorsand the exergy destruction rate of each of them is again smaller as
90 100 110 120 130 140 150 160 170
0
10
20
30
40
50
60
Heat source temperature [°C]
E
xerg
y d
estru
ctio
n rate [kW
]
IA
IC
ICG
IE
IG
IHEl
IHEh
Fig. 13. Exergy destruction rates in the main components of a double effect parallelflow absorption cycle as function of the heat source temperature.
the corresponding component in the double effect. While in theparallel flow exergy destruction rates are higher in the generator,this is again compensated by lower values in the absorber.
4.3.4. Half effect cycleThe half effect cycle (Fig. 15) includes two absorbers. Both have
the largest exergy destruction rates in the cycle followed by the twogenerators. Again for absorbers and generators the exergydestruction increases with the generator temperature, as solutionconcentration differences become larger. The exergy destructionrate of the whole cycle is the highest among the analyzed cycles,which explains the significantly lower exergetic efficiency (Fig. 10).
4.3.5. DiscussionIn our analysis only unavoidable exergy destruction is consid-
ered. For the minimum temperature difference in the heatexchangers a very small value of 0.2 K has been fixed and pressurelosses are neglected. The above results show similar tendencies forall cycles. The absorber exergy destruction rate is dominant, fol-lowed by the one of the generator. As the heat source temperatureincreases, the concentration differences between incoming andleaving solutions in generators and absorbers increase. This isaccompanied by larger exergy destruction rates. In the othercomponents like condenser and solution heat exchanger exergy
45 50 55 60 65 70 75
0
10
20
30
40
50
60
Heat source temperature [°C]
E
xerg
y d
estru
ctio
n rate [kW
]
IAL
IAh
IC
IE
IGl
IGh
IHEl
IHEh
Fig. 15. Exergy destruction rates in the main components of a half effect absorptioncycle as function of the heat source temperature.

B.H. Gebreslassie et al. / Renewable Energy 35 (2010) 1773–1782 1781
UNIVERSITAT ROVIRA I VIRGILI OPTIMIZATION OF ENVIRONMENTALLY FRIENDLY SOLAR ASSISTED ABSORPTION COOLING SYSTEMS Berhane Hagos Gebreslassie ISBN: 978-84-693-7673-7/DL:T-1752-2010
destruction rates are only slightly affected by the generatortemperature. The evaporator exergy destruction rate is notchanging among cycles as its operating conditions remainunchanged and is not affected by the heat source temperature.
These results differ from other studies which evaluate bothunavoidable and avoidable exergy destruction. In this conventionalexergetic evaluation the design of the heat exchangers is fixed forexample by given UA values. The minimum temperature differ-ences in the heat exchangers will change, if the operating condi-tions change. The behavior of the solution heat exchanger, thegenerator and absorber will be different. At low heat sourcetemperatures, near the cut-off temperature, the solution concen-tration differences are small. Therefore the solution mass flow ratesbecome large. Thus if the heat source temperature decreases in thistemperature range, the heat rate in the solution heat exchangerincreases significantly. The temperature difference between hotand cold fluid becomes larger. The solutions enter at a lowertemperature in the generator and at a higher temperature in theabsorber. Both heat rates in generator and absorber increase, if thecooling capacity has to remain constant. The COP decreasessignificantly. As a consequence close to the cut-off temperature, theexergy destruction rates in absorber, generator and solution heatexchangers becomes very high. With increasing generatortemperature the exergy destruction rates in absorber and generatorpass through a clear minimum, which corresponds to a maximumof the exergetic efficiency. For higher heat source temperaturesabsorber and generator exergy destruction rates increase again. Thelast phenomena is also observed in our study, as the solution flowrates are decreasing and the relative contribution of the exergydestruction due to the temperature difference becomes smaller.Therefore main differences in our results are found at generatortemperatures close to the cut-off temperature, which correspondsto small concentration differences and large mass flow rates of thesolution, while tendencies for higher heat source temperatures aresimilar.
5. Conclusions
The performance of seven different water–LiBr absorptioncooling cycles has been evaluated applying first and second lawanalysis. Only unavoidable exergy destruction is considered inorder to compare the cycles on a rational basis. Effects of theavoidable exergy destructions are eliminated at this stage of thetheoretical analysis, but should be considered at the design stage.The present study enables us to distinguish and quantify theseparts. The avoidable part shows where the main potential forimprovement of the cycle is. This is not necessarily the componentwith the largest exergy destruction, if the exergy destruction ismainly due to the unavoidable part.
The effect of the heat source temperature has been evaluated fortypical cooling operating conditions. The COP increases from half totriple effect and shows for each cycle a maximum, which is slightlyhigher than the cut-off temperature. The values of the COP arehigher than in studies which include both avoidable and unavoid-able exergy destruction and maintain these high values also close tothe cut-off temperature. At higher heat source temperatures theCOP decreases slowly. The same qualitative behavior is found forthe exergetic efficiency. But the decrease at higher heat sourcetemperatures is more significant as in the denominator of theexergetic efficiency the heat rate to the generator is nearly constant,while its temperature and thus the dimensionless exergetictemperature is increasing. As a consequence the exergy input (Fuel)increases, while the output (Product) in the numerator is fixed. Themaximum exergy efficiencies are lowest for the half effect, followedby the single effect. Highest values are found for double and triple
effect. Little difference is found among the flow configurations(reverse, series and parallel flow).
Furthermore, the exergy destruction rates of the heatexchangers are determined. For condenser and solution heatexchanger the exergy destruction is practically independent of theheat source temperature. For absorber and generator the exergydestruction rates increase with the heat source temperature, as thesolution concentration differences become larger. Differences tostudies which consider both avoidable and unavoidable exergydestruction are found at low generator temperatures near the cut-off temperature. In this temperature range, in real heat exchangersexergy destruction due to temperature difference is dominant. Inour study it is not included, as it represents an avoidable exergydestruction. Results for higher heat source temperatures are similarto other studies.
The purpose of this study is a comparison of the exergy effi-ciencies and the exergy destruction in different absorption cycleconfigurations taking into account only the unavoidable exergydestruction. Thus cycles can be compared on a rational basis.Results do not depend on design specifications, as for example UAvalues. The next step in this type of analysis would be the advancedexergy analysis proposed by [23], where the total exergy destruc-tion is splitted into avoidable and unavoidable parts. This makes iteasier to understand the thermodynamic inefficiencies and shouldbe considered in the termoeconomic optimization [25]. An exampleof how this type of advanced exergetic evaluation helps to improvethe design is presented in [24].
Acknowledgements
Berhane H. Gebreslassie expresses his gratitude for the financialsupport received from University Rovira i Virgili. The authors alsowish to acknowledge support of this research work from theSpanish Ministry of Education and Science (projects DPI2002-00706, DPI2008-04099, PHB2008-0090-PC and BFU2008-86300196) and the Spanish Ministry of External Affairs (projects A/8502/07, HS2007-864 0006 and A/020104/08).
References
[1] Herold KE, Radermacher R, Klein SA. Absorption chillers and heat pumps. BocaRaton, Florida: CRC Press; 1996.
[2] Bejan A, Tsatsaronis G, Moran M. Thermal design & optimization. John Wiley &Sons Inc; 1996.
[3] Kotas TJ. The exergy method of thermal plant analysis. Krieger PublishingCompany; 1995.
[4] Szargut J, Morris D, Steward F. Exergy analysis of thermal, chemical, andmetallurgical processes. N.Y.: Hemisphere; 1988.
[5] Anand DK, Lindler KW, Schweitzer S, Kennish W. Second-law analysis of solar-powered absorption cooling cycles and systems. Journal of Solar EnergyEngineering; 1984.
[6] Koehler WJ, Ibele WE, Soltes J, Winter ER. Availability simulation of a lithiumbromide absorption heat pump. Heat Recovery Systems and CHP1988;8(2):157–71.
[7] Le Goff P, Louis G, Ramadane A. pompes a chaleur a absorption, multi-etagees:analyse exergetique. principes de realisation [Multi-stage absorption heatpumps: exergetic analysis. Techniques for construction]. Revue Generale deThermique 1988;27(320–321):451–63.
[8] Aphornratana S, Eames IW. Thermodynamic analysis of absorption refrigera-tion cycles using the second law of thermodynamics method. InternationalJournal of Refrigeration 1994;18(4):244–52.
[9] Talbi M, Agnew B. Exergy analysis: an absorption refrigerator using lithiumbromide and water as the working fluids. Applied Thermal Engineering2000;20:619–30.
[10] Kilic M, Kaynakli O. Second law-based thermodynamic analysis of water–lithium bromide absorption refrigeration system. Energy 2007;32(8):1505–12.
[11] Ataer EO, Gogus Y. Comparative study of irreversibilities in an aqua–ammoniaabsorption refrigeration system. International Journal of Refrigeration 1991;14(2):86–92.
[12] Best R, Islas J, Martinez M. Exergy efficiency of an ammonia–water absorptionsystem for ice production. Applied Energy 1993;45:241–56.

B.H. Gebreslassie et al. / Renewable Energy 35 (2010) 1773–17821782
UNIVERSITAT ROVIRA I VIRGILI OPTIMIZATION OF ENVIRONMENTALLY FRIENDLY SOLAR ASSISTED ABSORPTION COOLING SYSTEMS Berhane Hagos Gebreslassie ISBN: 978-84-693-7673-7/DL:T-1752-2010
[13] Karakas A, Egrican N, Uygur S. Second-law analysis of solar absorption-coolingcycles using lithium bromide/water and ammonia/water as working fluids.Applied Energy 1990;37(3):169–87.
[14] Meunier F, Kaushik SC, Neveu P, Poyelle F. A comparative thermodynamicstudy of sorption systems: second law analysis. International Journal ofRefrigeration 1996;19(6):414–21.
[15] Izquierdo M, de Vega M, Lecuona A, Rodriguez P. Compressors driven bythermal solar energy: entropy generated, exergy destroyed and exergeticefficiency. Solar Energy 2002;72(4):363–75.
[16] Lee SF, Sherif SA. Second-law analysis of multi-effect lithium bromide/waterabsorption chillers. ASHRAE Transactions 1999;105.
[17] Ravikumar TS, Suganthi L, Samuel AA. Exergy analysis of solar assisteddouble effect absorption refrigeration system. Renewable Energy 1998;14(1–4):55–9.
[18] Gomri R. Second law comparison of single effect and double effect vapourabsorption refrigeration systems. Energy Conversion and Management2009;50(5):1279–87.
[19] Gomri R, Hakimi R. Second law analysis of double effect vapour absorptioncooler system. Energy Conversion and Management 2008;49(11):3343–8.
[20] Kaushik SC, Arora A. Energy and exergy analysis of single effect and series flowdouble effect water–lithium bromide absorption refrigeration systems. Inter-national Journal of Refrigeration 2009;32(6):1247–58.
[21] Jeong J, Saito K, and Sunao K. Optimum design method for a single effectabsorption refrigerator based on the first and, second law analysis. In: 21st IIRinternational congress of refrigeration, Washington, DC (USA): 2003; 1–9.
[22] Sencan A, Yakut KA, Kalogirou SA. Exergy analysis of lithium bromide/waterabsorption systems. Renewable Energy 2005;30(5):645–57.
[23] Morosuk T, Tsatsaronis G. A new approach to the exergy analysis of absorptionrefrigeration machines. Energy 2008;33(6):890–907.
[24] Morosuk T, Tsatsaronis G. Advanced exergetic evaluation of refrigerationmachines using different working fluids. Energy 2009;34(12):2248–58.
[25] Tsatsaronis G, Park MH. On avoidable and unavoidable exergy destructionsand investment costs in thermal systems. Energy Conversion and Manage-ment 2002;43(9–12):1259–70.
[26] Alefeld G. Rules for the design of multistage absorber machines. Brennstoff-Warme-Kraft 1982;34(2):64–73.
[27] EES. Engineering Equation Solver. F-chart software, www.fchart.com; 1992–2009.
[28] Kaita Y. Thermodynamic properties of litium bromide-water solutions at highhtemperatures. International Journal of Refrigeration 2001;24:374–90.
[29] Gommed K, Grossman G. Performance analysis of staged absorption heat pumps:water–lithium bromide systems. ASHRAE Transactions 1990;96(1):1590–8.
[30] Grossman G, Wilk M, De Vault RC. Simulation and, performance analysis oftriple-effect absorption cycles. ASHRAE Transactions 1994;100(1):452–62.
Vol. 12 (No. 1) / 17
Int. J. of Thermodynamics Vol. 12 (No. 1), pp. 17-27, March 2009 ISSN 1301-9724 www.icatweb.org/journal.htm
Effect of Internal Heat Recovery in Ammonia-Water Absorption Cooling Cycles: Exergy and Structural Analysis
Dieter Boer1*, Berhane Hagos Gebreslassie2, Marc Medrano3, Miquel Nogués4
1,2Department of Mechanical Engineering,
University of Rovira i Virgili, Tarragona, Spain Phone: (+34) 977 559631
E-mail: [email protected]; [email protected]
3,4GREA Innovació Concurrent, Universitat de Lleida Lleida, Spain E-mail: [email protected];
Abstract First and second law analysis have been conducted for three low temperature driven ammonia-water absorption cooling cycles with increasing internal heat recovery. Based on the results of exergy analysis the structural analysis has been achieved. The obtained Coefficients of Structural Bonds (CSB) consider how the irreversibility of the whole cycle is affected by a change in the irreversibility related to an efficiency improvement of a single component. Trends for the different configurations are similar, while quantitative differences among the main heat exchangers are considerable. The highest values of the CSB are found for the refrigerant heat exchanger. Also the evaporator, the condenser, the generator and the absorber show values higher than unity. The lowest CSB’s are obtained in the solution heat exchanger. In general, CSB’s decrease with increasing efficiency. That means that for very efficient heat exchangers, a further improvement looks less attractive. The dephlegmator is an exception as it shows a singularity of the CSB value due to its complex interactions with the other components. Once the CSB’s are obtained for the main components, they can be used in the structural method of the thermoeconomic optimisation. This method enables us to find the optimum design of a component in a straightforward calculation. Keywords: Absorption cycle, ammonia-water, exergy analysis, structural analysis.
1. Introduction Combining thermodynamics and economics, the
thermoeconomic or exergoeconomic analysis can be achieved (Kotas, 1995; Bejan et al., 1996; El-Sayed, 2003). The objective of exergoeconomic optimization is the minimization of the total cost, mainly composed of capital and energy costs. In the field of refrigeration thermoeconomic analysis was applied initially to compression cycles (Wall, 1986; Dentice d'Accadia et al., 1998; Dingeç et al., 1999; Ferrer et al., 2001; Dentice d'Accadia et al., 2004; Zhang et al., 2004) and later to absorption cycles (Tozer et al., 1999; Sahin et al., 2002; Misra et al., 2003; Misra et al., 2005; Misra et al., 2006; KizIlkan et al., 2007).
One methodology used in exergoeconomic optimisation is the structural method introduced by Beyer (1970 and 1974). It is based on structural coefficients, which show how local irreversibilities in the components affect the overall irreversibility rate of the cycle. The coefficient of structural bonds (CSB) of a component k, which is obtained by variation of a parameter xi, is defined as
var;
=⎟⎟⎠
⎞⎜⎜⎝
⎛∂∂
=xik
tik I
ICSB
(1)
where kI is the irreversibility rate of component k, and tI is the irreversibility rate of the whole cycle. Structural coefficients show how the irreversibility of the whole cycle and a single component are related. If a slight decrease in the irreversibility of one component due to an increased
efficiency causes a significant improvement in the total irreversibility of the cycle (high CSB), it will be wise to put much of the design effort in improving the efficiency of this component. Otherwise (low CSB), an improvement of the efficiency of the considered component is not worthwhile. These coefficients can help us to determine for one selected component of the system its optimum efficiency, for which a minimum total cost is achieved (Kotas, 1995).
In the present study, this method will be applied to the analysis of absorption cycles. The analysed cycles are ammonia-water absorption cooling cycles with increasing internal heat recovery. A similar approach has been applied by Sözen (2001) for an ammonia-water refrigeration cycle. Modelling starts with the first law analysis, followed by the exergy analysis (Karakas et al., 1990; Ataer et al., 1991; Best et al., 1993).
Once the irreversibilities of the components and the whole cycle are evaluated, the coefficients of structural bonds can be evaluated. Compared to a former study (Boer et al., 2005), here the CSB’s are not constant, but their dependence on the efficiencies is shown and their behaviour is quantified and compared for different cycle configurations. These CSB’s can be used in the structural method of exergoeconomic optimisation (Beyer, 1974). The final purpose is the design of more cost-effective absorption cycles. The application of the CSB’s is described in KizIlkan et al. (2007) and will be summarized briefly. More details can be found in Kotas (1995).
The optimum efficiency specification for a component will be determined in order to obtain the minimum annual
*Corresponding author
UNIVERSITAT ROVIRA I VIRGILI OPTIMIZATION OF ENVIRONMENTALLY FRIENDLY SOLAR ASSISTED ABSORPTION COOLING SYSTEMS Berhane Hagos Gebreslassie ISBN: 978-84-693-7673-7/DL:T-1752-2010

18 / Vol. 12 (No. 1) Int. Centre for Applied Thermodynamics (ICAT)
operating cost. This operating cost is composed mainly of the fuel and capital costs.
∑=
++=n
l
ci
cl
ciin
einopit bxCaxEctxC
1
)()()(
(2)
The first term of the right hand side represents the fuel cost, the second one the capital investment amortisation and the third one other cost factors that are not affected by the optimisation, for example maintenance costs. The capital recovery factor is given by
111
−++
= n
nc
i)(i)i(a
(3)
At the optimum point
i
ckc
i
kik
einop x
CaxICSBct
∂∂
−=∂∂
,
(4)
Equation (4) depends only on parameters of component
k, which is optimised. The interaction with the system is taken into account by the CSB. /k iI x∂ ∂ describes the effect of the efficiency parameter xi on the irreversibility of the component. /c
k iC x∂ ∂ takes into account the dependence of the component cost on xi. Both parameters depend on the efficiency of the analysed component. From equation (4) the efficiency that results in the lowest operating cost Ct can be obtained (KizIlkan et al., 2007).
2. Description of the cycles For this study an ammonia-water absorption cycle has
been selected (Figure 1). Basic components are the absorber (A), the condenser (C), the generator (G), and the evaporator (E). The cycle is completed by the solution heat exchanger (SHE), the dephlegmator (D) and the rectification plates (R). To obtain the necessary pressure changes, the cycles include the solution pump (P), the refrigerant expansion valve (RV) and solution expansion valve (SV).
For cycle I, the solution circulates between the absorber, where the refrigerant is absorbed at low pressure, and the generator, where the refrigerant is desorbed at high pressure (state points 1 to 6). The strong solution leaves the absorber (1), is preheated in the solution heat exchanger (3), and enters the rectification column. The column has three theoretical stages, which is sufficient in cooling applications (Roriz et al., 2003). The feed enters in central plate two. Vapour and liquid in equilibrium leave plate two towards plates one and three, respectively, while saturated liquid from plate three and saturated vapour from plate one enter plate two. Temperature and concentration of ammonia in the vapour increase from plate one to plate three. The generator acts as the reboiler of the rectification column. The weak solution (4) leaves towards the absorber. In the dephlegmator, the necessary liquid reflux is obtained, while the rest of the vapour (9) condenses completely in the condenser (10). The condensate expands in the refrigerant throttling valve, causing partial vaporisation (12), and enters the evaporator. Due to the water content of the mixture, the temperature increases during the vaporisation process as the liquid contains less and less ammonia, which is the more volatile component. Vaporisation in the evaporator is only partial, as total evaporation would
require too large of a temperature gradient. The cycle is closed when the vapour with a small liquid fraction (13) enters the absorber. Streams 15 to 22 are the external heat transfer fluids (in all cases this is water), which deliver or extract the heat to or from the cycle.
A
C
E
SHE
PRV
SV
G
D
1
2
43
5
6
9
10
12
13
17 1819 20
22 21 16 15
23 24
Cycle I
A
C
E
SHE
PRV
SV
G
D
1
2
43
5
6
9
10
12
13
17 1819 20
22 21 16 15
23 24
Cycle I
1
2
43
5
6
9
10
12
13
1411
18
22 21 16 15
A
C
E
RHE
P
RV
SV
GD
77
1719 20
Cycle III
SHE
1
2
43
5
6
9
10
12
13
1411
18
22 21 16 15
A
C
E
RHE
P
RV
SV
GD
77
1719 20
Cycle III
SHE
R
123
Cycle II
R
123
1
2
43
5
6
9
10
12
13
1411
17 1819 20
22 21 1516
A
C
E
RHE
SHE
P
RV
SV
23 24
GD
R
123
Figure 1. Ammonia-water absorption cycles with increasing internal heat recovery.
Cycle II is similar to Cycle I except for the refrigerant heat exchanger (RHE). In Cycle II after leaving the condenser the condensate (10) is subcooled (11) in order to supply heat for the partial vaporisation in the evaporator (14).
An additional feature of Cycle III is a heat exchange between the strong solution after the solution pump (2) and the dephlegmator (D). Preheating the strong solution (7) eliminates the use of cooling water in the rectifier.
3. Methodology of the simulation A computer code for simulating the cycle has been
established using the Engineering Equation Solver EES program. Properties for ammonia water are given by Tillner-Roth and Friend (1998). Typical cooling operation conditions are assumed as follows:
Evaporator cooling capacity 1000 kW Temperatures:
Chilled water inlet/outlet (E) 12/6ºC Cooling water inlet/outlet (parallel flow through A and C) 27ºC/32ºC
UNIVERSITAT ROVIRA I VIRGILI OPTIMIZATION OF ENVIRONMENTALLY FRIENDLY SOLAR ASSISTED ABSORPTION COOLING SYSTEMS Berhane Hagos Gebreslassie ISBN: 978-84-693-7673-7/DL:T-1752-2010
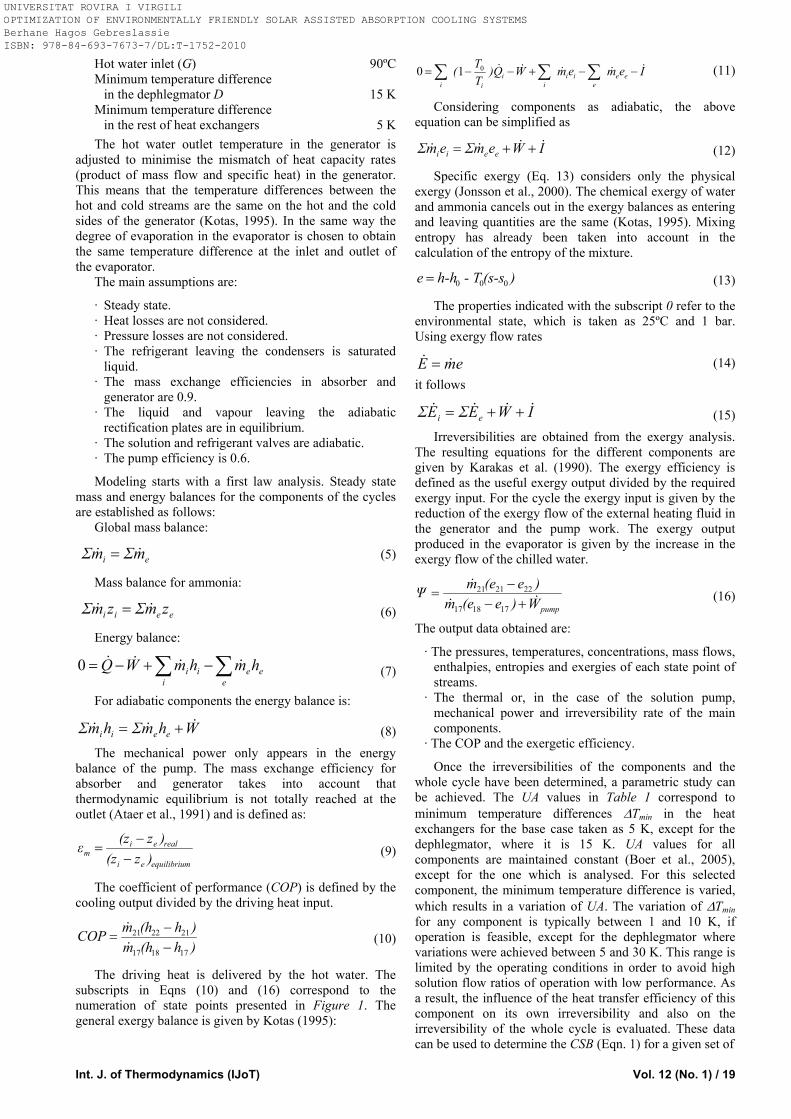
Int. J. of Thermodynamics (IJoT) Vol. 12 (No. 1) / 19
Hot water inlet (G) 90ºC Minimum temperature difference in the dephlegmator D 15 K Minimum temperature difference in the rest of heat exchangers 5 K The hot water outlet temperature in the generator is
adjusted to minimise the mismatch of heat capacity rates (product of mass flow and specific heat) in the generator. This means that the temperature differences between the hot and cold streams are the same on the hot and the cold sides of the generator (Kotas, 1995). In the same way the degree of evaporation in the evaporator is chosen to obtain the same temperature difference at the inlet and outlet of the evaporator.
The main assumptions are:
· Steady state. · Heat losses are not considered. · Pressure losses are not considered. · The refrigerant leaving the condensers is saturated
liquid. · The mass exchange efficiencies in absorber and
generator are 0.9. · The liquid and vapour leaving the adiabatic
rectification plates are in equilibrium. · The solution and refrigerant valves are adiabatic. · The pump efficiency is 0.6.
Modeling starts with a first law analysis. Steady state mass and energy balances for the components of the cycles are established as follows:
Global mass balance:
ei mΣmΣ = (5)
Mass balance for ammonia:
eeii zmΣzmΣ = (6) Energy balance:
ee
eii
i hmhmWQ ∑∑ −+−=0
(7)
For adiabatic components the energy balance is:
WhmΣhmΣ eeii += (8) The mechanical power only appears in the energy
balance of the pump. The mass exchange efficiency for absorber and generator takes into account that thermodynamic equilibrium is not totally reached at the outlet (Ataer et al., 1991) and is defined as:
mequilibriuei
realeim )z(z
)z(zε−−
=
(9)
The coefficient of performance (COP) is defined by the cooling output divided by the driving heat input.
)h(hm)h(hmCOP
171817
212221
−−
=
(10)
The driving heat is delivered by the hot water. The subscripts in Eqns (10) and (16) correspond to the numeration of state points presented in Figure 1. The general exergy balance is given by Kotas (1995):
IememWQ)TT( ee
eii
ii
ii
−−+−−= ∑∑∑ 010
(11)
Considering components as adiabatic, the above equation can be simplified as
IWemΣemΣ eeii ++= (12) Specific exergy (Eq. 13) considers only the physical
exergy (Jonsson et al., 2000). The chemical exergy of water and ammonia cancels out in the exergy balances as entering and leaving quantities are the same (Kotas, 1995). Mixing entropy has already been taken into account in the calculation of the entropy of the mixture.
)(s-s - Th-he 000= (13) The properties indicated with the subscript 0 refer to the
environmental state, which is taken as 25ºC and 1 bar. Using exergy flow rates
emE = (14) it follows
IWEΣEΣ ei ++= (15) Irreversibilities are obtained from the exergy analysis.
The resulting equations for the different components are given by Karakas et al. (1990). The exergy efficiency is defined as the useful exergy output divided by the required exergy input. For the cycle the exergy input is given by the reduction of the exergy flow of the external heating fluid in the generator and the pump work. The exergy output produced in the evaporator is given by the increase in the exergy flow of the chilled water.
pumpW)e(em)e(emΨ
+−−
=171817
222121
(16)
The output data obtained are:
· The pressures, temperatures, concentrations, mass flows, enthalpies, entropies and exergies of each state point of streams.
· The thermal or, in the case of the solution pump, mechanical power and irreversibility rate of the main components.
· The COP and the exergetic efficiency.
Once the irreversibilities of the components and the whole cycle have been determined, a parametric study can be achieved. The UA values in Table 1 correspond to minimum temperature differences ΔTmin in the heat exchangers for the base case taken as 5 K, except for the dephlegmator, where it is 15 K. UA values for all components are maintained constant (Boer et al., 2005), except for the one which is analysed. For this selected component, the minimum temperature difference is varied, which results in a variation of UA. The variation of ΔTmin for any component is typically between 1 and 10 K, if operation is feasible, except for the dephlegmator where variations were achieved between 5 and 30 K. This range is limited by the operating conditions in order to avoid high solution flow ratios of operation with low performance. As a result, the influence of the heat transfer efficiency of this component on its own irreversibility and also on the irreversibility of the whole cycle is evaluated. These data can be used to determine the CSB (Eqn. 1) for a given set of
UNIVERSITAT ROVIRA I VIRGILI OPTIMIZATION OF ENVIRONMENTALLY FRIENDLY SOLAR ASSISTED ABSORPTION COOLING SYSTEMS Berhane Hagos Gebreslassie ISBN: 978-84-693-7673-7/DL:T-1752-2010
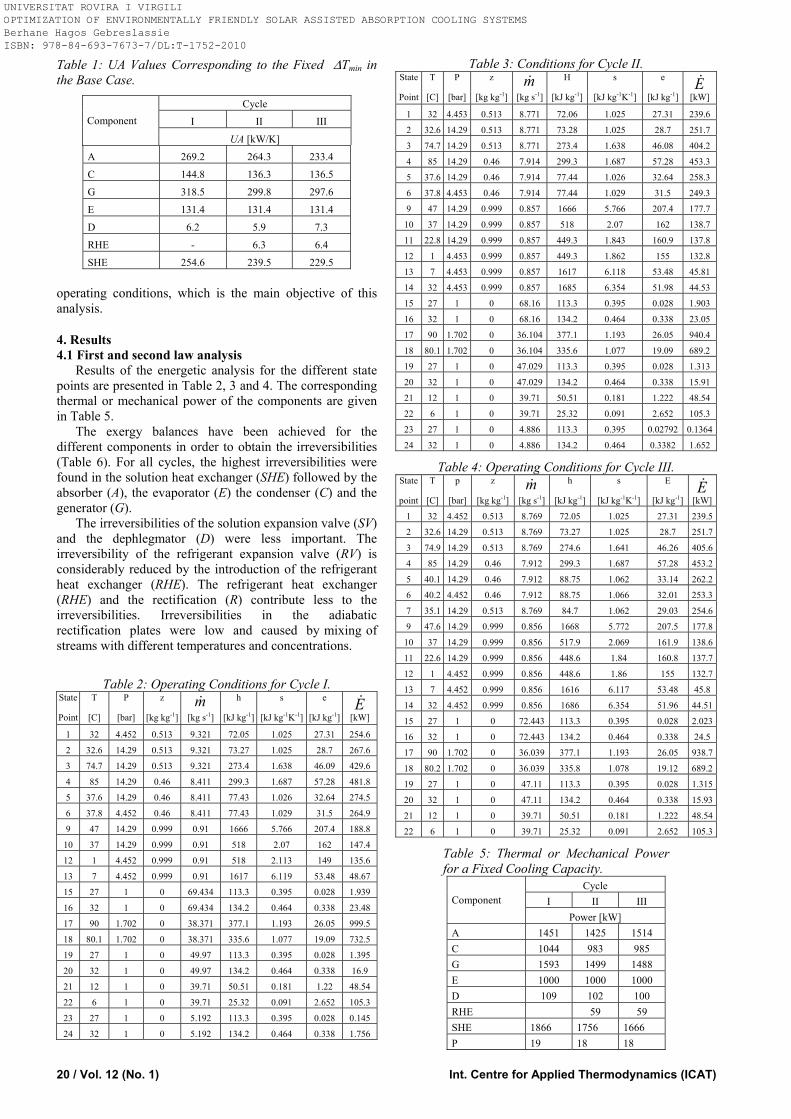
20 / Vol. 12 (No. 1) Int. Centre for Applied Thermodynamics (ICAT)
Table 1: UA Values Corresponding to the Fixed ΔTmin in the Base Case.
Component Cycle
I II III
UA [kW/K]
A 269.2 264.3 233.4
C 144.8 136.3 136.5
G 318.5 299.8 297.6
E 131.4 131.4 131.4
D 6.2 5.9 7.3
RHE - 6.3 6.4
SHE 254.6 239.5 229.5
operating conditions, which is the main objective of this analysis.
4. Results 4.1 First and second law analysis
Results of the energetic analysis for the different state points are presented in Table 2, 3 and 4. The corresponding thermal or mechanical power of the components are given in Table 5.
The exergy balances have been achieved for the different components in order to obtain the irreversibilities (Table 6). For all cycles, the highest irreversibilities were found in the solution heat exchanger (SHE) followed by the absorber (A), the evaporator (E) the condenser (C) and the generator (G).
The irreversibilities of the solution expansion valve (SV) and the dephlegmator (D) were less important. The irreversibility of the refrigerant expansion valve (RV) is considerably reduced by the introduction of the refrigerant heat exchanger (RHE). The refrigerant heat exchanger (RHE) and the rectification (R) contribute less to the irreversibilities. Irreversibilities in the adiabatic rectification plates were low and caused by mixing of streams with different temperatures and concentrations.
Table 2: Operating Conditions for Cycle I. State T P z m h s e E Point [C] [bar] [kg kg-1] [kg s-1] [kJ kg-1] [kJ kg-1K-1] [kJ kg-1] [kW]
1 32 4.452 0.513 9.321 72.05 1.025 27.31 254.6
2 32.6 14.29 0.513 9.321 73.27 1.025 28.7 267.6
3 74.7 14.29 0.513 9.321 273.4 1.638 46.09 429.6
4 85 14.29 0.46 8.411 299.3 1.687 57.28 481.8
5 37.6 14.29 0.46 8.411 77.43 1.026 32.64 274.5
6 37.8 4.452 0.46 8.411 77.43 1.029 31.5 264.9
9 47 14.29 0.999 0.91 1666 5.766 207.4 188.8
10 37 14.29 0.999 0.91 518 2.07 162 147.4
12 1 4.452 0.999 0.91 518 2.113 149 135.6
13 7 4.452 0.999 0.91 1617 6.119 53.48 48.67
15 27 1 0 69.434 113.3 0.395 0.028 1.939
16 32 1 0 69.434 134.2 0.464 0.338 23.48
17 90 1.702 0 38.371 377.1 1.193 26.05 999.5
18 80.1 1.702 0 38.371 335.6 1.077 19.09 732.5
19 27 1 0 49.97 113.3 0.395 0.028 1.395
20 32 1 0 49.97 134.2 0.464 0.338 16.9
21 12 1 0 39.71 50.51 0.181 1.22 48.54
22 6 1 0 39.71 25.32 0.091 2.652 105.3
23 27 1 0 5.192 113.3 0.395 0.028 0.145
24 32 1 0 5.192 134.2 0.464 0.338 1.756
Table 3: Conditions for Cycle II. State T P z m H s e E Point [C] [bar] [kg kg-1] [kg s-1] [kJ kg-1] [kJ kg-1K-1] [kJ kg-1] [kW]
1 32 4.453 0.513 8.771 72.06 1.025 27.31 239.6
2 32.6 14.29 0.513 8.771 73.28 1.025 28.7 251.7
3 74.7 14.29 0.513 8.771 273.4 1.638 46.08 404.2
4 85 14.29 0.46 7.914 299.3 1.687 57.28 453.3
5 37.6 14.29 0.46 7.914 77.44 1.026 32.64 258.3
6 37.8 4.453 0.46 7.914 77.44 1.029 31.5 249.3
9 47 14.29 0.999 0.857 1666 5.766 207.4 177.7
10 37 14.29 0.999 0.857 518 2.07 162 138.7
11 22.8 14.29 0.999 0.857 449.3 1.843 160.9 137.8
12 1 4.453 0.999 0.857 449.3 1.862 155 132.8
13 7 4.453 0.999 0.857 1617 6.118 53.48 45.81
14 32 4.453 0.999 0.857 1685 6.354 51.98 44.53
15 27 1 0 68.16 113.3 0.395 0.028 1.903
16 32 1 0 68.16 134.2 0.464 0.338 23.05
17 90 1.702 0 36.104 377.1 1.193 26.05 940.4
18 80.1 1.702 0 36.104 335.6 1.077 19.09 689.2
19 27 1 0 47.029 113.3 0.395 0.028 1.313
20 32 1 0 47.029 134.2 0.464 0.338 15.91
21 12 1 0 39.71 50.51 0.181 1.222 48.54
22 6 1 0 39.71 25.32 0.091 2.652 105.3
23 27 1 0 4.886 113.3 0.395 0.02792 0.1364
24 32 1 0 4.886 134.2 0.464 0.3382 1.652
Table 4: Operating Conditions for Cycle III. State T p z m h s E E point [C] [bar] [kg kg-1] [kg s-1] [kJ kg-1] [kJ kg-1K-1] [kJ kg-1] [kW]
1 32 4.452 0.513 8.769 72.05 1.025 27.31 239.5
2 32.6 14.29 0.513 8.769 73.27 1.025 28.7 251.7
3 74.9 14.29 0.513 8.769 274.6 1.641 46.26 405.6
4 85 14.29 0.46 7.912 299.3 1.687 57.28 453.2
5 40.1 14.29 0.46 7.912 88.75 1.062 33.14 262.2
6 40.2 4.452 0.46 7.912 88.75 1.066 32.01 253.3
7 35.1 14.29 0.513 8.769 84.7 1.062 29.03 254.6
9 47.6 14.29 0.999 0.856 1668 5.772 207.5 177.8
10 37 14.29 0.999 0.856 517.9 2.069 161.9 138.6
11 22.6 14.29 0.999 0.856 448.6 1.84 160.8 137.7
12 1 4.452 0.999 0.856 448.6 1.86 155 132.7
13 7 4.452 0.999 0.856 1616 6.117 53.48 45.8
14 32 4.452 0.999 0.856 1686 6.354 51.96 44.51
15 27 1 0 72.443 113.3 0.395 0.028 2.023
16 32 1 0 72.443 134.2 0.464 0.338 24.5
17 90 1.702 0 36.039 377.1 1.193 26.05 938.7
18 80.2 1.702 0 36.039 335.8 1.078 19.12 689.2
19 27 1 0 47.11 113.3 0.395 0.028 1.315
20 32 1 0 47.11 134.2 0.464 0.338 15.93
21 12 1 0 39.71 50.51 0.181 1.222 48.54
22 6 1 0 39.71 25.32 0.091 2.652 105.3
Table 5: Thermal or Mechanical Power for a Fixed Cooling Capacity.
Component Cycle
I II III Power [kW]
A 1451 1425 1514 C 1044 983 985 G 1593 1499 1488 E 1000 1000 1000 D 109 102 100 RHE 59 59 SHE 1866 1756 1666 P 19 18 18
UNIVERSITAT ROVIRA I VIRGILI OPTIMIZATION OF ENVIRONMENTALLY FRIENDLY SOLAR ASSISTED ABSORPTION COOLING SYSTEMS Berhane Hagos Gebreslassie ISBN: 978-84-693-7673-7/DL:T-1752-2010
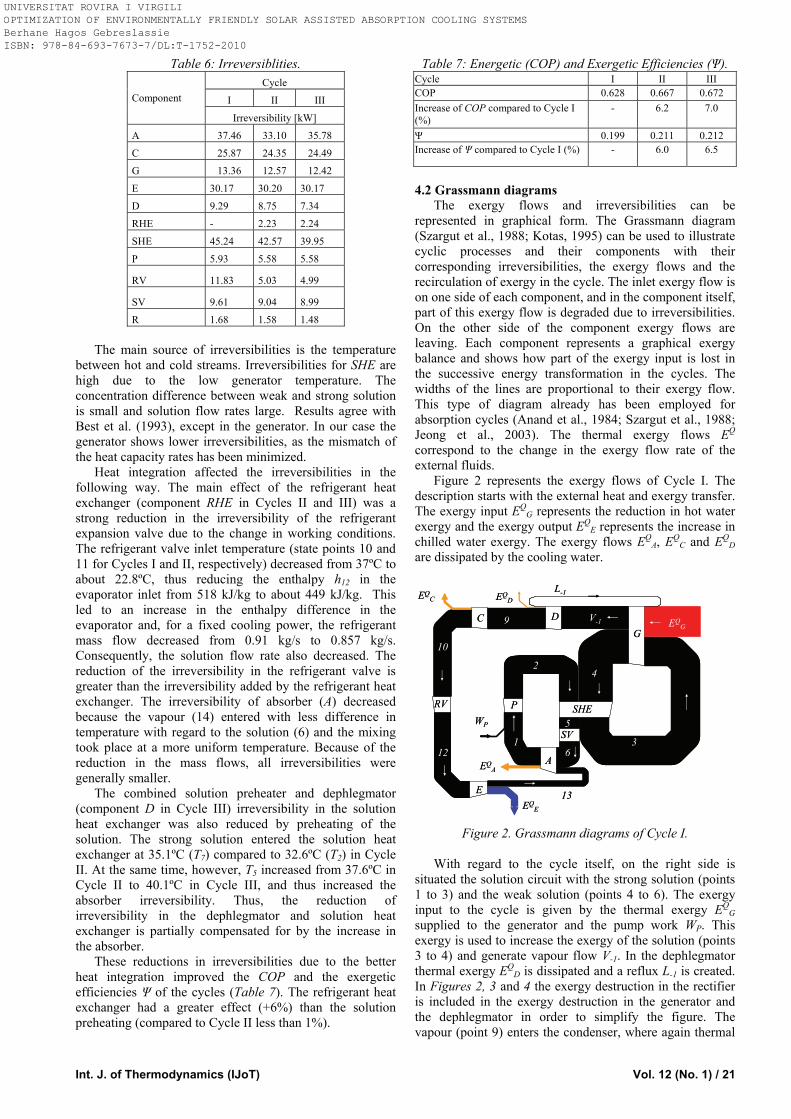
Int. J. of Thermodynamics (IJoT) Vol. 12 (No. 1) / 21
Table 6: Irreversiblities.
Component Cycle
I II III
Irreversibility [kW]
A 37.46 33.10 35.78
C 25.87 24.35 24.49
G 13.36 12.57 12.42
E 30.17 30.20 30.17
D 9.29 8.75 7.34
RHE - 2.23 2.24
SHE 45.24 42.57 39.95
P 5.93 5.58 5.58
RV 11.83 5.03 4.99
SV 9.61 9.04 8.99
R 1.68 1.58 1.48
The main source of irreversibilities is the temperature between hot and cold streams. Irreversibilities for SHE are high due to the low generator temperature. The concentration difference between weak and strong solution is small and solution flow rates large. Results agree with Best et al. (1993), except in the generator. In our case the generator shows lower irreversibilities, as the mismatch of the heat capacity rates has been minimized.
Heat integration affected the irreversibilities in the following way. The main effect of the refrigerant heat exchanger (component RHE in Cycles II and III) was a strong reduction in the irreversibility of the refrigerant expansion valve due to the change in working conditions. The refrigerant valve inlet temperature (state points 10 and 11 for Cycles I and II, respectively) decreased from 37ºC to about 22.8ºC, thus reducing the enthalpy h12 in the evaporator inlet from 518 kJ/kg to about 449 kJ/kg. This led to an increase in the enthalpy difference in the evaporator and, for a fixed cooling power, the refrigerant mass flow decreased from 0.91 kg/s to 0.857 kg/s. Consequently, the solution flow rate also decreased. The reduction of the irreversibility in the refrigerant valve is greater than the irreversibility added by the refrigerant heat exchanger. The irreversibility of absorber (A) decreased because the vapour (14) entered with less difference in temperature with regard to the solution (6) and the mixing took place at a more uniform temperature. Because of the reduction in the mass flows, all irreversibilities were generally smaller.
The combined solution preheater and dephlegmator (component D in Cycle III) irreversibility in the solution heat exchanger was also reduced by preheating of the solution. The strong solution entered the solution heat exchanger at 35.1ºC (T7) compared to 32.6ºC (T2) in Cycle II. At the same time, however, T5 increased from 37.6ºC in Cycle II to 40.1ºC in Cycle III, and thus increased the absorber irreversibility. Thus, the reduction of irreversibility in the dephlegmator and solution heat exchanger is partially compensated for by the increase in the absorber.
These reductions in irreversibilities due to the better heat integration improved the COP and the exergetic efficiencies Ψ of the cycles (Table 7). The refrigerant heat exchanger had a greater effect (+6%) than the solution preheating (compared to Cycle II less than 1%).
Table 7: Energetic (COP) and Exergetic Efficiencies (Ψ). Cycle I II III COP 0.628 0.667 0.672 Increase of COP compared to Cycle I (%)
- 6.2 7.0
Ψ 0.199 0.211 0.212 Increase of Ψ compared to Cycle I (%) - 6.0 6.5
4.2 Grassmann diagrams
The exergy flows and irreversibilities can be represented in graphical form. The Grassmann diagram (Szargut et al., 1988; Kotas, 1995) can be used to illustrate cyclic processes and their components with their corresponding irreversibilities, the exergy flows and the recirculation of exergy in the cycle. The inlet exergy flow is on one side of each component, and in the component itself, part of this exergy flow is degraded due to irreversibilities. On the other side of the component exergy flows are leaving. Each component represents a graphical exergy balance and shows how part of the exergy input is lost in the successive energy transformation in the cycles. The widths of the lines are proportional to their exergy flow. This type of diagram already has been employed for absorption cycles (Anand et al., 1984; Szargut et al., 1988; Jeong et al., 2003). The thermal exergy flows EQ correspond to the change in the exergy flow rate of the external fluids.
Figure 2 represents the exergy flows of Cycle I. The description starts with the external heat and exergy transfer. The exergy input EQ
G represents the reduction in hot water exergy and the exergy output EQ
E represents the increase in chilled water exergy. The exergy flows EQ
A, EQC and EQ
D are dissipated by the cooling water.
GDC
RV
E
A
P SHE
V-19
10
121
24
5
36
EQC EQ
D
EQE
WP
13
L-1
EQG
EQA
SV
GDC
RV
E
A
P SHE
V-19
10
121
24
5
36
EQC EQ
D
EQE
WP
13
L-1
EQG
EQA
SV
Figure 2. Grassmann diagrams of Cycle I.
With regard to the cycle itself, on the right side is
situated the solution circuit with the strong solution (points 1 to 3) and the weak solution (points 4 to 6). The exergy input to the cycle is given by the thermal exergy EQ
G supplied to the generator and the pump work WP. This exergy is used to increase the exergy of the solution (points 3 to 4) and generate vapour flow V-1. In the dephlegmator thermal exergy EQ
D is dissipated and a reflux L-1 is created. In Figures 2, 3 and 4 the exergy destruction in the rectifier is included in the exergy destruction in the generator and the dephlegmator in order to simplify the figure. The vapour (point 9) enters the condenser, where again thermal
UNIVERSITAT ROVIRA I VIRGILI OPTIMIZATION OF ENVIRONMENTALLY FRIENDLY SOLAR ASSISTED ABSORPTION COOLING SYSTEMS Berhane Hagos Gebreslassie ISBN: 978-84-693-7673-7/DL:T-1752-2010

22 / Vol. 12 (No. 1) Int. Centre for Applied Thermodynamics (ICAT)
exergy EQC is dissipated. The refrigerant passes through the
refrigerant expansion valve and enters the evaporator, where the useful thermal exergy output EQ
E is produced. The vapour (point 13) enters the absorber, where the refrigerant joins the solution circuit and the thermal exergy EQ
A is dissipated. The strong solution exergy is increased in the solution heat exchanger (points 2 to 3) while the weak solution exergy is reduced (points 4 to 5). It can also be observed that the irreversibilities in the solution pump and solution expansion valve are relatively small.
In the Grassmann diagram for Cycle II (Figure 3), the refrigerant heat exchanger has been added. A new loop for the refrigerant flow is therefore added on the left hand side. The lines representing the exergy flows are slightly narrower than for Cycle I due to the reduction in the mass flows. In the Grassmann diagram for Cycle III (Figure 4), the cooling of the dephlegmator by cooling water is replaced by a heat exchange, which preheats the strong solution. The dissipation of the thermal exergy flow EQ
D is therefore eliminated. The vapour flow V-1 and the strong solution 2 should enter on the same side but in order to obtain a clearer presentation an exception has been made in this case.
GDC
E
A
P SHE
V-19
10
1
2 4
5
36
EQC EQ
D
EQE
WP
13
L-1
EQG
EQA
12
14
RHE
11RV
SV
GDC
E
A
P SHE
V-19
10
1
2 4
5
36
EQC EQ
D
EQE
WP
13
L-1
EQG
EQA
12
14
RHE
11RV
SV
Figure 3. Grassmann diagrams of Cycle II.
GC
E
A
P SHE
V-19
10
1
24
5
36
EQC
EQE
WP
13
L-1
EQG
EQA
11
12
14
RHE
11
D
7
RV
SV
GC
E
A
P SHE
V-19
10
1
24
5
36
EQC
EQE
WP
13
L-1
EQG
EQA
11
12
14
RHE
11
D
7
RV
SV
Figure 4. Grassmann diagrams of Cycle III.
4.3 Structural analysis
Once the irreversibilities are obtained, it can be checked how a change of the irreversibility of one component affects the rest of the cycle. In the component, where the minimum temperature difference is modified, the irreversibility increases with a higher minimum temperature difference. For the other components the irreversibilities
can increase or decrease depending on the interactions among the components.
The analysis starts with the absorber. The minimum temperature difference ΔTA,min between solution and cooling water is modified. In Figure 5 can be observed how the irreversibility of the absorber and of the other components are affected. As ΔTA,min increases, the concentration difference between weak and strong solution decreases. In order to maintain the cooling capacity, the solution flow rate has to increase. As a direct consequence, the irreversibilities in the solution heat exchanger, the generator, the solution valve and the pump increase. This effect is more accentuated at temperature differences above 5 K, in which case as the absorber ΔTA,min increases the irreversibility of all components increases. Figure 5 also shows that the irreversibilities of the absorber and solution heat exchanger are the main contributors to the total irreversibility, followed by the evaporator and condenser.
1 2 3 4 5 6 7 80
10
20
30
40
50
60
70
80
ΔTA,min [K]
Irre
vers
ibili
ties
[kW
]
AACCGGEEDD
SHESHEPPRRRVRVSVSV
Figure 5: Irreversibilities due to a variation of absorber minimum temperature difference for Cycle I.
Figure 6 presents the total irreversibility of the whole cycle versus the irreversibility of the absorber due to the variations of ΔTmin for the cycle configurations considered. The trends for the different cycle configurations are similar, although there are slight differences among the values and slopes of the curves.
15 20 25 30 35 40 45 50 55 60120
140
160
180
200
220
240
260
280
IA [kW]
I t [k
W]
Cycle ICycle II
Cycle III
Figure 6: Total irreversibility change versus absorber irreversibility for change of absorber minimum temperature difference.
These observations will be quantified by the CSB’s as they correspond to the slope of the curves representing the
UNIVERSITAT ROVIRA I VIRGILI OPTIMIZATION OF ENVIRONMENTALLY FRIENDLY SOLAR ASSISTED ABSORPTION COOLING SYSTEMS Berhane Hagos Gebreslassie ISBN: 978-84-693-7673-7/DL:T-1752-2010

Int. J. of Thermodynamics (IJoT) Vol. 12 (No. 1) / 23
total irreversibility versus the irreversibility of the absorber. Their values are determined by application of Eqn. 1. For the absorber case, such an equation can be rewritten as:
,min
;var, ( )
A
A
tA T
A T UA comp A const
ICSBIΔ
Δ = ≠ =
⎛ ⎞Δ= ⎜ ⎟Δ⎝ ⎠
(9)
Values of the CSB for the absorber for the three configurations cycles are presented in Figure 7. At higher ΔTmin the CSB’s are higher. This means that the benefit of increasing the efficiency of a less efficient heat exchange is higher than for an already efficient heat exchanger with a low ΔTmin. If the value of the CSB is lower than one, the reduction of the irreversibility of the component under consideration is offset by an increase in the irreversibility of the other components. This means that a further improvement of this component is not worthwhile. Cycles I and II have very similar values of CSB’s, while cycle III has lower CSB’s for minimum temperature differences below 6 K. In the considered range CSB values are between 1.7 and 4.5. This means that in all cases a reduction in the irreversibility of the absorber is accompanied by a greater reduction in the cycle’s total irreversibility. The change in the slope at a ΔTmin of about 4.5 K corresponds to the point where the ΔTmin shifts from the hot to the cold side of the heat exchanger. The same phenomenon explains also sudden shifts in the slopes of the CSB’s for other components. Once the dependence of the CSB’s of the component efficiencies are obtained, we can apply Eqn. 4 to determine the optimum efficiency, which results in the lowest operating cost.
1 2 3 4 5 6 7 81,5
2
2,5
3
3,5
4
4,5
5
ΔTA,min [K]
CSB
A [-
]
Cycle ICycle ICycle IICycle IICycle IIICycle III
Figure 7: CSB for the absorber.
The same procedure is applied to the other main
components of the different cycles in order to obtain the corresponding CSB’s (
Figure 8). Comparing the different configurations, very similar values for cycles I and II are found, while values for cycle III are generally slightly higher.
Comparing the different components, the highest CSB results are for the refrigerant heat exchanger. Even at small temperature differences values are still much higher than unity. The condenser and evaporator have similar CSB’s with values above two. For the generator and solution heat exchanger it seems less interesting to improve their heat transfer efficiencies once ΔTmin is below 5 K, as in this range CSB’s are near unity. The dephlegmator shows a totally different behaviour with a singularity. While at
minimum temperature differences above 15 K CSB’s are negative, they change to positive values for lower ΔTmin. This means that we should operate at a ΔTmin between 10 to 15 K. For lower ΔTmin the CSB approaches zero and further improvement makes no sense. These different tendencies are due to the strong interactions of the dephlegmator with the rest of the cycle. As the heat exchange efficiency improves the leaving ammonia becomes more pure, but there is an increase in other parameters, namely the heat which has to be dissipated, the temperature difference along the rectification column, and the reflux.
The interactions between the different components can be better understood observing the changes in the irreversibilities in detail. Table 8 represents the effect of the improvement of one component on the irreversibility of the other components for the three cycle configurations. For each component changes in irreversibilities are presented in two columns, the left in kW and the right in %. The values correspond to the differences of the irreversibility for ΔTmin of 1 K and 5 K, except for the dephlegmator (5 K and 30 K). A positive number represents an improvement, which is a reduction in irreversibility. Moreover, there is also a positive interaction if the reduction in the irreversibility of one component also causes a reduction in the irreversibility of other components. A grey background marks the effect on the component itself. A bold number indicates an important improvement (>10%), while an italic number corresponds to strong losses (>10%).
The reduction of the ΔTmin of all main components (absorber, generator, evaporator and condenser) affects the pressures and concentrations and leads to a reduction in the solution mass flow ratio. As a consequence, the irreversibility of the solution heat exchanger SHE is always reduced. This also benefits other components of the solution circuit such as the pump P and the solution expansion valve SV.
An improvement of the absorber A reduces the solution flow rate and irreversibilities of all components in the solution circuit, including the rectification column and the generator. The same effect occurs with the condenser. As its ΔTmin decreases, the high pressure of the cycle is reduced and the solution leaving the generator is weaker in ammonia. The irreversibilities in all components except the absorber are reduced.
The irreversibility is given by the difference between exergy input and exergy output. For the absorber we obtain (for Cycle I):
[ ] [ ]15161136 EEEEEI A −−−+= (17)
As the heat dissipation increases, the amount of exergy output [ ]1516 EE − through the cooling water increases. As the solution flow rate increases, higher exergy flow rates of the solution circuit are obtained. But the exergy of the leaving strong solution 1E increases more than the exergy of the entering weak solution 6E . So, the exergy input
[ ]1136 EEE −+ becomes smaller. Consequently the irreversibility of the absorber decreases.
If in the generator ΔTmin decreases the weak solution outlet temperature increases for a fixed hot source temperature. Also, the temperature difference along the rectification column and its irreversibility increases. On the other hand, the component for which a decrease in
UNIVERSITAT ROVIRA I VIRGILI OPTIMIZATION OF ENVIRONMENTALLY FRIENDLY SOLAR ASSISTED ABSORPTION COOLING SYSTEMS Berhane Hagos Gebreslassie ISBN: 978-84-693-7673-7/DL:T-1752-2010
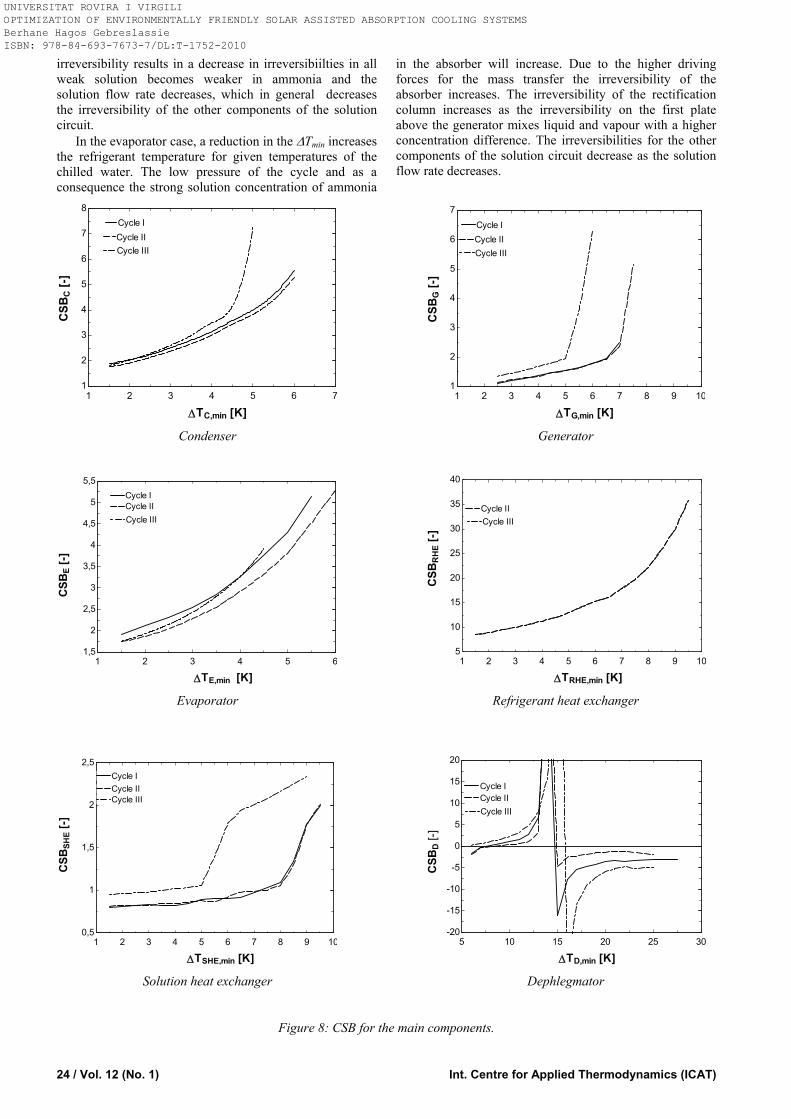
24 / Vol. 12 (No. 1) Int. Centre for Applied Thermodynamics (ICAT)
irreversibility results in a decrease in irreversibiilties in all weak solution becomes weaker in ammonia and the solution flow rate decreases, which in general decreases the irreversibility of the other components of the solution circuit.
In the evaporator case, a reduction in the ΔTmin increases the refrigerant temperature for given temperatures of the chilled water. The low pressure of the cycle and as a consequence the strong solution concentration of ammonia
in the absorber will increase. Due to the higher driving forces for the mass transfer the irreversibility of the absorber increases. The irreversibility of the rectification column increases as the irreversibility on the first plate above the generator mixes liquid and vapour with a higher concentration difference. The irreversibilities for the other components of the solution circuit decrease as the solution flow rate decreases.
1 2 3 4 5 6 71
2
3
4
5
6
7
8
ΔTC,min [K]
CSB
C [-
]
Cycle ICycle ICycle IICycle IICycle IIICycle III
1 2 3 4 5 6 7 8 9 10
1
2
3
4
5
6
7
ΔTG,min [K]C
SBG
[-]
Cycle ICycle ICycle IICycle IICycle IIICycle III
Condenser Generator
1 2 3 4 5 61,5
2
2,5
3
3,5
4
4,5
5
5,5
ΔTE,min [K]
CSB
E [-
]
Cycle ICycle ICycle IICycle IICycle IIICycle III
1 2 3 4 5 6 7 8 9 10
5
10
15
20
25
30
35
40
ΔTRHE,min [K]
CSB
RH
E [-
]
Cycle IICycle IICycle IIICycle III
Evaporator Refrigerant heat exchanger
1 2 3 4 5 6 7 8 9 100,5
1
1,5
2
2,5
ΔTSHE,min [K]
CSB
SHE
[-]
Cycle ICycle ICycle IICycle IICycle IIICycle III
5 10 15 20 25 30
-20
-15
-10
-5
0
5
10
15
20
ΔTD,min [K]
CSB
D [-
]
Cycle ICycle ICycle IICycle IICycle IIICycle III
Solution heat exchanger Dephlegmator
Figure 8: CSB for the main components.
UNIVERSITAT ROVIRA I VIRGILI OPTIMIZATION OF ENVIRONMENTALLY FRIENDLY SOLAR ASSISTED ABSORPTION COOLING SYSTEMS Berhane Hagos Gebreslassie ISBN: 978-84-693-7673-7/DL:T-1752-2010
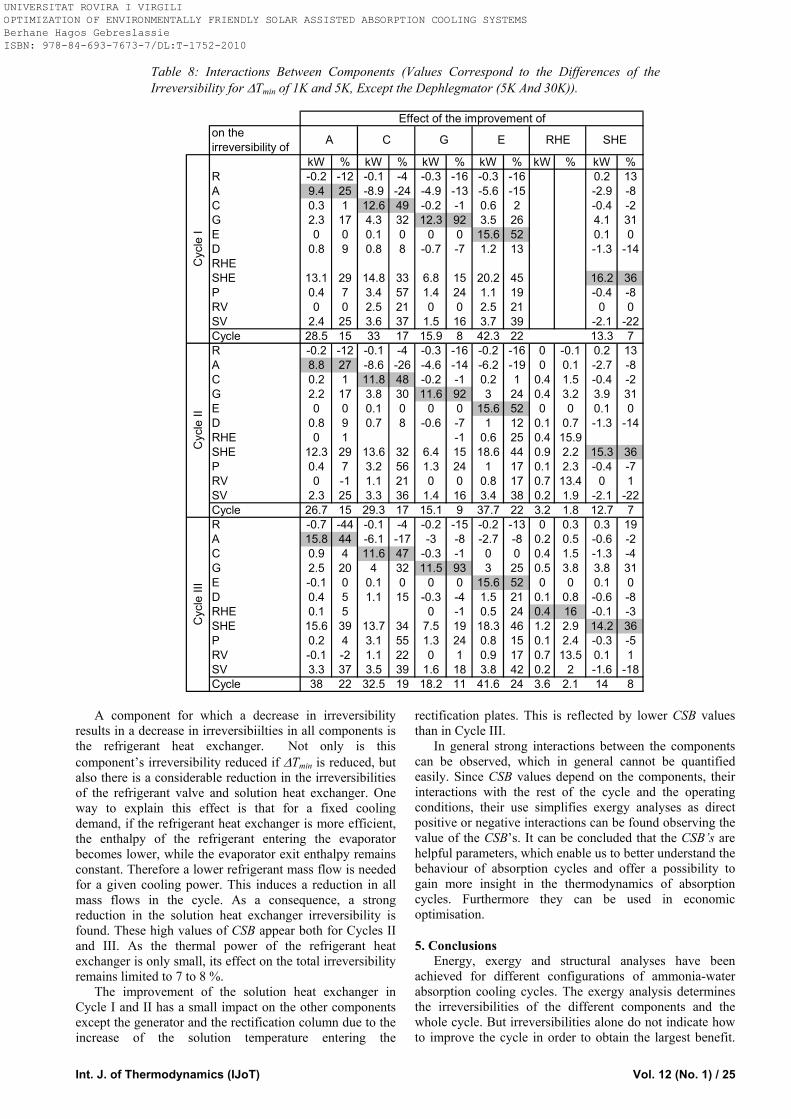
Int. J. of Thermodynamics (IJoT) Vol. 12 (No. 1) / 25
Table 8: Interactions Between Components (Values Correspond to the Differences of the Irreversibility for ΔTmin of 1K and 5K, Except the Dephlegmator (5K And 30K)).
on the irreversibility of
kW % kW % kW % kW % kW % kW %R -0.2 -12 -0.1 -4 -0.3 -16 -0.3 -16 0.2 13A 9.4 25 -8.9 -24 -4.9 -13 -5.6 -15 -2.9 -8C 0.3 1 12.6 49 -0.2 -1 0.6 2 -0.4 -2G 2.3 17 4.3 32 12.3 92 3.5 26 4.1 31E 0 0 0.1 0 0 0 15.6 52 0.1 0D 0.8 9 0.8 8 -0.7 -7 1.2 13 -1.3 -14RHESHE 13.1 29 14.8 33 6.8 15 20.2 45 16.2 36P 0.4 7 3.4 57 1.4 24 1.1 19 -0.4 -8RV 0 0 2.5 21 0 0 2.5 21 0 0SV 2.4 25 3.6 37 1.5 16 3.7 39 -2.1 -22Cycle 28.5 15 33 17 15.9 8 42.3 22 13.3 7R -0.2 -12 -0.1 -4 -0.3 -16 -0.2 -16 0 -0.1 0.2 13A 8.8 27 -8.6 -26 -4.6 -14 -6.2 -19 0 0.1 -2.7 -8C 0.2 1 11.8 48 -0.2 -1 0.2 1 0.4 1.5 -0.4 -2G 2.2 17 3.8 30 11.6 92 3 24 0.4 3.2 3.9 31E 0 0 0.1 0 0 0 15.6 52 0 0 0.1 0D 0.8 9 0.7 8 -0.6 -7 1 12 0.1 0.7 -1.3 -14RHE 0 1 -1 0.6 25 0.4 15.9SHE 12.3 29 13.6 32 6.4 15 18.6 44 0.9 2.2 15.3 36P 0.4 7 3.2 56 1.3 24 1 17 0.1 2.3 -0.4 -7RV 0 -1 1.1 21 0 0 0.8 17 0.7 13.4 0 1SV 2.3 25 3.3 36 1.4 16 3.4 38 0.2 1.9 -2.1 -22Cycle 26.7 15 29.3 17 15.1 9 37.7 22 3.2 1.8 12.7 7R -0.7 -44 -0.1 -4 -0.2 -15 -0.2 -13 0 0.3 0.3 19A 15.8 44 -6.1 -17 -3 -8 -2.7 -8 0.2 0.5 -0.6 -2C 0.9 4 11.6 47 -0.3 -1 0 0 0.4 1.5 -1.3 -4G 2.5 20 4 32 11.5 93 3 25 0.5 3.8 3.8 31E -0.1 0 0.1 0 0 0 15.6 52 0 0 0.1 0D 0.4 5 1.1 15 -0.3 -4 1.5 21 0.1 0.8 -0.6 -8RHE 0.1 5 0 -1 0.5 24 0.4 16 -0.1 -3SHE 15.6 39 13.7 34 7.5 19 18.3 46 1.2 2.9 14.2 36P 0.2 4 3.1 55 1.3 24 0.8 15 0.1 2.4 -0.3 -5RV -0.1 -2 1.1 22 0 1 0.9 17 0.7 13.5 0.1 1SV 3.3 37 3.5 39 1.6 18 3.8 42 0.2 2 -1.6 -18Cycle 38 22 32.5 19 18.2 11 41.6 24 3.6 2.1 14 8
Cyc
le I
Cyc
le II
Cyc
le II
I
Effect of the improvement of
RHE SHEA C G E
A component for which a decrease in irreversibility
results in a decrease in irreversibiilties in all components is the refrigerant heat exchanger. Not only is this component’s irreversibility reduced if ΔTmin is reduced, but also there is a considerable reduction in the irreversibilities of the refrigerant valve and solution heat exchanger. One way to explain this effect is that for a fixed cooling demand, if the refrigerant heat exchanger is more efficient, the enthalpy of the refrigerant entering the evaporator becomes lower, while the evaporator exit enthalpy remains constant. Therefore a lower refrigerant mass flow is needed for a given cooling power. This induces a reduction in all mass flows in the cycle. As a consequence, a strong reduction in the solution heat exchanger irreversibility is found. These high values of CSB appear both for Cycles II and III. As the thermal power of the refrigerant heat exchanger is only small, its effect on the total irreversibility remains limited to 7 to 8 %.
The improvement of the solution heat exchanger in Cycle I and II has a small impact on the other components except the generator and the rectification column due to the increase of the solution temperature entering the
rectification plates. This is reflected by lower CSB values than in Cycle III.
In general strong interactions between the components can be observed, which in general cannot be quantified easily. Since CSB values depend on the components, their interactions with the rest of the cycle and the operating conditions, their use simplifies exergy analyses as direct positive or negative interactions can be found observing the value of the CSB’s. It can be concluded that the CSB’s are helpful parameters, which enable us to better understand the behaviour of absorption cycles and offer a possibility to gain more insight in the thermodynamics of absorption cycles. Furthermore they can be used in economic optimisation.
5. Conclusions Energy, exergy and structural analyses have been
achieved for different configurations of ammonia-water absorption cooling cycles. The exergy analysis determines the irreversibilities of the different components and the whole cycle. But irreversibilities alone do not indicate how to improve the cycle in order to obtain the largest benefit.
UNIVERSITAT ROVIRA I VIRGILI OPTIMIZATION OF ENVIRONMENTALLY FRIENDLY SOLAR ASSISTED ABSORPTION COOLING SYSTEMS Berhane Hagos Gebreslassie ISBN: 978-84-693-7673-7/DL:T-1752-2010
26 / Vol. 12 (No. 1) Int. Centre for Applied Thermodynamics (ICAT)
To do so, the structural analysis using the coefficients of structural bonds (CSB) is applied. The CSB’s indicate how the irreversibility change in one component affects the rest of the system. This analysis includes a variation of the minimum temperature difference ΔTmin or UA-value of one component, while the UA-values of the other components are fixed. In this way, the effect on the irreversibility change in all the considered components of the whole cycle can be quantified by the CSB’s. They are different for each component and cycle configuration and also vary with the ΔTmin or UA-value.
Results show, as expected, that it is more beneficial to improve less efficient components with high ΔTmin or low UA-values rather than components which already operate with low ΔTmin. The components with the highest impact on the cycle as a whole are identified, and the refrigerant heat exchanger has the highest CSB values. Values which are in general significantly higher than unity can be seen in the evaporator, the condenser, the generator and the absorber. Values around unity are found for the solution heat exchanger. The dephlegmator shows a different behavior due to its strong interactions with the rest of the cycle. Differences between the cycle configurations are generally small.
In summary, once the exergy balances for a cycle have been established and the irreversibilities have been obtained, the structural method presents a useful method for better understanding and quantifying the interactions in the cycle. With the CSB, the most cost-effective cycle for a given set of operating parameters can be obtained. However, as is presented in Eqn. 8 the optimum efficiency values of each component depend also on the energy cost and the capital investment and the annual operation time.
Acknowledgements
This research project was financially supported by the “Ministerio de Ciencia y Tecnología – Dirección general de investigación” of Spain (DPI2002-00706).
Nomenclature
ac Capital recovery factor (-) bc Part of the annual operation cost which is not
affected by the optimisation (€) einc Unitary cost of input exergy (€/kWh) l
ikc , Unit cost of irreversibility (€/kWh) clC Capital cost of the component l (€)
Ct Annual operation cost (€) COP Coefficient of performance (-) CSB Coefficients of structural bonds (-) e Specific exergy (kJ kg-1) E Exergy flow (kW)
inE Input exergy flow (kW) h Specific enthalpy (kJ kg-1) i Interest rate (-) I Irreversibility (kW) m Mass flow (kg s-1) n Years of repayment p Pressure (bar) s Specific entropy (kJ kg-1 K-1) top Annual operation time (h)
T Temperature (ºC or K) UA Product of heat transfer coefficient and heat
transfer area (kW/K)
pumpW Pump power (kW) xi Parameter in the efficiency variation of the CSB z Mass fraction of ammonia (kg/kg)
Greek letters ΔTmin Minimum temperature difference in a heat
exchanger (K)
ik ,ξ Capital cost coefficient (€/kW) Ψ Exergetic efficiency of the cycle (-)
Subscripts i inlet e exit k component k t total 0 environmental state (25ºC, 1 bar)
Components A Absorber C Condenser D Dephlegmator E Evaporator G Generator P Solution pump R Adiabatic rectification plates RHE Refrigerant heat exchanger RV Refrigerant expansion valve SHE Solution heat exchanger SV Solution expansion valves
References Anand, D. K., K. W. Lindler, et al., 1984. "Second-Law Analysis of Solar-Powered Absorption Cooling cycles and systems,." J. Solar Energy Eng 106: 291-298. Ataer, E. and Y. Gögus, 1991. "Comparative study of irreversibilities in an aqua-ammonia absorption refrigeration system." International Journal of Refrigeration 14(2): 86-92. Bejan, A., G. Tsatsaronis, et al., 1996. Thermal Design & Optimization. New York, John Wiley & Sons Inc. Best, R., J. Islas, et al., 1993. "Exergy Efficiency of an Ammonia-Water Absorption System for Ice Production." Applied Energy 45: 241-256. Beyer, J., 1970. Structural analysis- necessary part of efficiency analysis of thermal systems [Strukturuntersuchungen- notwendiger Bestandteil der Effektivitätsanalyse von Wärmeverbrauchersystemen]. Energie-anwendung 19(12): 358-361. Beyer, J., 1974. "Structure of thermal systems and economical optimisation of system parameters [Struktur wärmetechnischer Systeme und ökonomische Optimierung der Systemparameter]." Energieanwendung 23(9): 274-279. Boer, D., M. Medrano, et al., 2005. "Exergy and structural analysis of an absorption cooling cycle and the effect of efficiency parameters." International Journal of Thermodynamics 8(4): 191-198. Dentice d'Accadia, M. and F. de Rossi, 1998. "Thermoeconomic optimization of a refrigeration plant." International Journal of Refrigeration 21(3): 42-54.
UNIVERSITAT ROVIRA I VIRGILI OPTIMIZATION OF ENVIRONMENTALLY FRIENDLY SOLAR ASSISTED ABSORPTION COOLING SYSTEMS Berhane Hagos Gebreslassie ISBN: 978-84-693-7673-7/DL:T-1752-2010

Int. J. of Thermodynamics (IJoT) Vol. 12 (No. 1) / 27
Dentice d'Accadia, M. and L. Vanoli, 2004. "Thermoeconomic optimisation of the condenser in a vapour compression heat pump." International Journal of Refrigeration 27(4): 433-441. Dingeç, H. and A. Ileri, 1999. "Thermoeconomic optimization of simple refrigerators." International Journal of Energy Research 23(11): 949-962. El-Sayed, Y. M., 2003. The Thermoeconomics of energy conversions. Amsterdam Boston. Ferrer, M. A., M. A. Lozano, et al., 2001. "Thermoeconomics applied to Air-Conditioning Systems." ASHRAE Transactions AT-01-9-2. Jeong, J., K. Saito, et al., 2003. Optimum design method for a single effect absorption refrigerator based on the first and second law analysis. 21st IIR International Congress of Refrigeration, Washington, DC (USA). Jonsson, M. and Y. Jinyue, 2000. "Exergy and Pinch Analysis of Diesel Engine Bottoming Cycles with Ammonia-Water Mixtures as Working Fluid." Int.J. Applied Thermodynamics 3(2): 57-71. Karakas, A., N. Egrican, et al., 1990. "Second law analysis of solar absorption-cooling cycles using Lithium Bromide/Water and Ammonia/Water as Working Fluids." Applied Energy 37: 169-197. KizIlkan, Ö., A. Sencan, et al., 2007. "Thermoeconomic optimization of a LiBr absorption refrigeration system." Chemical Engineering and Processing: Process Intensification 46(12): 1376-1384. Kotas, T., 1995. The Exergy Method of Thermal Plant Analysis. Melbourne, Florida, Krieger Publishing Company. Misra, R. D., P. K. Sahoo, et al., 2003. "Thermoeconomic optimization of a single effect water/LiBr vapour absorption refrigeration system." International Journal of Refrigeration 26(2): 158-169.
Misra, R. D., P. K. Sahoo, et al., 2005. "Thermoeconomic evaluation and optimization of a double-effect H2O/LiBr vapour-absorption refrigeration system." International Journal of Refrigeration 28(3): 331-343. Misra, R. D., P. K. Sahoo, et al., 2006. "Thermoeconomic evaluation and optimization of an aqua-ammonia vapour-absorption refrigeration system." International Journal of Refrigeration 29(1): 47-59. Roriz, L. and A. Mortal, 2003. Study on distillation solutions for a solar assisted absorption heat pump. Eurotherm seminar 72: Thermodynamics, heat and mass transfer of refrigeration machines and heat pumps, Valencia, Spain, Ed. Pub. IMST-UPV. Sahin, B. and A. Kodal, 2002. "Thermoeconomic optimization of a two stage combined refrigeration system: a finite-time approach." International Journal of Refrigeration 25(7): 872-877. Szargut, J., D. Morris, et al., 1988. Exergy Analysis of Thermal, Chemical, and Metallurgical Processes. Sözen, A., 2001. Effect of heat exchangers on performance of absorption refrigeration systems. Energy Conversion and Management 42(14): 1699-1716. Tillner Roth, R. and D. Friend, 1998. A Helmholtz Free Energy Formulation of the Thermodynamic Properties of the mixture {Ammonia + Water}. J.Phys.Chem.Ref.Data 27(1): 63-96. Tozer, R. and M. A. Lozano, 1999. Thermo-economic optimisation of a single effect absorption chiller and cooling tower. International Sorption Heat Pump Conference. Munich: ZAE Bayern. Wall, G., 1986. "Thermoeconomic Optimization of a Heat-Pump System." Energy 11(10): 957-967. Zhang, G. Q., L. Wang, et al., 2004. "Thermoeconomic optimization of small size central air conditioner." Applied Thermal Engineering 24(4): 471-485.
UNIVERSITAT ROVIRA I VIRGILI OPTIMIZATION OF ENVIRONMENTALLY FRIENDLY SOLAR ASSISTED ABSORPTION COOLING SYSTEMS Berhane Hagos Gebreslassie ISBN: 978-84-693-7673-7/DL:T-1752-2010

i n t e r n a t i o n a l j o u r n a l o f r e f r i g e r a t i o n 3 3 ( 2 0 1 0 ) 5 2 9 – 5 3 7
UNIVERSITAT ROVIRA I VIRGILI OPTIMIZATION OF ENVIRONMENTALLY FRIENDLY SOLAR ASSISTED ABSORPTION COOLING SYSTEMS Berhane Hagos Gebreslassie ISBN: 978-84-693-7673-7/DL:T-1752-2010
www. i ifi i r .org
ava i lab le at www.sc iencedi rec t . com
journa l homepage : www.e lsev i er . com/ loca te / i j r e f r ig
Optimum heat exchanger area estimation using coefficients ofstructural bonds: Application to an absorption chiller
Berhane H. Gebreslassie a, Marc Medrano b, Filipe Mendes c,d, Dieter Boer a,*a Department of Mechanical Engineering, University Rovira i Virgili, Tarragona 43007, Spainb GREA Innovacio Concurrent, Edifici CREA, Universitat de Lleida, Lleida, Spainc Departamento de Fısica, Instituto Superior Tecnico, Technical University of Lisbon, Lisbon, Portugald ICIST, Instituto Superior Tecnico, Technical University of Lisbon, Lisbon, Portugal
a r t i c l e i n f o
Article history:
Received 4 May 2009
Received in revised form
17 September 2009
Accepted 4 December 2009
Available online 16 December 2009
Keywords:
Absorption system
Chiller
Design
Optimisation
Area
Heat exchanger
* Corresponding author. Tel.: þ34 977 559631E-mail address: [email protected] (D. B
0140-7007/$ – see front matter ª 2009 Elsevidoi:10.1016/j.ijrefrig.2009.12.004
a b s t r a c t
The optimum allocation of the heat exchange area considers both running and investment
cost. The structural method of thermoeconomic optimization is used to derive a simple
equation for the estimation of the economic optimum of the area of a heat exchanger
integrated in a more complex system. The obtained equation is generally valid for thermal
systems. The optimum heat exchange area can be estimated in a straightforward calcu-
lation once operation and cost parameters, the overall heat transfer coefficient and the
Coefficient of Structural Bonds (CSB) are known. The CSB quantifies the interactions
between the units of the thermal system and is obtained from an exergy analysis.
Therefore, compared to former work, the proposed equation has the advantage of
considering interactions between the units of the system. A case study is presented for an
ammonia-water absorption chiller. The optimum area from the proposed formulation is
compared with the results obtained from the integrated optimization algorithm of EES
(from F-Chart) and the base cases for different annual operation time.
ª 2009 Elsevier Ltd and IIR. All rights reserved.
Determination de la surface d’echange de chaleur optimale al’aide des coefficients des liens structurels: application a unrefroidisseur a absorption
Mots cles : Systeme a absorption ; Refroidisseur ; Conception ; Optimisation ; Surface ; Echangeur de chaleur
; fax: þ34 977 559691.oer).er Ltd and IIR. All rights reserved.
Nomenclature
Abbreviations
A Absorber
C Condenser
D Desorber
EES Engineering Equation solver
E Evaporator
P Solution pump
RV Refrigerant expansion valve
SC Subcooler
SHX Solution heat exchanger
SV Solution expansion valve
yr Year
Variables
ac Capital recovery factor [–]
Ak Area of heat exchanger k [m2]
bc Cost factors, which are not affected by
optimization [euro]
clk;i Unit cost of exergy destruction [euro kWh�1]
Cc Annual capital cost [euro]
Cop Annual running cost [euro]
Ct Annual total cost [euro]
Ckc Capital cost of unit k [euro]
COP Coefficient of performance [–]
CSB Coefficient of structural bonds [–]
Ein Rate of fuel exergy consumed [kW]
ej Specific exergy of stream j [kJ kg�1]
hj specific enthalpy of stream j [kJ kg�1]
mj Mass flow rate of stream j [kg s�1]
Pj Pressure of stream j [MPa]
Qk Heat transfer rate to unit k [kW]
sj Specific entropy of stream j [kJ kg�1 K�1]
Sk Entropy production in unit k [kW K�1]
Tj Temperature of stream j ½�C or K�DTk
lm Logarithmic mean temperature difference [K]
DTk Arithmetic mean temperature difference [K]~T Thermodynamic mean temperature [K]
T Arithmetic mean temperature [K]
Wk Mechanical power done by unit k [kW]
xi Parameter related to efficiency of units [m2 or K]
zi,j Mass fraction of component i in stream j [–]
Greek letters
xk, i Capital cost coefficient [euro kW�1]
Parameters
b Specific cost of heat exchanger [euro m�2]
cine Specific cost of exergy [euro kWh�1]
ir Interest rate [–]
n Years for the repayment [yr]
nu The number of units in absorption cycle [–]
top Operation time [h yr�1]
Uk Overall heat transfer coefficient of unit k
[kW m�2 K�1]
Subscripts
0 Environment state
c Cold
h Hot
i Component of a stream
j Streams
k Unit
t Total
Sets
IN(k) Set of input streams to unit k
OUT(k) Set of output streams from unit k
i n t e r n a t i o n a l j o u r n a l o f r e f r i g e r a t i o n 3 3 ( 2 0 1 0 ) 5 2 9 – 5 3 7530
UNIVERSITAT ROVIRA I VIRGILI OPTIMIZATION OF ENVIRONMENTALLY FRIENDLY SOLAR ASSISTED ABSORPTION COOLING SYSTEMS Berhane Hagos Gebreslassie ISBN: 978-84-693-7673-7/DL:T-1752-2010
1. Introduction
Heat exchangers are important units in thermal systems. The
area should be sized to optimize economic performance and
be distributed in order to obtain the maximum performance
for a given available total area. The optimum refers to the
design with the lowest total cost, determined mostly by the
investment and running cost. The final purpose is the design
of more cost-effective systems.
An example of thermal systems, which are mainly
composed by heat exchangers are absorption cycles. In these
systems the heat exchangers are the main source of exergy
destruction and the dominant investment cost factor. The
problem of optimum area allocation has initially been dis-
cussed for endoreversible cycles, where the internal exergy
destruction is neglected. These approaches indicates how to
distribute the heat conductance among the external heat
exchangers (Bejan et al., 1995; Herold and Radermacher,
1990; Klein, 1992). The ‘‘square root criterion’’ (Summerer,
1996; Ziegler, 1997, 1999) includes the effect of parameters as
the specific cost of the heat exchanger surface, the overall
heat transfer coefficient and the mean temperature of the
heat exchanger. Summerer (1996) performed a large number
of numerical simulations of cycles in order to create a data-
base of the best-obtained design options. More recent work
used the exergy-based concept of thermoeconomic optimi-
zation. Misra et al. (2003, 2006) used an average cost approach
and the minimization of the overall running and amortiza-
tion cost.
Another exergy based method is the structural method,
which has been developed by Beyer (1970, 1974). It uses the
unitary cost of exergy and structural coefficients. This ther-
moeconomic optimization methodology has been applied by
Dingec and Ileri (1999) for a vapor compression refrigerator,
by Dentice d’Accadia and Vanoli (2004) for the design of
a condenser of a compression cycle and recently by KizIlkan
et al. (2007), for a water-LiBr absorption refrigeration system.
These works used the general optimization equation in order
to obtain the numerical solutions for the considered
problems.
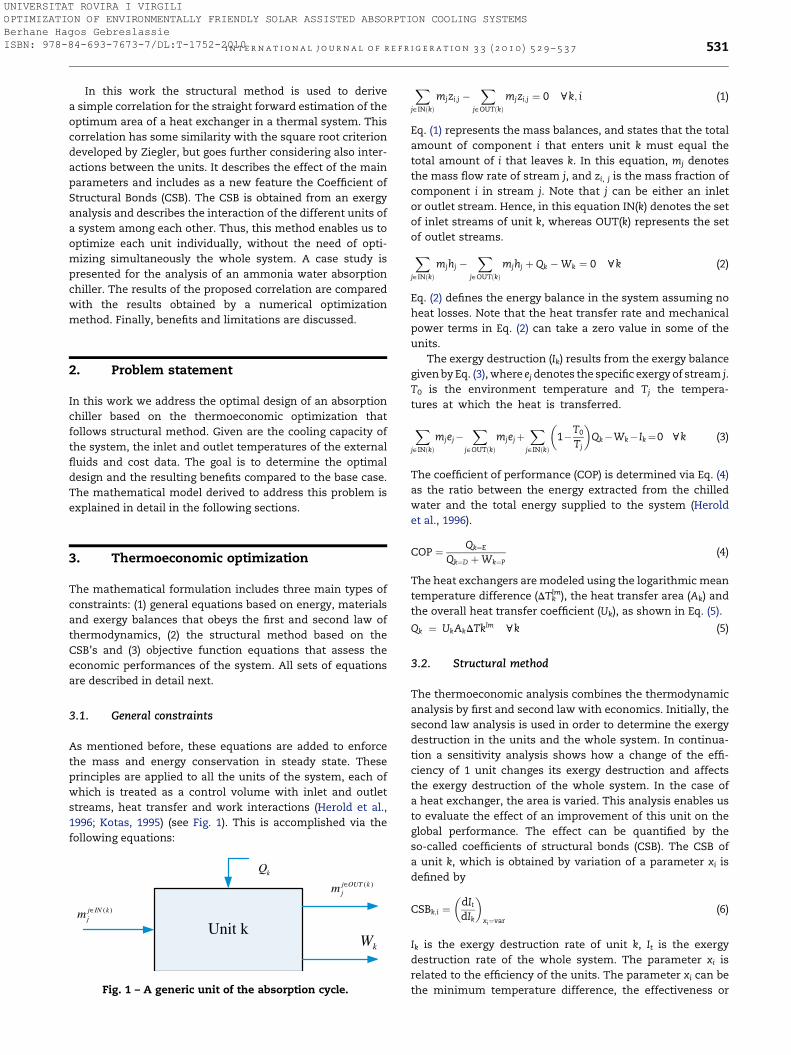
i n t e r n a t i o n a l j o u r n a l o f r e f r i g e r a t i o n 3 3 ( 2 0 1 0 ) 5 2 9 – 5 3 7 531
UNIVERSITAT ROVIRA I VIRGILI OPTIMIZATION OF ENVIRONMENTALLY FRIENDLY SOLAR ASSISTED ABSORPTION COOLING SYSTEMS Berhane Hagos Gebreslassie ISBN: 978-84-693-7673-7/DL:T-1752-2010
In this work the structural method is used to derive
a simple correlation for the straight forward estimation of the
optimum area of a heat exchanger in a thermal system. This
correlation has some similarity with the square root criterion
developed by Ziegler, but goes further considering also inter-
actions between the units. It describes the effect of the main
parameters and includes as a new feature the Coefficient of
Structural Bonds (CSB). The CSB is obtained from an exergy
analysis and describes the interaction of the different units of
a system among each other. Thus, this method enables us to
optimize each unit individually, without the need of opti-
mizing simultaneously the whole system. A case study is
presented for the analysis of an ammonia water absorption
chiller. The results of the proposed correlation are compared
with the results obtained by a numerical optimization
method. Finally, benefits and limitations are discussed.
2. Problem statement
In this work we address the optimal design of an absorption
chiller based on the thermoeconomic optimization that
follows structural method. Given are the cooling capacity of
the system, the inlet and outlet temperatures of the external
fluids and cost data. The goal is to determine the optimal
design and the resulting benefits compared to the base case.
The mathematical model derived to address this problem is
explained in detail in the following sections.
3. Thermoeconomic optimization
The mathematical formulation includes three main types of
constraints: (1) general equations based on energy, materials
and exergy balances that obeys the first and second law of
thermodynamics, (2) the structural method based on the
CSB’s and (3) objective function equations that assess the
economic performances of the system. All sets of equations
are described in detail next.
3.1. General constraints
As mentioned before, these equations are added to enforce
the mass and energy conservation in steady state. These
principles are applied to all the units of the system, each of
which is treated as a control volume with inlet and outlet
streams, heat transfer and work interactions (Herold et al.,
1996; Kotas, 1995) (see Fig. 1). This is accomplished via the
following equations:
kQ
( )j IN kjm ∈
kW
( )j OUT kjm ∈
Unit k
Fig. 1 – A generic unit of the absorption cycle.
Xj˛INðkÞ
mjzi;j �X
j˛OUTðkÞmjzi;j ¼ 0 ck; i (1)
Eq. (1) represents the mass balances, and states that the total
amount of component i that enters unit k must equal the
total amount of i that leaves k. In this equation, mj denotes
the mass flow rate of stream j, and zi, j is the mass fraction of
component i in stream j. Note that j can be either an inlet
or outlet stream. Hence, in this equation IN(k) denotes the set
of inlet streams of unit k, whereas OUT(k) represents the set
of outlet streams.
Xj˛INðkÞ
mjhj �X
j˛OUTðkÞmjhj þ Qk �Wk ¼ 0 ck (2)
Eq. (2) defines the energy balance in the system assuming no
heat losses. Note that the heat transfer rate and mechanical
power terms in Eq. (2) can take a zero value in some of the
units.
The exergy destruction (Ik) results from the exergy balance
given by Eq. (3), where ej denotes the specific exergy of stream j.
T0 is the environment temperature and Tj the tempera-
tures at which the heat is transferred.
Xj˛INðkÞ
mjej�X
j˛OUTðkÞmjejþ
Xj˛INðkÞ
�1�T0
Tj
�Qk�Wk�Ik¼0 ck (3)
The coefficient of performance (COP) is determined via Eq. (4)
as the ratio between the energy extracted from the chilled
water and the total energy supplied to the system (Herold
et al., 1996).
COP ¼ Qk¼E
Qk¼D þWk¼P(4)
The heat exchangers are modeled using the logarithmic mean
temperature difference (DTklm), the heat transfer area (Ak) and
the overall heat transfer coefficient (Uk), as shown in Eq. (5).
Qk ¼ UkAkDTklm ck (5)
3.2. Structural method
The thermoeconomic analysis combines the thermodynamic
analysis by first and second law with economics. Initially, the
second law analysis is used in order to determine the exergy
destruction in the units and the whole system. In continua-
tion a sensitivity analysis shows how a change of the effi-
ciency of 1 unit changes its exergy destruction and affects
the exergy destruction of the whole system. In the case of
a heat exchanger, the area is varied. This analysis enables us
to evaluate the effect of an improvement of this unit on the
global performance. The effect can be quantified by the
so-called coefficients of structural bonds (CSB). The CSB of
a unit k, which is obtained by variation of a parameter xi is
defined by
CSBk;i ¼�
dIt
dIk
�xi¼var
(6)
Ik is the exergy destruction rate of unit k, It is the exergy
destruction rate of the whole system. The parameter xi is
related to the efficiency of the units. The parameter xi can be
the minimum temperature difference, the effectiveness or
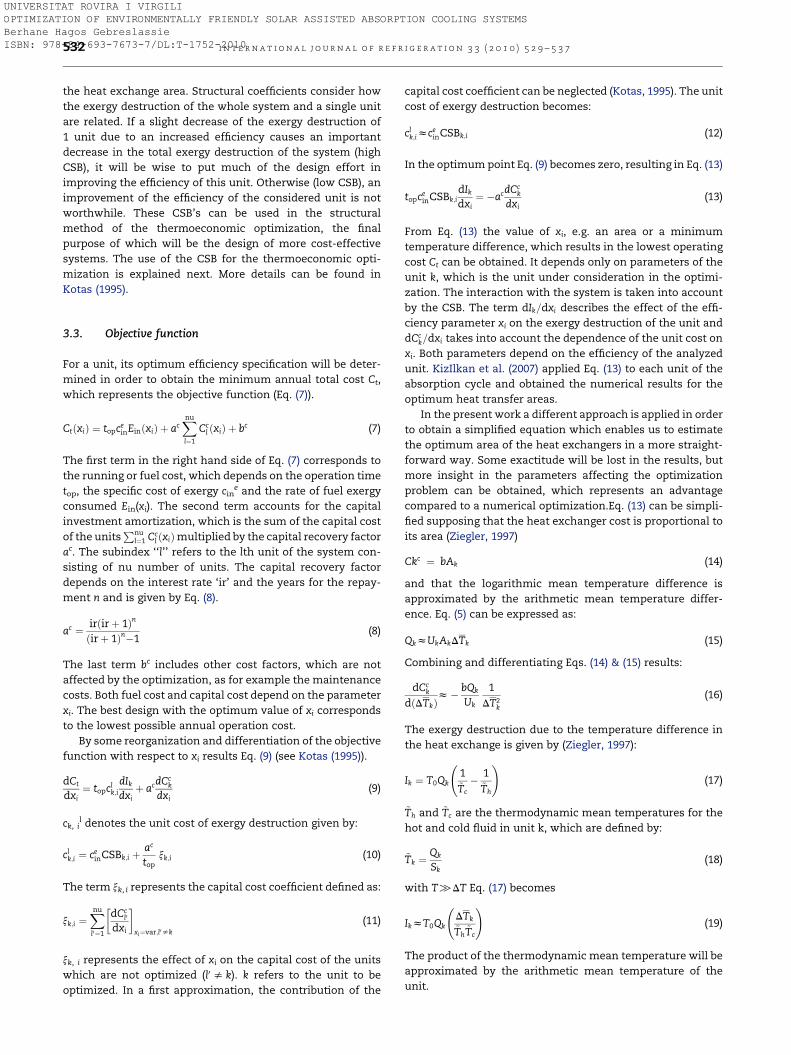
i n t e r n a t i o n a l j o u r n a l o f r e f r i g e r a t i o n 3 3 ( 2 0 1 0 ) 5 2 9 – 5 3 7532
UNIVERSITAT ROVIRA I VIRGILI OPTIMIZATION OF ENVIRONMENTALLY FRIENDLY SOLAR ASSISTED ABSORPTION COOLING SYSTEMS Berhane Hagos Gebreslassie ISBN: 978-84-693-7673-7/DL:T-1752-2010
the heat exchange area. Structural coefficients consider how
the exergy destruction of the whole system and a single unit
are related. If a slight decrease of the exergy destruction of
1 unit due to an increased efficiency causes an important
decrease in the total exergy destruction of the system (high
CSB), it will be wise to put much of the design effort in
improving the efficiency of this unit. Otherwise (low CSB), an
improvement of the efficiency of the considered unit is not
worthwhile. These CSB’s can be used in the structural
method of the thermoeconomic optimization, the final
purpose of which will be the design of more cost-effective
systems. The use of the CSB for the thermoeconomic opti-
mization is explained next. More details can be found in
Kotas (1995).
3.3. Objective function
For a unit, its optimum efficiency specification will be deter-
mined in order to obtain the minimum annual total cost Ct,
which represents the objective function (Eq. (7)).
CtðxiÞ ¼ topceinEinðxiÞ þ ac
Xnu
l¼1
Ccl ðxiÞ þ bc (7)
The first term in the right hand side of Eq. (7) corresponds to
the running or fuel cost, which depends on the operation time
top, the specific cost of exergy cine and the rate of fuel exergy
consumed Ein(xi). The second term accounts for the capital
investment amortization, which is the sum of the capital cost
of the unitsPnu
l¼1 Ccl ðxiÞmultiplied by the capital recovery factor
ac. The subindex ‘‘l’’ refers to the lth unit of the system con-
sisting of nu number of units. The capital recovery factor
depends on the interest rate ‘ir’ and the years for the repay-
ment n and is given by Eq. (8).
ac ¼ irðirþ 1Þn
ðirþ 1Þn�1(8)
The last term bc includes other cost factors, which are not
affected by the optimization, as for example the maintenance
costs. Both fuel cost and capital cost depend on the parameter
xi. The best design with the optimum value of xi corresponds
to the lowest possible annual operation cost.
By some reorganization and differentiation of the objective
function with respect to xi results Eq. (9) (see Kotas (1995)).
dCt
dxi¼ topcl
k;i
dIk
dxiþ acdCc
k
dxi(9)
ck, il denotes the unit cost of exergy destruction given by:
clk;i ¼ ce
inCSBk;i þac
topxk;i (10)
The term xk, i represents the capital cost coefficient defined as:
xk;i ¼Xnu
l0¼1
�dCc
l0
dxi
�xi¼var;l0sk
(11)
xk, i represents the effect of xi on the capital cost of the units
which are not optimized (l0 s k). k refers to the unit to be
optimized. In a first approximation, the contribution of the
capital cost coefficient can be neglected (Kotas, 1995). The unit
cost of exergy destruction becomes:
clk;izce
inCSBk;i (12)
In the optimum point Eq. (9) becomes zero, resulting in Eq. (13)
topceinCSBk;i
dIk
dxi¼ �acdCc
k
dxi(13)
From Eq. (13) the value of xi, e.g. an area or a minimum
temperature difference, which results in the lowest operating
cost Ct can be obtained. It depends only on parameters of the
unit k, which is the unit under consideration in the optimi-
zation. The interaction with the system is taken into account
by the CSB. The term dIk=dxi describes the effect of the effi-
ciency parameter xi on the exergy destruction of the unit and
dCck=dxi takes into account the dependence of the unit cost on
xi. Both parameters depend on the efficiency of the analyzed
unit. KizIlkan et al. (2007) applied Eq. (13) to each unit of the
absorption cycle and obtained the numerical results for the
optimum heat transfer areas.
In the present work a different approach is applied in order
to obtain a simplified equation which enables us to estimate
the optimum area of the heat exchangers in a more straight-
forward way. Some exactitude will be lost in the results, but
more insight in the parameters affecting the optimization
problem can be obtained, which represents an advantage
compared to a numerical optimization.Eq. (13) can be simpli-
fied supposing that the heat exchanger cost is proportional to
its area (Ziegler, 1997)
Ckc ¼ bAk (14)
and that the logarithmic mean temperature difference is
approximated by the arithmetic mean temperature differ-
ence. Eq. (5) can be expressed as:
QkzUkAkDTk (15)
Combining and differentiating Eqs. (14) & (15) results:
dCck
dðDTkÞz� bQk
Uk
1
DT2k
(16)
The exergy destruction due to the temperature difference in
the heat exchange is given by (Ziegler, 1997):
Ik ¼ T0Qk
1~Tc
� 1~Th
!(17)
~Th and ~Tc are the thermodynamic mean temperatures for the
hot and cold fluid in unit k, which are defined by:
~Tk ¼Qk
Sk(18)
with T[DT Eq. (17) becomes
IkzT0Qk
DTk
~Th~Tc
!(19)
The product of the thermodynamic mean temperature will be
approximated by the arithmetic mean temperature of the
unit.

i n t e r n a t i o n a l j o u r n a l o f r e f r i g e r a t i o n 3 3 ( 2 0 1 0 ) 5 2 9 – 5 3 7 533
UNIVERSITAT ROVIRA I VIRGILI OPTIMIZATION OF ENVIRONMENTALLY FRIENDLY SOLAR ASSISTED ABSORPTION COOLING SYSTEMS Berhane Hagos Gebreslassie ISBN: 978-84-693-7673-7/DL:T-1752-2010
~Th~TczT2
k (20)
where
Tk ¼TIN
h þ TINc
2(21)
leading to
dIk
dðDTkÞz
T0Qk
T2k
(22)
Substituting Eqs. (16) & (22) in Eq. (13) results in Eq. (23).
DTk;optz
ffiffiffiffiffiffiffiffiffiffiffiffiffiffiffiffiffiffiffiffiffiffiffiffiffiffiffiffiffiffiffiffiffiffiffiffiacb
topceinCSBk;iUk
T2k
T0
s(23)
This equation estimates the arithmetic mean temperature
difference for the heat exchanger k, which results in the
lowest operation cost. Note that units for temperatures are in
Kelvin. The value of the optimum temperature difference
increases with capital cost (capital recovery factor, specific
cost of the heat exchanger) and with the mean temperature of
the unit as the entropy flow and thus the exergy destruction
for the same heat flow is higher at lower temperatures. It
decreases with higher operation time, cost of energy, CSB and
heat transfer coefficient. The corresponding heat exchanger
area can then be obtained with Eq. (15).
Ak;optzQk
ffiffiffiffiffiffiffiffiffiffiffiffiffiffiffiffiffiffiffiffiffiffiffiffiffiffiffiffiffiffiffitopce
inCSBk;i
acbUk
T0
T2k
s(24)
Eqs. (23) and (24) can be used once the CSB’s have been
determined from an exergy analysis. The influence of the
overall heat transfer coefficient and specific heat exchanger
cost is the same as commented by Ziegler (Ziegler, 1998):
‘‘Specific cost and heat transfer coefficient are taken into
account with the square root. Large driving temperature
differences are required for expensive surfaces or bad transfer
coefficients. However the driving temperature difference
should be somewhat larger in the exchanger at high temper-
atures.’’ The most significant difference results from the
consideration of the interactions between units and cycle by
Fig. 2 – Schematics of an ammonia-water absorption
chiller.
the coefficient of structural bonds. This becomes especially
important for large values of the CSB.
4. Case study: ammonia–water absorptionchiller
The capabilities and limits of our approach are illustrated
through a case study that addresses the design of an absorp-
tion chiller (see Fig. 2). The system is an absorption chiller
driven by low grade heat optimized to be used with compound
parabolic concentrator solar collectors (Mendes and Collares-
Pereira, 1999). The chiller was built and tested at the Instituto
Superior Tecnico of the Technical University of Lisbon. It uses
ammonia–water as working pair, is indirectly cooled by air (dry
cooling tower) and has a nominal cooling capacity of 5 kW.
4.1. System description
Compared to a compression cooling cycle, the basic idea of an
absorption cycle is to replace the electricity consumption
associated with the vapor compression by a thermally driven
absorption–desorption system (Herold et al., 1996). This is
accomplished by making use of absorption and desorption
processes that employs suitable working fluid pairs. The
working pair consists of a refrigerant and an absorbent. In this
study, without loss of generality, an ammonia-water solution
is used as working pair, ammonia being the refrigerant and
water the absorbent.
Fig. 2 represents the considered absorption chiller in
a pressure–temperature plot. The system provides chilled
water for cooling applications and is driven by hot pressurized
water at 110 �C. The basic units are the absorber (A), condenser
(C), desorber (D) and evaporator (E). The cycle also includes the
refrigerant subcooler (SC), refrigerant expansion valve (RV),
solution heat exchanger (SHX), solution pump (P), and solu-
tion expansion valve (SV). The high pressure equipments are
the solution heat exchanger, desorber, and condenser,
whereas the low pressure ones are the evaporator and
absorber.
The system operation is as follows. The refrigerant in vapor
phase (stream 14) coming from the subcooler (SC) is absorbed
in absorber (A) by the diluted liquid solution (stream 6). The
concentrated solution (stream 1) leaving the absorber is
pumped by pump (P) to reach a higher pressure (stream 2)
before being preheated in the solution heat exchanger (SHX).
Then, the solution (stream 3) enters the desorber, in which the
desorption of ammonia takes place. Only the stripping of the
distillation section was used in this chiller (Mendes et al.,
2007). Since the evaporation temperature is above 0 �C, the
enrichment process of ammonia in the rectification column
does not bring significant performance improvement (Fer-
nandez-Seara and Sieres, 2006), which was experimentally
verified by Roriz and Mortal (2003). Vapor refrigerant (stream 9)
from the desorber condenses completely in the condenser (C).
The liquid refrigerant (stream 10) from the condenser is then
subcooled (stream 11) in the subcooler (SC) by the super-
heating stream (stream 13) that comes from the evaporator (E).
The liquid refrigerant (stream 11) flows to the evaporator (E)
through the refrigerant expansion valve (RV). The weak liquid
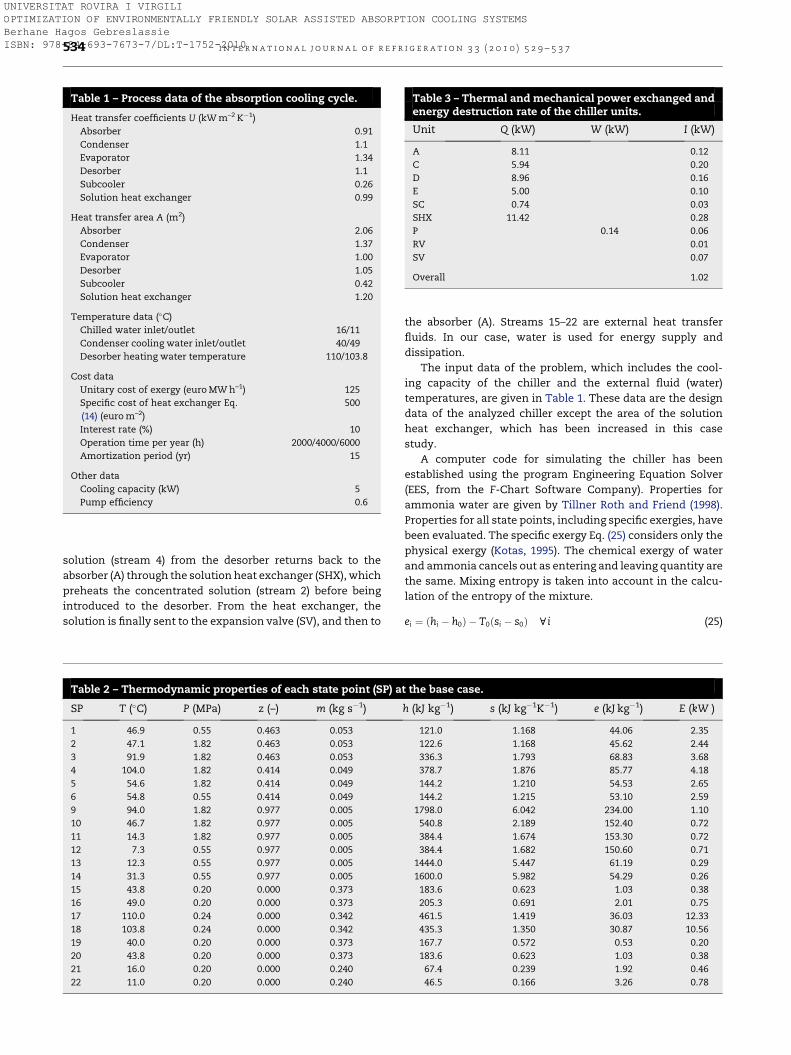
Table 1 – Process data of the absorption cooling cycle.
Heat transfer coefficients U (kW m–2 K�1)
Absorber 0.91
Condenser 1.1
Evaporator 1.34
Desorber 1.1
Subcooler 0.26
Solution heat exchanger 0.99
Heat transfer area A (m2)
Absorber 2.06
Condenser 1.37
Evaporator 1.00
Desorber 1.05
Subcooler 0.42
Solution heat exchanger 1.20
Temperature data (�C)
Chilled water inlet/outlet 16/11
Condenser cooling water inlet/outlet 40/49
Desorber heating water temperature 110/103.8
Cost data
Unitary cost of exergy (euro MW h–1) 125
Specific cost of heat exchanger Eq.
(14) (euro m–2)
500
Interest rate (%) 10
Operation time per year (h) 2000/4000/6000
Amortization period (yr) 15
Other data
Cooling capacity (kW) 5
Pump efficiency 0.6
Table 3 – Thermal and mechanical power exchanged andenergy destruction rate of the chiller units.
Unit Q (kW) W (kW) I (kW)
A 8.11 0.12
C 5.94 0.20
D 8.96 0.16
E 5.00 0.10
SC 0.74 0.03
SHX 11.42 0.28
P 0.14 0.06
RV 0.01
SV 0.07
Overall 1.02
i n t e r n a t i o n a l j o u r n a l o f r e f r i g e r a t i o n 3 3 ( 2 0 1 0 ) 5 2 9 – 5 3 7534
UNIVERSITAT ROVIRA I VIRGILI OPTIMIZATION OF ENVIRONMENTALLY FRIENDLY SOLAR ASSISTED ABSORPTION COOLING SYSTEMS Berhane Hagos Gebreslassie ISBN: 978-84-693-7673-7/DL:T-1752-2010
solution (stream 4) from the desorber returns back to the
absorber (A) through the solution heat exchanger (SHX), which
preheats the concentrated solution (stream 2) before being
introduced to the desorber. From the heat exchanger, the
solution is finally sent to the expansion valve (SV), and then to
Table 2 – Thermodynamic properties of each state point (SP) a
SP T (�C) P (MPa) z (–) m (kg s�1)
1 46.9 0.55 0.463 0.053
2 47.1 1.82 0.463 0.053
3 91.9 1.82 0.463 0.053
4 104.0 1.82 0.414 0.049
5 54.6 1.82 0.414 0.049
6 54.8 0.55 0.414 0.049
9 94.0 1.82 0.977 0.005
10 46.7 1.82 0.977 0.005
11 14.3 1.82 0.977 0.005
12 7.3 0.55 0.977 0.005
13 12.3 0.55 0.977 0.005
14 31.3 0.55 0.977 0.005
15 43.8 0.20 0.000 0.373
16 49.0 0.20 0.000 0.373
17 110.0 0.24 0.000 0.342
18 103.8 0.24 0.000 0.342
19 40.0 0.20 0.000 0.373
20 43.8 0.20 0.000 0.373
21 16.0 0.20 0.000 0.240
22 11.0 0.20 0.000 0.240
the absorber (A). Streams 15–22 are external heat transfer
fluids. In our case, water is used for energy supply and
dissipation.
The input data of the problem, which includes the cool-
ing capacity of the chiller and the external fluid (water)
temperatures, are given in Table 1. These data are the design
data of the analyzed chiller except the area of the solution
heat exchanger, which has been increased in this case
study.
A computer code for simulating the chiller has been
established using the program Engineering Equation Solver
(EES, from the F-Chart Software Company). Properties for
ammonia water are given by Tillner Roth and Friend (1998).
Properties for all state points, including specific exergies, have
been evaluated. The specific exergy Eq. (25) considers only the
physical exergy (Kotas, 1995). The chemical exergy of water
and ammonia cancels out as entering and leaving quantity are
the same. Mixing entropy is taken into account in the calcu-
lation of the entropy of the mixture.
ei ¼ ðhi � h0Þ � T0ðsi � s0Þ ci (25)
t the base case.
h (kJ kg�1) s (kJ kg�1K�1) e (kJ kg�1) E (kW )
121.0 1.168 44.06 2.35
122.6 1.168 45.62 2.44
336.3 1.793 68.83 3.68
378.7 1.876 85.77 4.18
144.2 1.210 54.53 2.65
144.2 1.215 53.10 2.59
1798.0 6.042 234.00 1.10
540.8 2.189 152.40 0.72
384.4 1.674 153.30 0.72
384.4 1.682 150.60 0.71
1444.0 5.447 61.19 0.29
1600.0 5.982 54.29 0.26
183.6 0.623 1.03 0.38
205.3 0.691 2.01 0.75
461.5 1.419 36.03 12.33
435.3 1.350 30.87 10.56
167.7 0.572 0.53 0.20
183.6 0.623 1.03 0.38
67.4 0.239 1.92 0.46
46.5 0.166 3.26 0.78
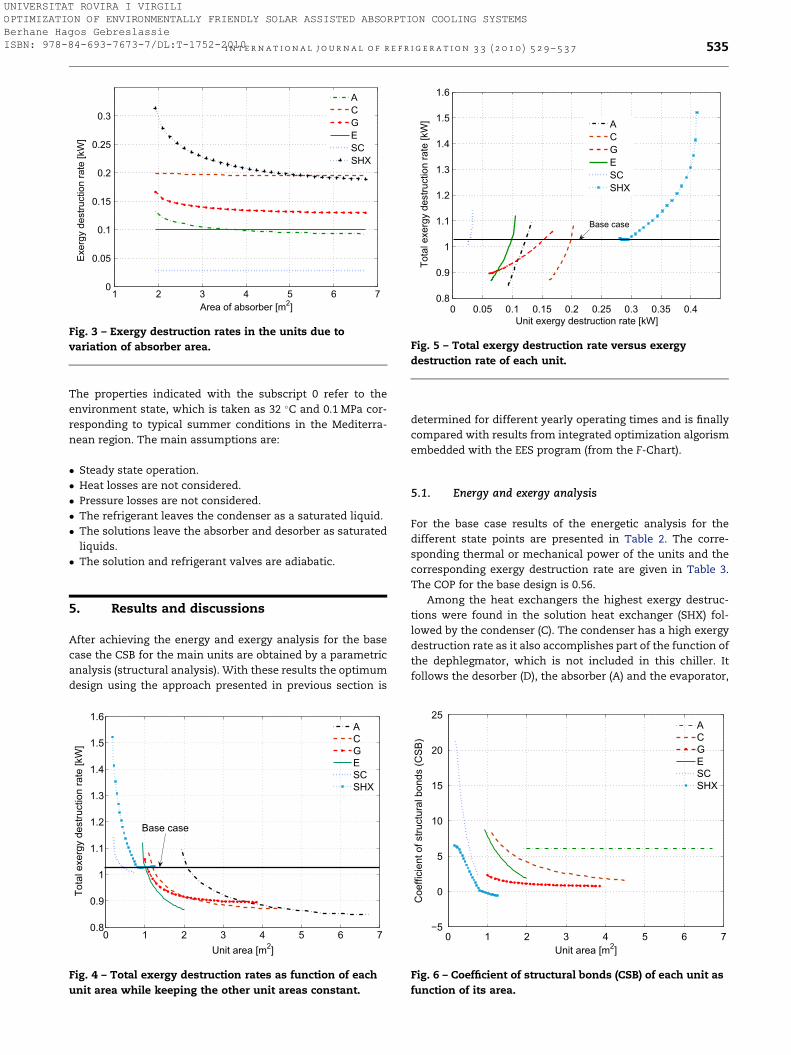
1 2 3 4 5 6 70
0.05
0.1
0.15
0.2
0.25
0.3
Area of absorber [m2]
Exer
gy d
estru
ctio
n ra
te [k
W]
ACGESCSHX
Fig. 3 – Exergy destruction rates in the units due to
variation of absorber area.
0 0.05 0.1 0.15 0.2 0.25 0.3 0.35 0.40.8
0.9
1
1.1
1.2
1.3
1.4
1.5
1.6
Unit exergy destruction rate [kW]
Tota
l exe
rgy
dest
ruct
ion
rate
[kW
] ACGESCSHX
Base case
Fig. 5 – Total exergy destruction rate versus exergy
destruction rate of each unit.
i n t e r n a t i o n a l j o u r n a l o f r e f r i g e r a t i o n 3 3 ( 2 0 1 0 ) 5 2 9 – 5 3 7 535
UNIVERSITAT ROVIRA I VIRGILI OPTIMIZATION OF ENVIRONMENTALLY FRIENDLY SOLAR ASSISTED ABSORPTION COOLING SYSTEMS Berhane Hagos Gebreslassie ISBN: 978-84-693-7673-7/DL:T-1752-2010
The properties indicated with the subscript 0 refer to the
environment state, which is taken as 32 �C and 0.1 MPa cor-
responding to typical summer conditions in the Mediterra-
nean region. The main assumptions are:
� Steady state operation.
� Heat losses are not considered.
� Pressure losses are not considered.
� The refrigerant leaves the condenser as a saturated liquid.
� The solutions leave the absorber and desorber as saturated
liquids.
� The solution and refrigerant valves are adiabatic.
5. Results and discussions
After achieving the energy and exergy analysis for the base
case the CSB for the main units are obtained by a parametric
analysis (structural analysis). With these results the optimum
design using the approach presented in previous section is
0 1 2 3 4 5 6 70.8
0.9
1
1.1
1.2
1.3
1.4
1.5
1.6
Unit area [m2]
Tota
l exe
rgy
dest
ruct
ion
rate
[kW
]
ACGESCSHX
Base case
Fig. 4 – Total exergy destruction rates as function of each
unit area while keeping the other unit areas constant.
determined for different yearly operating times and is finally
compared with results from integrated optimization algorism
embedded with the EES program (from the F-Chart).
5.1. Energy and exergy analysis
For the base case results of the energetic analysis for the
different state points are presented in Table 2. The corre-
sponding thermal or mechanical power of the units and the
corresponding exergy destruction rate are given in Table 3.
The COP for the base design is 0.56.
Among the heat exchangers the highest exergy destruc-
tions were found in the solution heat exchanger (SHX) fol-
lowed by the condenser (C). The condenser has a high exergy
destruction rate as it also accomplishes part of the function of
the dephlegmator, which is not included in this chiller. It
follows the desorber (D), the absorber (A) and the evaporator,
0 1 2 3 4 5 6 7−5
0
5
10
15
20
25
Unit area [m2]
Coe
ffici
ent o
f stru
ctur
al b
onds
(CSB
)
ACGESCSHX
Fig. 6 – Coefficient of structural bonds (CSB) of each unit as
function of its area.
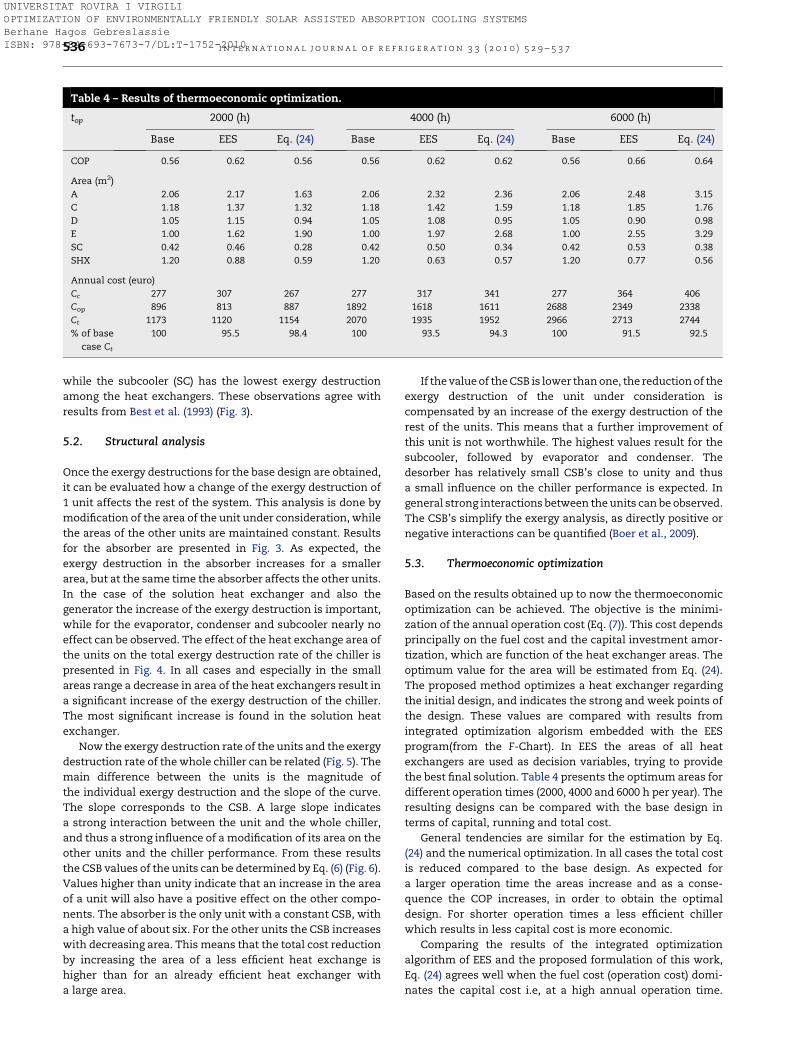
Table 4 – Results of thermoeconomic optimization.
top 2000 (h) 4000 (h) 6000 (h)
Base EES Eq. (24) Base EES Eq. (24) Base EES Eq. (24)
COP 0.56 0.62 0.56 0.56 0.62 0.62 0.56 0.66 0.64
Area (m2)
A 2.06 2.17 1.63 2.06 2.32 2.36 2.06 2.48 3.15
C 1.18 1.37 1.32 1.18 1.42 1.59 1.18 1.85 1.76
D 1.05 1.15 0.94 1.05 1.08 0.95 1.05 0.90 0.98
E 1.00 1.62 1.90 1.00 1.97 2.68 1.00 2.55 3.29
SC 0.42 0.46 0.28 0.42 0.50 0.34 0.42 0.53 0.38
SHX 1.20 0.88 0.59 1.20 0.63 0.57 1.20 0.77 0.56
Annual cost (euro)
Cc 277 307 267 277 317 341 277 364 406
Cop 896 813 887 1892 1618 1611 2688 2349 2338
Ct 1173 1120 1154 2070 1935 1952 2966 2713 2744
% of base
case Ct
100 95.5 98.4 100 93.5 94.3 100 91.5 92.5
i n t e r n a t i o n a l j o u r n a l o f r e f r i g e r a t i o n 3 3 ( 2 0 1 0 ) 5 2 9 – 5 3 7536
UNIVERSITAT ROVIRA I VIRGILI OPTIMIZATION OF ENVIRONMENTALLY FRIENDLY SOLAR ASSISTED ABSORPTION COOLING SYSTEMS Berhane Hagos Gebreslassie ISBN: 978-84-693-7673-7/DL:T-1752-2010
while the subcooler (SC) has the lowest exergy destruction
among the heat exchangers. These observations agree with
results from Best et al. (1993) (Fig. 3).
5.2. Structural analysis
Once the exergy destructions for the base design are obtained,
it can be evaluated how a change of the exergy destruction of
1 unit affects the rest of the system. This analysis is done by
modification of the area of the unit under consideration, while
the areas of the other units are maintained constant. Results
for the absorber are presented in Fig. 3. As expected, the
exergy destruction in the absorber increases for a smaller
area, but at the same time the absorber affects the other units.
In the case of the solution heat exchanger and also the
generator the increase of the exergy destruction is important,
while for the evaporator, condenser and subcooler nearly no
effect can be observed. The effect of the heat exchange area of
the units on the total exergy destruction rate of the chiller is
presented in Fig. 4. In all cases and especially in the small
areas range a decrease in area of the heat exchangers result in
a significant increase of the exergy destruction of the chiller.
The most significant increase is found in the solution heat
exchanger.
Now the exergy destruction rate of the units and the exergy
destruction rate of the whole chiller can be related (Fig. 5). The
main difference between the units is the magnitude of
the individual exergy destruction and the slope of the curve.
The slope corresponds to the CSB. A large slope indicates
a strong interaction between the unit and the whole chiller,
and thus a strong influence of a modification of its area on the
other units and the chiller performance. From these results
the CSB values of the units can be determined by Eq. (6) (Fig. 6).
Values higher than unity indicate that an increase in the area
of a unit will also have a positive effect on the other compo-
nents. The absorber is the only unit with a constant CSB, with
a high value of about six. For the other units the CSB increases
with decreasing area. This means that the total cost reduction
by increasing the area of a less efficient heat exchange is
higher than for an already efficient heat exchanger with
a large area.
If the value of the CSB is lower than one, the reduction of the
exergy destruction of the unit under consideration is
compensated by an increase of the exergy destruction of the
rest of the units. This means that a further improvement of
this unit is not worthwhile. The highest values result for the
subcooler, followed by evaporator and condenser. The
desorber has relatively small CSB’s close to unity and thus
a small influence on the chiller performance is expected. In
general strong interactions between the units can be observed.
The CSB’s simplify the exergy analysis, as directly positive or
negative interactions can be quantified (Boer et al., 2009).
5.3. Thermoeconomic optimization
Based on the results obtained up to now the thermoeconomic
optimization can be achieved. The objective is the minimi-
zation of the annual operation cost (Eq. (7)). This cost depends
principally on the fuel cost and the capital investment amor-
tization, which are function of the heat exchanger areas. The
optimum value for the area will be estimated from Eq. (24).
The proposed method optimizes a heat exchanger regarding
the initial design, and indicates the strong and week points of
the design. These values are compared with results from
integrated optimization algorism embedded with the EES
program(from the F-Chart). In EES the areas of all heat
exchangers are used as decision variables, trying to provide
the best final solution. Table 4 presents the optimum areas for
different operation times (2000, 4000 and 6000 h per year). The
resulting designs can be compared with the base design in
terms of capital, running and total cost.
General tendencies are similar for the estimation by Eq.
(24) and the numerical optimization. In all cases the total cost
is reduced compared to the base design. As expected for
a larger operation time the areas increase and as a conse-
quence the COP increases, in order to obtain the optimal
design. For shorter operation times a less efficient chiller
which results in less capital cost is more economic.
Comparing the results of the integrated optimization
algorithm of EES and the proposed formulation of this work,
Eq. (24) agrees well when the fuel cost (operation cost) domi-
nates the capital cost i.e, at a high annual operation time.
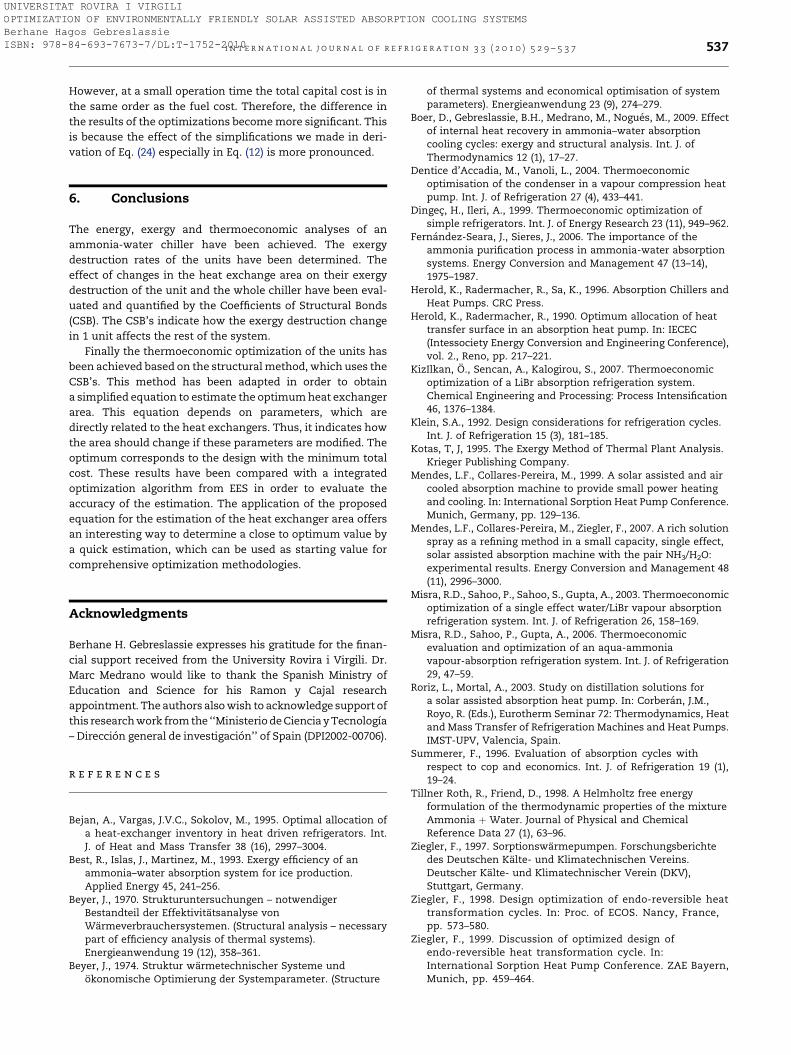
i n t e r n a t i o n a l j o u r n a l o f r e f r i g e r a t i o n 3 3 ( 2 0 1 0 ) 5 2 9 – 5 3 7 537
UNIVERSITAT ROVIRA I VIRGILI OPTIMIZATION OF ENVIRONMENTALLY FRIENDLY SOLAR ASSISTED ABSORPTION COOLING SYSTEMS Berhane Hagos Gebreslassie ISBN: 978-84-693-7673-7/DL:T-1752-2010
However, at a small operation time the total capital cost is in
the same order as the fuel cost. Therefore, the difference in
the results of the optimizations become more significant. This
is because the effect of the simplifications we made in deri-
vation of Eq. (24) especially in Eq. (12) is more pronounced.
6. Conclusions
The energy, exergy and thermoeconomic analyses of an
ammonia-water chiller have been achieved. The exergy
destruction rates of the units have been determined. The
effect of changes in the heat exchange area on their exergy
destruction of the unit and the whole chiller have been eval-
uated and quantified by the Coefficients of Structural Bonds
(CSB). The CSB’s indicate how the exergy destruction change
in 1 unit affects the rest of the system.
Finally the thermoeconomic optimization of the units has
been achieved based on the structural method, which uses the
CSB’s. This method has been adapted in order to obtain
a simplified equation to estimate the optimum heat exchanger
area. This equation depends on parameters, which are
directly related to the heat exchangers. Thus, it indicates how
the area should change if these parameters are modified. The
optimum corresponds to the design with the minimum total
cost. These results have been compared with a integrated
optimization algorithm from EES in order to evaluate the
accuracy of the estimation. The application of the proposed
equation for the estimation of the heat exchanger area offers
an interesting way to determine a close to optimum value by
a quick estimation, which can be used as starting value for
comprehensive optimization methodologies.
Acknowledgments
Berhane H. Gebreslassie expresses his gratitude for the finan-
cial support received from the University Rovira i Virgili. Dr.
Marc Medrano would like to thank the Spanish Ministry of
Education and Science for his Ramon y Cajal research
appointment. The authors also wish to acknowledge support of
this research work from the ‘‘Ministerio de Ciencia y Tecnologıa
– Direccion general de investigacion’’ of Spain (DPI2002-00706).
r e f e r e n c e s
Bejan, A., Vargas, J.V.C., Sokolov, M., 1995. Optimal allocation ofa heat-exchanger inventory in heat driven refrigerators. Int.J. of Heat and Mass Transfer 38 (16), 2997–3004.
Best, R., Islas, J., Martinez, M., 1993. Exergy efficiency of anammonia–water absorption system for ice production.Applied Energy 45, 241–256.
Beyer, J., 1970. Strukturuntersuchungen – notwendigerBestandteil der Effektivitatsanalyse vonWarmeverbrauchersystemen. (Structural analysis – necessarypart of efficiency analysis of thermal systems).Energieanwendung 19 (12), 358–361.
Beyer, J., 1974. Struktur warmetechnischer Systeme undokonomische Optimierung der Systemparameter. (Structure
of thermal systems and economical optimisation of systemparameters). Energieanwendung 23 (9), 274–279.
Boer, D., Gebreslassie, B.H., Medrano, M., Nogues, M., 2009. Effectof internal heat recovery in ammonia–water absorptioncooling cycles: exergy and structural analysis. Int. J. ofThermodynamics 12 (1), 17–27.
Dentice d’Accadia, M., Vanoli, L., 2004. Thermoeconomicoptimisation of the condenser in a vapour compression heatpump. Int. J. of Refrigeration 27 (4), 433–441.
Dingec, H., Ileri, A., 1999. Thermoeconomic optimization ofsimple refrigerators. Int. J. of Energy Research 23 (11), 949–962.
Fernandez-Seara, J., Sieres, J., 2006. The importance of theammonia purification process in ammonia-water absorptionsystems. Energy Conversion and Management 47 (13–14),1975–1987.
Herold, K., Radermacher, R., Sa, K., 1996. Absorption Chillers andHeat Pumps. CRC Press.
Herold, K., Radermacher, R., 1990. Optimum allocation of heattransfer surface in an absorption heat pump. In: IECEC(Intessociety Energy Conversion and Engineering Conference),vol. 2., Reno, pp. 217–221.
KizIlkan, O., Sencan, A., Kalogirou, S., 2007. Thermoeconomicoptimization of a LiBr absorption refrigeration system.Chemical Engineering and Processing: Process Intensification46, 1376–1384.
Klein, S.A., 1992. Design considerations for refrigeration cycles.Int. J. of Refrigeration 15 (3), 181–185.
Kotas, T, J, 1995. The Exergy Method of Thermal Plant Analysis.Krieger Publishing Company.
Mendes, L.F., Collares-Pereira, M., 1999. A solar assisted and aircooled absorption machine to provide small power heatingand cooling. In: International Sorption Heat Pump Conference.Munich, Germany, pp. 129–136.
Mendes, L.F., Collares-Pereira, M., Ziegler, F., 2007. A rich solutionspray as a refining method in a small capacity, single effect,solar assisted absorption machine with the pair NH3/H2O:experimental results. Energy Conversion and Management 48(11), 2996–3000.
Misra, R.D., Sahoo, P., Sahoo, S., Gupta, A., 2003. Thermoeconomicoptimization of a single effect water/LiBr vapour absorptionrefrigeration system. Int. J. of Refrigeration 26, 158–169.
Misra, R.D., Sahoo, P., Gupta, A., 2006. Thermoeconomicevaluation and optimization of an aqua-ammoniavapour-absorption refrigeration system. Int. J. of Refrigeration29, 47–59.
Roriz, L., Mortal, A., 2003. Study on distillation solutions fora solar assisted absorption heat pump. In: Corberan, J.M.,Royo, R. (Eds.), Eurotherm Seminar 72: Thermodynamics, Heatand Mass Transfer of Refrigeration Machines and Heat Pumps.IMST-UPV, Valencia, Spain.
Summerer, F., 1996. Evaluation of absorption cycles withrespect to cop and economics. Int. J. of Refrigeration 19 (1),19–24.
Tillner Roth, R., Friend, D., 1998. A Helmholtz free energyformulation of the thermodynamic properties of the mixtureAmmonia þ Water. Journal of Physical and ChemicalReference Data 27 (1), 63–96.
Ziegler, F., 1997. Sorptionswarmepumpen. Forschungsberichtedes Deutschen Kalte- und Klimatechnischen Vereins.Deutscher Kalte- und Klimatechnischer Verein (DKV),Stuttgart, Germany.
Ziegler, F., 1998. Design optimization of endo-reversible heattransformation cycles. In: Proc. of ECOS. Nancy, France,pp. 573–580.
Ziegler, F., 1999. Discussion of optimized design ofendo-reversible heat transformation cycle. In:International Sorption Heat Pump Conference. ZAE Bayern,Munich, pp. 459–464.
Applied Energy 86 (2009) 1712–1722
UNIVERSITAT ROVIRA I VIRGILI OPTIMIZATION OF ENVIRONMENTALLY FRIENDLY SOLAR ASSISTED ABSORPTION COOLING SYSTEMS Berhane Hagos Gebreslassie ISBN: 978-84-693-7673-7/DL:T-1752-2010
Contents lists available at ScienceDirect
Applied Energy
journal homepage: www.elsevier .com/ locate/apenergy
Design of environmentally conscious absorption cooling systemsvia multi-objective optimization and life cycle assessment
Berhane H. Gebreslassie a, Gonzalo Guillén-Gosálbez b, Laureano Jiménez b, Dieter Boer a,*
a Department of Mechanical Engineering, University Rovira i Virgili, Av. Països Catalans, 26, 43007 Tarragona, Spainb Department of Chemical Engineering, University Rovira i Virgili, Av. Països Catalans, 26, 43007 Tarragona, Spain
a r t i c l e i n f o
Article history:Received 20 August 2008Received in revised form 14 November 2008Accepted 16 November 2008Available online 25 December 2008
Keywords:Absorption refrigerationMulti-objective optimizationLife cycle assessment (LCA)Ammonia–waterCost analysis
0306-2619/$ - see front matter � 2008 Elsevier Ltd. Adoi:10.1016/j.apenergy.2008.11.019
* Corresponding author. Tel.: +34 977559631.E-mail address: [email protected] (D. Boer).
a b s t r a c t
In this paper, a systematic method based on mathematical programming is proposed for the design ofenvironmentally conscious absorption cooling systems. The approach presented relies on the develop-ment of a multi-objective formulation that simultaneously accounts for the minimization of cost andenvironmental impact at the design stage. The latter criterion is measured by the Eco-indicator 99 meth-odology, which follows the principles of life cycle assessment (LCA). The design task is formulated as a bi-criteria nonlinear programming (NLP) problem, the solution of which is defined by a set of Pareto pointsthat represent the optimal trade-off between the economic and environmental concerns considered inthe analysis. These Pareto solutions can be obtained via standard techniques for multi-objective optimi-zation. The main advantage of this approach is that it offers a set of alternative options for system designrather than a single solution. From these alternatives, the decision-maker can choose the best one accord-ing to his/her preferences and the applicable legislation. The capabilities of the proposed method areillustrated in a case study problem that addresses the design of a typical absorption cooling system.
� 2008 Elsevier Ltd. All rights reserved.
1. Introduction
During the last decade, there has been a growing awareness ofthe importance of incorporating environmental concerns alongwith traditional economic criteria in the optimization of industrialprocess. This trend has been motivated by several issues, a majorone being the stringent legislation that aims to mitigate importantenvironmental problems such as the ozone layer depletion andglobal warming. In this challenging scenario, absorption refrigera-tion is gaining popularity in the air conditioning system, as it usesrefrigerants with almost zero global warming potential and do notcontribute to the ozone layer depletion [1–3]. The main differencebetween an absorption refrigeration system and the conventionalcompression system is that the former uses heat sources as energyinput in order to produce cooling, while the compression systemrequires mechanical energy for its operation. The heat sourcesmay be fossil fuel, renewable energy resources or waste heatrecovered from other thermal systems. Moreover, these systemshave also other advantages, such as high reliability, low maintain-ability and a silent and vibration free operation. Another importantmerit of these systems is the elimination of CFC’s and HCFC’s asrefrigerants [4].
Unfortunately, absorption cycles require higher number of unitsto accommodate the absorption and desorption processes. This
ll rights reserved.
leads to higher capital costs than those associated with conven-tional cooling systems (i.e., vapor compression system). Hence,optimization strategies based on both, thermodynamic and eco-nomic insights are needed to improve their operational and eco-nomic performance so that they can be competitive in themarket. Specifically, the preferred method for optimizing thesesystems has been the thermoeconomic optimization [5–8], whichmerges exergy and economic analysis within a single framework.This approach is based on an iterative procedure that relies onboth, a thermodynamic model and a cost model [5,8].
An alternative strategy that has been applied to the optimiza-tion of similar industrial process is the simultaneous approach,which relies on systematic optimization methods based on mathe-matical programming. In this second approach, the design task isposed as an optimization problem, which is solved by standardtechniques for linear, nonlinear, mixed integer linear and mixedinteger nonlinear (LP, NLP, MILP, MINLP, respectively) problems.These methods have been extensively used in the optimization ofchemical processes [9–14]. However, their application to the de-sign of absorption cycles has been rather limited.
Most of the strategies that address the design of absorption cy-cles focus on reducing the exergy destroyed within the cycle in or-der to improve the energetic efficiency [5,6,8,15]. Although theseapproaches may lead to a reduction in the energy consumption,and hence to a decrease in the associated environmental impact,they have the disadvantage of neglecting the damage caused inother stages in the life cycle of the absorption system, such as
Nomenclature
A absorberC condenserD desorberE evaporatorLCA life cycle assessmentP solution pumpRV refrigerant expansion valveSC subcoolerSHX solution heat exchangerSV solution expansion valveyr year
Indicesb chemicald damage categoryi component of a streamj streamsk unitr impact category
SetsRD(d) set of impact categories included in the damage cate-
gory dIN(k) set of input streams to unit kOUT(k) set of out put streams from unit k
Parametersc1 cost parameter (euro/m2)c2 cost parameter (euro)c3 cost parameter (euro/kW)cq unitary cost of steam (euro/MW h)ce unitary cost of electricity (euro/MW h)cr f capital recovery factor (–)dmbr coefficient of damage model associated with chemical b
and impact r (impact/kg)
ir interest rate (–)isb life cycle inventory entry per unit of steam generated
(kg/kg)ieb life cycle inventory entry per unit of electricity gener-
ated (kg/kW)nd normalization factor (Eco-indicator 99 points/impact)top operational hours (h/yr)Uk overall heat transfer co-efficient of unit k (kW/m2 K)wd weighting factor (–)
VariablesAk area of heat exchanger (km2)Cc total capital cost (euro/yr)Cexp cost of expansion valves (euro)Chxs cost of heat exchangers (euro)Cop total operational cost (euro/yr)Cp cost of pump (euro)COP coefficient of performance (–)DAMd damage in category d (impact)ECO99 Eco-indicator 99 (Eco-indicator 99 points)DTlm
k logarithmic mean temperature difference (�C or K)DTh
k temperature difference in the hot end (�C or K)DTc
k temperature difference in the cold end (�C or K)hj enthalpy of stream j (kJ/kg)IMPr damage in impact r (impact)LCIb life cycle inventory entry associated with chemical b
(kg)mj mass flow rate of stream j (kg/s)Pj pressure of stream j (bar)Qk heat transferred in unit k (kW)TC total cost (euro/yr)Tj temperature of stream j (�C or K)Wp mechanical power of pump (kW)xi;j mass fraction of component i in stream j (–)
B.H. Gebreslassie et al. / Applied Energy 86 (2009) 1712–1722 1713
UNIVERSITAT ROVIRA I VIRGILI OPTIMIZATION OF ENVIRONMENTALLY FRIENDLY SOLAR ASSISTED ABSORPTION COOLING SYSTEMS Berhane Hagos Gebreslassie ISBN: 978-84-693-7673-7/DL:T-1752-2010
the generation of those utilities consumed by the cycle. Thus, dueto their limited scope, these methods can lead to solutions that re-duce the impact locally instead of alternatives that mitigate theharmful effects over the entire life cycle of the process.
Life cycle analysis (LCA) arose in response to this situation. LCAis an objective process for evaluating the environmental loadsassociated with a product, process or activity [9,16]. During theapplication of LCA, the energy and materials used in a processare firstly identified and quantified along with the wastes releasedto the environment. This information is further translated in to aset of environmental impacts that can be aggregated into differentgroups. These impacts are finally used to assess diverse processalternatives that may be implemented to achieve environmentalimprovements. Today, LCA can be effectively used to restructureany industrial process in order to improve its environmental per-formance [9]. In energy scenarios, LCA has been traditionally usedas a tool to estimate the energy and environmental impacts relatedto products or services [16–19].
The application of LCA provides valuable insights into the de-sign problem. Unfortunately, LCA does not include a systematicway of generating process alternatives for environmental improve-ments. This limitation can be overcome by coupling LCA with opti-mization tools. In this framework, LCA is employed to assesstechnological solutions from an environmental perspective,whereas optimization tools seek in a systematic way the best onesaccording to the predefined criteria. Although the advantages ofsuch a combined strategy have been already acknowledged in
the literature, specifically in the area of process design [9–14], littleresearch has been conducted to date in this direction. Specifically,Azapagic and Clift [13,14] proposed the application of multi-objec-tive optimization as a tool for system improvements by integratingthe economic performance of mineral boron production and lifecycle assessment. Fu and Diwekar [20] used multi-objective opti-mization to simultaneously minimize the green house emissionsand the total cost. Guillén-Gosálbez et al. [9] have addressed theincorporation of environmental concerns in the structural optimi-zation of process flowsheets through the combined use of LCA andmulti-objective mixed integer nonlinear programming (MINLP)techniques.
To our knowledge, there is no work in the literature that simul-taneously considers the integration of LCA and process optimiza-tion to improve the economic and environmental performance ofabsorption cooling cycles. Hence, the aim of this work is to developa systematic approach for the design of environmentally consciousabsorption cooling cycles based on the combined use of LCA andmathematical programming. More precisely, in this work the de-sign task is formulated as a multi-objective nonlinear program-ming (NLP) problem that accounts for the minimization of thetotal annualized cost and environmental impact. The environmen-tal impact is determined according to the Eco-indicator 99 meth-odology [21], which includes eleven environmental impactcategories that are further aggregated into a single environmentalmetric [9,22]. The capabilities of our approach are illustratedthrough a case study. The obtained results show that significant
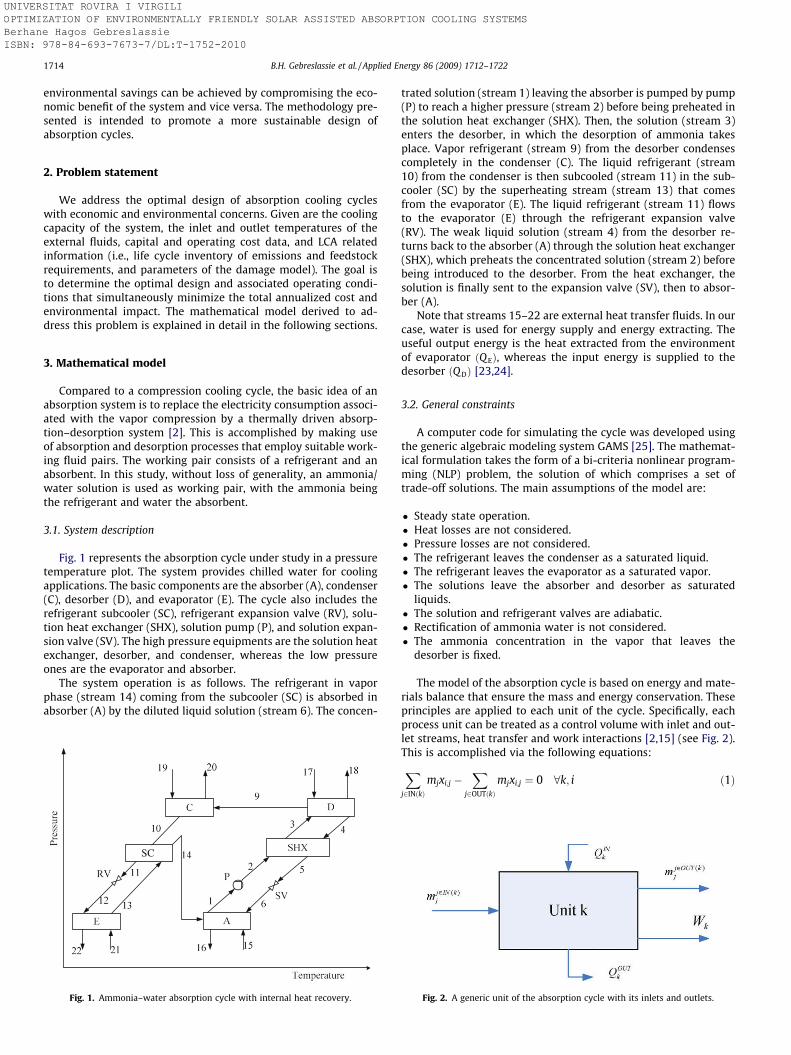
1714 B.H. Gebreslassie et al. / Applied Energy 86 (2009) 1712–1722
UNIVERSITAT ROVIRA I VIRGILI OPTIMIZATION OF ENVIRONMENTALLY FRIENDLY SOLAR ASSISTED ABSORPTION COOLING SYSTEMS Berhane Hagos Gebreslassie ISBN: 978-84-693-7673-7/DL:T-1752-2010
environmental savings can be achieved by compromising the eco-nomic benefit of the system and vice versa. The methodology pre-sented is intended to promote a more sustainable design ofabsorption cycles.
2. Problem statement
We address the optimal design of absorption cooling cycleswith economic and environmental concerns. Given are the coolingcapacity of the system, the inlet and outlet temperatures of theexternal fluids, capital and operating cost data, and LCA relatedinformation (i.e., life cycle inventory of emissions and feedstockrequirements, and parameters of the damage model). The goal isto determine the optimal design and associated operating condi-tions that simultaneously minimize the total annualized cost andenvironmental impact. The mathematical model derived to ad-dress this problem is explained in detail in the following sections.
3. Mathematical model
Compared to a compression cooling cycle, the basic idea of anabsorption system is to replace the electricity consumption associ-ated with the vapor compression by a thermally driven absorp-tion–desorption system [2]. This is accomplished by making useof absorption and desorption processes that employ suitable work-ing fluid pairs. The working pair consists of a refrigerant and anabsorbent. In this study, without loss of generality, an ammonia/water solution is used as working pair, with the ammonia beingthe refrigerant and water the absorbent.
3.1. System description
Fig. 1 represents the absorption cycle under study in a pressuretemperature plot. The system provides chilled water for coolingapplications. The basic components are the absorber (A), condenser(C), desorber (D), and evaporator (E). The cycle also includes therefrigerant subcooler (SC), refrigerant expansion valve (RV), solu-tion heat exchanger (SHX), solution pump (P), and solution expan-sion valve (SV). The high pressure equipments are the solution heatexchanger, desorber, and condenser, whereas the low pressureones are the evaporator and absorber.
The system operation is as follows. The refrigerant in vaporphase (stream 14) coming from the subcooler (SC) is absorbed inabsorber (A) by the diluted liquid solution (stream 6). The concen-
SC
Fig. 1. Ammonia–water absorption cycle with internal heat recovery.
trated solution (stream 1) leaving the absorber is pumped by pump(P) to reach a higher pressure (stream 2) before being preheated inthe solution heat exchanger (SHX). Then, the solution (stream 3)enters the desorber, in which the desorption of ammonia takesplace. Vapor refrigerant (stream 9) from the desorber condensescompletely in the condenser (C). The liquid refrigerant (stream10) from the condenser is then subcooled (stream 11) in the sub-cooler (SC) by the superheating stream (stream 13) that comesfrom the evaporator (E). The liquid refrigerant (stream 11) flowsto the evaporator (E) through the refrigerant expansion valve(RV). The weak liquid solution (stream 4) from the desorber re-turns back to the absorber (A) through the solution heat exchanger(SHX), which preheats the concentrated solution (stream 2) beforebeing introduced to the desorber. From the heat exchanger, thesolution is finally sent to the expansion valve (SV), then to absor-ber (A).
Note that streams 15–22 are external heat transfer fluids. In ourcase, water is used for energy supply and energy extracting. Theuseful output energy is the heat extracted from the environmentof evaporator ðQ EÞ, whereas the input energy is supplied to thedesorber ðQ DÞ [23,24].
3.2. General constraints
A computer code for simulating the cycle was developed usingthe generic algebraic modeling system GAMS [25]. The mathemat-ical formulation takes the form of a bi-criteria nonlinear program-ming (NLP) problem, the solution of which comprises a set oftrade-off solutions. The main assumptions of the model are:
� Steady state operation.� Heat losses are not considered.� Pressure losses are not considered.� The refrigerant leaves the condenser as a saturated liquid.� The refrigerant leaves the evaporator as a saturated vapor.� The solutions leave the absorber and desorber as saturated
liquids.� The solution and refrigerant valves are adiabatic.� Rectification of ammonia water is not considered.� The ammonia concentration in the vapor that leaves the
desorber is fixed.
The model of the absorption cycle is based on energy and mate-rials balance that ensure the mass and energy conservation. Theseprinciples are applied to each unit of the cycle. Specifically, eachprocess unit can be treated as a control volume with inlet and out-let streams, heat transfer and work interactions [2,15] (see Fig. 2).This is accomplished via the following equations:
Xj2INðkÞ
mjxi;j �X
j2OUTðkÞmjxi;j ¼ 0 8k; i ð1Þ
Fig. 2. A generic unit of the absorption cycle with its inlets and outlets.
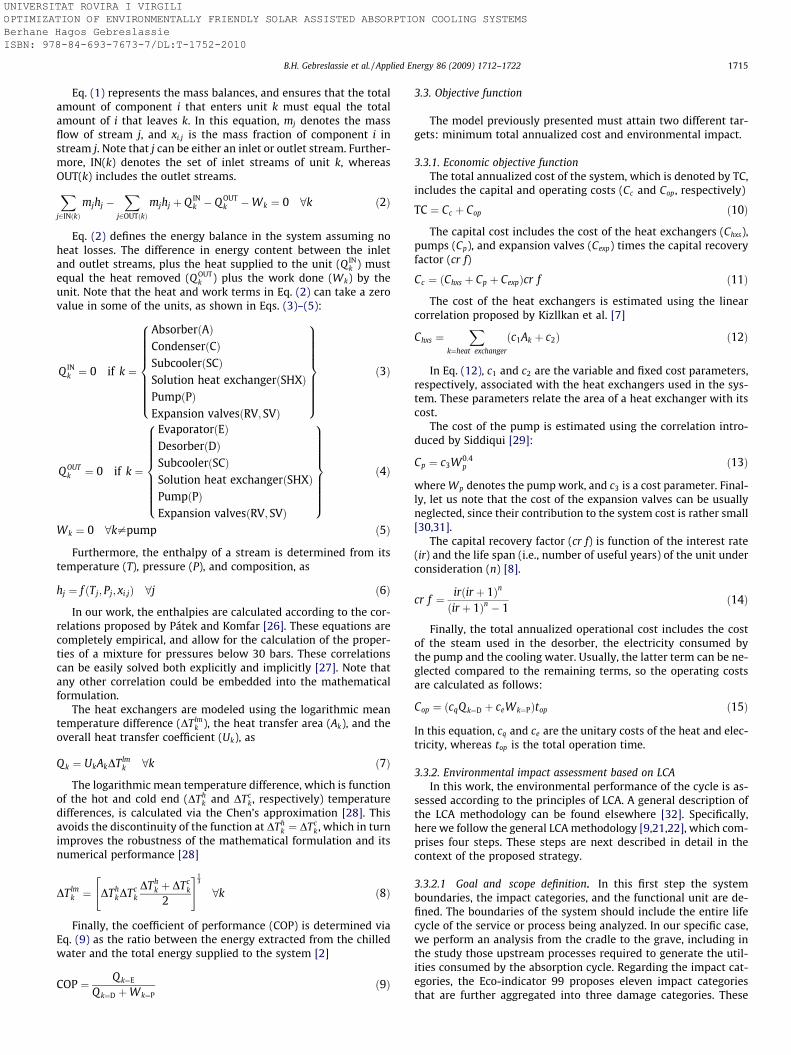
B.H. Gebreslassie et al. / Applied Energy 86 (2009) 1712–1722 1715
UNIVERSITAT ROVIRA I VIRGILI OPTIMIZATION OF ENVIRONMENTALLY FRIENDLY SOLAR ASSISTED ABSORPTION COOLING SYSTEMS Berhane Hagos Gebreslassie ISBN: 978-84-693-7673-7/DL:T-1752-2010
Eq. (1) represents the mass balances, and ensures that the totalamount of component i that enters unit k must equal the totalamount of i that leaves k. In this equation, mj denotes the massflow of stream j, and xi;j is the mass fraction of component i instream j. Note that j can be either an inlet or outlet stream. Further-more, IN(k) denotes the set of inlet streams of unit k, whereasOUT(k) includes the outlet streams.X
j2INðkÞmjhj �
Xj2OUTðkÞ
mjhj þ Q INk � QOUT
k �Wk ¼ 0 8k ð2Þ
Eq. (2) defines the energy balance in the system assuming noheat losses. The difference in energy content between the inletand outlet streams, plus the heat supplied to the unit (Q IN
k ) mustequal the heat removed (QOUT
k ) plus the work done (Wk) by theunit. Note that the heat and work terms in Eq. (2) can take a zerovalue in some of the units, as shown in Eqs. (3)–(5):
Q INk ¼ 0 if k ¼
AbsorberðAÞCondenserðCÞSubcoolerðSCÞSolution heat exchangerðSHXÞPumpðPÞExpansion valvesðRV; SVÞ
8>>>>>>>><>>>>>>>>:
9>>>>>>>>=>>>>>>>>;
ð3Þ
QOUTk ¼ 0 if k ¼
EvaporatorðEÞDesorberðDÞSubcoolerðSCÞSolution heat exchangerðSHXÞPumpðPÞExpansion valvesðRV; SVÞ
8>>>>>>>><>>>>>>>>:
9>>>>>>>>=>>>>>>>>;
ð4Þ
Wk ¼ 0 8k–pump ð5Þ
Furthermore, the enthalpy of a stream is determined from itstemperature (T), pressure (P), and composition, as
hj ¼ f ðTj; Pj; xi;jÞ 8j ð6Þ
In our work, the enthalpies are calculated according to the cor-relations proposed by Pátek and Komfar [26]. These equations arecompletely empirical, and allow for the calculation of the proper-ties of a mixture for pressures below 30 bars. These correlationscan be easily solved both explicitly and implicitly [27]. Note thatany other correlation could be embedded into the mathematicalformulation.
The heat exchangers are modeled using the logarithmic meantemperature difference (DTlm
k ), the heat transfer area (Ak), and theoverall heat transfer coefficient (Uk), as
Q k ¼ UkAkDTlmk 8k ð7Þ
The logarithmic mean temperature difference, which is functionof the hot and cold end (DTh
k and DTck, respectively) temperature
differences, is calculated via the Chen’s approximation [28]. Thisavoids the discontinuity of the function at DTh
k ¼ DTck, which in turn
improves the robustness of the mathematical formulation and itsnumerical performance [28]
DTlmk ¼ DTh
kDTckDTh
k þ DTck
2
" #13
8k ð8Þ
Finally, the coefficient of performance (COP) is determined viaEq. (9) as the ratio between the energy extracted from the chilledwater and the total energy supplied to the system [2]
COP ¼ Q k¼E
Q k¼D þWk¼Pð9Þ
3.3. Objective function
The model previously presented must attain two different tar-gets: minimum total annualized cost and environmental impact.
3.3.1. Economic objective functionThe total annualized cost of the system, which is denoted by TC,
includes the capital and operating costs (Cc and Cop, respectively)
TC ¼ Cc þ Cop ð10Þ
The capital cost includes the cost of the heat exchangers (Chxs),pumps (Cp), and expansion valves (Cexp) times the capital recoveryfactor (cr f)
Cc ¼ ðChxs þ Cp þ CexpÞcr f ð11Þ
The cost of the heat exchangers is estimated using the linearcorrelation proposed by Kizllkan et al. [7]
Chxs ¼X
k¼heat exchanger
ðc1Ak þ c2Þ ð12Þ
In Eq. (12), c1 and c2 are the variable and fixed cost parameters,respectively, associated with the heat exchangers used in the sys-tem. These parameters relate the area of a heat exchanger with itscost.
The cost of the pump is estimated using the correlation intro-duced by Siddiqui [29]:
Cp ¼ c3W0:4p ð13Þ
where Wp denotes the pump work, and c3 is a cost parameter. Final-ly, let us note that the cost of the expansion valves can be usuallyneglected, since their contribution to the system cost is rather small[30,31].
The capital recovery factor (cr f) is function of the interest rate(ir) and the life span (i.e., number of useful years) of the unit underconsideration (n) [8].
cr f ¼ irðir þ 1Þn
ðir þ 1Þn � 1ð14Þ
Finally, the total annualized operational cost includes the costof the steam used in the desorber, the electricity consumed bythe pump and the cooling water. Usually, the latter term can be ne-glected compared to the remaining terms, so the operating costsare calculated as follows:
Cop ¼ ðcqQ k¼D þ ceWk¼PÞtop ð15Þ
In this equation, cq and ce are the unitary costs of the heat and elec-tricity, whereas top is the total operation time.
3.3.2. Environmental impact assessment based on LCAIn this work, the environmental performance of the cycle is as-
sessed according to the principles of LCA. A general description ofthe LCA methodology can be found elsewhere [32]. Specifically,here we follow the general LCA methodology [9,21,22], which com-prises four steps. These steps are next described in detail in thecontext of the proposed strategy.
3.3.2.1 Goal and scope definition. In this first step the systemboundaries, the impact categories, and the functional unit are de-fined. The boundaries of the system should include the entire lifecycle of the service or process being analyzed. In our specific case,we perform an analysis from the cradle to the grave, including inthe study those upstream processes required to generate the util-ities consumed by the absorption cycle. Regarding the impact cat-egories, the Eco-indicator 99 proposes eleven impact categoriesthat are further aggregated into three damage categories. These
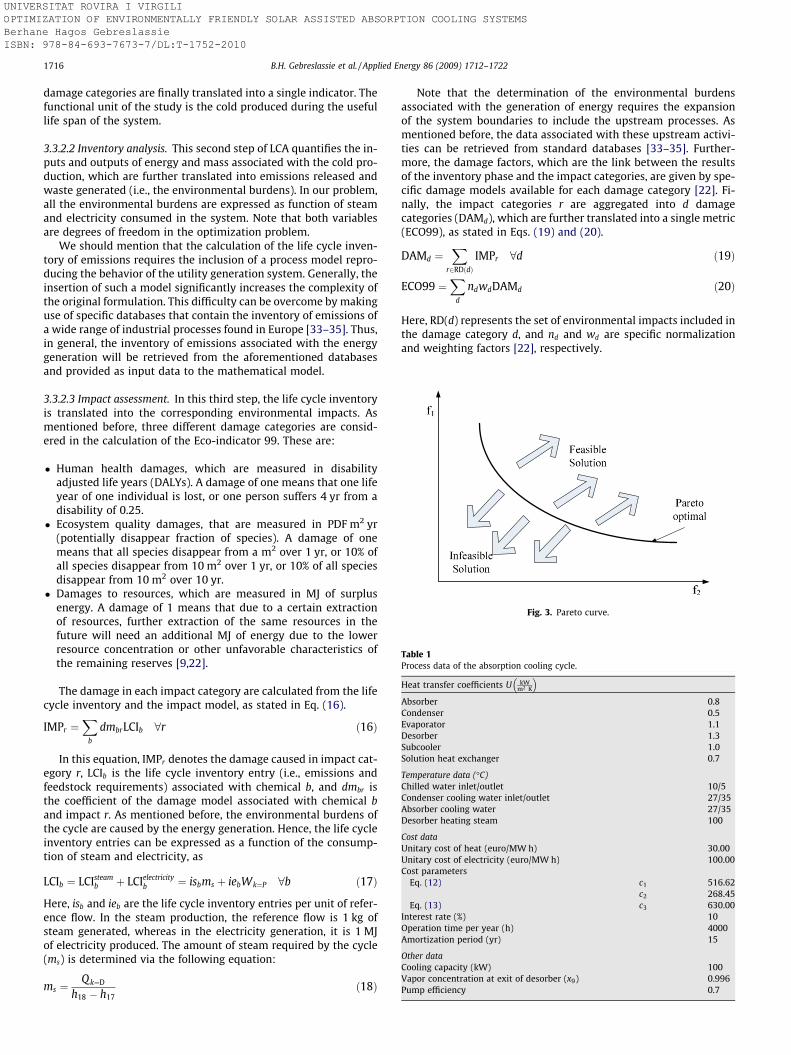
Fig. 3. Pareto curve.
Table 1Process data of the absorption cooling cycle.
Heat transfer coefficients U kWm2 K
� �
Absorber 0.8Condenser 0.5Evaporator 1.1Desorber 1.3Subcooler 1.0Solution heat exchanger 0.7
Temperature data (�C)Chilled water inlet/outlet 10/5Condenser cooling water inlet/outlet 27/35Absorber cooling water 27/35Desorber heating steam 100
Cost dataUnitary cost of heat (euro/MW h) 30.00Unitary cost of electricity (euro/MW h) 100.00Cost parameters
Eq. (12) c1 516.62c2 268.45
Eq. (13) c3 630.00Interest rate (%) 10Operation time per year (h) 4000Amortization period (yr) 15
Other dataCooling capacity (kW) 100Vapor concentration at exit of desorber (x9) 0.996Pump efficiency 0.7
1716 B.H. Gebreslassie et al. / Applied Energy 86 (2009) 1712–1722
UNIVERSITAT ROVIRA I VIRGILI OPTIMIZATION OF ENVIRONMENTALLY FRIENDLY SOLAR ASSISTED ABSORPTION COOLING SYSTEMS Berhane Hagos Gebreslassie ISBN: 978-84-693-7673-7/DL:T-1752-2010
damage categories are finally translated into a single indicator. Thefunctional unit of the study is the cold produced during the usefullife span of the system.
3.3.2.2 Inventory analysis. This second step of LCA quantifies the in-puts and outputs of energy and mass associated with the cold pro-duction, which are further translated into emissions released andwaste generated (i.e., the environmental burdens). In our problem,all the environmental burdens are expressed as function of steamand electricity consumed in the system. Note that both variablesare degrees of freedom in the optimization problem.
We should mention that the calculation of the life cycle inven-tory of emissions requires the inclusion of a process model repro-ducing the behavior of the utility generation system. Generally, theinsertion of such a model significantly increases the complexity ofthe original formulation. This difficulty can be overcome by makinguse of specific databases that contain the inventory of emissions ofa wide range of industrial processes found in Europe [33–35]. Thus,in general, the inventory of emissions associated with the energygeneration will be retrieved from the aforementioned databasesand provided as input data to the mathematical model.
3.3.2.3 Impact assessment. In this third step, the life cycle inventoryis translated into the corresponding environmental impacts. Asmentioned before, three different damage categories are consid-ered in the calculation of the Eco-indicator 99. These are:
� Human health damages, which are measured in disabilityadjusted life years (DALYs). A damage of one means that one lifeyear of one individual is lost, or one person suffers 4 yr from adisability of 0.25.
� Ecosystem quality damages, that are measured in PDF m2 yr(potentially disappear fraction of species). A damage of onemeans that all species disappear from a m2 over 1 yr, or 10% ofall species disappear from 10 m2 over 1 yr, or 10% of all speciesdisappear from 10 m2 over 10 yr.
� Damages to resources, which are measured in MJ of surplusenergy. A damage of 1 means that due to a certain extractionof resources, further extraction of the same resources in thefuture will need an additional MJ of energy due to the lowerresource concentration or other unfavorable characteristics ofthe remaining reserves [9,22].
The damage in each impact category are calculated from the lifecycle inventory and the impact model, as stated in Eq. (16).
IMPr ¼X
b
dmbrLCIb 8r ð16Þ
In this equation, IMPr denotes the damage caused in impact cat-egory r, LCIb is the life cycle inventory entry (i.e., emissions andfeedstock requirements) associated with chemical b, and dmbr isthe coefficient of the damage model associated with chemical band impact r. As mentioned before, the environmental burdens ofthe cycle are caused by the energy generation. Hence, the life cycleinventory entries can be expressed as a function of the consump-tion of steam and electricity, as
LCIb ¼ LCIsteamb þ LCIelectricity
b ¼ isbms þ iebWk¼P 8b ð17Þ
Here, isb and ieb are the life cycle inventory entries per unit of refer-ence flow. In the steam production, the reference flow is 1 kg ofsteam generated, whereas in the electricity generation, it is 1 MJof electricity produced. The amount of steam required by the cycle(ms) is determined via the following equation:
ms ¼Q k¼D
h18 � h17ð18Þ
Note that the determination of the environmental burdensassociated with the generation of energy requires the expansionof the system boundaries to include the upstream processes. Asmentioned before, the data associated with these upstream activi-ties can be retrieved from standard databases [33–35]. Further-more, the damage factors, which are the link between the resultsof the inventory phase and the impact categories, are given by spe-cific damage models available for each damage category [22]. Fi-nally, the impact categories r are aggregated into d damagecategories (DAMd), which are further translated into a single metric(ECO99), as stated in Eqs. (19) and (20).
DAMd ¼X
r2RDðdÞIMPr 8d ð19Þ
ECO99 ¼X
d
ndwdDAMd ð20Þ
Here, RD(d) represents the set of environmental impacts included inthe damage category d, and nd and wd are specific normalizationand weighting factors [22], respectively.
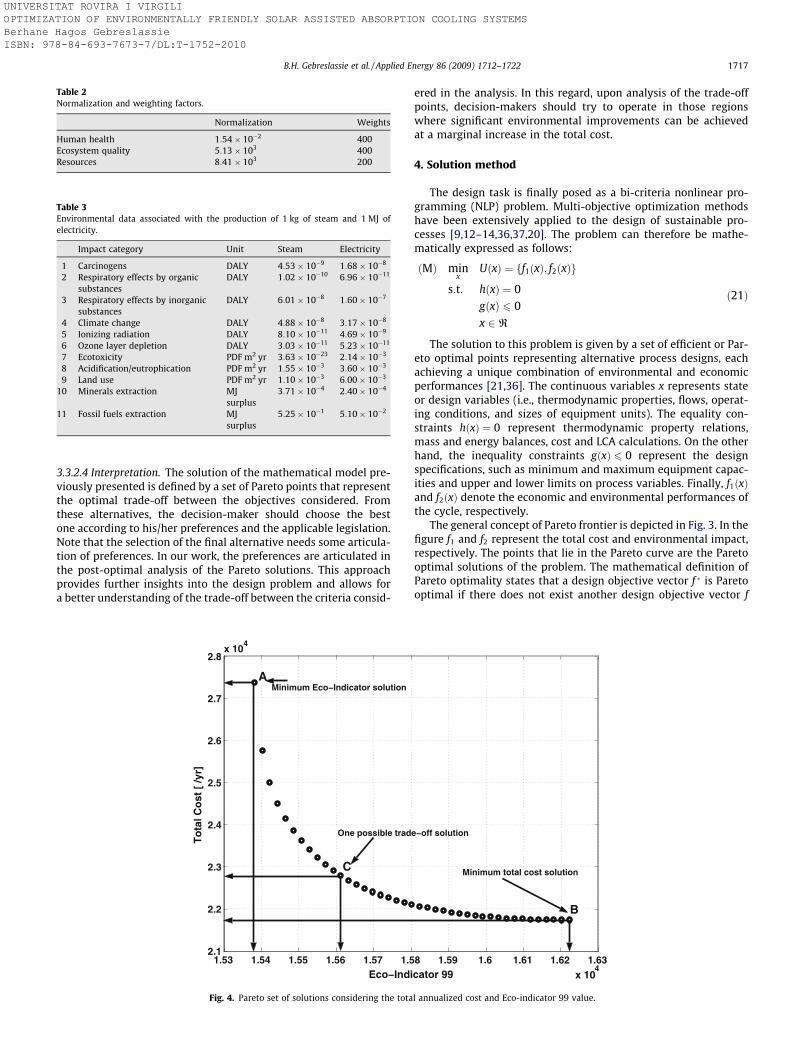
Table 2Normalization and weighting factors.
Normalization Weights
Human health 1:54� 10�2 400Ecosystem quality 5:13� 103 400Resources 8:41� 103 200
Table 3Environmental data associated with the production of 1 kg of steam and 1 MJ ofelectricity.
Impact category Unit Steam Electricity
1 Carcinogens DALY 4:53� 10�9 1:68� 10�8
2 Respiratory effects by organicsubstances
DALY 1:02� 10�10 6:96� 10�11
3 Respiratory effects by inorganicsubstances
DALY 6:01� 10�8 1:60� 10�7
4 Climate change DALY 4:88� 10�8 3:17� 10�8
5 Ionizing radiation DALY 8:10� 10�11 4:69� 10�9
6 Ozone layer depletion DALY 3:03� 10�11 5:23� 10�11
7 Ecotoxicity PDF m2 yr 3:63� 10�23 2:14� 10�3
8 Acidification/eutrophication PDF m2 yr 1:55� 10�3 3:60� 10�3
9 Land use PDF m2 yr 1:10� 10�3 6:00� 10�3
10 Minerals extraction MJsurplus
3:71� 10�4 2:40� 10�4
11 Fossil fuels extraction MJsurplus
5:25� 10�1 5:10� 10�2
B.H. Gebreslassie et al. / Applied Energy 86 (2009) 1712–1722 1717
UNIVERSITAT ROVIRA I VIRGILI OPTIMIZATION OF ENVIRONMENTALLY FRIENDLY SOLAR ASSISTED ABSORPTION COOLING SYSTEMS Berhane Hagos Gebreslassie ISBN: 978-84-693-7673-7/DL:T-1752-2010
3.3.2.4 Interpretation. The solution of the mathematical model pre-viously presented is defined by a set of Pareto points that representthe optimal trade-off between the objectives considered. Fromthese alternatives, the decision-maker should choose the bestone according to his/her preferences and the applicable legislation.Note that the selection of the final alternative needs some articula-tion of preferences. In our work, the preferences are articulated inthe post-optimal analysis of the Pareto solutions. This approachprovides further insights into the design problem and allows fora better understanding of the trade-off between the criteria consid-
1.53 1.54 1.55 1.56 1.57 1.52.1
2.2
2.3
2.4
2.5
2.6
2.7
2.8x 10
4
Eco−Indi
To
tal C
ost
[ /y
r]
A
C
Minimum Eco−Indicator solution
One possible trad
Fig. 4. Pareto set of solutions considering the tota
ered in the analysis. In this regard, upon analysis of the trade-offpoints, decision-makers should try to operate in those regionswhere significant environmental improvements can be achievedat a marginal increase in the total cost.
4. Solution method
The design task is finally posed as a bi-criteria nonlinear pro-gramming (NLP) problem. Multi-objective optimization methodshave been extensively applied to the design of sustainable pro-cesses [9,12–14,36,37,20]. The problem can therefore be mathe-matically expressed as follows:
ðMÞ minx
UðxÞ ¼ ff1ðxÞ; f2ðxÞg
s:t: hðxÞ ¼ 0gðxÞ 6 0x 2 R
ð21Þ
The solution to this problem is given by a set of efficient or Par-eto optimal points representing alternative process designs, eachachieving a unique combination of environmental and economicperformances [21,36]. The continuous variables x represents stateor design variables (i.e., thermodynamic properties, flows, operat-ing conditions, and sizes of equipment units). The equality con-straints hðxÞ ¼ 0 represent thermodynamic property relations,mass and energy balances, cost and LCA calculations. On the otherhand, the inequality constraints gðxÞ 6 0 represent the designspecifications, such as minimum and maximum equipment capac-ities and upper and lower limits on process variables. Finally, f1ðxÞand f2ðxÞ denote the economic and environmental performances ofthe cycle, respectively.
The general concept of Pareto frontier is depicted in Fig. 3. In thefigure f1 and f2 represent the total cost and environmental impact,respectively. The points that lie in the Pareto curve are the Paretooptimal solutions of the problem. The mathematical definition ofPareto optimality states that a design objective vector f � is Paretooptimal if there does not exist another design objective vector f
8 1.59 1.6 1.61 1.62 1.63
x 104
cator 99
B
Minimum total cost solution
e−off solution
l annualized cost and Eco-indicator 99 value.
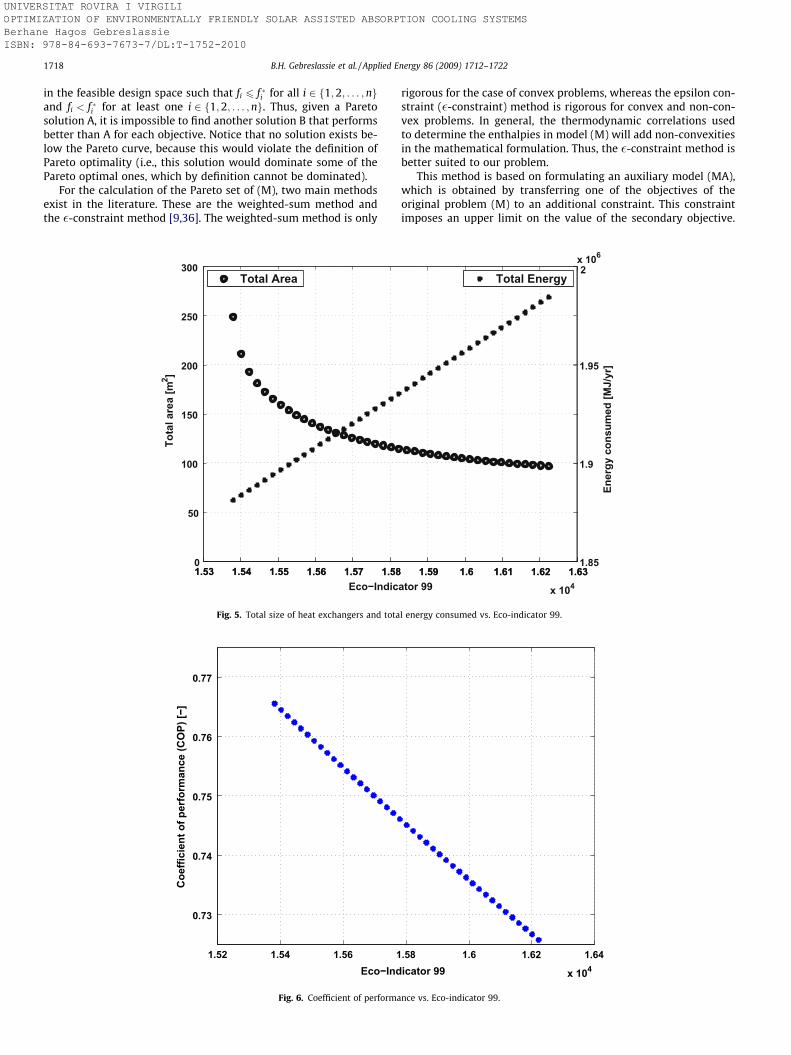
1718 B.H. Gebreslassie et al. / Applied Energy 86 (2009) 1712–1722
UNIVERSITAT ROVIRA I VIRGILI OPTIMIZATION OF ENVIRONMENTALLY FRIENDLY SOLAR ASSISTED ABSORPTION COOLING SYSTEMS Berhane Hagos Gebreslassie ISBN: 978-84-693-7673-7/DL:T-1752-2010
in the feasible design space such that fi 6 f �i for all i 2 f1;2; . . . ;ngand fi < f �i for at least one i 2 f1;2; . . . ;ng. Thus, given a Paretosolution A, it is impossible to find another solution B that performsbetter than A for each objective. Notice that no solution exists be-low the Pareto curve, because this would violate the definition ofPareto optimality (i.e., this solution would dominate some of thePareto optimal ones, which by definition cannot be dominated).
For the calculation of the Pareto set of (M), two main methodsexist in the literature. These are the weighted-sum method andthe �-constraint method [9,36]. The weighted-sum method is only
1.53 1.54 1.55 1.56 1.57 1.580
50
100
150
200
250
300
Tota
l are
a [m
2 ]
Eco−Indic
Total Area
1.53 1.54 1.55 1.56 1.57 1.58
Fig. 5. Total size of heat exchangers and tota
1.52 1.54 1.56 1
0.73
0.74
0.75
0.76
0.77
Eco−Ind
Coe
ffici
ent o
f per
form
ance
(CO
P) [−
]
Fig. 6. Coefficient of performa
rigorous for the case of convex problems, whereas the epsilon con-straint (�-constraint) method is rigorous for convex and non-con-vex problems. In general, the thermodynamic correlations usedto determine the enthalpies in model (M) will add non-convexitiesin the mathematical formulation. Thus, the �-constraint method isbetter suited to our problem.
This method is based on formulating an auxiliary model (MA),which is obtained by transferring one of the objectives of theoriginal problem (M) to an additional constraint. This constraintimposes an upper limit on the value of the secondary objective.
1.59 1.6 1.61 1.62 1.63ator 99
1.59 1.6 1.61 1.62 1.63
x 104
1.85
1.9
1.95
2x 10⁶
Ener
gy c
onsu
med
[MJ/
yr]
Total Energy
l energy consumed vs. Eco-indicator 99.
.58 1.6 1.62 1.64
x 104icator 99
nce vs. Eco-indicator 99.

Table 5Thermodynamic properties and mass flow rates at each state point of the cycle inPareto solution B.
State point P (bar) T (�C) x kgkg
� �m kg
s
� �h kJ
kg
� �
1 0.48 33.1 0.548 0.401 �102.52 1.55 33.1 0.548 0.401 �99.23 1.55 79.1 0.548 0.401 105.74 1.55 95.7 0.429 0.317 189.45 1.55 41.1 0.429 0.317 �69.76 0.48 41.1 0.429 0.317 �69.79 1.55 79.1 0.996 0.084 1417.0
B.H. Gebreslassie et al. / Applied Energy 86 (2009) 1712–1722 1719
UNIVERSITAT ROVIRA I VIRGILI OPTIMIZATION OF ENVIRONMENTALLY FRIENDLY SOLAR ASSISTED ABSORPTION COOLING SYSTEMS Berhane Hagos Gebreslassie ISBN: 978-84-693-7673-7/DL:T-1752-2010
Model (MA) is then solved for different values of the auxiliaryparameter � in order to generate the entire Pareto set of solutions:
ðMAÞ minx
f1ðxÞ
s:t: f2ðxÞ 6 �� 6 � 6 ��hðxÞ ¼ 0gðxÞ 6 0x 2 R
ð22Þ
Thus, if (MA) is solved for all possible values of � and the result-ing solutions are unique, then these solutions represent the entirePareto set of solutions of the original multi-objective problem. Ifthe solutions to (MA) are not unique for some value(s) of �, thenthe Pareto point(s) must be picked by direct comparison. The ex-treme points of the interval ½�; ���, within which � must fall,� 2 ½�; ���, can be determined by solving the following single objec-tive problems:
� ¼ f2ð�x�Þ�x� ¼ arg min
xf2ðxÞ
hðxÞ ¼ 0gðxÞ 6 0x 2 R
ð23Þ
�� ¼ f2ð�x�Þ�x� ¼ arg min
xf 1ðxÞ
hðxÞ ¼ 0gðxÞ 6 0x 2 R
ð24Þ
10 1.55 39.8 0.996 0.084 185.811 1.55 23.8 0.996 0.084 110.112 0.48 3.0 0.996 0.084 110.113 0.48 3.0 0.996 0.084 1303.014 0.48 38.8 0.996 0.084 1378.615 1.00 27.0 4.024 116.216 1.00 35.0 4.024 149.717 1.00 100.0 0.06 2678.018 1.00 100.0 0.06 418.619 1.00 27.0 3.087 116.220 1.00 35.0 3.087 149.721 1.00 10.0 4.785 42.122 1.00 5.0 4.785 21.1
5. Case study
The capabilities of our approach is illustrated through a casestudy problem that addresses the design of a typical absorptioncooling system. The system is driven by low grade heat and utilizesammonia–water as working pair. The process data and environ-mental information of the problem are given in Tables 1–3. Thesedata include the operating conditions, heat exchanger designparameters, costs parameters and environmental information. Theenvironmental inventory data were retrieved from the Eco-invent
Table 4Thermodynamic properties and mass flow rates at each state point of the cycle inPareto solution A.
State point P (bar) T (�C) x kgkg
� �m kg
s
� �h kJ
kg
� �
1 0.50 28.1 0.596 0.267 �114.22 1.39 28.1 0.596 0.267 �110.13 1.39 70.0 0.596 0.267 76.44 1.39 93.7 0.416 0.184 180.35 1.39 36.1 0.416 0.184 �90.36 0.50 36.1 0.416 0.184 �90.39 1.39 70.0 0.996 0.083 1404.0
10 1.39 36.0 0.996 0.083 166.811 1.39 22.2 0.996 0.083 101.512 0.50 4.0 0.996 0.083 101.513 0.50 4.0 0.996 0.083 1304.014 0.50 35.0 0.996 0.083 1370.015 1.00 27.0 3.820 116.216 1.00 35.0 3.820 149.717 1.00 100.0 0.057 2678.018 1.00 100.0 0.057 418.619 1.00 27.0 3.076 116.220 1.00 35.0 3.076 149.721 1.00 10.0 4.785 42.122 1.00 5.0 4.785 21.1
database [33–35]. The Hierarchist damage model and normaliza-tion with the Average weighting factors were adopted in the LCAcalculations (see Table 3).
6. Results and discussion
A bi-criteria nonlinear programming (NLP) simulation modelwas implemented in GAMS [25]. The resulting optimization prob-lem contains 165 constraints and 206 continuous variables. Eachsingle-objective problem was solved with CONOPT [38]. This solverattempts to find a local optimum to an NLP model. Since problem(MA) is non-convex, CONOPT cannot guarantee the global optimal-ity of the solutions found. Each of these solutions must therefore beregarded as locally optimal unless a global optimization packagelike BARON [39] is used.
The problem is first solved by optimizing each single objectiveseparately. This provides the lower and upper limits within which� fall. Then, the interval ½�; ��� is partitioned into 40 sub-intervals ofequal length, and model (MA) is calculated for each of the limits of
Table 6Thermodynamic properties and mass flow rates at each state point of the cycle inPareto solution C.
State point P (bar) T (�C) x kgkg
� �m kg
s
� �h kJ
kg
� �
1 0.50 30.1 0.579 0.318 �109.32 1.45 30.1 0.579 0.318 �105.63 1.45 72.6 0.579 0.318 83.44 1.45 92.4 0.431 0.235 172.95 1.45 38.1 0.431 0.235 �83.46 0.50 38.1 0.431 0.235 �83.49 1.45 72.6 0.996 0.083 1408.0
10 1.45 37.4 0.996 0.083 173.711 1.45 22.9 0.996 0.083 105.412 0.50 4.0 0.996 0.083 105.413 0.50 4.0 0.996 0.083 1304.414 0.50 36.4 0.996 0.083 1373.015 1.00 27.0 3.878 116.216 1.00 35.0 3.878 149.717 1.00 100.0 0.058 2678.018 1.00 100.0 0.058 418.619 1.00 27.0 3.078 116.220 1.00 35.0 3.078 149.721 1.00 10.0 4.785 42.122 1.00 5.0 4.785 21.1

Table 7Operating performance, cost and environmental impact of Pareto solutions A, B, and C.
Design COP (–) TC (euro/yr) Cop (euro/yr) Cc (euro/yr) Atotal (m2) Steam (kg) Electricity (MJ) Total ECO99
ECO99 (A) 0.77 27,366 15,983 11,383 248.5 825,464 15,838 15,381Cost (B) 0.73 21,737 16,903 4834 96.8 869,737 18,948 16,223Trade-off (C) 0.76 22,786 16,239 6548 136.8 837,582 16,832 15,612
Table 8Normalized contribution of each impact category to the total Eco-indicator 99 valuein Pareto solution C.
Impact categories Impact(steam)
Impact(electricity)
Totaltrade-off
1 Carcinogens 98.54 7.34 105.902 Respiratory effects by organic
substances2.21 0.03 2.24
3 Respiratory effects by inorganicsubstances
1307.00 69.95 1377.00
4 Climate change 1061.00 13.86 1075.005 Ionizing radiation 1.76 2.05 3.816 Ozone layer depletion 0.66 0.02 0.687 Ecotoxicity 2371.00 2.81 2373.008 Acidification/eutrophication 101.07 4.74 105.809 Land use 72.05 7.87 79.93
10 Minerals extraction 7.40 0.10 7.5011 Fossil fuels extraction 10461.00 20.44 10481.00
ECO99 15484.00 129.20 15613.20
1720 B.H. Gebreslassie et al. / Applied Energy 86 (2009) 1712–1722
UNIVERSITAT ROVIRA I VIRGILI OPTIMIZATION OF ENVIRONMENTALLY FRIENDLY SOLAR ASSISTED ABSORPTION COOLING SYSTEMS Berhane Hagos Gebreslassie ISBN: 978-84-693-7673-7/DL:T-1752-2010
these sub-intervals. The total computation time for the generationof the efficient solutions is 2.75 s in a 1.86 GHz machine. The Par-eto points obtained by following this strategy are shown in Fig. 4.As can be observed in the figure, there is a clear trade-off betweenboth objective functions, since a reduction in the total Eco-indica-tor 99 value can only be achieved at the expense of an increase inthe total annualized cost. Points A and B are the optimal designsolutions with minimum Eco-indicator 99 and total annualizedcost values, respectively. In the optimal solution A, the total annu-alized cost is 25.9% larger than in solution B, whereas in B, the Eco-indicator 99 is 5.5% larger than in A. Point C represents a possibleintermediate Pareto optimal solution in the interval ½�; ���.
1 2 3 4 5 60
2000
4000
6000
8000
10000
12000
14000
16000
18000
Impact
Eco
−In
dic
ato
r 99
[%
]
ACB
Fig. 7. Breakdown of Eco-indicator 99
Note that each point in the Pareto set represents a differentoptimal design which operates under a set of specific conditions.Furthermore, each trade-off solution involves a different compro-mise between both criteria. The environmental impact is decreasedalong the Pareto curve by reducing the consumption of energy (i.e.,steam and electricity), which in turn decreases the environmentalloads and, hence, the impact caused. This is accomplished byincreasing the area of the heat exchangers of the cycle. Ideally,the size of the heat exchangers and the energy consumption shouldbe simultaneously minimized in order to decrease the total costand environmental impact. However, this is not possible, since areduction in the size of the heat exchangers leads to an increasein the thermal energy demand (i.e., steam consumption), whichturns out to be the main contributor to the total environmental im-pact, and vice versa. This is clearly shown in Fig. 5, which depictsfor the obtained Pareto solutions, the total area and energy con-sumption as a function of the Eco-indicator 99 value.
Let us note that in the cost and environmental assessment anal-ysis, there is an inherent trade-off between energy consumptionand size of the cycle. In the cost analysis, we have that bigger areaslead to higher capital cost but on the other hand to lower energyconsumption. In the environmental analysis, we find that greaterequipments reduce the impact due to the energy production buton the other hand increase the impact associated with their con-struction. In both cases, each of these terms is penalized with a dif-ferent factor (energy and capital cost in the former case, andenergy and equipment impact in the latter). These weighting fac-tors (i.e., cost and environmental impact parameters) will conductthe optimization search towards a particular solution. Hence, theminimum cost alternative will not be in general the same as theminimum environmental impact one, since both solutions will de-pend on the specific values of the economic and environmental
7 8 9 10 11 12
Categories
for Pareto solutions A, B, and C.
B.H. Gebreslassie et al. / Applied Energy 86 (2009) 1712–1722 1721
UNIVERSITAT ROVIRA I VIRGILI OPTIMIZATION OF ENVIRONMENTALLY FRIENDLY SOLAR ASSISTED ABSORPTION COOLING SYSTEMS Berhane Hagos Gebreslassie ISBN: 978-84-693-7673-7/DL:T-1752-2010
data used in the analysis. We should also clarify at this point thatthe impact due to the equipment construction is usually very smallcompared to that caused by the energy generation. For this reason,it has been neglected in our work, although it could have been eas-ily incorporated into the model.
Fig. 6 shows the direct relationship between the COP and the to-tal Eco-indicator 99 value. Note that the COP is the ratio betweenthe cooling load, which is constant, and the energy input to the sys-tem given in Eq. (9). As can be observed, when the energy input in-creases, both the COP and the Eco-indicator 99 value increase.
Tables 4–7 summarize the solutions A, B, and C. The informationgiven includes the thermodynamic properties of each state point ofthe cycle, the mass flow rates, the design and operating variables ofthe heat exchangers, and the values of both objective functions. Ascan be seen, when the energy consumption increases, the solutiontemperature and the pressure level increase accordingly. As a re-sult, the concentration gradient decreases, and the mass flow rateof the solution is increased in order to keep the cooling loadconstant.
Furthermore, in Table 7 one can see as the steam and electricityconsumption increase, the total Eco-indicator 99 value increasesaccordingly, while the heat transfer area requirement decreases.For instance, the Eco-indicator 99 value of solution C is lower by3.8% from solution B, and higher by 1.5% from A. On the other hand,its total annualized cost is 16.8% lower than solution A, and 4.8%higher than B. Therefore, taking B as reference, if we switch fromB to C it leads to a 3.8% reduction in the total Eco-indicator 99 valueat the expense of increasing the cost by 4.8%.
Table 8 shows the Eco-indicator 99 values and environmentalimpact of all 11 impact categories along with each contributorsof Pareto solution C. As can be observed, the steam production isthe main contributor to the total environmental impact in almostall damage categories, except for the damage to human healthcaused by ionization radiation, in which the electricity generationcontributes more than 50% to the total impact.
Finally, Fig. 7 shows a breakdown of the Eco-indicator 99 valueinto its single impact categories for the Pareto solutions A, B, and C.As can be seen, the most significant environmental impact is thedepletion of natural resources (impact 11) followed by the damageto the ecosystem quality caused by ecotoxic emissions (impact 7).The third and fourth damages are the respiratory effects on humanhealth caused by inorganic substance (impact 3) and the damage tohuman health caused by climate change (impact 4), respectively.
Note that these specific results are very sensitive to the life cy-cle inventory data, which in our case were retrieved from the Eco-invent databases. Hence, the conclusions and recommendationsmade may significantly change according to the specific featuresof the technologies employed for the generation of steam andelectricity.
7. Conclusions
A systematic approach for the design of sustainable absorptioncooling systems has been presented. The method introduced relieson formulating a bi-criteria nonlinear programming (NLP) problemthat accounts for the minimization of the total annualized cost andthe environmental impact of the cycle. The latter criterion has beenmeasured according to the principles of life cycle assessment(LCA). The solution of such a problem, which is defined by a setof Pareto optimal design alternatives, can be obtained via standardtechniques for multi-objective optimization.
The capabilities of the proposed approach have been illustratedthrough its application to the design of a typical absorption coolingsystem. It has been clearly shown that significant reductions in theenvironmental impact caused by the cycle can be attained if the
decision-maker is willing to compromise the economic perfor-mance of the system. These reductions can be achieved by decreas-ing the energy consumption, which on the other hand leads to anincrease in the total cost of the cycle. The methodology presentedis intended to promote a more sustainable design of absorption cy-cles by guiding the decision-makers towards the adoption of alter-natives that cause less environmental impact.
Acknowledgements
Berhane H. Gebreslassie expresses his gratitude for the financialsupport received from the University Rovira i Virgili. The authorsalso wish to acknowledge support of this research work from theSpanish Ministry of Education and Science (DPI2008-04099/DPI)and the Spanish Ministry of External Affairs (A/8502/07 andHS2007-0006).
References
[1] McMullan JT. Refrigeration and the environment – issues and strategies for thefuture. Int J Refrig 2002;25:89–99.
[2] Herold KE, Radermacher R, Klein SA. Absorption chillers and heat pumps. CRCPress; 1996.
[3] Florides GA, Kalogirou SA, Tassou SA, Wrobel LC. Modelling simulation andwarming impact assessment of a domestic-size absorption solar coolingsystem. Appl Therm Eng 2002;22:1313–25.
[4] Palacios BR, Gonzales PR, Nebra SA. Thermoeconomic analysis of a single anddouble-effect LiBr=H2O absorption refrigeration system. In: Andrzej Z,Zygmunt K, Wojciech S, editors. ECOS, 2008. p. 287–98.
[5] Misra PK, Sahoo RD, Gupta A. Thermoeconomic evaluation and optimization ofan aqua-ammonia vapour-absorption refrigeration system. Int J Refrig2006;29:47–59.
[6] Misra PK, Sahoo RD, Sahoo S, Gupta A. Thermoeconomic optimization of asingle effect water/LiBr vapour absorption refrigeration system. Int J Refrig2003;26:158–69.
[7] KizIlkan Ö, Sencan A, Kalogirou SA. Thermoeconomic optimization of a LiBrabsorption refrigeration system. Chem Eng Process: Process Intens2007;46:1376–84.
[8] Bejan A, Tsatsaronis G, Moran M. Thermal design & optimization. John Wiley &Sons; 1996.
[9] Guillén-Gosálbez G, Caballero JA, Jiménez L, Gadalla M. Application of life cycleassessment to the structural optimization of process flowsheets. Comput AidChem Eng 2007;24:1163–8.
[10] Stefanis SK, Livingston AG, Pistikopoulos EN. Minimizing the environmentalimpact of process plants: a process systems methodology. Comput Chem Eng1995;19:39–44.
[11] Dantus MM, High KA. Evaluation of waste minimization alternatives underuncertainty: a multiobjective optimization approach. Comput Chem Eng1999;23:1493–508.
[12] Azapagic A. Life cycle assessment and its application to process selection,design and optimisation. Chem Eng J 1999;73:1–21.
[13] Azapagic A, Clift R. The application of life cycle assessment to processoptimisation. Comput Chem Eng 1999;10:1509–26.
[14] Azapagic A, Clift R. Life cycle assessment and multiobjective optimisation. JClean Product 1999;7:135–43.
[15] Kotas TJ. The exergy method of thermal plant analysis. Krieger PublishingCompany; 1995.
[16] Riva A, D’Angelosante S, Trebeschi C. Natural gas and the environmentalresults of life cycle assessment. Energy 2006;31:138–48.
[17] Prek M. Environmental impact and life cycle assessment of heating and airconditioning systems, a simplified case study. Energy Build 2004;36:1021–7.
[18] Masruroh NA, Li B, Klemes J. Life cycle analysis of a solar thermal system withthermochemical storage process. Appl Energy 2006;31:537–48.
[19] Góralczyk M. Life-cycle assessment in the renewable energy sector. ApplEnergy 2003;75:205–11.
[20] Fu Y, Diwekar UM. Cost effective environmental control technology forutilities. Adv Environ Res 2004;8:173–96.
[21] Hugo A, Pistikopoulos EN. Environmentally conscious planning and design ofsupply chain networks. J Clean Product 2005;13:1471–91.
[22] PRé-Consultants. The Eco-indicator 99A damage oriented method for life cycleimpact assessment. methodology report and manual for designers. TechnicalReport, PRé Consultants, Amersfoort, The Netherlands, 2000.
[23] Sencan A, Yakut KA, Kalogirou SA. Exergy analysis of lithium bromide/waterabsorption systems. Renew Energy 2005;30:645–57.
[24] Best R, Islas J, Martínez M. Exergy efficiency of an ammonia–water absorptionsystem for ice production. Appl Energy 1993;45:241–56.
[25] Brooke A, Kendrik D, Meeraus A, Raman R, Rosenthal RE. GAMS – a user’sguide. Washington: GAMS Development Corporation; 1998.

1722 B.H. Gebreslassie et al. / Applied Energy 86 (2009) 1712–1722
UNIVERSITAT ROVIRA I VIRGILI OPTIMIZATION OF ENVIRONMENTALLY FRIENDLY SOLAR ASSISTED ABSORPTION COOLING SYSTEMS Berhane Hagos Gebreslassie ISBN: 978-84-693-7673-7/DL:T-1752-2010
[26] Pátek J, Klomfar J. Simple functions for fast calculations of selectedthermodynamic properties of the ammonia–water system. Int J Refrig1995;18:228–34.
[27] Conde Engineering M. Thermophysical properties of NH3 þ H2O mixtures forthe industrial design of absorption refrigeration equipment. Technical Report,2006.
[28] Edgar TF, Himmelblau DM, Lasdon DS. Optimization of chemicalprocesses. McGraw-Hill; 2001.
[29] Siddiqui MA. Economic analyses of absorption systems: part a – design andcost evaluation. Energy Convers Manage 1997;38:889–904.
[30] Wall G. Optimization of refrigeration machinery. Int J Refrig 1997;14:336–40.[31] Al-Otaibi DA, Dincer I, Kalyon M. Thermoeconomic optimization of vapor-
compression refrigeration systems. Int Commun Heat Mass Transfer2004;31:95–107.
[32] IRAM-ISO 14040. Environmental management-Life cycle assessment-principles and frame work, 2006.
[33] Ecobalance-UK. TEAM and DEAM. Ecobalance UK, The Ecobilan Group,Arundel, UK, 1998. <http://www.ecobalance.com/uk_team.php>.
[34] PIRA-International. PEMS 4 Database. PIRA International, Leatherhead, UK,1998. <http://www.pira.co.uk/pack/lca_software.htm>.
[35] PRé-Consultants. SimaPro 6 LCA software. The Netherlands, 1998. <http://www.pre.nl/simapro/default.htm>.
[36] Hugo A, Ciumei C, Buxton A, Pistikopoulos EN. Environmental impactminimization through material substitution: a multi-objective optimizationapproach. Green Chem 2004;6:407–17.
[37] Eliceche AM, Corvalán SM, Martínez P. Environmental life cycle impact as atool for process optimisation of a utility plant. Comput Chem Eng2007;31:648–56.
[38] Drud A. CONOPT solver manual. Bagsvaerd, Denmark: ARKI Consulting andDevelopment; 1996.
[39] Drud A. BARON user manual. The Optimization Firm, LLC; 2004.
Applied Thermal Engineering 29 (2009) 3491–3500
UNIVERSITAT ROVIRA I VIRGILI OPTIMIZATION OF ENVIRONMENTALLY FRIENDLY SOLAR ASSISTED ABSORPTION COOLING SYSTEMS Berhane Hagos Gebreslassie ISBN: 978-84-693-7673-7/DL:T-1752-2010
Contents lists available at ScienceDirect
Applied Thermal Engineering
journal homepage: www.elsevier .com/locate /apthermeng
Economic performance optimization of an absorption cooling systemunder uncertainty
Berhane H. Gebreslassie a, Gonzalo Guillén-Gosálbez b, Laureano Jiménez b, Dieter Boer a,*
a Department of Mechanical Engineering, University Rovira i Virgili, Av. Països Catalans, 26, 43007 Tarragona, Spainb Department of Chemical Engineering, University Rovira i Virgili, Av. Països Catalans, 26, 43007 Tarragona, Spain
a r t i c l e i n f o
Article history:Received 13 March 2009Accepted 2 June 2009Available online 6 June 2009
Keywords:Absorption refrigerationStochastic programmingMulti-objective optimizationUncertaintyAmmonia–waterEnergy cost
1359-4311/$ - see front matter � 2009 Elsevier Ltd. Adoi:10.1016/j.applthermaleng.2009.06.002
* Corresponding author. Tel.: +34 977559631; fax:E-mail address: [email protected] (D. Boer).
a b s t r a c t
Many of the strategies devised so far to address the optimization of energy systems are deterministicapproaches that rely on estimated data. However, in real world applications there are many sources ofuncertainty that introduce variability into the decision-making problem. Within this general context,we propose a novel approach to address the design of absorption cooling systems under uncertainty inthe energy cost. As opposed to other approaches that optimize the expected performance of the systemas a single objective, in our method the design task is formulated as a stochastic bi-criteria non-linearoptimization problem that simultaneously accounts for the minimization of the expected total costand the financial risk associated with the investment. The latter criterion is measured by the downsiderisk, which avoids the need to define binary variables thus improving the computational performanceof the model. The capabilities of the proposed modeling framework and solution strategy are illustratedin a case study problem that addresses the design of a typical absorption cooling system. Numericalresults demonstrate that the method presented allows to manage the risk level effectively by varyingthe area of the heat exchangers of the absorption cycle. Specifically, our strategy allows identifying theoptimal values of the operating and design variables of the cycle that make it less sensitive to fluctuationsin the energy price, thus improving its robustness in the face of uncertainty.
� 2009 Elsevier Ltd. All rights reserved.
1. Introduction
Energy plays an important role in supporting our daily life, eco-nomic development and every human activity. Energy systems arecomplex as they involve various economic, technical, environmen-tal, legal and political factors [1,2]. Due to the limitation of fossilenergy resources, the impact on the environment, and the humanhealth problems during the last decades, there has been a growinginterest on developing modeling and optimization strategies forenergy systems. In this challenging scenario, absorption cycleshave emerged as a promising alternative in cooling and refrigera-tion applications, as they use refrigerant with zero global warmingpotential that do not contribute to the ozone layer depletion [3,4].Moreover, another advantage of these systems is that they can usedifferent forms of primary energy sources such as fossil fuels,renewable energy sources, and also waste heat recovered fromother thermal systems.
Unfortunately, these systems require higher number of unitsthan conventional vapor compression cycles, which leads to higherinvestment costs. Hence, there is a clear need to develop strategiesable to optimize their design and operation from a thermodynamic
ll rights reserved.
+34 977559691.
and economic point of view so they can become a real alternativeto the standard compression systems. Specifically, most of themethods proposed so far to accomplish this task rely on the con-cept of thermoeconomic analysis [5–7], an approach that combinesin a single framework both, a thermodynamic model (usuallybased on exergy considerations) and an economic model (i.e., acost model).
An alternative strategy that has been widely applied in the opti-mization of process industries is the simultaneous approach basedon mathematical programming [8]. In this second method, the de-sign task is posed as an optimization problem that is solved viastandard techniques for linear, non-linear, mixed-integer linearand mixed-integer non-linear (LP, NLP, MILP, MINLP, respectively)programming. Although these strategies have been extensivelyused in the optimization of chemical processes (see [9]), theirapplication to the design of absorption cooling systems has beenrather limited, and only a few works can be found in the area[10,11] that deals with the optimization of an ammonia–waterabsorption cycle by application of MINLP following a deterministicapproach.
Most of the strategies that address the optimization of thermalsystems following either of the aforementioned approaches aredeterministic. That is, they are typically based on nominal orestimated values for all the input data considered in the analysis

Nomenclature
AbbreviationsA absorberC condenserD desorberE evaporatorP solution pumpRV refrigerant expansion valveSC subcoolerSHX solution heat exchangerSV solution expansion valveyr year
Indicesi component of a streamj streamsk unit
SetsINðkÞ set of input streams to unit kOUTðkÞ set of output streams from unit k
Parametersc1 cost parameter €
m2
� �c2 cost parameter (€)
c3 cost parameter €kW
� �cqs unitary cost of steam in scenario s €
MWh
� �ces unitary cost of electricity in scenario s €
MWh
� �cr capital recovery factor (–)probs probability of total cost of scenario sir interest rate (–)top operating hours h
yr
� �Uk overall heat transfer coefficient of unit k kW
m2K
� �
VariablesAk area of heat exchanger k ðm2Þ
CC total capital cost (€)Cexp cost of the expansion valves (€)Chxs cost of the heat exchangers (€)COs total operating cost in scenario s (€)Cp cost of the pump (€)
COP coefficient of performance (–)
DRisk downside risk (€)
E[TC] expected total cost (€)
DTlmk logarithmic mean temperature difference in equipment
k (�C or K)DTh
k temperature difference in the hot end in equipment k(�C or K)
DTck temperature difference in the cold end in equipment k
(�C or K)DT temperature difference of heat exchangers in equip-
ment k (�C or K)hj enthalpy of stream j ðkJ
kgÞmj mass flow rate of stream j kg
s
� �Pj pressure of stream j ðbarÞP probability (–)Qk heat transferred in unit k (kW)TC total cost (€)TCs total cost in scenario s (€)Tj temperature of stream j (�C or K)Wp mechanical power of the pump (kW)xi;j mass fraction of component i in stream j (–)zs binary variable (1 if the cost in scenario s exceeds the
target level, 0 otherwise)
Greek lettersX target on the total cost (€)d deviation of TC from X (€)ds deviation of TCs from X (€)
3492 B.H. Gebreslassie et al. / Applied Thermal Engineering 29 (2009) 3491–3500
UNIVERSITAT ROVIRA I VIRGILI OPTIMIZATION OF ENVIRONMENTALLY FRIENDLY SOLAR ASSISTED ABSORPTION COOLING SYSTEMS Berhane Hagos Gebreslassie ISBN: 978-84-693-7673-7/DL:T-1752-2010
[5,12–17]. This means that the key parameters that influence theoptimization task are assumed to be perfectly known in advance,so the only situation assessed in the study is the most likely one.This type of strategies lead to decisions by far too optimistic, inwhich the variability of the parameters of the problem is disre-garded. However, in real world applications there are manysources of uncertainty that introduce variability into the deci-sion-making problem. This is especially true in the optimizationof energy systems, in which the availability of energy sources,technology performance, energy cost and end user cooling andheating demand, among many others, are affected by a high degreeof uncertainty [2,18–21].
In the process system engineering literature, the inclusion ofuncertainty issues in the decision-making procedure has recentlyemerged as an active area of research. There are currently threemain approaches that address optimization under uncertainty(for a detailed review see [19]): (1) stochastic programming [22–28], (2) fuzzy programming [1,2,20,29,30] and (3) stochasticdynamic programming [31]. The main applications of these toolshave focused on process design [33–35], planning and schedulingof process plants [23,27,28,36–38] and also on the design and plan-ning of entire chemical supply chains [22,26,39]. On the otherhand, in the modeling and optimization of energy systems, uncer-tainty considerations have been usually neglected. Whereas thereare few works that account for uncertainty issues in the planningof energy systems [1,2,20,29,30], to our knowledge the design un-der uncertainty of such systems has not yet been addressed.
Specifically, Cai et al. [2] studied the identification of optimalstrategies for energy management planning where the total cost,energy demand, technology efficiency and energy import costsare considered as uncertain and represented by fuzzy sets. Linet al. [1] have addressed the energy system planning by integrationof interval-parameter and fuzzy programming into a two stage sto-chastic programming framework to handle energy demand uncer-tainty. Sadeghi et al. [20] studied the energy supply planning inIran using fuzzy models to represent the investment cost uncer-tainty. Mavrotas et al. [29] used fuzzy linear programming to opti-mize energy planning in buildings by considering the fuel costs asuncertain or fuzzy parameters. Svensson et al. [32] developed amethodology for identifying robust process integration invest-ments under uncertainty using a real options approach. Tayloret al. [40] performed an uncertainty analysis on the design of pip-ing systems, piping networks, and cross-flow heat exchangers. Theauthors showed that uncertainty analysis is a viable paradigm forenergy system analysis and design.
The objective of this work is to address the design of absorp-tion cooling systems under uncertainty in the energy cost. Themain novelties of this work are: (1) the explicit considerationof uncertainty issues at the design stage of absorption coolingcycles and (2) the development of a bi-criteria mathematicalmodel that employs risk management techniques to deal withthe associated decision-making problem under uncertainty. Theapproach presented relies on formulating the design task as astochastic non-linear programming problem (NLP) that accounts
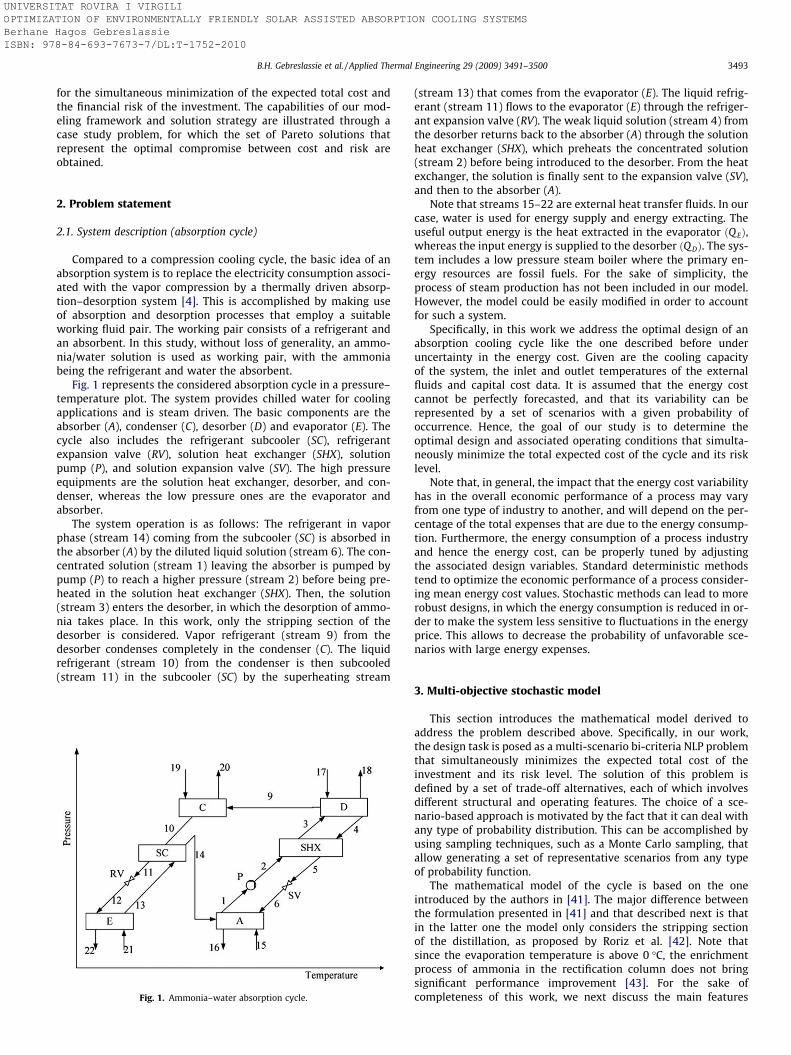
B.H. Gebreslassie et al. / Applied Thermal Engineering 29 (2009) 3491–3500 3493
UNIVERSITAT ROVIRA I VIRGILI OPTIMIZATION OF ENVIRONMENTALLY FRIENDLY SOLAR ASSISTED ABSORPTION COOLING SYSTEMS Berhane Hagos Gebreslassie ISBN: 978-84-693-7673-7/DL:T-1752-2010
for the simultaneous minimization of the expected total cost andthe financial risk of the investment. The capabilities of our mod-eling framework and solution strategy are illustrated through acase study problem, for which the set of Pareto solutions thatrepresent the optimal compromise between cost and risk areobtained.
2. Problem statement
2.1. System description (absorption cycle)
Compared to a compression cooling cycle, the basic idea of anabsorption system is to replace the electricity consumption associ-ated with the vapor compression by a thermally driven absorp-tion–desorption system [4]. This is accomplished by making useof absorption and desorption processes that employ a suitableworking fluid pair. The working pair consists of a refrigerant andan absorbent. In this study, without loss of generality, an ammo-nia/water solution is used as working pair, with the ammoniabeing the refrigerant and water the absorbent.
Fig. 1 represents the considered absorption cycle in a pressure–temperature plot. The system provides chilled water for coolingapplications and is steam driven. The basic components are theabsorber (A), condenser (C), desorber (D) and evaporator (E). Thecycle also includes the refrigerant subcooler (SC), refrigerantexpansion valve (RV), solution heat exchanger (SHX), solutionpump (P), and solution expansion valve (SV). The high pressureequipments are the solution heat exchanger, desorber, and con-denser, whereas the low pressure ones are the evaporator andabsorber.
The system operation is as follows: The refrigerant in vaporphase (stream 14) coming from the subcooler (SC) is absorbed inthe absorber (A) by the diluted liquid solution (stream 6). The con-centrated solution (stream 1) leaving the absorber is pumped bypump (P) to reach a higher pressure (stream 2) before being pre-heated in the solution heat exchanger (SHX). Then, the solution(stream 3) enters the desorber, in which the desorption of ammo-nia takes place. In this work, only the stripping section of thedesorber is considered. Vapor refrigerant (stream 9) from thedesorber condenses completely in the condenser (C). The liquidrefrigerant (stream 10) from the condenser is then subcooled(stream 11) in the subcooler (SC) by the superheating stream
Fig. 1. Ammonia–water absorption cycle.
(stream 13) that comes from the evaporator (E). The liquid refrig-erant (stream 11) flows to the evaporator (E) through the refriger-ant expansion valve (RV). The weak liquid solution (stream 4) fromthe desorber returns back to the absorber (A) through the solutionheat exchanger (SHX), which preheats the concentrated solution(stream 2) before being introduced to the desorber. From the heatexchanger, the solution is finally sent to the expansion valve (SV),and then to the absorber (A).
Note that streams 15–22 are external heat transfer fluids. In ourcase, water is used for energy supply and energy extracting. Theuseful output energy is the heat extracted in the evaporator ðQ EÞ,whereas the input energy is supplied to the desorber ðQ DÞ. The sys-tem includes a low pressure steam boiler where the primary en-ergy resources are fossil fuels. For the sake of simplicity, theprocess of steam production has not been included in our model.However, the model could be easily modified in order to accountfor such a system.
Specifically, in this work we address the optimal design of anabsorption cooling cycle like the one described before underuncertainty in the energy cost. Given are the cooling capacityof the system, the inlet and outlet temperatures of the externalfluids and capital cost data. It is assumed that the energy costcannot be perfectly forecasted, and that its variability can berepresented by a set of scenarios with a given probability ofoccurrence. Hence, the goal of our study is to determine theoptimal design and associated operating conditions that simulta-neously minimize the total expected cost of the cycle and its risklevel.
Note that, in general, the impact that the energy cost variabilityhas in the overall economic performance of a process may varyfrom one type of industry to another, and will depend on the per-centage of the total expenses that are due to the energy consump-tion. Furthermore, the energy consumption of a process industryand hence the energy cost, can be properly tuned by adjustingthe associated design variables. Standard deterministic methodstend to optimize the economic performance of a process consider-ing mean energy cost values. Stochastic methods can lead to morerobust designs, in which the energy consumption is reduced in or-der to make the system less sensitive to fluctuations in the energyprice. This allows to decrease the probability of unfavorable sce-narios with large energy expenses.
3. Multi-objective stochastic model
This section introduces the mathematical model derived toaddress the problem described above. Specifically, in our work,the design task is posed as a multi-scenario bi-criteria NLP problemthat simultaneously minimizes the expected total cost of theinvestment and its risk level. The solution of this problem isdefined by a set of trade-off alternatives, each of which involvesdifferent structural and operating features. The choice of a sce-nario-based approach is motivated by the fact that it can deal withany type of probability distribution. This can be accomplished byusing sampling techniques, such as a Monte Carlo sampling, thatallow generating a set of representative scenarios from any typeof probability function.
The mathematical model of the cycle is based on the oneintroduced by the authors in [41]. The major difference betweenthe formulation presented in [41] and that described next is thatin the latter one the model only considers the stripping sectionof the distillation, as proposed by Roriz et al. [42]. Note thatsince the evaporation temperature is above 0 �C, the enrichmentprocess of ammonia in the rectification column does not bringsignificant performance improvement [43]. For the sake ofcompleteness of this work, we next discuss the main features
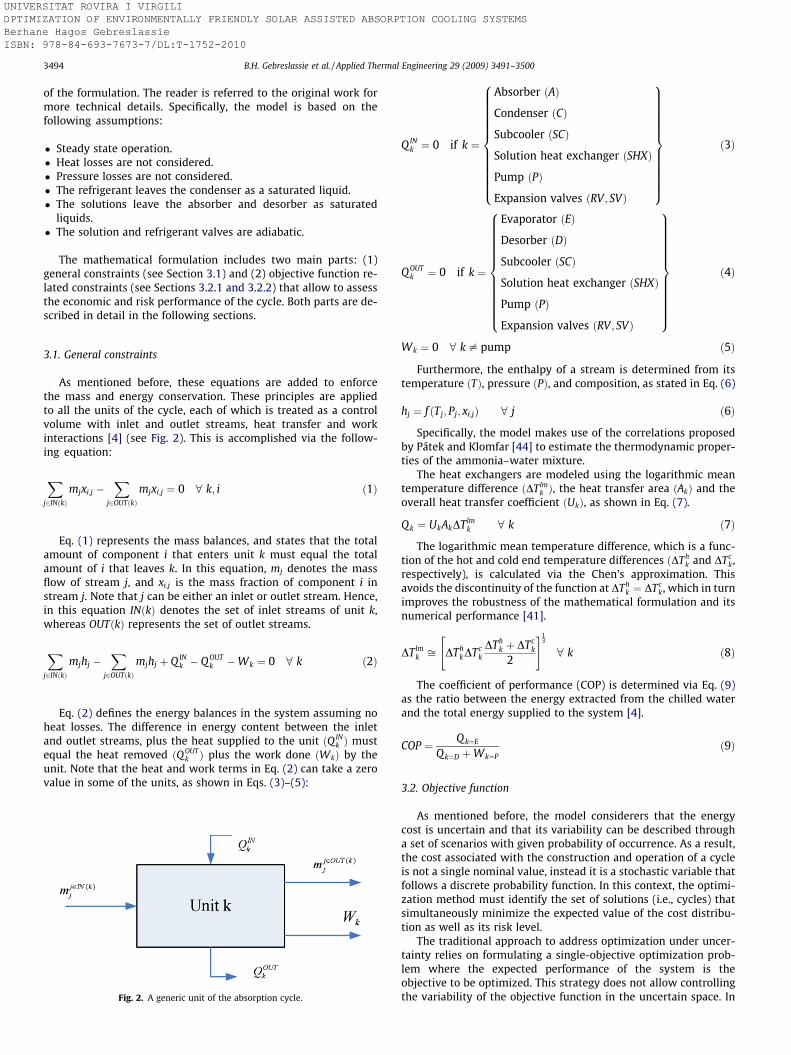
3494 B.H. Gebreslassie et al. / Applied Thermal Engineering 29 (2009) 3491–3500
UNIVERSITAT ROVIRA I VIRGILI OPTIMIZATION OF ENVIRONMENTALLY FRIENDLY SOLAR ASSISTED ABSORPTION COOLING SYSTEMS Berhane Hagos Gebreslassie ISBN: 978-84-693-7673-7/DL:T-1752-2010
of the formulation. The reader is referred to the original work formore technical details. Specifically, the model is based on thefollowing assumptions:
� Steady state operation.� Heat losses are not considered.� Pressure losses are not considered.� The refrigerant leaves the condenser as a saturated liquid.� The solutions leave the absorber and desorber as saturated
liquids.� The solution and refrigerant valves are adiabatic.
The mathematical formulation includes two main parts: (1)general constraints (see Section 3.1) and (2) objective function re-lated constraints (see Sections 3.2.1 and 3.2.2) that allow to assessthe economic and risk performance of the cycle. Both parts are de-scribed in detail in the following sections.
3.1. General constraints
As mentioned before, these equations are added to enforcethe mass and energy conservation. These principles are appliedto all the units of the cycle, each of which is treated as a controlvolume with inlet and outlet streams, heat transfer and workinteractions [4] (see Fig. 2). This is accomplished via the follow-ing equation:
Xj2INðkÞ
mjxi;j �X
j2OUTðkÞmjxi;j ¼ 0 8 k; i ð1Þ
Eq. (1) represents the mass balances, and states that the totalamount of component i that enters unit k must equal the totalamount of i that leaves k. In this equation, mj denotes the massflow of stream j, and xi;j is the mass fraction of component i instream j. Note that j can be either an inlet or outlet stream. Hence,in this equation INðkÞ denotes the set of inlet streams of unit k,whereas OUTðkÞ represents the set of outlet streams.
Xj2INðkÞ
mjhj �X
j2OUTðkÞmjhj þ Q IN
k � Q OUTk �Wk ¼ 0 8 k ð2Þ
Eq. (2) defines the energy balances in the system assuming noheat losses. The difference in energy content between the inletand outlet streams, plus the heat supplied to the unit ðQIN
k Þ mustequal the heat removed ðQ OUT
k Þ plus the work done ðWkÞ by theunit. Note that the heat and work terms in Eq. (2) can take a zerovalue in some of the units, as shown in Eqs. (3)–(5):
Fig. 2. A generic unit of the absorption cycle.
QINk ¼ 0 if k ¼
Absorber ðAÞ
Condenser ðCÞ
Subcooler ðSCÞ
Solution heat exchanger ðSHXÞ
Pump ðPÞ
Expansion valves ðRV ; SVÞ
8>>>>>>>>>>>><>>>>>>>>>>>>:
9>>>>>>>>>>>>=>>>>>>>>>>>>;
ð3Þ
QOUTk ¼ 0 if k ¼
Evaporator ðEÞ
Desorber ðDÞ
Subcooler ðSCÞ
Solution heat exchanger ðSHXÞ
Pump ðPÞ
Expansion valves ðRV ; SVÞ
8>>>>>>>>>>>><>>>>>>>>>>>>:
9>>>>>>>>>>>>=>>>>>>>>>>>>;
ð4Þ
Wk ¼ 0 8 k – pump ð5Þ
Furthermore, the enthalpy of a stream is determined from itstemperature ðTÞ, pressure ðPÞ, and composition, as stated in Eq. (6)
hj ¼ f ðTj; Pj; xi;jÞ 8 j ð6Þ
Specifically, the model makes use of the correlations proposedby Pátek and Klomfar [44] to estimate the thermodynamic proper-ties of the ammonia–water mixture.
The heat exchangers are modeled using the logarithmic meantemperature difference ðDTlm
k Þ, the heat transfer area ðAkÞ and theoverall heat transfer coefficient ðUkÞ, as shown in Eq. (7).
Qk ¼ UkAkDTlmk 8 k ð7Þ
The logarithmic mean temperature difference, which is a func-tion of the hot and cold end temperature differences ðDTh
k and DTck,
respectively), is calculated via the Chen’s approximation. Thisavoids the discontinuity of the function at DTh
k ¼ DTck, which in turn
improves the robustness of the mathematical formulation and itsnumerical performance [41].
DTlmk ffi DTh
kDTckDTh
k þ DTck
2
" #13
8 k ð8Þ
The coefficient of performance (COP) is determined via Eq. (9)as the ratio between the energy extracted from the chilled waterand the total energy supplied to the system [4].
COP ¼ Q k¼E
Qk¼D þWk¼Pð9Þ
3.2. Objective function
As mentioned before, the model considerers that the energycost is uncertain and that its variability can be described througha set of scenarios with given probability of occurrence. As a result,the cost associated with the construction and operation of a cycleis not a single nominal value, instead it is a stochastic variable thatfollows a discrete probability function. In this context, the optimi-zation method must identify the set of solutions (i.e., cycles) thatsimultaneously minimize the expected value of the cost distribu-tion as well as its risk level.
The traditional approach to address optimization under uncer-tainty relies on formulating a single-objective optimization prob-lem where the expected performance of the system is theobjective to be optimized. This strategy does not allow controllingthe variability of the objective function in the uncertain space. In
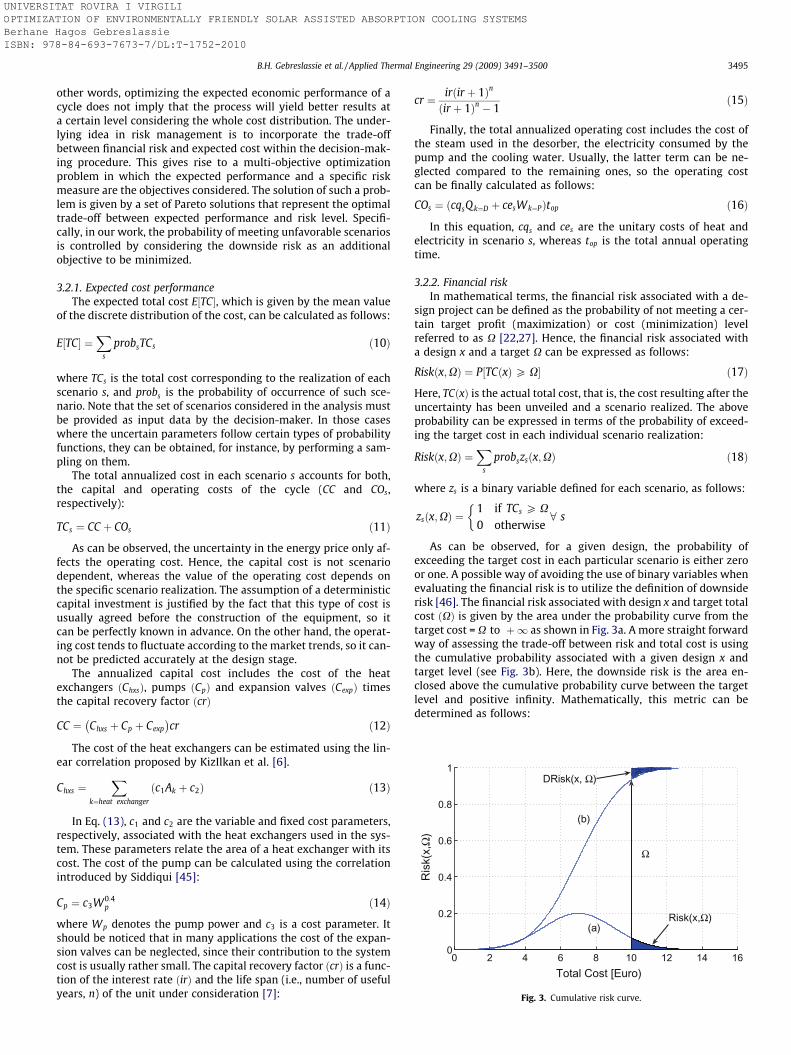
0 2 4 6 8 10 12 14 160
0.2
0.4
0.6
0.8
1
Ris
k(x,
Ω)
Total Cost [Euro)
Ω
Risk(x,Ω)
DRisk(x, Ω)
(a)
(b)
Fig. 3. Cumulative risk curve.
B.H. Gebreslassie et al. / Applied Thermal Engineering 29 (2009) 3491–3500 3495
UNIVERSITAT ROVIRA I VIRGILI OPTIMIZATION OF ENVIRONMENTALLY FRIENDLY SOLAR ASSISTED ABSORPTION COOLING SYSTEMS Berhane Hagos Gebreslassie ISBN: 978-84-693-7673-7/DL:T-1752-2010
other words, optimizing the expected economic performance of acycle does not imply that the process will yield better results ata certain level considering the whole cost distribution. The under-lying idea in risk management is to incorporate the trade-offbetween financial risk and expected cost within the decision-mak-ing procedure. This gives rise to a multi-objective optimizationproblem in which the expected performance and a specific riskmeasure are the objectives considered. The solution of such a prob-lem is given by a set of Pareto solutions that represent the optimaltrade-off between expected performance and risk level. Specifi-cally, in our work, the probability of meeting unfavorable scenariosis controlled by considering the downside risk as an additionalobjective to be minimized.
3.2.1. Expected cost performanceThe expected total cost E½TC�, which is given by the mean value
of the discrete distribution of the cost, can be calculated as follows:
E½TC� ¼X
s
probsTCs ð10Þ
where TCs is the total cost corresponding to the realization of eachscenario s, and probs is the probability of occurrence of such sce-nario. Note that the set of scenarios considered in the analysis mustbe provided as input data by the decision-maker. In those caseswhere the uncertain parameters follow certain types of probabilityfunctions, they can be obtained, for instance, by performing a sam-pling on them.
The total annualized cost in each scenario s accounts for both,the capital and operating costs of the cycle (CC and COs,respectively):
TCs ¼ CC þ COs ð11Þ
As can be observed, the uncertainty in the energy price only af-fects the operating cost. Hence, the capital cost is not scenariodependent, whereas the value of the operating cost depends onthe specific scenario realization. The assumption of a deterministiccapital investment is justified by the fact that this type of cost isusually agreed before the construction of the equipment, so itcan be perfectly known in advance. On the other hand, the operat-ing cost tends to fluctuate according to the market trends, so it can-not be predicted accurately at the design stage.
The annualized capital cost includes the cost of the heatexchangers ðChxsÞ, pumps ðCpÞ and expansion valves ðCexpÞ timesthe capital recovery factor ðcrÞ
CC ¼ Chxs þ Cp þ Cexp� �
cr ð12Þ
The cost of the heat exchangers can be estimated using the lin-ear correlation proposed by KizIlkan et al. [6].
Chxs ¼X
k¼heat exchanger
c1Ak þ c2ð Þ ð13Þ
In Eq. (13), c1 and c2 are the variable and fixed cost parameters,respectively, associated with the heat exchangers used in the sys-tem. These parameters relate the area of a heat exchanger with itscost. The cost of the pump can be calculated using the correlationintroduced by Siddiqui [45]:
Cp ¼ c3W0:4p ð14Þ
where Wp denotes the pump power and c3 is a cost parameter. Itshould be noticed that in many applications the cost of the expan-sion valves can be neglected, since their contribution to the systemcost is usually rather small. The capital recovery factor ðcrÞ is a func-tion of the interest rate ðirÞ and the life span (i.e., number of usefulyears, n) of the unit under consideration [7]:
cr ¼ irðir þ 1Þn
ðir þ 1Þn � 1ð15Þ
Finally, the total annualized operating cost includes the cost ofthe steam used in the desorber, the electricity consumed by thepump and the cooling water. Usually, the latter term can be ne-glected compared to the remaining ones, so the operating costcan be finally calculated as follows:
COs ¼ cqsQk¼D þ cesWk¼Pð Þtop ð16Þ
In this equation, cqs and ces are the unitary costs of heat andelectricity in scenario s, whereas top is the total annual operatingtime.
3.2.2. Financial riskIn mathematical terms, the financial risk associated with a de-
sign project can be defined as the probability of not meeting a cer-tain target profit (maximization) or cost (minimization) levelreferred to as X [22,27]. Hence, the financial risk associated witha design x and a target X can be expressed as follows:
Riskðx;XÞ ¼ P½TCðxÞP X� ð17Þ
Here, TCðxÞ is the actual total cost, that is, the cost resulting after theuncertainty has been unveiled and a scenario realized. The aboveprobability can be expressed in terms of the probability of exceed-ing the target cost in each individual scenario realization:
Riskðx;XÞ ¼X
s
probszsðx;XÞ ð18Þ
where zs is a binary variable defined for each scenario, as follows:
zsðx;XÞ ¼1 if TCs P X
0 otherwise
�8 s
As can be observed, for a given design, the probability ofexceeding the target cost in each particular scenario is either zeroor one. A possible way of avoiding the use of binary variables whenevaluating the financial risk is to utilize the definition of downsiderisk [46]. The financial risk associated with design x and target totalcost ðXÞ is given by the area under the probability curve from thetarget cost = X to þ1 as shown in Fig. 3a. A more straight forwardway of assessing the trade-off between risk and total cost is usingthe cumulative probability associated with a given design x andtarget level (see Fig. 3b). Here, the downside risk is the area en-closed above the cumulative probability curve between the targetlevel and positive infinity. Mathematically, this metric can bedetermined as follows:

Table 1Process data of the absorption cooling cycle.
Heat transfer coefficients U kWm2 K
h iand temperature data (�C) Ref. [41]
Desorber heating steam temperature (�C) 110Cost data Ref. [41]Operation time per year (h) 1000
3496 B.H. Gebreslassie et al. / Applied Thermal Engineering 29 (2009) 3491–3500
UNIVERSITAT ROVIRA I VIRGILI OPTIMIZATION OF ENVIRONMENTALLY FRIENDLY SOLAR ASSISTED ABSORPTION COOLING SYSTEMS Berhane Hagos Gebreslassie ISBN: 978-84-693-7673-7/DL:T-1752-2010
DRiskðx;XÞ ¼X
s
probsdsðx;XÞ ð19Þ
where dðx;XÞ is a positive variable that measures the deviation froma target X, that is:
dsðx;XÞP TCs �X 8 s ð20Þ
Notice that the downside risk is a continuous linear measurethat does not require the definition of binary variables. This is ahighly desirable property to potentially reduce the computationalrequirements of the models to manage risk.
3.3. Remarks
� The model presented accounts for the minimization of theexpected total annualized cost of the cycle. To calculate the costassociated with a given time horizon, it suffices to multiply theannualized cost with the corresponding number of years. Notethat the results of the optimization problem do not depend onthe number of periods considered in the study, since the numberof years is a constant value and hence can be removed from theobjective function without affecting the calculations.
� By performing some algebraic transformations on the economicobjective function of the model, it can be shown that minimizingthe expected total cost is equivalent to minimizing the cost inthe mean scenario, assuming that the same energy consumptionis attained in all the scenarios:
E½TC� ¼X
s
probsTCs
¼X
s
probs½CC þ cqsQ k¼D þ cesWk¼Pð Þtop�
¼X
s
probsCC þX
s
probscqsQ k¼Dtop þX
s
probscesWk¼Ptop
¼ CCX
s
probs þ Q k¼Dtop
Xs
probscqs þWk¼Ptop
Xs
probsces
¼ CC þ Q k¼Dtopcq þWk¼Ptopce ð21Þ
Here, cq and ce represent the expected values of the energy andelectricity cost, respectively. In practice, it is convenient to re-place constraint (10) by Eq. (21) in order to achieve a betternumerical performance. Note that this simplification assumesthat the operating conditions of the cycle are fixed once the de-sign is decided on (i.e. Qk is equal in all scenarios).
� As shown in [37], both the financial risk and downside risk canbe effectively manipulated by minimizing the worst case (i.e.,the total cost in the most unfavorable scenario). The worst caseposses also the desired property of avoiding the definition ofauxiliary binary variables.
� The model presented can handle uncertainties in any of the coef-ficients of the objective function, including the capital cost. Thisrepresents an important feature of the proposed approach.
� In those cases in which the uncertain coefficients follow specifictypes of probability functions (see [47]), it is possible to applychance constrained programming techniques to perform an ana-lytical integration of the probabilistic constraint defined by Eq.(17).
4. Solution method
The design task is finally posed as a bi-criteria non-linear pro-gramming (NLP) problem of the following form:
ðMÞ minx
U ¼ fE½TC�;DRiskg
s:t: constraints ð1Þ—ð16Þ; ð19Þ and ð20Þð22Þ
The solution to this problem is given by a set of efficient orPareto optimal points representing alternative process designs,each achieving a unique combination of economic performanceand downside risk. For the calculation of the Pareto set of (M),two main methods exist in the literature. These are theweighted-sum method and the �-constraint method [48]. Theweighted-sum method is only rigorous for problems with convexPareto sets, whereas the epsilon constraint ð�-constraint) methodis rigorous for both, the convex and non-convex cases. In general,the thermodynamic correlations used to determine the enthalpiesin model (M) will add non-convexities in the mathematical formu-lation. Thus, the �-constraint method is better suited to ourproblem.
This method is based on formulating an auxiliary model (MA),which is obtained by transferring one of the objectives of the origi-nal problem (M) to an additional constraint. This constraintimposes an upper limit on the value of the secondary objective.Model (MA) is then solved for different values of the auxiliaryparameter � in order to generate the entire Pareto set of solutions:
ðMAÞ minx
E½TC�
s:t: DRiskðx;XÞ 6 �constraints ð1Þ—ð16Þ; ð19Þ and ð20Þ
ð23Þ
The extreme points of the search interval of � ð� 2 ½�; ��Þ, can bedetermined by optimizing each single objective separately.
5. Case study
The capabilities of our approach are illustrated through a casestudy that addresses the design of a typical absorption cooling sys-tem (see Fig. 1). The system is an absorption cooling cycle drivenby low grade heat that utilizes ammonia–water as working pair.The input data of the problem, which includes the cooling capacityof the cycle and the external fluid (water) temperatures, are givenin Table 1. A time horizon of 15 years was considered, so the annu-alized total cost was multiplied by 15 in the calculations. Note that,as commented before, the consideration of a specific time horizondoes not affect the output of the optimization model.
The uncertain parameters (i.e., steam and electricity cost) weredescribed through 100 equiprobable scenarios that were generatedby performing a Monte Carlo sampling on a set of Gaussian prob-ability functions. Specifically, we considered five distributions withmean values 1, 1.5, 2, 2.5 and 3 times larger than the nominal en-ergy cost used in [41]. All these distributions assumed a standarddeviation of 30 %. Figs. 4a and b show the histogram of frequenciesassociated with the resulting discrete probability distributions thatcharacterize the heat and electricity cost.
6. Results and discussion
The problem was implemented in the modeling system GAMS[49] interfacing with CONOPT [50] as main optimization package.The resulting optimization problem features 713 continuous vari-ables and 821 constraints. In general, the number of variablesand constraints of the model is a function of the number of scenar-
Other data Ref. [41]
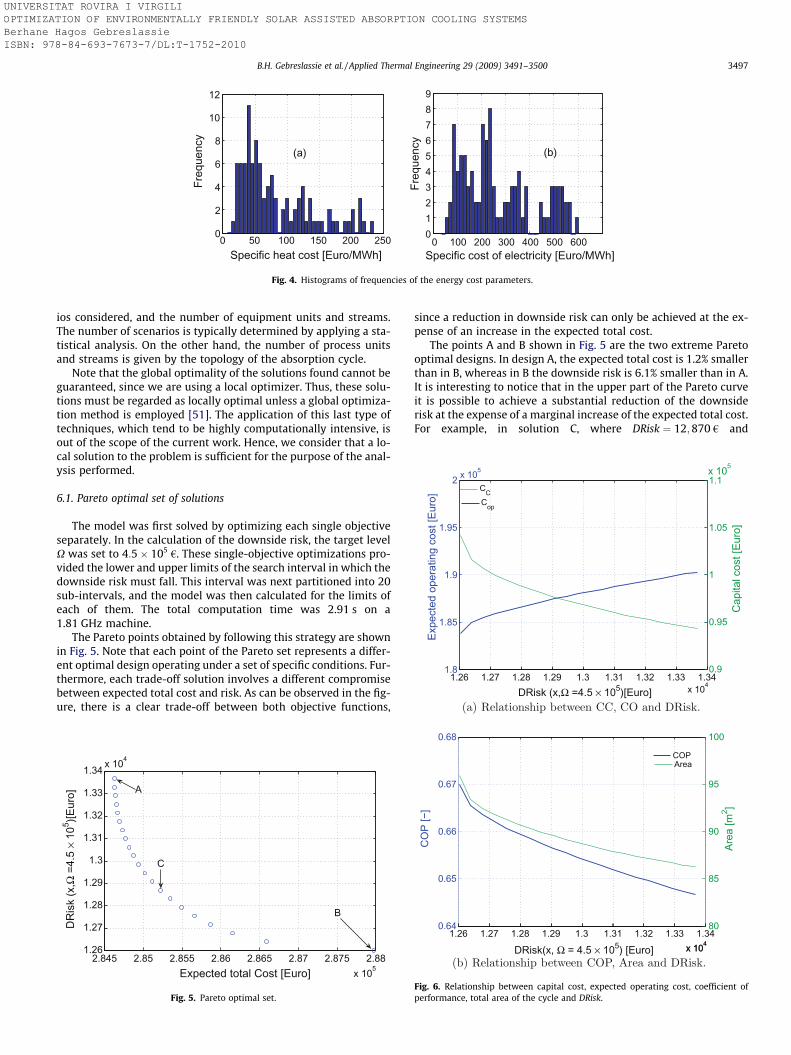
0 50 100 150 200 2500
2
4
6
8
10
12
Specific heat cost [Euro/MWh]
Freq
uenc
y
0 100 200 300 400 500 6000123456789
Specific cost of electricity [Euro/MWh]
Freq
uenc
y
(a) (b)
Fig. 4. Histograms of frequencies of the energy cost parameters.
1.26 1.27 1.28 1.29 1.3 1.31 1.32 1.33 1.34x 10⁴
1.8
1.85
1.9
1.95
2 x 10⁵
Expe
cted
ope
ratin
g co
st [E
uro]
DRisk (x,Ω =4.5 × 10⁵)[Euro]
0.9
0.95
1
1.05
1.1x 10⁵
Cap
ital c
ost [
Euro
]
Cop
CC
B.H. Gebreslassie et al. / Applied Thermal Engineering 29 (2009) 3491–3500 3497
UNIVERSITAT ROVIRA I VIRGILI OPTIMIZATION OF ENVIRONMENTALLY FRIENDLY SOLAR ASSISTED ABSORPTION COOLING SYSTEMS Berhane Hagos Gebreslassie ISBN: 978-84-693-7673-7/DL:T-1752-2010
ios considered, and the number of equipment units and streams.The number of scenarios is typically determined by applying a sta-tistical analysis. On the other hand, the number of process unitsand streams is given by the topology of the absorption cycle.
Note that the global optimality of the solutions found cannot beguaranteed, since we are using a local optimizer. Thus, these solu-tions must be regarded as locally optimal unless a global optimiza-tion method is employed [51]. The application of this last type oftechniques, which tend to be highly computationally intensive, isout of the scope of the current work. Hence, we consider that a lo-cal solution to the problem is sufficient for the purpose of the anal-ysis performed.
6.1. Pareto optimal set of solutions
The model was first solved by optimizing each single objectiveseparately. In the calculation of the downside risk, the target levelX was set to 4:5� 105 €. These single-objective optimizations pro-vided the lower and upper limits of the search interval in which thedownside risk must fall. This interval was next partitioned into 20sub-intervals, and the model was then calculated for the limits ofeach of them. The total computation time was 2.91 s on a1.81 GHz machine.
The Pareto points obtained by following this strategy are shownin Fig. 5. Note that each point of the Pareto set represents a differ-ent optimal design operating under a set of specific conditions. Fur-thermore, each trade-off solution involves a different compromisebetween expected total cost and risk. As can be observed in the fig-ure, there is a clear trade-off between both objective functions,
2.845 2.85 2.855 2.86 2.865 2.87 2.875 2.88x 10⁵
1.26
1.27
1.28
1.29
1.3
1.31
1.32
1.33
1.34 x 10⁴
Expected total Cost [Euro]
DR
isk
(x,Ω
=4.
5 ×
105 )[E
uro]
B
C
A
Fig. 5. Pareto optimal set.
since a reduction in downside risk can only be achieved at the ex-pense of an increase in the expected total cost.
The points A and B shown in Fig. 5 are the two extreme Paretooptimal designs. In design A, the expected total cost is 1.2% smallerthan in B, whereas in B the downside risk is 6.1% smaller than in A.It is interesting to notice that in the upper part of the Pareto curveit is possible to achieve a substantial reduction of the downsiderisk at the expense of a marginal increase of the expected total cost.For example, in solution C, where DRisk ¼ 12;870 € and
1.26 1.27 1.28 1.29 1.3 1.31 1.32 1.33 1.34x 10⁴
0.64
0.65
0.66
0.67
0.68
CO
P [−
]
DRisk(x, Ω = 4.5 × 10⁵) [Euro] x 104
80
85
90
95
100Ar
ea [m
2 ]
COPArea
Fig. 6. Relationship between capital cost, expected operating cost, coefficient ofperformance, total area of the cycle and DRisk.
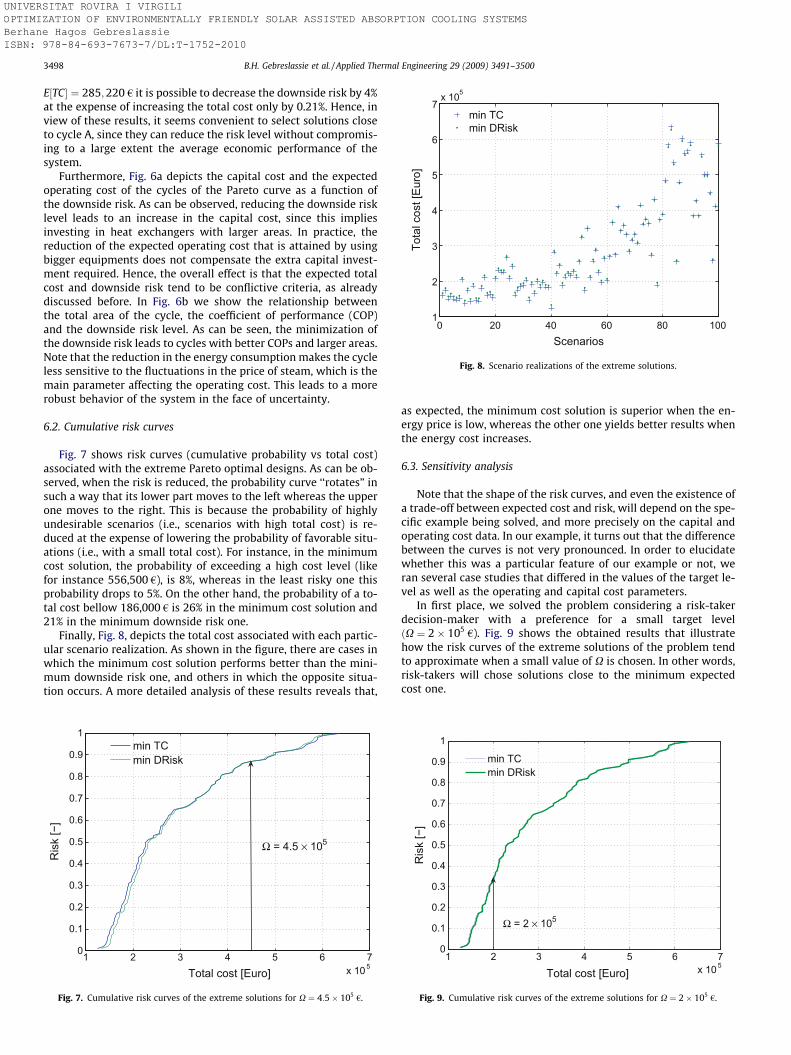
0 20 40 60 80 1001
2
3
4
5
6
7x 10⁵
Scenarios
Tot
al c
ost [
Euro
]
min TCmin DRisk
Fig. 8. Scenario realizations of the extreme solutions.
3498 B.H. Gebreslassie et al. / Applied Thermal Engineering 29 (2009) 3491–3500
UNIVERSITAT ROVIRA I VIRGILI OPTIMIZATION OF ENVIRONMENTALLY FRIENDLY SOLAR ASSISTED ABSORPTION COOLING SYSTEMS Berhane Hagos Gebreslassie ISBN: 978-84-693-7673-7/DL:T-1752-2010
E½TC� ¼ 285;220 € it is possible to decrease the downside risk by 4%at the expense of increasing the total cost only by 0.21%. Hence, inview of these results, it seems convenient to select solutions closeto cycle A, since they can reduce the risk level without compromis-ing to a large extent the average economic performance of thesystem.
Furthermore, Fig. 6a depicts the capital cost and the expectedoperating cost of the cycles of the Pareto curve as a function ofthe downside risk. As can be observed, reducing the downside risklevel leads to an increase in the capital cost, since this impliesinvesting in heat exchangers with larger areas. In practice, thereduction of the expected operating cost that is attained by usingbigger equipments does not compensate the extra capital invest-ment required. Hence, the overall effect is that the expected totalcost and downside risk tend to be conflictive criteria, as alreadydiscussed before. In Fig. 6b we show the relationship betweenthe total area of the cycle, the coefficient of performance (COP)and the downside risk level. As can be seen, the minimization ofthe downside risk leads to cycles with better COPs and larger areas.Note that the reduction in the energy consumption makes the cycleless sensitive to the fluctuations in the price of steam, which is themain parameter affecting the operating cost. This leads to a morerobust behavior of the system in the face of uncertainty.
6.2. Cumulative risk curves
Fig. 7 shows risk curves (cumulative probability vs total cost)associated with the extreme Pareto optimal designs. As can be ob-served, when the risk is reduced, the probability curve ‘‘rotates” insuch a way that its lower part moves to the left whereas the upperone moves to the right. This is because the probability of highlyundesirable scenarios (i.e., scenarios with high total cost) is re-duced at the expense of lowering the probability of favorable situ-ations (i.e., with a small total cost). For instance, in the minimumcost solution, the probability of exceeding a high cost level (likefor instance 556,500 €), is 8%, whereas in the least risky one thisprobability drops to 5%. On the other hand, the probability of a to-tal cost bellow 186,000 € is 26% in the minimum cost solution and21% in the minimum downside risk one.
Finally, Fig. 8, depicts the total cost associated with each partic-ular scenario realization. As shown in the figure, there are cases inwhich the minimum cost solution performs better than the mini-mum downside risk one, and others in which the opposite situa-tion occurs. A more detailed analysis of these results reveals that,
1 2 3 4 5 6 7x 10⁵
0
0.1
0.2
0.3
0.4
0.5
0.6
0.7
0.8
0.9
1
Total cost [Euro]
Ris
k [−
]
min TCmin DRisk
Ω = 4.5 × 10⁵
Fig. 7. Cumulative risk curves of the extreme solutions for X ¼ 4:5� 105 €.
as expected, the minimum cost solution is superior when the en-ergy price is low, whereas the other one yields better results whenthe energy cost increases.
6.3. Sensitivity analysis
Note that the shape of the risk curves, and even the existence ofa trade-off between expected cost and risk, will depend on the spe-cific example being solved, and more precisely on the capital andoperating cost data. In our example, it turns out that the differencebetween the curves is not very pronounced. In order to elucidatewhether this was a particular feature of our example or not, weran several case studies that differed in the values of the target le-vel as well as the operating and capital cost parameters.
In first place, we solved the problem considering a risk-takerdecision-maker with a preference for a small target levelðX ¼ 2� 105 €). Fig. 9 shows the obtained results that illustratehow the risk curves of the extreme solutions of the problem tendto approximate when a small value of X is chosen. In other words,risk-takers will chose solutions close to the minimum expectedcost one.
1 2 3 4 5 6 7x 10⁵
0
0.1
0.2
0.3
0.4
0.5
0.6
0.7
0.8
0.9
1
Total cost [Euro]
Ris
k [−
]
min TCmin DRisk
Ω = 2 × 10⁵
Fig. 9. Cumulative risk curves of the extreme solutions for X ¼ 2� 105 €.

0 0.5 1 1.5 2 2.5x 10⁶
0
0.1
0.2
0.3
0.4
0.5
0.6
0.7
0.8
0.9
1
Total cost [Euro]
Ris
k [−
]
min TCmin DRisk
Ω = 1.6 × 10⁶
2 3 4 5 6 7 8x 10 5
0
0.1
0.2
0.3
0.4
0.5
0.6
0.7
0.8
0.9
1
Total cost [Euro]
Ris
k [−
]
min TCmin DRisk
Ω = 5.5 × 10⁵
Fig. 10. Cumulative risk curves of the extreme solutions for top ¼ 4000 h anddoubled CC.
B.H. Gebreslassie et al. / Applied Thermal Engineering 29 (2009) 3491–3500 3499
UNIVERSITAT ROVIRA I VIRGILI OPTIMIZATION OF ENVIRONMENTALLY FRIENDLY SOLAR ASSISTED ABSORPTION COOLING SYSTEMS Berhane Hagos Gebreslassie ISBN: 978-84-693-7673-7/DL:T-1752-2010
To study the impact that the operation and capital cost have inthe risk curves, we next solved two examples which differed in theoperating times and capital cost coefficients. In the first case, weconsidered an annual operating time of 4000 h per year in orderto increase the weigh of the operating cost in the total cost ofthe system. The target level for this case was fixed toX ¼ 1:6� 106 €. Given this data, the model tries to minimize theoperating cost by investing in equipments with larger areas. As aresult, the trade-off between expected total cost and downside riskis small, since the areas of the heat exchangers are already large inorder to minimize the energy consumption. Consequently, thecumulative risk curves of the extreme solutions are quite close,as depicted in Fig. 10a.
In the second example we doubled the coefficients of the capitalcosts and set X ¼ 5:5� 105 €. In this case, the optimization modelminimizes the capital cost by investing in smaller heat exchangers,since they represent a large percentage of the total cost. As a result,the trade-off between expected cost and downside risk is morepronounced, and the risk curves move away, as shown in Fig. 10b.
As can be observed, in all the cases the probability curves of theextreme solutions are quite close. Hence, in view of these numer-
ical results and in the absence of a more rigorous theoretical anal-ysis, we conclude that the design problem is per se quite rigid (i.e.,it is difficult to manipulate the risk associated with the invest-ment). This might be attributed to the inherent trade-off that nat-urally exists between the capital and operating cost of anabsorption cycle (i.e., to reduce the operating cost it is necessaryto invest in larger equipments). In any case, as discussed andshown before, the risk level can still be manipulated to a certainextent by properly varying the areas of the equipments. This isan interesting insight that we get from the stochastic model, whichshows how the optimal design of an absorption cycle is not verymuch affected by the uncertainty in the energy cost, since the po-tential savings that can be achieved by decreasing the energy con-sumption are compensated by the required increase in the capitalinvestment. We should note, however, that such a conclusionstrongly depends on the input data of the model.
7. Conclusions
This work has presented a systematic approach for the design ofabsorption cooling cycles under uncertainty in the energy cost. Thedesign task has been formulated as a bi-criteria stochastic NLPmodel that seeks to minimize the expected total cost and the asso-ciated risk. The latter criterion has been measured by the downsiderisk, which avoids the definition of binary variables thus leading tobetter numerical performance. The solution to the problem is givenby a set of Pareto optimal solutions that trade-off the objectivesconsidered in the analysis. In this work, these solutions have beencalculated via the epsilon constraint method.
The capabilities of the proposed modeling framework and solu-tion strategy have been illustrated through the design of a typicalabsorption cooling system. It has been clearly shown that reductionsin the downside risk can be attained by slightly increasing the ex-pected cost of the cycle. This can be achieved by investing in heatexchangers with larger areas, which lowers energy consumption thusmaking the cycle less sensitive to fluctuations in the energy price.
Acknowledgements
Berhane H. Gebreslassie expresses his gratitude for the financialsupport received from the University Rovira i Virgili. The authorsalso wish to acknowledge support of this research work from theSpanish Ministry of Education and Science (Projects DPI2008-04099, PHB2008-0090-PC and BFU2008- 863 00196) and the Span-ish Ministry of External Affairs (Projects A/8502/07, HS2007- 8640006 and A/020104/08).
References
[1] Q.G. Lin, G.H. Huang, B. Bass, X.S. Qin, IFTEM: an interval-fuzzy two-stagestochastic optimization model for regional energy systems planning underuncertainty, Energy Policy 37 (3) (2009) 868–878.
[2] Y.P. Cai, G.H. Huang, Z.F. Yang, Q. Tan, Identification of optimal strategies forenergy management systems planning under multiple uncertainties, AppliedEnergy 86 (4) (2009) 480–495.
[3] J.T. McMullan, Refrigeration and the environment – issues and strategies forthe future, International Journal of Refrigeration 25 (2002) 89–99.
[4] K.E. Herold, R. Radermacher, S.A. Klein, Absorption Chillers and Heat Pumps,CRC Press, 1996.
[5] R.D. Misra, P.K. Sahoo, A. Gupta, Thermoeconomic evaluation and optimizationof an aqua–ammonia vapour-absorption refrigeration system, InternationalJournal of Refrigeration 29 (2006) 47–59.
[6] . KizIlkan, A. Sencan, S.A. Kalogirou, Thermoeconomic optimization of a LiBrabsorption refrigeration system, Chemical Engineering and Processing: ProcessIntensification 46 (2007) 1376–1384.
[7] A. Bejan, G. Tsatsaronis, M. Moran, Thermal Design & Optimization, John Wiley& Sons Inc., 1996.
[8] I.E. Grossmann, J.A. Caballero, H. Yeomans, Mathematical programmingapproaches for the synthesis of chemical process systems, Korean Journal ofChemical Engineering 16 (1999) 407.

3500 B.H. Gebreslassie et al. / Applied Thermal Engineering 29 (2009) 3491–3500
UNIVERSITAT ROVIRA I VIRGILI OPTIMIZATION OF ENVIRONMENTALLY FRIENDLY SOLAR ASSISTED ABSORPTION COOLING SYSTEMS Berhane Hagos Gebreslassie ISBN: 978-84-693-7673-7/DL:T-1752-2010
[9] L.T. Biegler, A.W. Westerberg, I.E. Grossmann, Systematic Methods of ChemicalProcess Design, Prentice-Hall, PTR, NJ, 1997.
[10] L.M. Chavez-Islas, C.L. Heard, I.E. Grossmann, Synthesis and optimization of anammonia–water absorption refrigeration cycle considering different types ofheat exchangers by application of mixed-integer nonlinear programming,Industrial & Engineering Chemistry Research 48 (6) (2009) 2972–2990.
[11] L.M. Chavez-Islas, C.L. Heard, Optimization of a simple ammonia–waterabsorption refrigeration cycle by application of mixed-integer nonlinearprogramming, Industrial & Engineering Chemistry Research 48 (4) (2009)1957–1972.
[12] T. Savola, T-M. Tveit, C-J. Fogelholm, A MINLP model including the pressurelevels and multiperiods for CHP process optimisation, Applied ThermalEngineering 27 (11–12) (2007) 1857–1867.
[13] T. Savola, C-J. Fogelholm, Minlp optimisation model for increased powerproduction in small-scale CHP plants, Applied Thermal Engineering 27 (1)(2007) 89–99.
[14] J. Wang, Y. Dai, G. Lin, Parametric analysis and optimization for a combinedpower and refrigeration cycle, Applied Energy 85 (11) (2008) 1071–1085.
[15] G.Q. Zhang, L. Wang, L. Liu, Z. Wang, Thermoeconomic optimization of smallsize central air conditioner, Applied Thermal Engineering 24 (4) (2004) 471–485.
[16] Z. Yang, S.G. Zhang, H.B. Zhao, Optimization study of combined refrigerationcycles driven by an engine, Applied Energy 76 (4) (2003) 379–389.
[17] L. Ahlby, D. Hodgett, T. Berntsson, Optimization study of the compressionabsorption cycle, International Journal of Refrigeration-Revue InternationaleDu Froid 14 (1) (1991) 16–23.
[18] S.W. Wallace, S-E. Fleten, A. Ruszczynski, A. Shapiro, Stochastic programmingmodels in energy, Handbooks in Operations Research and ManagementScience, vol. 10, Elsevier, 2003, pp. 637–677.
[19] N.V. Sahinidis, Optimization under uncertainty: state-of-the-art andopportunities, Computers & Chemical Engineering 28 (6–7) (2004) 971–983.
[20] M. Sadeghi, H.M. Hosseini, Energy supply planning in iran by using fuzzy linearprogramming approach (regarding uncertainties of investment costs), EnergyPolicy 34 (9) (2006) 993–1003.
[21] E. Svensson, T. Berntsson. Economy and CO2 emissions trade-off: a systematicapproach for optimizing investments in process integration measures underuncertainty. Applied Thermal Engineering, in press, doi:10.1016/j.applthermaleng.2009.02.010 (Corrected Proof).
[22] G. Guillen, F.D. Mele, M.J. Bagajewicz, A. Espuna, L. Puigjaner, Multiobjectivesupply chain design under uncertainty, Chemical Engineering Science 60 (6)(2005) 1535–1553.
[23] S. Subrahmanyam, J.F. Pekny, G.V. Reklaitis, Design of batch chemical plantsunder market uncertainty, Industrial & Engineering Chemistry Research 33(11) (1994) 2688–2701.
[24] R. Lahdelma, S. Makkonen, P. Salminen, Two ways to handle dependentuncertainties in multi-criteria decision problems, Omega 37 (1) (2009) 79–92.
[25] I.N. Durbach, T.J. Stewart, Using expected values to simplify decision makingunder uncertainty, Omega 37 (2) (2009) 312–330.
[26] A. Azaron, K.N. Brown, S.A. Tarim, M. Modarres, A multi-objective stochasticprogramming approach for supply chain design considering risk, InternationalJournal of Production Economics 116 (1) (2008) 129–138.
[27] A. Barbaro, M.J. Bagajewicz, Managing financial risk in planning underuncertainty, AIChE Journal 50 (5) (2004) 963–989.
[28] A. Gupta, C.D. Maranas, Managing demand uncertainty in supply chainplanning, Computers & Chemical Engineering 27 (8–9) (2003) 1219–1227.
[29] G. Mavrotas, H. Demertzis, A. Meintani, D. Diakoulaki, Energy planning inbuildings under uncertainty in fuel costs: the case of a hotel unit in greece,Energy Conversion and Management 44 (8) (2003) 1303–1321.
[30] R. Yokoyama, K. Ito, Optimal design of energy supply systems based on relativerobustness criterion, Energy Conversion and Management 43 (4) (2002) 499–514.
[31] S.B. Petkov, C.D. Maranas, Design of multiproduct batch plants under demanduncertainty with staged capacity expansions, Computers & ChemicalEngineering 22 (Supp. 1) (1998) S789–S792.
[32] E. Svensson, T. Berntsson, A.B. Strömberg, M. Patriksson, An optimizationmethodology for identifying robust process integration investments underuncertainty, Energy Policy 37 (2) (2009) 680–685.
[33] H.S. Wellons, G.V. Reklaitis, The design of multiproduct batch plants underuncertainty with staged expansion, Computers & Chemical Engineering 13(1989) 115–126.
[34] J. Acevedo, E.N. Pistikopoulos, Stochastic optimisation based algorithms forprocess synthesis under uncertainty, Computers & Chemical Engineering 22(1998) 647–671.
[35] D.M. Cao, X.G. Yuan, Optimal design of batch plants with uncertain demandsconsidering switch over of operating modes of parallel units, Industrial andEngineering Chemistry Research 41 (2002) 4616–4625.
[36] S.B. Petkov, C.D. Maranas, Multiperiod planning and scheduling ofmultipurpose batch plants under demand uncertainty, Industrial andEngineering Chemistry Research 36 (1997) 4864–4881.
[37] A. Bonfill, M. Bagajewicz, A. Espuna, L. Puigjaner, Risk management inscheduling of batch plants under uncertain market demand, Industrial andEngineering Chemistry Research 43 (2004) 741–750.
[38] J. Balasubramanian, I.E. Grossmann, Approximation to multistage stochasticoptimization in multiperiod batch plant scheduling under demanduncertainty, Industrial and Engineering Chemistry Research 43 (2004) 3695–3713.
[39] F. You, I.E. Grossmann, in: L.G. Papageorgiou, M.C. Georgiadis (Eds.), OptimalDesign and Operational Planning of Responsive Process Supply Chains, SupplyChain Optimization, vol. 3, Wiley-VCH, Weinheim, 2007 (Book chapter inProcess System Engineering).
[40] R.P. Taylor, B.K. Hodge, C.A. James, Estimating uncertainty in thermal systemsanalysis and design, Applied Thermal Engineering 19 (1) (1999) 51–73.
[41] B.H. Gebreslassie, G. Guillen-Gosalbez, J. Laureano, D. Boer, Design ofenvironmentally conscious absorption cooling systems via multi-objectiveoptimization and life cycle assessment, Applied Energy 86 (9) (2009) 1712–1722.
[42] L. Roriz, A. Mortal, L.F. Mendes, Study of a plate heat exchanger desorber with aspray column for a small solar powered absorption machine, in: 3rdInternational Conference on Heat Powered Cycles, HPC, Cyprus, 2004.
[43] J. Fernández-Seara, J. Sieres, The importance of the ammonia purificationprocess in ammonia–water absorption systems, Energy Conversion andManagement 47 (13–14) (2006) 1975–1987.
[44] J. Pátek, J. Klomfar, Simple functions for fast calculations of selectedthermodynamic properties of the ammonia–water system, InternationalJournal of Refrigeration 18 (1995) 228–234.
[45] M.A. Siddiqui, Economic analyses of absorption systems: part A – design andcost evaluation, Energy Conversion and Management 38 (1997)889–904.
[46] G.D. Eppen, R.K. Martin, L. Schrage, A scenario approach to capacity planning,Operations Research 37 (4) (1989) 517–527.
[47] S.L. Janak, X. Lin, C.A. Floudas, A new robust optimization approach forscheduling under uncertainty: II. uncertainty with known probabilitydistribution, Computers & Chemical Engineering 31 (3) (2007) 171–195.
[48] M. Ehrgott, Multicriteria Optimization, Springer, 2000.[49] A. Brooke, D. Kendrik, A. Meeraus, R. Raman, R.E. Rosenthal, GAMS-A User’s
Guide, GAMS Development Corporation, Washington, 1998.[50] A. Drud, CONOPT Solver Manual, ARKI Consulting and Development,
Bagsvaerd, Denmark, 1996.[51] C.A. Floudas, Deterministic Global Optimization: Theory. In Methods and
Applications, Kluwer, Academic Publishers, Dordrecht, The Netherlands, 2000.
lable at ScienceDirect
Energy xxx (2010) 1e14
UNIVERSITAT ROVIRA I VIRGILI OPTIMIZATION OF ENVIRONMENTALLY FRIENDLY SOLAR ASSISTED ABSORPTION COOLING SYSTEMS Berhane Hagos Gebreslassie ISBN: 978-84-693-7673-7/DL:T-1752-2010
Contents lists avai
Energy
journal homepage: www.elsevier .com/locate/energy
A systematic tool for the minimization of the life cycle impact of solar assistedabsorption cooling systems
Berhane H. Gebreslassie a, Gonzalo Guillén-Gosálbez b, Laureano Jiménez b, Dieter Boera a,*
aDepartament d’Enginyeria Mecànica, Universitat Rovira i Virgili, Av. Països Catalans, 26 43007 Tarragona, SpainbDepartament d’Enginyeria Quimica, Universitat Rovira i Virgili, Av. Països Catalans, 26 43007 Tarragona, Spain
a r t i c l e i n f o
Article history:Received 29 January 2010Received in revised form17 May 2010Accepted 25 May 2010Available online xxx
Keywords:Absorption coolingSolar assisted coolingMINLPMulti-objective optimizationLife cycle assessment (LCA)Eco-indicator 99
* Corresponding author. Tel.: þ34 977559631; fax:E-mail address: [email protected] (D. Boera).
0360-5442/$ e see front matter � 2010 Elsevier Ltd.doi:10.1016/j.energy.2010.05.039
Please cite this article in press as: Gebreslaabsorption cooling systems, Energy (2010),
a b s t r a c t
In recent years, there has been a growing increase of the cooling demand in many parts of the world,which has led to major energy problems. In this context, solar assisted absorption cooling systems haveemerged as a promising alternative to conventional vapor compression air conditioning systems, giventhe fact that in many cases the cooling demand coincide with the availability of solar radiation. In thiswork, we present a decision-support tool based on mathematical programming for the design of solarassisted absorption cooling systems. The design task is formulated as a bi-criteria mixed-integernonlinear programming (MINLP) optimization problem that accounts for the minimization of the totalcost of the cooling system and the associated environmental impact measured over its entire life cycle.The capabilities of the proposed method are illustrated in a case study that addresses the design of a solarassisted ammonia-water absorption cycle considering weather data of Barcelona (Spain).
� 2010 Elsevier Ltd. All rights reserved.
1. Introduction
The cooling demand in many parts of the world has beenincreasing rapidly during the last decade, especially in moderateclimates, such as in many European countries [1,2]. As a result,more air conditioning units have been installed, and the electricitydemand has been rising, which has led to an increase in the use offossil and nuclear energy. This trend threatens the stability ofelectricity grids, leading at the same time to major environmentalproblems. Particularly, during the last years there has been a fastproliferation of vapor compression air conditioning (AC) [1e3]. InSpain, the electricity consumption of these equipments is alreadyaffecting significantly the national energy system. For example, thesummer peak electricity demand in the southern part of thecountry increased by 20% in 2003 and by another 20% in 2004, inwhich the summer peak consumption became even higher than thewinter peak electricity demand [3].
Hence, it seems clear that a drastic change in the energystructure should be made in the developed countries in order toadopt more sustainable solutions for fulfilling the cooling demand.
þ34 977559691.
All rights reserved.
ssie BH, et al., A systematicdoi:10.1016/j.energy.2010.05.
Particularly, environmentally friendly and energy efficient tech-nologies have to be promoted so that the environmental impact ofcooling applications is minimized without compromising theeconomic performance of the cooling system.
Solar cooling is one of the possible technological alternatives tovapor compression AC that has recently attracted an increasinginterest. Solar cooling technology uses thermal energy provided bysolar collectors to power an absorption cycle that produces cooling.The use of solar energy in cooling applications has a large potential toreplace conventional cooling systems, given the fact that the coolingdemand tends to coincide with the availability of solar radiation[2,4]. Although these technologies take advantage of a renewablesource of energy, thus decreasing the associated environmentalimpact, they have the drawback that their cost is higher than that ofconventional cooling systems (i.e., vapor compression coolingsystems). Particularly, the required heat production subsystem,which includes the solar collectors as well as the auxiliary heatingsystem, along with the absorption cooling cycle itself lead to highercapital costs than those of compression cycles.
In this context, it is necessary to develop tools for optimizing theperformance of absorption cooling cycles, so they become a realalternative to compression cycles in the market place. In the liter-ature, solar cooling systems have been typically optimized eithercomponent by component or variable by variable. Florides et al.
tool for the minimization of the life cycle impact of solar assisted039
Nomenclature
AbbreviationsAB AbsorberABS Absorption cycleCon CondenserCol Solar collectorD DesorberE EvaporatorECO99 Eco-indicator 99GFH, gfh Gas fired heaterLCA Life cycle assessmentP Solution pumpRV Refrigerant expansion valveSC SubcoolerSHX Solution heat exchangerSV Solution expansion valveyr Year
Indicesb Chemical/feedstockd Damage categoryc Impact categoryi Collector modelj Streamsk Unit of the absorption cyclen Number of collectorsp Component of a streamt Time period
SetsID(d) Set of impact categories included in the damage
category dIN(k) Set of input streams to unit kOUT(k) Set of output streams from unit k
ParametersAiCol Absorber area of solar collector model i [m2]
costicol Cost of solar collector model iper unit of capacity ½a
ˇ
�€=m2�costelec Unit cost of electricity ½a
ˇ
�€=kWh2�costng Unit cost of heat from natural gas ½a
ˇ
�€=kWh2�c0,i Optical efficiency of collector model ic1,i Linear loss coefficient of collector model ic2, i Quadratic loss coefficient of collector model iCp Water heat capacitydfbc Damage factor associated with chemical/feedstock
b and impact category c ½impact=kg�Gt Global daily solar radiation for month t ½W=m2�IAM(Q) Incident angle modifierir Interest rate [%]LCIEelecb Life cycle inventory entry associated with chemical/
feedstock b per unit of electricity consumed ½kg=MJ�LCIEheatðColÞb Life cycle inventory entry associated with chemical/
feedstock b per unit of heat delivered by the solarcollector ½kg=kWh�
LCIEheatðgfhÞb Life cycle inventory entry associated with chemicalb per unit of heat delivered by the heater ½kg=MJ�
LCIEmanbk Life cycle inventory entry associated with chemical
b per unit of capacity of equipment k constructed½kg=unit�
M and BM Sufficiently large parametersQEt Heat transferred in the evaporator in period t [kW]
Tambt Ambient temperature in month t [�C]
Top Operating hours per year ½h=yr�
Uk Overall heat transfer coefficient of unit k½ðkwÞ=ðm2KÞ�ak Purchase cost exponentbk Purchase cost coefficientdd Normalization factor ½points=impact�hgfh Thermal efficiency of the gas fired heaterj Capital cost coefficientq Capital cost recovery factorQ Incident anglef Life span of the cooling system [yrs]xd Weighting factor
VariablesAk Area of heat exchanger kCAPk Capacity of equipment kCC Capital cost [V]COPt Coefficient of performance of the absorption cycle in
month tCOPSi;t Solar cooling system efficiency using collector type i in
month tDAMd Damage in damage category d [impact]ECk Capital cost of unit k [V]ECO99 Total Eco-indicator 99 [points]f grosst Gross solar fraction in month tf nett Net solar fraction in period thj, t Enthalpy of stream j in period t ½kJ=kg�IMc Damage in impact category c [impact]LCItotb Life cycle inventory entry of chemical/feedstockb related
to the construction and operation of the cycle [kg]LCIman
b Life cycle inventory entry associated with chemical/feedstock b related to the manufacture of the system [kg]
LCIopb Life cycle inventory entry associated with chemical/feedstock b related to the operation of the system [kg]
mj, t Mass flow rate of stream j in period t½kg=s�OC Operating cost [V]Pj, t Pressure of stream j in period t [bar]PECk Purchase equipment cost [V]QColt Solar heat collected in period t [kW]
QDt Heat demand of the absorption cycle generator in
period t [kW]Qgfht Heat provided by the gas fired heater in period t [kW]
QINk;t Heat input to unit k in period t [kW]
QOUTk;t Heat output from unit k in period t [kW]
RCCol Running cost of the solar collectors [V]RCcw Running cost of the cooling water [V]RCgfh Running cost of the gas fired heater [V]RCP Running cost of the pump [V]ryi, n Relaxed binary variableTC Total cost [V]Tavt Average temperature of the inlet and exit temperatures
of the collector in period t [�C]Tj, t Temperature of stream j in period t [�C or K]Wk, t Mechanical power of unit k in period t [kW]xp, j, t Mass fraction of component p in stream j of period tyi, n Binary variable (1 if n collectors of type i are selected,
0 otherwise)DTlmk;t Logarithmic mean temperature difference of unit k in
period t [�C or K]DThk;t Temperature difference in the hot end of unit k in
period t [�C or K]DTck;t Temperature difference in the cold end of unit k in
period t [�C or K]3 Auxiliary parameter3 Lower bound on the auxiliary parameter3 Upper bound on the auxiliary parameterhcoli;t Efficiency of solar collector type i in period t
Please cite this article in press as: Gebreslassie BH, et al., A systematic tool for the minimization of the life cycle impact of solar assistedabsorption cooling systems, Energy (2010), doi:10.1016/j.energy.2010.05.039
UNIVERSITAT ROVIRA I VIRGILI OPTIMIZATION OF ENVIRONMENTALLY FRIENDLY SOLAR ASSISTED ABSORPTION COOLING SYSTEMS Berhane Hagos Gebreslassie ISBN: 978-84-693-7673-7/DL:T-1752-2010

B.H. Gebreslassie et al. / Energy xxx (2010) 1e14 3
UNIVERSITAT ROVIRA I VIRGILI OPTIMIZATION OF ENVIRONMENTALLY FRIENDLY SOLAR ASSISTED ABSORPTION COOLING SYSTEMS Berhane Hagos Gebreslassie ISBN: 978-84-693-7673-7/DL:T-1752-2010
[5,6] addressed the optimization of a solar assisted air conditioningsystem installed in Nicosia. The optimization was aimed at select-ing the appropriate solar collector type, slope, area, storage tankvolume, and settings of the boiler thermostat so as to maximize theperformance of the cooling system. Assilzadeh et al. [7] developeda model of a solar cooling system designed for the weatherconditions of Malaysia that included evacuated tube solar collectorsand a LiBr absorption chiller. These work used the dynamic simu-lation program TRNSYS in the modeling and analysis of the coolingsystem. The approach followed was a back and forth iterative onethat consisted of running the model for a set of values that thevariables of interest could take, and then identifying the best onesconsidering the performance of the solar system and the absorp-tion cycle. The main drawback of this approach is that it is likely tofail in sub-optimal solutions, since the parameters search space isnot explored in a systematic way.
Lecuona et al. [8] provided an explicit equation to optimize thehot water temperature of solar assisted absorption cooling systems.They used characteristic equation models that depended only onthe external temperatures of the absorption refrigeration system.Their work assumed that as the hot water temperature increases,the coefficient of performance of the chiller increases, whereas thesolar field efficiency decreases. In this context, there is a hot watertemperature that leads to the best overall performance of thecombined system [9,10].
Systematic methods based on mathematical programmingtechniques have also been applied to the optimization of absorp-tion cycles. The use of these tools is rather convenient in thiscontext, since they allow to explore in a systematic way a very largenumber of alternative solutions. This approach relies on posing thedesign task as an optimization problem, which is solved by stan-dard techniques for linear, nonlinear, mixed-integer linear andmixed-integer nonlinear programming (LP, NLP, MILP, MINLP,respectively). These methods have been extensively used in manyprocess systems engineering problems [11,12], including the opti-mization of energy systems [13,14] and more recently of ammonia-water absorption cycles [15e17].
Savola et al. [13] developed a MINLP model for the synthesis andoperation of a combined heat and power (CHP) plant. Theirobjective was to maximize the power to heat production ratio. Tveitet al. [14] presented also a multi-period MINLP model to optimizea CHP plant by maximizing the benefits from the power generationand district heating.
The optimization of the operating conditions and the processscheme of an ammonia-water absorption refrigeration system wasaddressed in [15e17] using a MINLP model. In these works, variousheat exchanger technologies were examined aiming at the mini-mization of the total capital cost of the absorption refrigerationsystem.
The aforementioned approaches focused on optimizing theeconomic performance of the absorption cycle. In contrast, otherworks in the literature have focused on evaluating the environ-mental performance of solar collectors following the Life CycleAssessment (LCA) methodology [18e20]. The application of multi-objective optimization for integrating the environmental andeconomic performance of energy systems using evolutionaryalgorithm was also addressed in [21e24]. All the aforementionedcontributions have concentrated on either the absorption cycle orthe solar system. However, to our knowledge, the study of inte-grated solar assisted thermal systems has never been addressed inthe literature.
In this paper, we fill in this research gap by proposing a novelMINLP model that optimizes the design and operating conditions ofthese systems considering economic and environmental concerns.Particularly, the two main goals of this work are: (i) to present
Please cite this article in press as: Gebreslassie BH, et al., A systematicabsorption cooling systems, Energy (2010), doi:10.1016/j.energy.2010.05.
a novel MINLP formulation that integrates a solar thermal systeminto a thermal energy driven absorption cooling model based onprevious works by the authors [25,26], and (ii) to perform a LCAanalysis of the integrated system in order to obtain a suitableenvironmental indicator to be optimized along with the standardeconomic criteria. The approach presented relies on a novel bi-criteria MINLP formulation in which the environmental impact ismeasured by an environmental metric based on LCA principles (i.e.,Eco-indicator 99 [27]). To overcome the numerical difficultiesassociated with the model resolution, we propose an efficientsolution strategy based on a customized branch and bound methodthat exploits the specific structure of the model.
The capabilities of the approach presented are illustratedthrough a case study that addresses the design of a solar assistedammonia-water absorption cooling system that can operate with 7different types of solar collectors: 3 evacuated tube collectors, 3 flatplate collectors and 1 compound parabolic collector, consideringtypical weather data of Barcelona (Spain).
The paper is organized as follows. The problem under study isformally stated in first place. The mathematical model is presentednext along with the solution method devised to solve it. The casestudy is introduced in the next section, and the conclusions of thework are presented afterwards.
2. Problem statement
Compared to a compression cooling cycle, the basic idea of anabsorption cooling cycle is to replace the electricity consumptionassociated with the vapor compression cycle by a thermally drivenabsorptionedesorption system [28] that employs a suitableworking fluid pair. The working pair consists of a refrigerant and anabsorbent. In this study, without loss of generality, an ammonia-water solution is used as working pair, with the ammonia being therefrigerant and water the absorbent. We assume that the thermalenergy that powers the absorption cooling cycle can be produced indifferent ways, including the use of gas fired heaters, steam boilers,waste heat and/or solar thermal panels.
Fig. 1 depicts the solar assisted absorption cooling systemstudied in this work. The hot water driven absorption cycle (Fig. 1(a)) provides chilled water for cooling applications. The basiccomponents of the absorption cycle are the absorber (AB),condenser (Con), desorber (D), evaporator (E), refrigerant subcooler(SC), refrigerant expansion valve (RV), solution heat exchanger(SHX), solution pump (P), and solution expansion valve (SV). Theheat required by the desorber can be supplied by a fired waterheater, by solar panels or by a combination of both. Therefore, theheat production subsystem includes two main components: a gasfired heater (GFH), and solar collectors (Col). The gas fired heateruses natural gas as primary energy resource. Different types of solarpanels can be installed, including evacuated tube collectors (ETC),flat plate collectors (FPC) or compound parabolic collectors (CPC).Within each collector type, we consider different models. Details onthe absorption cycle operation can be found in [25,26].
The hot water from the heat production subsystem is used in thegenerator of the absorption cycle, as shown in Fig. 1(b). If thetemperature of the output stream from the solar collectors is highenough to power the absorption cycle, then the gas fired heater isby-passed. Otherwise, the water is further heated by passingthrough the gas fired heater in order to reach the appropriateoperating temperature. If no solar collectors are chosen, then thecooled water directly enters the gas fired heater without anypreheating.
The problem addressed in this paper can be formally stated asfollows. Given are the cooling capacity of the system, the inlet andoutlet temperatures of the external fluids (except the hot water
tool for the minimization of the life cycle impact of solar assisted039
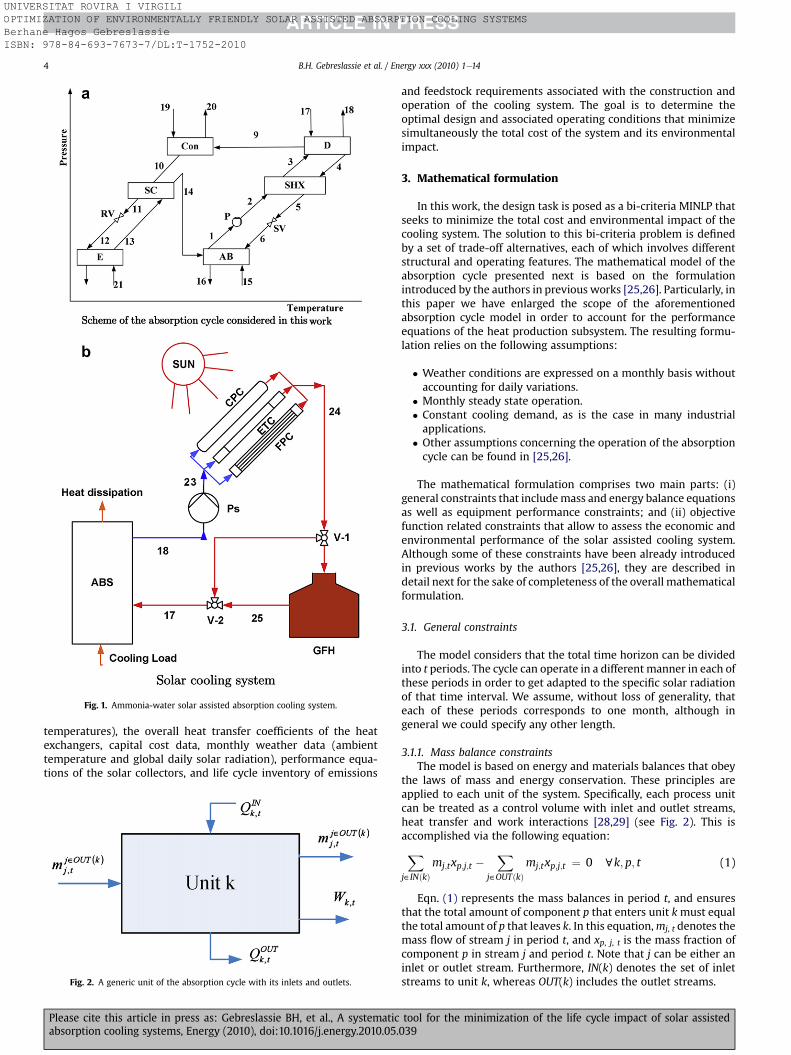
Fig. 1. Ammonia-water solar assisted absorption cooling system.
B.H. Gebreslassie et al. / Energy xxx (2010) 1e144
UNIVERSITAT ROVIRA I VIRGILI OPTIMIZATION OF ENVIRONMENTALLY FRIENDLY SOLAR ASSISTED ABSORPTION COOLING SYSTEMS Berhane Hagos Gebreslassie ISBN: 978-84-693-7673-7/DL:T-1752-2010
temperatures), the overall heat transfer coefficients of the heatexchangers, capital cost data, monthly weather data (ambienttemperature and global daily solar radiation), performance equa-tions of the solar collectors, and life cycle inventory of emissions
Fig. 2. A generic unit of the absorption cycle with its inlets and outlets.
Please cite this article in press as: Gebreslassie BH, et al., A systematicabsorption cooling systems, Energy (2010), doi:10.1016/j.energy.2010.05.
and feedstock requirements associated with the construction andoperation of the cooling system. The goal is to determine theoptimal design and associated operating conditions that minimizesimultaneously the total cost of the system and its environmentalimpact.
3. Mathematical formulation
In this work, the design task is posed as a bi-criteria MINLP thatseeks to minimize the total cost and environmental impact of thecooling system. The solution to this bi-criteria problem is definedby a set of trade-off alternatives, each of which involves differentstructural and operating features. The mathematical model of theabsorption cycle presented next is based on the formulationintroduced by the authors in previous works [25,26]. Particularly, inthis paper we have enlarged the scope of the aforementionedabsorption cycle model in order to account for the performanceequations of the heat production subsystem. The resulting formu-lation relies on the following assumptions:
� Weather conditions are expressed on a monthly basis withoutaccounting for daily variations.� Monthly steady state operation.� Constant cooling demand, as is the case in many industrial
applications.� Other assumptions concerning the operation of the absorption
cycle can be found in [25,26].
The mathematical formulation comprises two main parts: (i)general constraints that include mass and energy balance equationsas well as equipment performance constraints; and (ii) objectivefunction related constraints that allow to assess the economic andenvironmental performance of the solar assisted cooling system.Although some of these constraints have been already introducedin previous works by the authors [25,26], they are described indetail next for the sake of completeness of the overall mathematicalformulation.
3.1. General constraints
The model considers that the total time horizon can be dividedinto t periods. The cycle can operate in a different manner in each ofthese periods in order to get adapted to the specific solar radiationof that time interval. We assume, without loss of generality, thateach of these periods corresponds to one month, although ingeneral we could specify any other length.
3.1.1. Mass balance constraintsThe model is based on energy and materials balances that obey
the laws of mass and energy conservation. These principles areapplied to each unit of the system. Specifically, each process unitcan be treated as a control volume with inlet and outlet streams,heat transfer and work interactions [28,29] (see Fig. 2). This isaccomplished via the following equation:Xj˛INðkÞ
mj;txp;j;t �X
j˛OUTðkÞmj;txp;j;t ¼ 0 ck; p; t (1)
Eqn. (1) represents the mass balances in period t, and ensuresthat the total amount of component p that enters unit k must equalthe total amount of p that leaves k. In this equation, mj, t denotes themass flow of stream j in period t, and xp, j, t is the mass fraction ofcomponent p in stream j and period t. Note that j can be either aninlet or outlet stream. Furthermore, IN(k) denotes the set of inletstreams to unit k, whereas OUT(k) includes the outlet streams.
tool for the minimization of the life cycle impact of solar assisted039
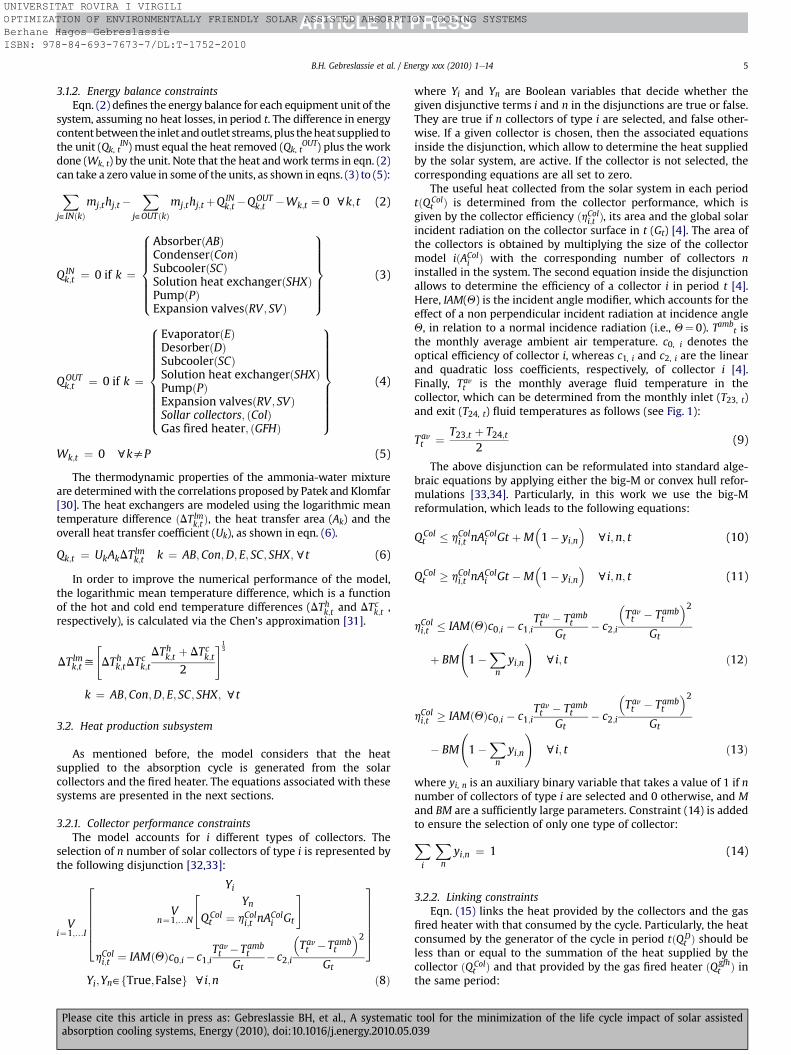
B.H. Gebreslassie et al. / Energy xxx (2010) 1e14 5
UNIVERSITAT ROVIRA I VIRGILI OPTIMIZATION OF ENVIRONMENTALLY FRIENDLY SOLAR ASSISTED ABSORPTION COOLING SYSTEMS Berhane Hagos Gebreslassie ISBN: 978-84-693-7673-7/DL:T-1752-2010
3.1.2. Energy balance constraintsEqn. (2) defines the energy balance for each equipment unit of the
system, assuming no heat losses, in period t. The difference in energycontent between the inlet and outlet streams, plus the heatsupplied tothe unit (Qk, t
IN) must equal the heat removed (Qk, tOUT) plus the work
done (Wk, t) by the unit. Note that the heat and work terms in eqn. (2)can take a zero value in some of the units, as shown in eqns. (3) to (5):Xj˛INðkÞ
mj;thj;t�X
j˛OUTðkÞmj;thj;tþQIN
k;t�QOUTk;t �Wk;t ¼ 0 ck;t (2)
QINk;t ¼ 0 if k ¼
8>>>>>><>>>>>>:
AbsorberðABÞCondenserðConÞSubcoolerðSCÞSolution heat exchangerðSHXÞPumpðPÞExpansion valvesðRV ; SVÞ
9>>>>>>=>>>>>>;
(3)
QOUTk;t ¼ 0 if k ¼
8>>>>>>>>>><>>>>>>>>>>:
EvaporatorðEÞDesorberðDÞSubcoolerðSCÞSolution heat exchangerðSHXÞPumpðPÞExpansion valvesðRV ; SVÞSollar collectors; ðColÞGas fired heater; ðGFHÞ
9>>>>>>>>>>=>>>>>>>>>>;
(4)
Wk;t ¼ 0 cksP (5)
The thermodynamic properties of the ammonia-water mixtureare determined with the correlations proposed by Patek and Klomfar[30]. The heat exchangers are modeled using the logarithmic meantemperature difference ðDTlm
k;t Þ, the heat transfer area (Ak) and theoverall heat transfer coefficient (Uk), as shown in eqn. (6).
Qk;t ¼ UkAkDTlmk;t k ¼ AB;Con;D; E; SC; SHX;ct (6)
In order to improve the numerical performance of the model,the logarithmic mean temperature difference, which is a functionof the hot and cold end temperature differences (DThk;t and DTc
k;t ,respectively), is calculated via the Chen’s approximation [31].
DTlmk;ty
"DThk;tDT
ck;t
DThk;t þ DTck;t2
#13
k ¼ AB;Con;D; E; SC; SHX; ct
3.2. Heat production subsystem
As mentioned before, the model considers that the heatsupplied to the absorption cycle is generated from the solarcollectors and the fired heater. The equations associated with thesesystems are presented in the next sections.
3.2.1. Collector performance constraintsThe model accounts for i different types of collectors. The
selection of n number of solar collectors of type i is represented bythe following disjunction [32,33]:
Vi¼1;.I
2666664
Yi
Vn¼1;.N
"Yn
QColt ¼ hColi;t nA
Coli Gt
#
hColi;t ¼ IAMðQÞc0;i�c1;iTavt �Tamb
tGt
�c2;i
�Tavt �Tamb
t
�2
Gt
3777775
Yi;Yn˛fTrue;Falseg ci;n ð8Þ
Please cite this article in press as: Gebreslassie BH, et al., A systematicabsorption cooling systems, Energy (2010), doi:10.1016/j.energy.2010.05.
where Yi and Yn are Boolean variables that decide whether thegiven disjunctive terms i and n in the disjunctions are true or false.They are true if n collectors of type i are selected, and false other-wise. If a given collector is chosen, then the associated equationsinside the disjunction, which allow to determine the heat suppliedby the solar system, are active. If the collector is not selected, thecorresponding equations are all set to zero.
The useful heat collected from the solar system in each periodtðQCol
t Þ is determined from the collector performance, which isgiven by the collector efficiency ðhColi;t Þ, its area and the global solarincident radiation on the collector surface in t (Gt) [4]. The area ofthe collectors is obtained by multiplying the size of the collectormodel iðACol
i Þ with the corresponding number of collectors ninstalled in the system. The second equation inside the disjunctionallows to determine the efficiency of a collector i in period t [4].Here, IAM(Q) is the incident angle modifier, which accounts for theeffect of a non perpendicular incident radiation at incidence angleQ, in relation to a normal incidence radiation (i.e., Q¼ 0). Tamb
t isthe monthly average ambient air temperature. c0, i denotes theoptical efficiency of collector i, whereas c1, i and c2, i are the linearand quadratic loss coefficients, respectively, of collector i [4].Finally, Tavt is the monthly average fluid temperature in thecollector, which can be determined from the monthly inlet (T23, t)and exit (T24, t) fluid temperatures as follows (see Fig. 1):
Tavt ¼T23;t þ T24;t
2(9)
The above disjunction can be reformulated into standard alge-braic equations by applying either the big-M or convex hull refor-mulations [33,34]. Particularly, in this work we use the big-Mreformulation, which leads to the following equations:
QColt � hColi;t nA
Coli Gt þM
�1� yi;n
�ci;n; t (10)
QColt � hColi;t nA
Coli Gt �M
�1� yi;n
�ci;n; t (11)
hColi;t � IAMðQÞc0;i � c1;iTavt � Tamb
tGt
� c2;i
�Tavt � Tamb
t
�2
Gt
þ BM
1�
Xn
yi;n
!ci; t ð12Þ
hColi;t � IAMðQÞc0;i � c1;iTavt � Tamb
tGt
� c2;i
�Tavt � Tamb
t
�2
Gt
� BM
1�
Xn
yi;n
!ci; t ð13Þ
where yi, n is an auxiliary binary variable that takes a value of 1 if nnumber of collectors of type i are selected and 0 otherwise, and Mand BM are a sufficiently large parameters. Constraint (14) is addedto ensure the selection of only one type of collector:Xi
Xn
yi;n ¼ 1 (14)
3.2.2. Linking constraintsEqn. (15) links the heat provided by the collectors and the gas
fired heater with that consumed by the cycle. Particularly, the heatconsumed by the generator of the cycle in period tðQD
t Þ should beless than or equal to the summation of the heat supplied by thecollector ðQCol
t Þ and that provided by the gas fired heater ðQgfht Þ in
the same period:
tool for the minimization of the life cycle impact of solar assisted039

B.H. Gebreslassie et al. / Energy xxx (2010) 1e146
UNIVERSITAT ROVIRA I VIRGILI OPTIMIZATION OF ENVIRONMENTALLY FRIENDLY SOLAR ASSISTED ABSORPTION COOLING SYSTEMS Berhane Hagos Gebreslassie ISBN: 978-84-693-7673-7/DL:T-1752-2010
QDt � QCol
t þ Qgfht ct (15)
The amount of heat provided by the heater in every time periodmust be less than or equal to its capacity, which is denoted by thecontinuous variable CAPk.
Qgfht � CAPk k ¼ gfh;ct (16)
The heat provided by the collectors and the gas fired heater(QCol
t and Qgfht , respectively) can be determined from the water flow
rate mj, t and the inlet and exit temperatures of the heat productionsubsystem (see Fig. 1) as follows:
QColt ¼ m23;tCp
�T24;t � T23;t
�ct (17)
Qgfht ¼ m24;tCp
�T25;t � T24;t
�ct (18)
3.2.3. Temperature constraintsThe following equations enforce some conditions that the
temperatures of the heat production subsystem must satisfy. Thesubscript numbers refer to the stream numbers in Fig. 1(b).
T17;t � T18;t ct (19)
T18;t � T23;t ct (20)
T24;t � T23;t ct (21)
T25;t � T24;t ct (22)
T17;t � T25;t ct (23)
3.2.4. Performance indicatorsThe equations given in this section are added to determine some
indicators that provide information on the performance of thecooling system. In fact, these performance metrics can be easilydetermined once the model has been solved (i.e., in the post-optimal analysis of the solutions), since they do not affect thecalculations. Nevertheless, they are described in detail next forcompleteness of the mathematical formulation.
The gross solar fraction f grosst is given by the ratio between thesolar heat collected and the heat demand of the absorption cyclegenerator [4]:
f grosst ¼ QColt
QDt
ct (24)
Furthermore, the net solar fraction f nett is defined as the ratiobetween the heat supplied by the solar collector and the heatdemand of the generator [4].
f nett ¼ QDt � Qgfh
t
QDt
ct (25)
Eqn. (26) defines the overall solar cooling system efficiencyðCOPSi;tÞ as the product of the collector efficiency hColi;t and theabsorption cycle coefficient of performance COPt [3].
COPSi;t ¼ hColi;t COPt ci; t (26)
Where COPt is given by eqn. (27).
COPt ¼QEt
QDt
(27)
Please cite this article in press as: Gebreslassie BH, et al., A systematicabsorption cooling systems, Energy (2010), doi:10.1016/j.energy.2010.05.
3.3. Objective functions
Our model includes two contradicting objective functions:minimum total cost and life cycle environmental impact.
3.3.1. Economic performance objective functionThe total cost of the system (TC), which accounts for both, the
capital and operating costs (CC and OC, respectively) during itsentire life span, is given by eqn. (28).
TC ¼ CC þ OC (28)
The capital cost includes the cost of the heat exchangers, solarcollectors, gas fired heater, pumps and expansion valves, which aredenoted by the continuous variable ECk, as shown in eqn. (29).
CC ¼ 4q
Xk
ECk
!(29)
Note that this equation makes use of the number of useful years(f) and capital recovery factor (q). The latter term, which is calcu-lated via eqn. (30), is a function of the interest rate (ir) and the lifespan (f) of the system [35].
q ¼ irðir þ 1Þ4
ðir þ 1Þ4�1(30)
Eqn. (31) is used to determine the capital cost associated withequipment k [35].
ECk ¼ jPECk cksCol (31)
wherej is a cost parameter that allows to determine the total capitalcost of a given equipment (i.e., a heat exchanger, gas fired heater,pump or expansion valve) from the purchase equipment cost PECk[35]. The value ofPECk is estimated using available correlations in theliterature [36]. From these correlations, it is possible to derive thefollowing exponential expression that is added to the model:
PECk ¼ bkðCAPkÞak cksCol (32)
In this equation, CAPk represents the capacity of unit k (i.e., a heatexchanger, gas fired heater or pump), whereas ak and bk are costparameters. Typical values for the coefficientbk, the exponentak andthe range of capacities for the different equipments are shown inTable 1. The Chemical Engineering cost index [37] can be used forupdating the equipment costs from the base year to the current one.
The capital cost associated with the solar collectors is determinedfrom the specific collector cost and area (costColi andACol
i , respectively)and number of collector units n purchased, as shown in eqn. (33).
ECk ¼Xi
Xn
yi;nnAColi costColi k ¼ Col (33)
The total operational cost accounts for the running cost associ-ated with the gasfired heater (RCgfh), pump (RCP) and solar collectors(RCCol), as well as the cooling water cost (RCcw). It should be notedthat the last two terms are typically neglected in the calculations.
OC ¼ RCgfh þ RCP þ RCCol þ RCcw (34)
The running cost of the gas fired heater (RCgfh) and the pump(RCP) are given by eqns. (35) and (36), respectively.
RCgfh ¼ costng4Top12hgfh
Xt
Qgfht (35)
RCP ¼ costelec4Top12
Xt
WPt (36)
tool for the minimization of the life cycle impact of solar assisted039

B.H. Gebreslassie et al. / Energy xxx (2010) 1e14 7
UNIVERSITAT ROVIRA I VIRGILI OPTIMIZATION OF ENVIRONMENTALLY FRIENDLY SOLAR ASSISTED ABSORPTION COOLING SYSTEMS Berhane Hagos Gebreslassie ISBN: 978-84-693-7673-7/DL:T-1752-2010
Where f and Top represent the useful life of the systemexpressed in years and total number of operating hours per year,respectively. In this equation, Qt
gfh and WtP are the monthly heat
contribution of the gas fired heater and monthly electricityconsumption of the pump, respectively, whereas hgfh is theconversion efficiency of the gas fired heater. The parameters costngand costelec are the unit costs of the heat from the gas fired heaterand electricity, respectively.
3.3.2. Environmental performance objective functionTo assess the environmental performance of the system, we
follow a combined approach that integrates LCA principles withoptimization theory [38,39]. In this framework, LCA is employed toassess the environmental performance of the process, whereasoptimization techniques are used for generating in a systematicway different technological alternatives and identifying the bestones in terms of economic and environmental criteria. Examples onthe application of this general framework to the development ofsustainable processes can be found in [40e45].
In particular, the environmental performance of the system ismeasured by the Eco-indicator 99 metric. Note, however, that anyother LCA indicator could be used. The Eco-indicator 99 accountsfor 11 impact categories that are aggregated into three types ofdamages: human health, ecosystem quality and resource depletion.Details about the LCA methodology can be found elsewhere [46],whereas the Eco-indicator 99 is described in detail in [27].
The calculation of the Eco-indicator 99 follows the main LCAstages: (1) goal and scope definition, (2) inventory analysis, (3)damage assessment and (4) interpretation. We describe next thesephases in the context of our study.
The goal of our LCA analysis, which is specified in phase 1, is todetermine the life cycle impact of fulfilling a given cooling demand.The functional unit of the LCA analysis is therefore the amount ofcooling demand satisfied. We perform a cradle to gate analysis thatencompasses all the processes from the extraction of the rawmaterials required for the construction and operation of the cycleuntil the energy is delivered to the final customer.
The inventory analysis phase aims to determine the life cycleinventory of emissions and feedstock requirements associated withthe cooling system. This inventory, which is represented bya continuous variable LCItotb , accounts for the feedstock require-ments and emissions of pollutant chemicals associated with themanufacture ðLCIman
b Þ and operation ðLCIopb Þ of the cooling system,as shown in eqn. (37).
LCItotb ¼ LCImanb þ LCIopb (37)
The value of LCImanb can be determined from the sizes of the gas
fired heater, solar collectors, heat exchangers and pumps of thecycle, as stated in eqn. (38).
LCImanb ¼
Xk
LCIEmanbk CAPk (38)
Here, CAPk represents, in each case, the area of the heatexchangers, capacity of heat delivered by the gas fired heater inkWh and solar collector absorber area in m2. These variables aredegrees of freedom in the optimization problem. On the other hand,
Table 1Economic parameters.
Unit bk ak Range
Heat exchanger 6880 0.430 5 m2e1500 m2
Gas fired heater 1633 0.584 100 kWe10000 kWPump 1942 1.110 1 kWe100 kW
Please cite this article in press as: Gebreslassie BH, et al., A systematicabsorption cooling systems, Energy (2010), doi:10.1016/j.energy.2010.05.
LCIEmanbk denotes the life cycle inventory entries associated with
each equipment unit k (i.e., the emissions/feedstock requirementsof chemical b per unit of equipment capacity installed).
The values of LCIEmanbk should be obtained either from the liter-
ature or by performing an LCA analysis on the manufacture of eachsingle equipment unit. At this point, it might be convenient to userough estimates in the LCA calculations when there is little infor-mation available on the manufacture process. A possible way to dothis consists of determining in first place the amount of metalcontained in an equipment, and then translating this informationinto the corresponding life cycle inventory entries by using stan-dard environmental databases that store emissions data associatedwith a wide range of processes [47e49]. Thus, in the absence ofmore accurate data, the life cycle inventory of emissions andfeedstock requirements of any equipment unit will be approxi-mated by the life cycle inventory of the material it is made of.
On the other hand, the value of LCIEopb can be determined fromthe energy consumed by the gas fired heater, the energy consumedby the solar collectors, and the electricity consumed by the pump ofthe cycle, as shown in eqn. (39).
LCIopb ¼ 4TopXt
Qgfht
hgfhLCIEheatðgfhÞb þ QCol
t LCIEheatðColÞb
þWPt LCIE
elecb
!(39)
Here, LCIEheatðgfhÞb , LCIEheatðColÞb and LCIEelecb denote the life cycleinventory entries per unit of heat delivered by the heater and solarcollectors, and unit of electricity consumed by the cycle, respec-tively. Note that these values, which can be retrieved from envi-ronmental databases [47e49], depend on the particular features ofthe cycle (i.e., type of primary energy sources used in the heater,type of solar collectors, electricity mix of the country in which thecycle operates, etc.).
The damage assessment phase aims at translating the life cycleinventory of emissions and feedstock requirements into the cor-responding environmental impacts in each damage category. TheEco-indicator 99 framework accounts for 11 environmental impactsthat are aggregated into three damage categories as follows:
� Human health, measured in Disability Adjusted Life Years (DALYs).This damage category includes the following impacts: carcino-genic effects on humans, respiratory effects on humans caused byorganic substances, respiratory effects on humans caused byinorganic substances, damage to human health caused by climatechange, human health effects caused by ionizing radiations andhuman health effects caused by ozone layer depletion.� Ecosystem quality, measured in Potentially Disappear Fraction
of Species per square meter and year (PDF$m2$year), whichincludes the following impacts: damage to ecosystem qualitycaused by ecosystem toxic emissions, damage to ecosystemquality caused by the combined effect of acidification andeutrophication and damage to ecosystem quality caused byland occupation and land conversion.� Depletion of resources, measured in MJ surplus energy, which
accounts for the following impacts: damage to resourcescaused by extraction of minerals and damage to resourcescaused by extraction of fossil fuels.
The damage caused in each impact category c belonging toa specific damage category d (IMc) is calculated from the life cycleinventory of emissions and feedstock requirements associated withthe construction and operation of the cycle (i.e., LCItotb ) and thecorresponding set of damage factors (dfbc), as stated in eqn. (40).
tool for the minimization of the life cycle impact of solar assisted039

B.H. Gebreslassie et al. / Energy xxx (2010) 1e148
UNIVERSITAT ROVIRA I VIRGILI OPTIMIZATION OF ENVIRONMENTALLY FRIENDLY SOLAR ASSISTED ABSORPTION COOLING SYSTEMS Berhane Hagos Gebreslassie ISBN: 978-84-693-7673-7/DL:T-1752-2010
IMc ¼Xb
dfbcLCItotb cc (40)
As can be seen, the damage factors are used to translate theemissions and feedstock requirements into the associated impacts.The impact categories are next aggregated into the correspondingdamage categories as follows:
DAMd ¼X
c˛IDðdÞIMc cd (41)
where ID(d) denotes the set of impact categories c that contribute todamage d. Finally, the Eco-indicator 99 is determined from theimpact (DAMd) in each damage category d (i.e., damage in humanhealth, ecosystem quality and depletion of resources), by consid-ering specific normalization (dd) and weighting (xd) factors:
ECO99 ¼Xd
ddxd$DAMd (42)
With regard to the last stage of the LCA methodology (i.e.,interpretation), let us note that in the context of our integratedframework, such phase corresponds to the post-optimal analysis ofthe Pareto solutions of the multi-objective problem.
4. Solution method
The design task isfinally formulated as a bi-criteria mixed-integernonlinear programming (MINLP) problem of the following form:
ðMÞ minx;y
Uðx; yÞ ¼ fTCðx; yÞ; ECO99ðx; yÞgs:t: constraints 1 to 42
x˛<; y˛f0;1g(43)
In this formulation, x represents the state variables or designvariables such as thermodynamic properties, mass flows, and sizesof equipments. The discrete variables are denoted by y, and are usedin the selection of a specific number n of collectors of type i. On theother hand, TC(x, y) and ECO99(x, y) denote the economic perfor-mance and environmental impact of the solar heat integratedabsorption cooling system, respectively.
4.1. Epsilon constraint method
The solution to (M) is given by a set of Pareto optimal points thatrepresent the trade-off between economic and environmental criteria.
Fig. 3. Customized branch and bound example.
Please cite this article in press as: Gebreslassie BH, et al., A systematicabsorption cooling systems, Energy (2010), doi:10.1016/j.energy.2010.05.
These points involve alternative process designs, each of whichfeaturing a specific environmental and economic performance. Thesetrade-off solutions are determined in this work by the 3-constraintmethod [50]. This technique is based on solving a setof single-objectiveproblems in which one of the objectives is kept in the objective func-tion and the others are transferred to auxiliary constraints as follows:
ðMAÞ min TCðx; yÞs:t: constraints 1 to 42ECO99 � 33 � 3 � 3x˛<; y˛f0;1g
(44)
in which the lower and upper limits (3 and 3, respectively) thatdefine the interval within which the epsilon parameter must fall areobtained by optimizing each scalar objective separately.
A recent review on MINLP methods can be found in [51]. As pointedout in [51], one of the main difficulties that must be faced when solvingMINLPs in synthesis problems, like the one addressed in this article,concerns the calculation of NLP subproblems with fixed values of thebinary variables. In these subproblems, a significant number ofequations and variables are often set to zero as they become redundantwhen units “disappear”. This in turn often leads to singularities andpoor numerical performance. In the context of our problem, thissituation arises when a collector type is not selected, which forces thecorresponding efficiency equations to take zero values.
To circumvent these difficulties, we propose in this paper a novelsolution method that is based on the logic-based outer approxima-tion for nonlinear Generalized Disjunctive Programming (GDP)problems [34,52], which has the important feature of generatingsubproblems where redundant equations and constraints of non-existing units are not included.
4.2. Customized branch and bound algorithm (CBB)
The proposed algorithm to solve (MA) is a customized branchand bound that exploits the model structure. The main ideaconsists of branching in first place on the type of collector and thensolving a MINLP in which the only binary variables that are let freeare those representing the number of collectors installed. Thedetailed steps of the algorithm are as follows.
� Step 1: Initialization. Set lower bound LB ¼ �N, upper boundUB¼N and set of collector types Col:¼ {1, ., I}� Step 2: Branching. Choose a collector type i ˛ Col.
Table 2Different models of solar collectors considered.
Symbol Name Manufacturer Type
ETC-1 Sydney SK-6 MicrotermEnergietechnik GmbH
Evacuated tube collector,cylindrical absorber,directly cooled,CPC Concentrator
ETC-2 MemotronTMO 600
Thermomax Ltd. Evacuated tube collector,Flat absorber, heat pipe
ETC-3 VacuTubeHP 65/30
Gasokol GmbH Evacuated tube collector
FPC-1 SK 500 SonnenkraftVertriebs GmbH
Flat Plate collector,Selective coating
FPC-2 Euro C18 Wagner & CoSolartechnik GmbH
Flat Plate collector,Selective coating
CPC CPC AO SOL 15 AO SOL Lda Stationary CPC Collector(concentration 1.5)selective coating, teflon film
FPC-3 Sunbox HFK-S Sun-Pro GmbH Flat Plate collector,Selective coating,
Roof integrated
tool for the minimization of the life cycle impact of solar assisted039
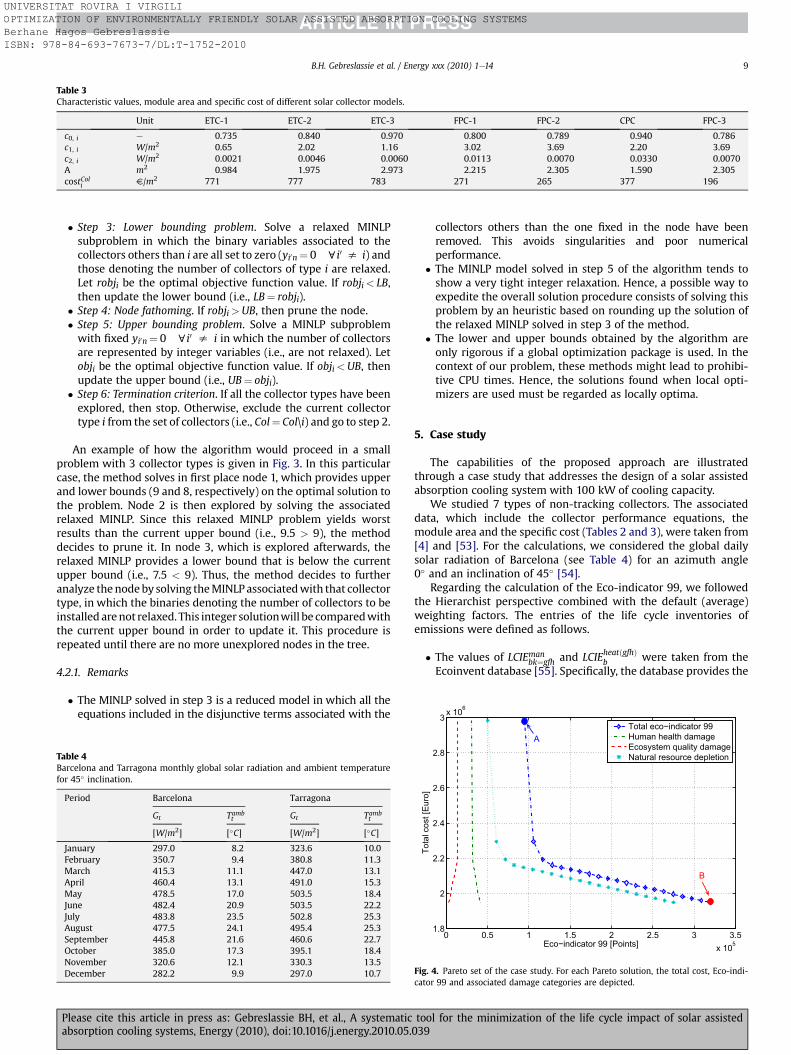
Table 3Characteristic values, module area and specific cost of different solar collector models.
Unit ETC-1 ETC-2 ETC-3 FPC-1 FPC-2 CPC FPC-3
c0, i e 0.735 0.840 0.970 0.800 0.789 0.940 0.786c1, i W/m2 0.65 2.02 1.16 3.02 3.69 2.20 3.69c2, i W/m2 0.0021 0.0046 0.0060 0.0113 0.0070 0.0330 0.0070A m2 0.984 1.975 2.973 2.215 2.305 1.590 2.305costColi V/m2 771 777 783 271 265 377 196
3 x 10⁶
B.H. Gebreslassie et al. / Energy xxx (2010) 1e14 9
UNIVERSITAT ROVIRA I VIRGILI OPTIMIZATION OF ENVIRONMENTALLY FRIENDLY SOLAR ASSISTED ABSORPTION COOLING SYSTEMS Berhane Hagos Gebreslassie ISBN: 978-84-693-7673-7/DL:T-1752-2010
� Step 3: Lower bounding problem. Solve a relaxed MINLPsubproblem in which the binary variables associated to thecollectors others than i are all set to zero (yi0n¼ 0 ci0 s i) andthose denoting the number of collectors of type i are relaxed.Let robji be the optimal objective function value. If robji< LB,then update the lower bound (i.e., LB¼ robji).� Step 4: Node fathoming. If robji>UB, then prune the node.� Step 5: Upper bounding problem. Solve a MINLP subproblem
with fixed yi0n¼ 0 ci0 s i in which the number of collectorsare represented by integer variables (i.e., are not relaxed). Letobji be the optimal objective function value. If obji<UB, thenupdate the upper bound (i.e., UB¼ obji).� Step 6: Termination criterion. If all the collector types have been
explored, then stop. Otherwise, exclude the current collectortype i from the set of collectors (i.e., Col¼ Col\i) and go to step 2.
An example of how the algorithm would proceed in a smallproblem with 3 collector types is given in Fig. 3. In this particularcase, the method solves in first place node 1, which provides upperand lower bounds (9 and 8, respectively) on the optimal solution tothe problem. Node 2 is then explored by solving the associatedrelaxed MINLP. Since this relaxed MINLP problem yields worstresults than the current upper bound (i.e., 9.5 > 9), the methoddecides to prune it. In node 3, which is explored afterwards, therelaxed MINLP provides a lower bound that is below the currentupper bound (i.e., 7.5 < 9). Thus, the method decides to furtheranalyze the node by solving the MINLP associated with that collectortype, in which the binaries denoting the number of collectors to beinstalled are not relaxed. This integer solution will be compared withthe current upper bound in order to update it. This procedure isrepeated until there are no more unexplored nodes in the tree.
4.2.1. Remarks
� The MINLP solved in step 3 is a reduced model in which all theequations included in the disjunctive terms associated with the
Table 4Barcelona and Tarragona monthly global solar radiation and ambient temperaturefor 45� inclination.
Period Barcelona Tarragona
Gt Tambt Gt Tamb
t
[W/m2] [�C] [W/m2] [�C]
January 297.0 8.2 323.6 10.0February 350.7 9.4 380.8 11.3March 415.3 11.1 447.0 13.1April 460.4 13.1 491.0 15.3May 478.5 17.0 503.5 18.4June 482.4 20.9 503.5 22.2July 483.8 23.5 502.8 25.3August 477.5 24.1 495.4 25.3September 445.8 21.6 460.6 22.7October 385.0 17.3 395.1 18.4November 320.6 12.1 330.3 13.5December 282.2 9.9 297.0 10.7
Please cite this article in press as: Gebreslassie BH, et al., A systematicabsorption cooling systems, Energy (2010), doi:10.1016/j.energy.2010.05.
collectors others than the one fixed in the node have beenremoved. This avoids singularities and poor numericalperformance.� The MINLP model solved in step 5 of the algorithm tends to
show a very tight integer relaxation. Hence, a possible way toexpedite the overall solution procedure consists of solving thisproblem by an heuristic based on rounding up the solution ofthe relaxed MINLP solved in step 3 of the method.� The lower and upper bounds obtained by the algorithm are
only rigorous if a global optimization package is used. In thecontext of our problem, these methods might lead to prohibi-tive CPU times. Hence, the solutions found when local opti-mizers are used must be regarded as locally optima.
5. Case study
The capabilities of the proposed approach are illustratedthrough a case study that addresses the design of a solar assistedabsorption cooling system with 100 kW of cooling capacity.
We studied 7 types of non-tracking collectors. The associateddata, which include the collector performance equations, themodule area and the specific cost (Tables 2 and 3), were taken from[4] and [53]. For the calculations, we considered the global dailysolar radiation of Barcelona (see Table 4) for an azimuth angle0� and an inclination of 45� [54].
Regarding the calculation of the Eco-indicator 99, we followedthe Hierarchist perspective combined with the default (average)weighting factors. The entries of the life cycle inventories ofemissions were defined as follows.
� The values of LCIEmanbk¼gfh and LCIEheatðgfhÞb were taken from the
Ecoinvent database [55]. Specifically, the database provides the
0 0.5 1 1.5 2 2.5 3 3.5x 10⁵
1.8
2
2.2
2.4
2.6
2.8
Eco−indicator 99 [Points]
Tota
l cos
t [Eu
ro]
Total eco−indicator 99Human health damageEcosystem quality damageNatural resource depletion
A
B
Fig. 4. Pareto set of the case study. For each Pareto solution, the total cost, Eco-indi-cator 99 and associated damage categories are depicted.
tool for the minimization of the life cycle impact of solar assisted039
0.5 1 1.5 2 2.5 3 3.5x 10⁵
1.8
2
2.2
2.4
2.6
2.8
3
3.2
3.4
3.6
3.8 x 10⁶
Eco−indicator 99 [Points]
Tota
l cos
t [Eu
ro]
ETC−1ETC−2ETC−3FPC−1FPC−2CPCFPC−3
Fig. 6. Individual Pareto sets associated with each collector type.
B.H. Gebreslassie et al. / Energy xxx (2010) 1e1410
UNIVERSITAT ROVIRA I VIRGILI OPTIMIZATION OF ENVIRONMENTALLY FRIENDLY SOLAR ASSISTED ABSORPTION COOLING SYSTEMS Berhane Hagos Gebreslassie ISBN: 978-84-693-7673-7/DL:T-1752-2010
life cycle inventory associated with both, the manufacture andoperation of the heater. This includes the infrastructureconstruction, as well as the electricity and natural gasconsumed per MJ of heat delivered by the gas fired heater.� The values of LCIEman
bk¼Col and LCIEheatðColÞb were determined asfollows. For the life cycle inventory associated with themanufacture of the collectors, we first obtained the keyconstruction elements per m2 of absorber area of flat plate andevacuated tube collectors from the work by Jungbluth [56]. Thelife cycle inventory entries associated with the production ofthe mass of metal contained in these key elements were thenretrieved from Ecoinvent. On the other hand, the life cycleinventory associated with the operation of the solar system,which includes the maintenance tasks and electricityconsumed during their operation, were also retrieved fromEcoinvent.� The values of LCIEman
bk for the heat exchangers (AB, Con, D, E, SC,SHX) and of LCIEelecb were also taken from Ecoinvent. Particu-larly, the heat exchangers of the absorption cycles are assumedto be made of stainless steel. Hence, the mass of stainless steelcontained in each heat exchanger was determined in first placefrom the heat exchanger area. The life cycle inventory associ-ated with the production of this material was then retrievedfrom Ecoinvent. Finally, the life cycle inventory of the elec-tricity consumed by the pump was also retrieved from Ecoin-vent, considering the electricity mix of Spain. Theaforementioned inventory accounts for the electricity produc-tion and also for its transportation through the transmissionnetwork.� The impact associated with the construction of the pumps (i.e,LCIEman
bk¼P) was neglected in the analysis.
5.1. Validation
The model of the absorption cycle was validated by an erroranalysis that can be found in a recent work by the authors [57]. Theefficiencies of the solar collectors are given in [4]. The optimizationmodel was implemented in the Generic Algebraic Modeling System(GAMS). The process data considered in the model were taken fromprevious works by the authors [25,26].
0 100 200 300 400 500 600 7001.8
2
2.2
2.4
2.6
2.8
3 x 10⁶
Total area [m2]
Tota
l Cos
t [Eu
ro]
Total area of solar collectorTotal area of absorption cycle
Fig. 5. Solar collectors and absorption cycle areas associated with each Pareto optimalsolution.
Please cite this article in press as: Gebreslassie BH, et al., A systematicabsorption cooling systems, Energy (2010), doi:10.1016/j.energy.2010.05.
5.2. Results and discussions
The model featured 11,869 constraints, 7004 continuous vari-ables and 4557 binary variables. The solution procedure wasimplemented in GAMS [58] and solved with DICOPT, interfacingwith SNOPT 6.2 and CPLEX 9.0. The upper bounding MINLP prob-lems solved in each node of the tree were approximated by therounding up heuristic discussed in section 4. The starting pointsused to initialize the NLPs were determined from a simulationmodel implemented in the Engineering Equation Solver [59]simulation environment, which was validated in [57]. Note thatthe model contains non-convex terms and for this reason thesolutions found should be regarded as locally optimal unlessa global optimization technique is employed.
5.2.1. Pareto optimal set of designsThe total computational time required to obtain 21 solutions of
the Pareto set using the 3 e constraint method was 117.5 s in a 2.29GHz machine. The Pareto points obtained by following the abovestrategy are shown in Fig. 4. Note that each point in the Pareto setrepresents a different optimal design operating under a set ofspecific conditions. Particularly, the figure shows the total cost
9.7 19 29 39
Carcinogic effect6.8
14
2027
Climate change
9.9
20
30
40Ionizing radiation
4.2
8.3
13
17
Ozone layer depletion
5.1
10
15
20Respiratory effect
4.18.1
1216
Acidification & Eutrophication
2.85.5
8.311Toxic emissions 3.8
7.7
12
15Land occupation
6.9
14
21
27Extraction of fossil fuels
3.4
6.8
10
14Extraction of minerals
8
16
2432
Total Eco−indicator 99
Minimum eco−indicator designMinimum total cost design
× 103
× 104
× 102
× 103
× 103
× 104
× 102
× 103
× 101
× 102
Fig. 7. Single impact categories and total Eco-indicator 99 associated with the extremePareto designs.
tool for the minimization of the life cycle impact of solar assisted039
ABS_m ABS_op ABS_t Col_m Col_op Col_t GFH_m GFH_op GFH_t0
1
2
3
4
5
6
7 x 10⁴
The environmental impact sources of each subsystem
Eco−
indi
cato
r 99
[poi
nts]
Human health damageEcosystem quality damageResource depletion
Fig. 8. Contribution of the manufacturing (m) and operation (op) stages associatedwith the absorption cycle (ABS), collectors (Col) and gas fired heater (GFH) in the total(t) environmental impact for the minimum environmental impact design (design A ofFig. 4).
B.H. Gebreslassie et al. / Energy xxx (2010) 1e14 11
UNIVERSITAT ROVIRA I VIRGILI OPTIMIZATION OF ENVIRONMENTALLY FRIENDLY SOLAR ASSISTED ABSORPTION COOLING SYSTEMS Berhane Hagos Gebreslassie ISBN: 978-84-693-7673-7/DL:T-1752-2010
associated with each Pareto design versus the Eco-indicator 99. Foreach Pareto point shown in the figure, we have also plotted thevalues of the single damage categories.
As observed in the figure, a conflict exists between the cost andenvironmental impact. Points A and B represent the minimum Eco-indicator and minimum total cost solutions, respectively. As can beseen, it is possible to reduce up to 70.5% the environmental impactof the most profitable design (point B), by increasing the cost in nomore than 40%. As it will be discussed later on, this is achieved byincreasing the amount of solar collectors installed, which reducesthe fossil fuel needs. It is interesting to notice that the slope of thePareto curve gradually decreases as we move from point A towardsB. Hence, it is convenient to choose solutions close to point B, inwhich we can reduce to a large extent the environmental impactwithout having to compromise too much the economicperformance.
ABS_m ABS_op ABS_t Col_m Col_op Col_t GFH_m GFH_op GFH_t0
0.5
1
1.5
2
2.5
3
3.5 x 10⁵
The environmental impact sources of each subsystem
Eco−
indi
cato
r 99
[Poi
nts]
Human health damageEcosystem quality damageResource depletion
Fig. 9. Contribution of the manufacturing (m) and operation (op) stages associatedwith the absorption cycle (ABS), collectors (Col) and gas fired heater (GFH) in the total(t) environmental impact for the minimum total cost design (design B of Fig. 4).
Please cite this article in press as: Gebreslassie BH, et al., A systematicabsorption cooling systems, Energy (2010), doi:10.1016/j.energy.2010.05.
Regarding the single damage categories included in the Eco-indicator 99, it is worthy to mention that the total impact isdominated by the depletion of natural resources followed byhuman health damage and finally by ecosystem quality. It is alsointeresting to notice that the first two damage categories behave ina similar way as the total Eco-indicator, whereas the ecosystemquality damage increases as the total impact is reduced. This is dueto the increase in the emissions of heavy metals associated with theconstruction of the solar collectors. Particularly, the emissions ofchromium steel and copper, both used in the production of thesolar collectors, have a significant ecotoxic effect, which increasesthe damage in the ecosystem quality.
Fig. 5 shows for each point of the Pareto set depicted in Fig. 4,the total cost of the system and the areas of the solar collectors andabsorption cycles. As can be seen, the environmental impact islowered by increasing these areas. This reduces the contribution ofthe heat covered from the natural gas fired heater that is energyconsumed by the cooling system, but on the other hand leads to anincrease of the total cost.
Fig. 6 shows the individual Pareto sets associated with eachcollector type. These curves were obtained by solving for eachcollector type a reduced MINLP in which the binaries representingthe associated collector model were fixed. Note that the Pareto setshown in Fig. 4 is nothing else but the envelope of the individualPareto sets of each collector type. As observed, the Sydney SK-6(ETC-1) collector model performs better than the remainingcollectors, not only economically but also environmentally. As seenin the same figure, for small environmental impacts, MemotronTMO 600 (ETC-2) and VacuTube HP 65/30 (ETC-3) behave ina similar way as Sydney SK-6 (ETC-1). On the other hand, for lowcost values, SK 500 (FPC-1), CPC AO SOL 15 (CPC) and ETC-1perform all well.
These results are explained by the fact that the evacuated tubecollectors show the highest efficiency in every month of the year. Asa result, the total collector area required is considerably lower. Thiseffect is more pronounced in the left region of the Pareto curve, inwhich the solar fraction increases. On the other hand, when theinterest is shifted to the minimization of the total cost, the solarcontribution decreases, since the cooling system tends to select thegas fired heater. In the latter region, the collectors operate at lowertemperature, as most of the heat is supplied by the gas fired heater.Under these conditions (i.e., lower operating temperature) theefficiency of the flat plate collectors gets closer to that of theevacuated tube collectors. Therefore, because of their lower cost per
Jan. Feb. Mar. April May June July Aug. Sept. Oct. Nov. Dec0
0.05
0.1
0.15
0.2
0.25
0.3
0.35
0.4
0.45
0.5
Month of the year
Sola
r coo
ling
syst
em e
ffici
ency
[−]
ETC−1 ETC−2 ETC−3 FPC−1 FPC−2 CPC FPC−3
Fig. 10. Comparison of the solar cooling efficiency at each month of the year atminimum environmental impact for each collector type.
tool for the minimization of the life cycle impact of solar assisted039

Jan. Feb. Mar. April may June July Aug. Sept. Oct. Nov. Dec.
0.4
0.5
0.6
0.7
0.8
0.9
1.0
solar COP Collector efficiency Absorption cycle COP Solar fraction Primary energy saving
Month of the year
Col
lect
or e
ffici
ency
, Chi
ller C
OP
Sola
r CO
P, a
nd s
olar
frac
tion
[-]
960000
965000
970000
975000
980000
985000
990000
Primary energy saving [kW
h]
Fig. 11. Performance indicators associated with the minimum environmental impactdesign. 0.5 1 1.5 2 2.5 3 3.5
x 105
1.8
2
2.2
2.4
2.6
2.8
3
3.2
3.4
3.6 x 10⁶
Eco−indicator 99 [Points]
Tota
l cos
t [Eu
ro]
ETC−1ETC−2ETC−3FPC−1FPC−2CPCFPC−3
Fig. 13. Individual Pareto optimal sets associated with each collector type consideringTarragona weather data.
B.H. Gebreslassie et al. / Energy xxx (2010) 1e1412
UNIVERSITAT ROVIRA I VIRGILI OPTIMIZATION OF ENVIRONMENTALLY FRIENDLY SOLAR ASSISTED ABSORPTION COOLING SYSTEMS Berhane Hagos Gebreslassie ISBN: 978-84-693-7673-7/DL:T-1752-2010
square meter, the flat plate collectors become more competitive,although they still cannot perform better than the ETC-1.
5.2.2. Extreme pareto optimal solutionsFig. 7 depicts for the extreme Pareto optimal solutions, the
environmental performance in each impact category expressed innormalized Eco-indicator 99 points. As observed, in some impactcategories the minimum cost solution performs better than theminimum environmental impact one, whereas in some others theopposite situation occurs. In both designs, the main contribution tothe overall impact is given by the extraction of fossil fuels followedby climate change, in the case of the minimum cost Pareto design,and by respiratory effects in the minimum environmental impactone. We can also observe in the same figure that the ozone layerdepletion impact is rather low. This is because the cooling systemuses natural working fluids.
Figs. 8 and 9 depict the contribution that the manufacturing andoperation of the subsystems of the cooling system (i.e., absorptioncycle itself, collectors and heater) have on the environmentalperformance of each extreme Pareto design. In general, theconstruction of the equipments have very little impact on theoverall environmental damage. In fact, in the minimum total costPareto design, the main source of impact is the operation of the gas
0.5 1 1.5 2 2.5 3x 10⁵
1.8
2
2.2
2.4
2.6
2.8
3
3.2
3.4 x 10⁶
Eco−Indicator 99 [Points]
Tota
l Cos
t [Eu
ro]
ETC−1ETC−2ETC−3FPC−1FPC−2CPCFPC−3
Fig. 12. Individual Pareto optimal sets associated with each collector type consideringchilled and cooling water temperatures of 15/10 and 25/30 �C, respectively.
Please cite this article in press as: Gebreslassie BH, et al., A systematicabsorption cooling systems, Energy (2010), doi:10.1016/j.energy.2010.05.
fired heater, whereas the contribution of the construction phase ofthe cooling system is negligible. In contrast, in the minimumenvironmental impact solution, the main contributor to the totalimpact is the operation of the solar collectors. These are operatedusing pumps that consume electricity. The electricity impact isdetermined assuming the Spanish electricity mix, which is mainlybased on fuel oil and coal, and hence leads to large environmentalimpacts. In this latter case, the contribution of the manufacturingphase associated with the collectors is larger, mainly because of theemissions of heavy metals, as already mentioned. Hence, in view ofthese results, it seems convenient to account for this life cycle stage(i.e., construction of solar collectors) when performing the envi-ronmental analysis.
Fig. 10 shows the solar cooling system efficiency attained byeach solar collector type in every month of the year when the Eco-indicator 99 value is minimized. As shown in the figure, theperformance of the cooling system improves when the evacuatedtube collector of type Sydney SK-6 (ETC-1) is used.
In Fig. 11 we show the performance indicators of the solarsystem, solar collector and the chiller in each month of the year forthe minimum environmental impact design. The figure depicts alsothe total primary energy saved in each month relative to theconsumption of primary energy at the minimum cost Pareto design.As observed, the savings in primary energy are larger from March toSeptember, a period in which the solar radiation is higher.
5.2.3. Evaluation for different operation conditionsThe outcome of the optimization depends on the specific case
study under investigation. Among the key factors that affect thecalculations, we find the operating conditions of the absorptioncycle and the weather data of the location where the solar assistedsystem will be installed. In order to elaborate the dependency onthe aforementioned variables, we conducted tests at differentoperating and weather conditions. The results of this analysis arepresented in the next sections.
5.2.3.1. Operating conditions of the absorption cycle. The problemwas solved for different values of the cooling and chilled watertemperatures, which were varied from 27/35 �C to 25/30 �C, andfrom 10/5 �C to 15/10 �C, respectively.
The Pareto sets of alternatives associated with each solar collectortype are presented in Fig.12. As observed, theflat plate collectors (FPC)
tool for the minimization of the life cycle impact of solar assisted039
B.H. Gebreslassie et al. / Energy xxx (2010) 1e14 13
UNIVERSITAT ROVIRA I VIRGILI OPTIMIZATION OF ENVIRONMENTALLY FRIENDLY SOLAR ASSISTED ABSORPTION COOLING SYSTEMS Berhane Hagos Gebreslassie ISBN: 978-84-693-7673-7/DL:T-1752-2010
are now selected in the lower region of the Pareto set (close to theminimum total cost design) and are used for preheating the water.The explanation for this is as follows. According to [60], the optimalgenerator temperature decreases when the cooling water tempera-ture decreases and chilled water temperature increases. At lowergenerator temperature, and consequently lower solar collectortemperatures, the flat plate collector performance improves, andbecause of their economic advantage, they are selected. On the otherhand, in the left region of the Pareto curve, the contribution of thesolar energy is more significant. Therefore, heating is carried outmainly by the solar collectors. In this case, those solar collectors thatare more efficient at higher temperature perform better than the flatplate collectors and are therefore preferred.
5.2.3.2. Weather conditions. Taking as reference the base case, wenext solved the problem considering weather data of Tarragona(Spain) (see Table 4) instead of Barcelona. This new locationfeatures higher solar radiations and ambient temperatures thanBarcelona.
The Pareto set of the problem based on Tarragona weather datafor each solar collector is presented in Fig. 13. Near the minimumtotal cost design, flat plate collectors are selected for preheating thewater. This choice is explained by the following two observations:(i) the collector temperature is low because the solar collectors areused as preheater; (ii) as the ambient temperature and global dailysolar radiation increases, the collector performance increases (seeeqn. (8)). This improvement in the collector efficiency is morepronounced in the case of flat plate collectors. Hence, the flat platecollectors dominate in this region of the Pareto sets. On the otherhand, close to the minimum environmental impact Pareto designs,evacuated tube collectors are selected. In this region, the heating ismainly covered by the solar collectors, so the collector temperatureis higher. At higher temperatures, the performance of thesecollectors are by far better than that of the flat plate collectors andcompound parabolic collectors and for this reason they becomemore competitive.
6. Conclusions
In this paper we have presented a systematic method forreducing the life cycle impact of cooling applications. The methodintroduced relies on formulating a bi-criteria MINLP problem thataccounts for the minimization of the total cost and environmentalimpact of solar assisted absorption cooling cycles. The environ-mental performance has been measured according to the principlesof LCA, which allows accounting for the damage caused in all thestages of the life cycle of the cooling system.
The capabilities of the proposed approach have been illustratedthrough its application to the design of a solar assisted ammonia-water absorption cooling system considering weather data of Bar-celona and Tarragona. It has been clearly shown that significantreductions in the environmental impact can be achieved if thedecision-maker is willing to invest on the solar collectorssubsystem. These reductions can be attained by increasing thenumber of collectors installed, which increases the solar fraction ofthe cooling system. It has also been shown that the type of collectorselected depends on the particular operating conditions andweather data considered in the analysis.
The systematic approach presented in this article has allowed tooptimize integrated solar assisted absorption cycles in short CPUtimes under different conditions. The methodology presented inthis work is intended to promote a more sustainable design ofcooling applications by guiding the decision-makers towards theadoption of alternatives that cause less environmental impact andreduce the consumption of primary energy resources.
Please cite this article in press as: Gebreslassie BH, et al., A systematicabsorption cooling systems, Energy (2010), doi:10.1016/j.energy.2010.05.
Acknowledgements
Berhane H. Gebreslassie expresses his gratitude for the financialsupport received from the University Rovira i Virgili. The authors alsowish to acknowledge support of this research work from the SpanishMinistry of Education and Science (DPI2008-04099/DPI, CTQ2009-14420 and ENE2008-06687-C02-01) and the Spanish Ministry ofExternal Affairs (A/8502/07, A/023551/09 and HS2007-0006).
References
[1] Balaras CA, Grossman G, Henning HM, Carlos A, Ferreira I, Podesser E, et al.Solar air conditioning in Europeean overview. Renewable and SustainableEnergy Reviews 2007;2:299e314.
[2] Henning HM. Solar assisted air conditioning of buildings e an overview.Applied Thermal Engineering 2007;27:1734e49.
[3] Casals XG. Solar absorption cooling in spain: perspectives and outcomes fromthe simulation of recent instalations. Renewable Energy 2006;31:1371e89.
[4] Henning HM. Solar-assisted air-conditioning in buildings. Wien/New York:Springer, ISBN 3-211-00647-8; 2004.
[5] Florides GA, Kalogirou SA, Tassou SA, Wrobel LC. Modelling, simulation andwarming impact assessment of a domestic-size absorption solar coolingsystem. Applied Thermal Engineering 2002;22:1313e25.
[6] Florides GA, Kalogirou SA, Tassou SA, Wrobel LC. Modelling and simulation ofan absorption solar cooling system for cyprus. Solar Energy 2002;72:43e51.
[7] Assilzadeh F, Kalogirou SA, Ali Y, Sopian K. Simulation and optimization ofa LiBr solar absorption cooling system with evacuated tube collectors.Renewable Energy 2005;30:1143e59.
[8] Lecuona A, Ventas R, Venegas M, Zacarías A, Salgado R. Optimum hot watertemperature for absorption solar cooling. Solar Energy 2009;83:1806e14.
[9] Fathi R, Guemimi C, Ouaskit S. An irreversible thermodynamic model for solarabsorption refrigerator. Renewable Energy 2004;29:1349e65.
[10] Wu C, Chen L, Sun F. Optimization of solar absorption refrigerator. AppliedThermal Engineering 1997;17:203e8.
[11] Biegler LT, Grossmann IE. Retrospective on optimization. Computers &Chemical Engineering 2004;28:1169e92.
[12] Grossmann IE, Biegler LT. Part ii. future perspective on optimization.Computers & Chemical Engineering 2004;28:1193e218.
[13] Savola T, Fogelholm CJ. MINLP optimisation model for increased powerproduction in small-scale CHP plants. Applied Thermal Engineering 2007;27(1):89e99.
[14] Tveit TM, Savola T, Gebremedhin A, Fogelholm CJ. Multi-period MINLP modelfor optimising operation and structural changes to CHP plants in districtheating networks with long-term thermal storage. Energy Conversion andManagement 2009;50:639e47.
[15] Chavez-Islas LM, Heard CL. Design and analysis of an ammonia-waterabsorption refrigeration cycle by means of an equation-oriented method.Industrial & Engineering Chemistry Research 2009;48(4):1944e56.
[16] Chavez-Islas LM, Heard CL. Optimization of a simple ammonia-water absorp-tion refrigeration cycle by application of mixed-integer nonlinear program-ming. Industrial & Engineering Chemistry Research 2009;48(4):1957e72.
[17] Chavez-Islas LM, Heard CL, Grossmann IE. Synthesis and optimization of anammonia-water absorption refrigeration cycle considering different types ofheat exchangers by application of mixed-integer nonlinear programming.Industrial & Engineering Chemistry Research 2009;48(6):2972e90.
[18] Ardente F, Beccali G, Cellura M, Brano VL. Life cycle assessment of a solarthermal collector. Renewable Energy 2005;30(7):1031e54.
[19] Ardente F, Beccali G, Cellura M, Brano VL. Life cycle assessment of a solarthermal collector: sensitivity analysis, energy and environmental balances.Renewable Energy 2005;30(2):109e30.
[20] Battisti R, Corrado A. Environmental assessment of solar thermal collectorswith integrated water storage. Journal of Cleaner Production 2005;13(13e14):1295e300.
[21] Bernier E, Maréchal F, Samson R. Multi-objective design optimization ofa natural gas-combined cycle with carbon dioxide capture in a life cycleperspective. Energy 2010;35(2):1121e8.
[22] Li H, Maréchal F, Burer M, Favrat D. Multi-objective optimization of anadvanced combined cycle power plant including CO2 separation options.Energy 2006;31:3117e34.
[23] Lazzaretto A, Toffolo A. Energy, economy and environment as objectives inmulti-criterion optimization of thermal systems design. Energy2004;29:1139e57.
[24] Burer M, Tanaka K, Favrat D, Yamada K. Multi-criteria optimization ofa district cogeneration plant integrating a solid oxide fuel cell-gas turbinecombined cycle, heat pumps and chillers. Energy 2003;28:497e518.
[25] Gebreslassie BH, Guillén-Gosálbez G, Jiménez L, Boer D. Design of environ-mentally conscious absorption cooling systems via multi-objective optimi-zation and life cycle assesment. Applied Energy 2009;86:1712e22.
[26] Gebreslassie BH, Guillén-Gosálbez G, Jiménez L, Boer D. Economic perfor-mance optimization of an absorption cooling system under uncertainity.Applied Thermal Engineering 2009;29:3491e500.
tool for the minimization of the life cycle impact of solar assisted039
B.H. Gebreslassie et al. / Energy xxx (2010) 1e1414
UNIVERSITAT ROVIRA I VIRGILI OPTIMIZATION OF ENVIRONMENTALLY FRIENDLY SOLAR ASSISTED ABSORPTION COOLING SYSTEMS Berhane Hagos Gebreslassie ISBN: 978-84-693-7673-7/DL:T-1752-2010
[27] PRé-Consultants. The eco-indicator 99, a damage oriented method for lifecycle impact assessment. methodology report and manual for designers.Amersfoort, The Netherlands: PRé Consultants; 2000. Technical report.
[28] Herold KE, Radermacher R, Klein SA. Absorption chillers and heat pumps. CRCPress; 1996.
[29] Kotas JT. The exergy method of thermal plant analysis. Krieger PublishingCompany; 1995.
[30] Pátek J, Klomfar J. Simple functions for fast calculations of selected thermo-dynamic properties of the ammonia-water system. International Journal ofRefrigeration 1995;18:228e34.
[31] Lasdon LS, Edgar TF, Himmelblau DM. Optimization of chemical processes.McGraw-Hill; 2001.
[32] Türkay M, Grossmann IE. Structural flowsheet optimization with complexinvestment cost functions. Computers & Chemical Engineering 1998;22:673e86.
[33] Vecchietti A, Lee S, Grossmann IE. Modeling of discrete/continuous optimi-zation problems: characterization and formulation of disjunctions and theirrelaxations. Computers & Chemical Engineering 2003;27:433e48.
[34] Lee S, Grossmann IE. New algorithms for nonlinear generalized disjunctiveprogramming. Computers & Chemical Engineering 2000;24:2125e41.
[35] Bejan A, Tsatsaronis G, Moran M. Thermal design & optimization. John Wiley &Sons Inc.; 1996.
[36] Turton R, Richard BC, Wallace WB, Joseph SA. Analysis, synthesis, and designof chemical processes. New Jersey: Prentice Hall PTR; 2003.
[37] Chemical Engineering. Chemical engineering plant cost index (CEPCI), Tech-nical report; 2009.
[38] Azapagic A, Clift R. The application of life cycle assessment to process opti-misation. Computers & Chemical Engineering 1999;10:1509e26.
[39] Puigjaner L, Guillén-Gosálbez G. Towards an integrated framework for supplychain management in the batch chemical process industry. Computers &Chemical Engineering 2008;32(4e5):650e70.
[40] Guillén-Gosálbez G, Caballero JA, Jiménez L. Application of life cycle assess-ment to the structural optimization of process flowsheets. Industrial & Engi-neering Chemical Research 2008;47:777e89.
[41] Hugo A, Ciumei C, Buxton A, Pistikopoulos EN. Environmental impact mini-mization through material substitution: a multi-objective optimizationapproach. Green Chemistry 2004;6:407e17.
[42] Bojarski AD, Guillén-Gosálbez G, Jiménez L, Espuña A, Puigjaner L. Life cycleassessment coupled with process simulation under uncertainty for reducedenvironmental impact: application to phosphoric acid production. Industrial& Engineering Chemical Research 2008;47(21):8286e300.
Please cite this article in press as: Gebreslassie BH, et al., A systematicabsorption cooling systems, Energy (2010), doi:10.1016/j.energy.2010.05.
[43] Guillén-Gosálbez G, Grossmann IE. Optimal design and planning of sustain-able chemical supply chains under uncertainty. AIChE Journal 2009;55(1):99e121.
[44] Guillén-Gosálbez G, Mele F, Grossmann IE. A bi-criterion optimizationapproach for the design and planning of hydrogen supply chains for vehicleuse. AIChE Journal 2010;56(3):650e67.
[45] Guillén-Gosálbez G, Grossmann IE. A global optimization strategy for theenvironmentally conscious design of chemical supply chains under uncer-tainty in the damage assessment model. Computers & Chemical Engineering2010;34(1):42e58.
[46] Environmental management-life cycle assesment-principles and framework.IRAM-ISO 14040; 2006.
[47] Ecobalance-UK. TEAM and DEAM. Ecobalance UK. Arundel, UK: The EcobilanGroup, www.ecobalance.com/uk_team.php; 1998.
[48] SimaPro 6 LCA software. The Netherlands: PRé-Consultants, www.pre.nl/simapro/default.htm; 1998.
[49] PIRA-International. PEMS 4 database. Leatherhead, UK: PIRA International,www.pira.co.uk/pack/lca_software.htm; 1998.
[50] Ehrgott M. Multicriteria optimization. Springer; 2000.[51] Grossmann IE. Review of nonlinear mixed-integer and disjunctive program-
ming techniques. Optimization and Engineering 2002;3:227e52.[52] Türkay M, Grossmann IE. Logic-based MINLP algorithms for the optimal
synthesis of process networks. Computers & Chemical Engineering1996;20:959e78.
[53] SPF Solartechnik Prüfung Forschung, www.solarenergy.ch.[54] Comerç i Turisme Generalitat de Catalunya. ATLAS DE RADIACIÓ SOLAR A
CATALUNYA. Departament d’Indústria, www.icaen.net; 2000.[55] The ecoinvent Center. A competence centre of ETH, PSI, EMPA& ART, www.
ecoinvent.ch/. ecoinvent data v2.1.[56] Jungbluth N. Sonnenkollektor-anlagen. Dübendorf, CH: Swiss Centre for Life
Cycle Inventories; 2007. ecoinvent report No. 6-XI.[57] Gebreslassie BH, Medrano M, Mendes F, Boer D. Optimum heat exchanger
area estimation using coefficients of structural bonds: application to anabsorption chiller. International Journal of Refrigeration 2010;3(3):529e37.
[58] Brooke A, Kendrik D, Meeraus A, Raman R, Rosenthal RE. GAMS e a user’sguide. Washington: GAMS Development Corporation; 1998.
[59] F-Chart Software. Engineering equation solver, (EES), www.fchart.com.[60] Fernández-Seara J, Vázquez M. Study and control of the optimal generation
temperature in NH3eH2O absorption refrigeration systems. Applied ThermalEngineering 2001;21:343e57.
tool for the minimization of the life cycle impact of solar assisted039

Solar assisted absorption cooling cycles for reduction of
global warming: a multi-objective optimization
approach
Berhane H. Gebreslassiea, Gonzalo Guillen-Gosalbezb, Laureano Jimenezb,Dieter Boera,∗
aDepartament d’Enginyeria Mecanica, Universitat Rovira i VirgiliAv. Paısos Catalans, 26, 43007, Tarragona, Spain
bDepartament d’Enginyeria Quimica, Universitat Rovira i VirgiliAv. Paısos Catalans, 26, 43007, Tarragona, Spain
Abstract
This work studies the use of absorption cycles combined with solar energy for
reducing the green house gas emissions in the energy sector. The problem
of satisfying a given cooling demand at minimum cost and environmental
impact is formulated as a bi-criterion nonlinear optimization problem that
seeks to minimize the total cost of the cooling application and its contribu-
tion to global warming. The latter metric, which is assessed following the
principles of life cycle assessment, accounts for the impact caused during the
construction and operation of the system. The concept of Pareto optimality
is employed to discuss different alternatives for reducing the contribution to
global warming that differ in their economic and environmental performance.
We show that reducing the contribution to global warming considering the
current energy prices and taxes on carbon dioxide emissions is technically
viable but economically not appealing. We also discuss the conditions under
which reducing the CO2 emissions could become economically attractive.
Keywords: Solar assisted cooling, NLP, Multi-objective optimization, Life
∗Corresponding authorEmail address: [email protected] (Dieter Boer )
Preprint submitted to Renewable Energy June 14, 2010
UNIVERSITAT ROVIRA I VIRGILI OPTIMIZATION OF ENVIRONMENTALLY FRIENDLY SOLAR ASSISTED ABSORPTION COOLING SYSTEMS Berhane Hagos Gebreslassie ISBN: 978-84-693-7673-7/DL:T-1752-2010
cycle assessment (LCA), Global warming potential
1. Introduction
The human pattern of development has led to a significant increase in
greenhouse gas (GHG) emissions and consequently in global warming [1].
Based on the Intergovernmental Panel on Climate Change (IPCC) [2] global
GHG emissions increased by 70% between 1970 and 2004, growing from 28.7
to 49 Gigatonnes of carbon dioxide equivalents (GtCO2 eq). CO2 emissions
grew by 80% in the same period representing 77% of the GHG emissions in
2004.
Nowadays, 94% of the CO2 emissions in Europe are attributed to the
energy sector as a whole, and particularly to the combustion of fossil fuels.
Oil consumption accounts for 50% of the CO2 emissions in the European
Union, natural gas for 22% and coal for 28% [1]. Particularly, the building
sector represents 40% of the total primary energy demand in European Union
countries and it is responsible for one third of the GHG emissions [3].
A large percentage of the emissions attributed to the building sector are
due to air conditioning (AC) systems, most of which are based on electricity
driven compression cycles. These systems show the best economic perfor-
mance and for this reason they have dominated the market in the last years.
Unfortunately, they consume non-renewable primary energy resources and
contribute to major environmental problems such as the Ozone layer deple-
tion (due to the refrigerants) and global warming (because of their electricity
consumption [4]). With the recent trend of developing more sustainable pro-
cesses, there has been a growing interest on thermal energy activated cooling
machines. These systems represent an environmentally friendly alternative
to standard compression chillers, as they can be driven by waste heat, nat-
ural gas, solar energy or biomass. This can lead to significant reductions in
GHG emissions [5–7].
Among all the alternatives to standard AC systems, solar assisted cool-
ing cycles are seen by many as a promising option. By using solar energy
2
UNIVERSITAT ROVIRA I VIRGILI OPTIMIZATION OF ENVIRONMENTALLY FRIENDLY SOLAR ASSISTED ABSORPTION COOLING SYSTEMS Berhane Hagos Gebreslassie ISBN: 978-84-693-7673-7/DL:T-1752-2010

autonomous cooling systems, it is possible to achieve virtually zero CO2
emissions. Unfortunately, the current electricity cost and fuel prices make
it difficult to compete with conventional cooling systems [8]. Hence, the
adoption of alternative AC systems raises the question of to which extent
decision-makers are willing to compromise the economic performance in or-
der to obtain environmental benefits.
Mathematical programming methods, and in particular, multi-objective
optimization, offer a suitable framework for addressing this type of prob-
lems. These techniques allow for the inclusion of environmental concerns in
the decision-making process by generating a set of trade-off solutions that
balance economic and environmental criteria called the Pareto set. From
these points, decision-makers can identify the best ones according to their
strategic guidelines and applicable legislation.
Several optimization studies have been carried out on cooling systems [13–
16]. Most of them addressed the optimization of the economic performance of
the cooling application and neglected the associated environmental impact.
A reduced number of approaches have applied multi-objective optimization
to the design of energy systems [17–19]. However, to our knowledge, none of
them focused on integrated solar absorption systems.
One of the key issues in multi-objective optimization as applied to envi-
ronmentally conscious process design is the definition of a suitable environ-
mental metric. Works incorporating environmental concerns through multi-
objective optimization have typically focused on minimizing the impact at
the plant level [19, 20], thus neglecting the damage caused in other stages
of the life cycle. This approach can lead to solutions that transfer the en-
vironmental problem to other echelons of the energy supply chain, thereby
failing in reducing the environmental damage globally [21]. A proper evalu-
ation of the environmental performance of a system requires the application
of life cycle assessment (LCA) principles [11, 12, 22, 23] for quantifying the
impact from the extraction of raw materials to the delivery of energy to the
final customer. Despite recent advances in LCA methodology, the current
3
UNIVERSITAT ROVIRA I VIRGILI OPTIMIZATION OF ENVIRONMENTALLY FRIENDLY SOLAR ASSISTED ABSORPTION COOLING SYSTEMS Berhane Hagos Gebreslassie ISBN: 978-84-693-7673-7/DL:T-1752-2010
situation is that the literature on the application of LCA to energy systems
is limited.
With the aforementioned observations in mind, the goals of this work are:
(i) to perform an LCA analysis on solar assisted absorption cooling systems;
and (ii) to explore their environmental benefits in terms of reducing the GHG
emissions by employing a multi-objective optimization framework. Specifi-
cally, in this work we will elaborate, among others, the following points.
i. Under which circumstances the use of solar energy in cooling applica-
tions is economically competitive with fossil fuels? (i.e., which are the
values of the fuel cost and CO2 taxes that make the use of solar energy
in absorption cooling systems profitable?)
ii. How much can be saved in terms of GHG emissions by integrating solar
collectors with absorption cooling systems?
This work is structured in seven sections. The section that follows presents
a motivating example that illustrates the environmental benefits of the solar
assisted absorption chiller over the counter part vapor compression cycle. The
next section discuses the mathematical formulation of the multi-objective
optimization problem. Special emphasis is given to the solar system perfor-
mance constraints and the equations added to quantify the environmental
impact (i.e., contribution to global warming). The fourth and fifth sections
concentrate on the solution method of the problem and the case study used
to test its capabilities. A detailed discussion of the results is presented in
section six. The conclusions of the work are finally drawn in the last section
of the paper.
2. Motivating example
We present first a straightforward example that helps to briefly illustrate
the environmental advantages of integrating solar collectors with absorption
cycles for reducing the GHG emissions in cooling applications. Three chillers,
4
UNIVERSITAT ROVIRA I VIRGILI OPTIMIZATION OF ENVIRONMENTALLY FRIENDLY SOLAR ASSISTED ABSORPTION COOLING SYSTEMS Berhane Hagos Gebreslassie ISBN: 978-84-693-7673-7/DL:T-1752-2010
the conventional electricity driven one and two thermal energy driven chillers,
are considered at this point. Particularly, we will study single effect absorp-
tion and vapour compression cycles with coefficients of performance of 0.7
and 3, respectively. The vapour compression cycle motor efficiency (ηmot) is
95%. The solar fraction (SF ) of the absorption chillers are 0% (100% natural
gas) and 70%. A life span of 20 years and 2000 working hours per year are
assumed.
These systems are compared in terms of their global warming potential
(GWP) expressed in equivalent tons of CO2 per unit of cooling capacity gen-
erated. In the case of the electricity driven chiller, the calculation of the
GWP accounts only for the electricity generation. For the thermal energy
driven chillers, the environmental analysis considers the extraction and com-
bustion of natural gas as well as operation of the solar collectors. It should
be noted that, for the sake of simplicity, in both cases the impact associated
with the construction of the cycle has been neglected. The electricity con-
sumed by the pump of the absorption cycle has also been neglected, since
it represents a very low percentage of the total energy consumption. With
regard to the GWP associated with the electricity generation, we consider
different electricity generation mixes (i.e., Spain, USA and China). The as-
sociated GWP values per unit of energy generated have been retrieved from
the environmental database Ecoinvent [24]. For the countries considered in
this example, these are 0.6035, 0.751 and 1.148 [kg CO2 eq/kWh], respec-
tively. On the other hand, the GWP due to the combustion of natural gas in
the gas fired heater, which has also been retrieved from Ecoinvent, is 0.256
[kg CO2 eq/kWh]. The latter value includes also the impact associated with
the construction of the boiler.
[Figure 1 Could be placed here ]
The results of the analysis are shown in Fig. 1. Particularly, Fig. 1(a)
represents 100 kW cooling capacity powered by natural gas. The total GWP
5
UNIVERSITAT ROVIRA I VIRGILI OPTIMIZATION OF ENVIRONMENTALLY FRIENDLY SOLAR ASSISTED ABSORPTION COOLING SYSTEMS Berhane Hagos Gebreslassie ISBN: 978-84-693-7673-7/DL:T-1752-2010
is 1463 tonCO2 eq with a natural gas consumption of 142.8 kW. Fig. 1(b)
represents the same cycle but this time powered by combination of natu-
ral gas and solar energy. With this integration, the natural gas consumption
drops to 42.9 kW, with a total GWP of 438.8 ton CO2 eq. Fig. 1(c) represents
a 100 kW cooling capacity vapour compression cycle powered by electricity.
The GWP of this chiller is 847, 1054 and 1612 tonCO2 eq in Spain, USA and
China, respectively.
Comparing chillers (a) and (b), it can be seen that it is possible to reduce
up to 70% the primary energy demand of the cycle by integrating it with
solar energy. This reduces the GWP from 1463 to 438.8 tonCO2 eq.
The comparison between chillers (a) and (c) depends on the electricity
production mix. The use of absorption chillers in China reduces the GWP
by 9%. On the other hand, in Spain and USA, vapour compression chillers
are environmentally more attractive than the considered absorption chillers.
It should be noted that absorption chillers become competitive from an envi-
ronmental perspective if they had higher COPs. This could be accomplished
by using double or triple effect configurations. Besides, their impact could
also be reduced by using less contaminant heat sources or free driving energy
as waste heat.
The comparison between chillers (b) and (c) reveals that solar assisted
absorption chillers are environmentally more attractive than electric chillers.
The magnitude of the GWP reduction depends again on the electricity pro-
duction mix of the country. We can see from the results that reductions
in GWP of 48%, 52% and 73% can be achieved in Spain, USA and China,
respectively. In these cases, the advantages are twofold: (i) the mitigation
of global warming; and (ii) the reduction in the consumption of those non-
renewable primary energy resources consumed for generating the electricity
required by the compression chillers.
6
UNIVERSITAT ROVIRA I VIRGILI OPTIMIZATION OF ENVIRONMENTALLY FRIENDLY SOLAR ASSISTED ABSORPTION COOLING SYSTEMS Berhane Hagos Gebreslassie ISBN: 978-84-693-7673-7/DL:T-1752-2010

3. Mathematical formulation: a multi-objective optimization ap-
proach
After proving the environmental advantages of integrating solar collectors
with absorption cycles, we next derive a multi-objective mathematical formu-
lation for analyzing systematically these systems considering environmental
and economic criteria simultaneously.
3.1. System description
In order to derive our formulation, we consider a typical ammonia/water
mixture supported solar assisted absorption chiller (see Fig. 2). The detail
description of the absorption cycle could be found [14]. It is assumed that
the heat demand required to activate the chiller can be supplied either by
the gas fired heater using natural gas as primary energy resource or by solar
energy captured by solar collectors. Evacuated tube collectors are used to
convert the solar energy into usable forms of thermal energy. It is also pos-
sible to cover the heat demand of the absorption chiller by a combination of
the aforementioned heat sources.
[Figure 2 could be placed here ]
The problem addressed in this paper can be formally stated as follows. Given
are the cooling capacity of the cooling system, the inlet and outlet tempera-
tures of the external fluids (except the generator temperatures), capital cost
data, monthly weather data (ambient temperature and global daily solar ra-
diation), performance equations of the solar collector, and GHG emissions
associated with the construction and operation of the cooling system. The
goal is to minimize simultaneously the contribution to global warming and
the total cost of the cooling system.
3.2. Mathematical formulation
We present next a multi-objective optimization model that provides as
output a set of technical alternatives for satisfying the cooling demand, each
7
UNIVERSITAT ROVIRA I VIRGILI OPTIMIZATION OF ENVIRONMENTALLY FRIENDLY SOLAR ASSISTED ABSORPTION COOLING SYSTEMS Berhane Hagos Gebreslassie ISBN: 978-84-693-7673-7/DL:T-1752-2010

featured by a different economic and environmental performance. The math-
ematical model of the absorption cycle is based on the formulation presented
in detail in previous works [14, 25]. The model described here extends the
original formulation by integrating the absorption cycle with solar collec-
tors. For completeness of the work, we present the main equations of the
absorption cycle already described elsewhere [14, 25] in the Appendix. On
the other hand, the solar collector performance constraints and the equations
associated with the calculation of the GHG emissions are given next.
The mathematical formulation is a multi-period one that allows to follow
a given cooling demand pattern while accounting for varying meteorological
conditions over time. It is assumed that the cycle can operate in a differ-
ent manner in each time period t in order to get adapted to the specific
solar radiation available. The model is based on mass and energy balances
(see Appendix) and objective function constraints that allow to assess the
economic and environmental performance of the cooling system.
3.2.1. Heat production subsystem
The model considers that the heat supplied to the absorption cycle is
provided from the solar collectors and the gas fired heater. The associated
solar collector constraints are presented in the following sections.
3.2.2. Collector performance constraints
Solar collectors absorb solar radiation and convert it into useful heat.
The useful heat collected is transported by working fluids flowing through
the solar collectors [26]. The collector performance is denoted by a continuous
variable ηcolt whose value is determined via eqn. (1). On the other hand, the
heat collected from the solar collector in period t (Qk=col,t) is given by eqn.
(2).
ηcolt = IAM(Θ)c0 − c1T avt − T amb
t
Gt
− c2(T av
t − T ambt )2
Gt
∀t (1)
Qk,t = ηcolt AcolGt k = Col, ∀t (2)
8
UNIVERSITAT ROVIRA I VIRGILI OPTIMIZATION OF ENVIRONMENTALLY FRIENDLY SOLAR ASSISTED ABSORPTION COOLING SYSTEMS Berhane Hagos Gebreslassie ISBN: 978-84-693-7673-7/DL:T-1752-2010
In eqn. (1), IAM(Θ) is the incident angle modifier, which accounts for
the effect of a non perpendicular incident radiation at incidence angle Θ in
relation to a normal incidence radiation (i.e.,Θ = 0); T avt is the monthly
average inlet and exit fluid temperature in the collector; and T ambt is the
monthly average ambient air temperature. The daily global solar radiation
is represented by Gt. Finally, c0 denotes the optical efficiency of the collector,
whereas c1 and c2 are the linear and quadratic loss coefficients, respectively
[8]. On the other hand, in eqn. (2), n represents the number of collectors
and Acol is the absorber area of a single collector. For the sake of simplicity,
in this work we treat the integer variable n as a continuous one. It should be
noted that from numerical examples we have observed that this can be done
without compromising the quality of the final solution. This simplification
greatly helps the computations.
3.2.3. Linking constraints
Eqn. (3) relates the heat consumed by the absorption cycle with that
produced by the solar collector and the gas fired heater. More precisely, the
sum of the heat produced by the solar collector (Qk=Col,t) and gas fired heater
(Qk=GFH,t) should cover at least the heat demand (Qh=D,t) of the absorption
cycle in period t.
Qk,t ≤ Qk′,t +Qk′′,t k = D, k′ = Col, k′′ = GFH, ∀t (3)
Furthermore, the heat produced by the heater in every time period must be
less than or equal to its capacity (CAPk=GFH) as given by eqn. (4).
Qk,t ≤ CAPk k = GFH, ∀t (4)
3.3. Objective functions
The model seeks to minimize two contradicting objective functions si-
multaneously: total cost and contribution to global warming. Details on the
calculations of both performance metrics are given in the next subsections.
9
UNIVERSITAT ROVIRA I VIRGILI OPTIMIZATION OF ENVIRONMENTALLY FRIENDLY SOLAR ASSISTED ABSORPTION COOLING SYSTEMS Berhane Hagos Gebreslassie ISBN: 978-84-693-7673-7/DL:T-1752-2010
3.3.1. Economic performance
The economic assessment of the absorption cycle is discussed in detail
in [14, 25]. Specifically, the total cost (TC) accounts for the capital and
operating cost of the integrated system (TCC and TOC, respectively) as
shown in eqn. (5).
TC = TCC + TOC (5)
In this equation, TCC accounts for the cost of the heat exchangers of the
cycle, solar collectors, gas fired heater, pump and expansion valves. On the
other hand, the operating cost (TOC) includes the running cost of the gas
fired heater, pump and solar collectors, as well as the cooling water cost. The
capital and operation cost constraints are included in the Appendix.
3.3.2. Environmental impact
The environmental impact is quantified according to LCA principles. The
combined use of LCA and multi-objective optimization has been shown to
be a suitable framework for identifying, in a systematic way, opportunities
for environmental improvements in different applications [9–12]. In this ap-
proach, LCA is employed to assess the environmental performance of a sys-
tem, whereas optimization techniques enable us to generate feasible process
alternatives and identify the best ones in terms of economic and environmen-
tal criteria. General details on the LCA methodology can be found elsewhere
[21].
The calculation of the life cycle impact of the cooling application follows
the four LCA steps: (1) goal and scope definition; (2) inventory analysis; (3)
damage assessment; and (4) interpretation. We describe next these phases
in the context of our study.
Goal and scope definition: In this step, the system boundaries, the functional
unit and the environmental damages are defined. We perform a cradle-to-
gate analysis that accounts for the generation of the utilities consumed by
the cooling system as well as the impact during the construction phase. The
functional unit is the amount of cooling demand satisfied during the time
10
UNIVERSITAT ROVIRA I VIRGILI OPTIMIZATION OF ENVIRONMENTALLY FRIENDLY SOLAR ASSISTED ABSORPTION COOLING SYSTEMS Berhane Hagos Gebreslassie ISBN: 978-84-693-7673-7/DL:T-1752-2010
horizon. The environmental damage is quantified through the global warm-
ing potential (GWP). This is a measure of how much a given mass of a GHG
emission contribute to global warming. It is a relative scale which compares
the impact of a given chemical with that of the same mass of carbon dioxide
(whose GWP by convention equals 1). The GWP is calculated over a specific
time interval that must be stated beforehand [2, 27]. Particularly, we follow
the Intergovernmental Panel on Climate Change IPCC 2007 framework con-
sidering a time horizon of 100 years, which is the time frame used in the
Kyoto Protocol [27].
Inventory analysis: This step aims at quantifying the total GHG emissions
associated with the absorption cooling. These emissions are represented by
a continuous variable (LCI totb ), that is determined from the emissions during
the manufacturing (LCImanb ) and operation (LCIopb ) of the cooling system,
as shown in eqn. (6).
LCI totb = LCImanb + LCIopb ∀b (6)
The life cycle GHG emissions during the construction phase, which are de-
noted by the continuous variable LCImanb , can be determined from the sizes
of the gas fired heater, solar collectors, heat exchangers and pumps of the
cycle, as stated in eqn. (7).
LCImanb =
∑
k
LCIEb,kCAPk (7)
Here, the continuous variable CAPk represents, in each case, the mass of the
heat exchangers and expansion valve in kg, heat capacity of the gas fired
heater and pump capacity expressed in kW , power of and solar collector
absorber area in m2. The parameter LCIEb,k denotes the life cycle inven-
tory of emissions of chemical b released during the construction phase per
unit of capacity of equipment k. The values of LCIEb,k should be obtained
either from the literature or by performing an ad hoc LCA analysis on the
construction of each single equipment.
The second term in eqn. (6) (LCIopb ) accounts for the emissions due to the
extraction and combustion of natural gas, operation of the solar collectors
11
UNIVERSITAT ROVIRA I VIRGILI OPTIMIZATION OF ENVIRONMENTALLY FRIENDLY SOLAR ASSISTED ABSORPTION COOLING SYSTEMS Berhane Hagos Gebreslassie ISBN: 978-84-693-7673-7/DL:T-1752-2010

and generation of the cooling water and electricity consumed by the heat
exchangers and pumps of the cycle, respectively:
LCIopb =∑t
ϕTop
(Qk,tLCIE
heat(gfh)b +Qk′,tLCIE
heat(col)b
+mj,tLCIEcwb +Wk′′,tLCIEelec
b
)
∀b, j = cooling water, k = GFH, k′ = Col, k′′ = Pump
(8)
In this equation, Top and ϕ are the annual operation hours of the cooling
system and life span in years. LCIEheat(gfh)b , LCIE
heat(col)b , LCIEcw
b and
LCIEelecb appearing in the same equation denote the life cycle inventory of
emissions of chemical b contributing to global warming per unit of reference
flow (i.e., heat, amount of cooling water and electricity, respectively). These
values, which can be retrieved from environmental databases [28, 29], de-
pend on the particular features of the absorption cycle (i.e., type of primary
energy sources used in the heater, type of solar collectors, electricity mix of
the country in which the cycle operates, etc.). Finally, the continuous vari-
ables mj=cooling water,t and Wk=Pump,t denote the cooling water and electricity
consumption, respectively, in period t. Note that the consumption of cooling
water is obtained from the energy balance applied to the heat exchangers.
Impact assessment: In this step, the life cycle inventory of emissions is trans-
lated into the corresponding contribution to global warming.
GWP =∑
b
LCI totb dfb (9)
Here, the parameter dfb is a damage factor that accounts for the global
warming potential of chemical b compared to that of CO2. These values are
available in the IPCC report [30]. It should be noted that environmental
databases such as Ecoinvent provide both the life cycle inventory of emissions
as well as the associated environmental impacts per unit of reference flow.
Hence, it might be possible to omit eqn.(9) in those cases in which the GWP
values are directly available in the database.
Interpretation: In the context of the approach presented, the interpretation
phase entails analyzing the Pareto solutions of the following multi-objective
12
UNIVERSITAT ROVIRA I VIRGILI OPTIMIZATION OF ENVIRONMENTALLY FRIENDLY SOLAR ASSISTED ABSORPTION COOLING SYSTEMS Berhane Hagos Gebreslassie ISBN: 978-84-693-7673-7/DL:T-1752-2010

environmental problem:
(M) minx
U (x) = {TC (x) , GWP (x)}s.t. h(x) = 0
g(x) ≤ 0
x ∈ <
(10)
In this formulation, x denotes state or design variables (i.e., thermodynamic
properties, flows, operating conditions, and sizes of equipment units). The
equality constraints h(x) = 0 represent thermodynamic property relations,
mass and energy balances, cost, and LCA calculations. On the other hand,
the inequality constraints g(x) ≤ 0 are added to model design specifica-
tions (i.e., capacity limits, bounds on process variables, etc.). The objective
function includes two terms: TC(x) is the total cost of the cooling system,
and GWP(x) represents its environmental impact (i.e., contribution to global
warming). The solution to this problem is given by a set of efficient or Pareto
optimal points representing trade-off designs [12].
4. Solution method
To obtain the Pareto solutions of model (M), we apply the ε-constraint
method, which is based on solving a set of instances of an auxiliary model
(MA) for different target values on the environmental performance (i.e.,
GWP(x)) as follows:
(MA) minx
U(x) = TC (x)
s.t. GWP (x) ≤ ε
ε ≤ ε ≤ ε
h(x) = 0
g(x) ≤ 0
x ∈ <
(11)
Note that the lower and upper limits imposed on epsilon can be obtained by
minimizing each scalar objective separately.
13
UNIVERSITAT ROVIRA I VIRGILI OPTIMIZATION OF ENVIRONMENTALLY FRIENDLY SOLAR ASSISTED ABSORPTION COOLING SYSTEMS Berhane Hagos Gebreslassie ISBN: 978-84-693-7673-7/DL:T-1752-2010

5. Case study
The capabilities of the proposed approach were illustrated through a case
study that addresses the design of a solar assisted absorption cooling system
with 100 kW cooling capacity. The process data for the absorption cycle are
given in [14, 25]. We considered a water cooled ammonia/water absorption
chiller with a generator temperature in the range of 95 to 120ºC. Note that
this temperature range cannot be reached by flat plate collectors with accept-
able efficiencies [26]with acceptable efficiencies. For this reason in this work
assumed to operate with evacuated tube collectors. More precisely, the cycle
operates with a Sydney SK-6 from Microterm Energietechnik GmbH, which
is a directly cooled evacuated tube collector with a cylindrical absorber and a
CPC concentrator collector [8]. Global daily solar radiation of Barcelona (see
Table 1) for an azimuth angle 0º and an inclination of 45º was considered [31].
[Table 1 could be placed here ]
The entries of the life cycle inventory of GHG emissions associated with
the construction and operation of the cooling system were defined as follows:
• Heat exchangers: The life cycle inventory of GHG emissions released
during the construction of the heat exchangers was approximated by
that associated with production of the equivalent mass of stainless steel.
This amount of mass can be easily determined from the exchange area.
The associated environmental information was taken from Ecoinvent
[24].
• Solar collectors: The emissions due to the construction and operation
of the evacuated tube collector were retrieved from Ecoinvent [24]. The
operation emissions account for the maintenance of the solar collector
and the generation of the electricity consumed by its pump.
• Gas fired heater: The emissions associated with the generation and
combustion of natural gas in the fired heater were retrieved from Ecoin-
14
UNIVERSITAT ROVIRA I VIRGILI OPTIMIZATION OF ENVIRONMENTALLY FRIENDLY SOLAR ASSISTED ABSORPTION COOLING SYSTEMS Berhane Hagos Gebreslassie ISBN: 978-84-693-7673-7/DL:T-1752-2010

vent. This term accounts for the emissions given by the fuel generation,
construction of the boiler, direct emissions, and electricity consumed
during the boiler operation. For the calculations, we assumed an aver-
age net efficiency of 0.95 based on the lower heating value.
• Pump: The life cycle inventory of GHG emissions associated with the
electricity consumed by the pump consdering the electricity mix of
Spain, was also retrieved from Ecoinvent [24]. The emissions during
the construction of the pump and expansion valve were neglected.
6. Results and Discussions
6.1. Pareto set for the base case
The NLP model of the solar assisted cooling system was implemented in
GAMS 23.0 [28] and solved with the NLP solver CONOPT [29] in a 2.29
GHz machine. The Pareto solutions were calculated following the method
described before. The model contained 2634 constraints and 2116 variables.
It took 22 seconds of CPU time to generate 21 Pareto solutions.
Fig. 3 depicts the Pareto set of alternatives, each of which represents a
different integrated absorption cycle with a specific solar fraction. The y axis
on the right hand side of the figure shows the solar fraction associated with
each Pareto design (i.e., amount of energy covered by solar energy divided
by the total energy consumed by the cycle), whereas that on the left axis
provides the total cost.
[Figure 3 could be placed here ]
As can be seen, there is a clear trade off between the economic (total cost) and
environmental (GWP) indicators. Particularly, one can reduce up to 82.3%
the GWP potential at the expense of increasing the total cost by 115%. Fur-
ther inspection of the Pareto points reveals that reductions in GWP with
respect to the minimum cost design are achieved by reducing the primary
15
UNIVERSITAT ROVIRA I VIRGILI OPTIMIZATION OF ENVIRONMENTALLY FRIENDLY SOLAR ASSISTED ABSORPTION COOLING SYSTEMS Berhane Hagos Gebreslassie ISBN: 978-84-693-7673-7/DL:T-1752-2010

energy consumption rate of the cycle. This is accomplished by increasing the
area of the heat exchangers of the cycle and also by replacing the primary
energy source (natural gas) by solar energy. Note that reducing the natural
gas consumption decreases the operating cost of the cooling system, but also
increases the capital cost due to the installation of solar collectors. In prac-
tice, the latter effect dominates the former one, so an increase in the total
cost is observed when the GWP is minimized.
As observed in the figure, the slope of the Pareto curve is smooth in the
region close to the minimum cost design (point D), but becomes steeper as
we move towards the minimum GWP solution (point A). This is because
in order to fulfill more stringent environmental limitations (near to Pareto
design A), the model is forced to increase the area of the solar collectors
drastically in order to cover the energy requirements in months with low
radiations. This causes a large increase in the slope of the curve, as observed
in the figure.
In Fig. 3 we have also depicted the economic and environmental perfor-
mance of a standard vapour compression chiller, considering only the impact
during the operation phase. This chiller has a cooling capacity of 100 kW and
a COP of 3. Data for the Spanish electricity grid retrieved from Ecoinvent
[24] was considered in its environmental assessment. A simulation model
of the chiller was implemented in EES [32] in order to perform the calcu-
lations. As observed, this system dominates part of the Pareto designs, as
it shows better environmental and economic performance for a GWP above
2100 tonCO2 eq. However, the vapour compression chiller have the limitation
that it cannot reduce the GWP below that point. Hence, it can be concluded
from these results that depending on the part of the Pareto frontier in which
decision-makers are interested, it might be convenient to select a traditional
vapour compression cycle instead of a solar assisted cooling system.
[Figure 4 could be placed here ]
16
UNIVERSITAT ROVIRA I VIRGILI OPTIMIZATION OF ENVIRONMENTALLY FRIENDLY SOLAR ASSISTED ABSORPTION COOLING SYSTEMS Berhane Hagos Gebreslassie ISBN: 978-84-693-7673-7/DL:T-1752-2010

Fig. 4 depicts for some of the Pareto designs shown in Fig. 3, the solar
fraction attained in each month of the year. Note that the model assumes
that the cycle operates in the same way during all the years of the time hori-
zon. As seen, in the minimum environmental impact design (design A), 98%
of the heat demanded by the absorption chiller is covered by solar energy.
On the other hand, in the Pareto designs B, C, and D the contribution of
the solar energy decreases depending on the environmental limit imposed by
the epsilon constraint method. Pareto design D is not visible in the figure
because at the minimum total cost design the cooling system does not have
any contribution of solar energy.
[Figure 5 could be placed here ]
Fig. 5 shows the life cycle GWP associated with the operation of the cy-
cle for some Pareto alternatives (i.e., points A, B, C and D in Fig. 3) in
each month of the year. As we can see in Fig. 5, the GWP is lower in May,
June, July and August, due to the high global daily solar radiation (see Table
1). In these months, the natural gas consumption is reduced and the GHG
emissions are decreased.
6.2. Taxes on GHG emissions
Ideally, decision-makers should analyze the Pareto set of alternatives
given in Fig. 3, and finally choose the best one according to their prefer-
ences. Unfortunately, this is not done in practice. Instead, the total cost is
usually minimized as single-objective and the unique solution obtained by do-
ing so is implemented as far as it fulfills the environmental legislation. Hence,
by setting taxes on GHG emissions, policy makers can guide decision-makers
towards the adoption of more sustainable alternatives.
With this observation in mind, we conducted an analysis whose goal was
to assess the impact of a given tax on CO2 emissions on the optimal absorp-
tion cycle configuration considering only its economic performance. More
precisely, we aimed at determining how the areas of the heat exchangers of
17
UNIVERSITAT ROVIRA I VIRGILI OPTIMIZATION OF ENVIRONMENTALLY FRIENDLY SOLAR ASSISTED ABSORPTION COOLING SYSTEMS Berhane Hagos Gebreslassie ISBN: 978-84-693-7673-7/DL:T-1752-2010
the cycle and number of solar collectors changed as a function of the charges
taxCO2 on the CO2 emissions. This study was performed by solving the fol-
lowing single-objective optimization model that minimizes the total cost for
different possible values of taxCO2 :
(MT) minx
U(x) = TC(x) +GWP (x)taxCO2
s.t. h(x) = 0
g(x) ≤ 0
x ∈ <
(12)
Note that this is indeed equivalent to applying the weighted sum method
(REF) to the multi-objective problem (M). In fact, each single run of model
(MT) for a given tax value on the GHG emissions provides a different Pareto
solution. Conversely, each point of the Pareto set “total cost” vs “GWP”
has an associated tax rate, that is to say, a value of the tax rate that would
make that Pareto point optimal if the total cost was minimized as a single
objective without any restriction on the GHG emissions. It should be noted
that since the problem is nonconvex, the weighted sum method is not guar-
anteed to provide all the solutions of the Pareto set. In fact, it can only
provide the points that lie in the convex envelope of the Pareto set [33]. This
implies that there might be points of the Pareto set that cannot be obtained
by solving (MT) (i.e., there is not any tax rate for which the Pareto point is
the maximum of MT).
[Table 2 could be placed here ]
The results obtained by applying the above commented procedure are given
in Table 2. The table shows for each tax rate value, the total cost, GWP
and solar fraction of the cycle that minimizes the cost as unique criterion.
As observed, increasing the tax rate has the effect of leading to optimal de-
signs with larger solar fractions and consequently less GHG emissions. This
is an interesting result that shows how policy makers can influence on the
GHG emissions in the energy sector by properly adjusting the tax rates. It
18
UNIVERSITAT ROVIRA I VIRGILI OPTIMIZATION OF ENVIRONMENTALLY FRIENDLY SOLAR ASSISTED ABSORPTION COOLING SYSTEMS Berhane Hagos Gebreslassie ISBN: 978-84-693-7673-7/DL:T-1752-2010
is worthwhile to mention that in the last Pareto optimal high jump in the
total cost is observed. This could be explained that once the solar energy
contribution reaches certain percentage further increase in the solar fraction
alone does not lead to a reduction in environmental load but also it has to be
accompanied by significant increase in the area of the absorption cycle. The
increase in the area of the absorption cycle allows decreasing the higher tem-
perature energy demand thus reducing the primary energy needs. However,
it leads to a large increase of the total cost.
6.3. Influence of fuel cost
We recalculated next the Pareto set shown in Fig. 3 for different fuel
prices in order to assess the impact of this parameter on the performance
of the integrated system. Fig. 6 shows the new Pareto sets obtained for
different fuel prices.
[Figure 6 could be placed here ]
As expected, the Pareto set moves upwards and to the left when the fuel
cost is increased. Particularly, the minimum total cost design shows a solar
fraction of 8% for a fuel price of 0.0635 C /kWh, and of 77% when the fuel
price is 0.0700 C /kWh. This is due to the fact that the increase in the fuel
cost makes the integration of the cycle with solar collectors more profitable.
[Table 3 could be placed here ]
Table 3 shows for each Pareto point in Fig. 6, the carbon dioxide tax rate
(taxCO2), the solar fraction (SF ) and the associated GWP for fuel prices of
0.0474 C /kWh, 0.0635 C /kWh and 0.07 C /kWh. Note that the tax rate
given in the table is that for which the Pareto point would become optimal
considering only the total cost as single objective.
As observed, by increasing the fuel cost, we get larger solar fractions and
lower tax rates. This is an interesting observation that suggests that the tax
19
UNIVERSITAT ROVIRA I VIRGILI OPTIMIZATION OF ENVIRONMENTALLY FRIENDLY SOLAR ASSISTED ABSORPTION COOLING SYSTEMS Berhane Hagos Gebreslassie ISBN: 978-84-693-7673-7/DL:T-1752-2010
rate should be adapted to the cost data in order to achieve always a given
reduction in GHG emissions rather than being fixed independently of the
market trends.
Results in Table 3 indicate also that at a given fuel cost, it is possible
to obtain Pareto designs with significant reductions in GWP by slightly in-
creasing the tax rate on CO2 emissions. For instance, for a fuel cost of 0.0474
C /kWh and a tax rate of 77.8 C /tonCO2, the optimal solar fraction is 0.06.
However, by slightly increasing the value of taxCO2 up to 4.4%, we obtain
a solar fraction of 0.75 and a reduction of GWP of 62.8%. Moreover, Table
3 shows that when the fuel cost is increased to 0.07 C /kWh, the first four
Pareto designs show a negative value of the charges on CO2 emissions. This
is because in these cases the use of solar energy becomes profitable not only
economically but also environmentally.
[Figure 7 could be placed here ]
Fig. 7 depicts (1) the total life cycle GWP, the life cycle GWP associated
with the manufacturing (2) and operation (3) of the cooling system, and
(4) the CO2 emissions released during the cycle operation for the minimum
total cost solution under different fuel prices. The emissions values were
determined as follows: (4) includes the CO2 released in the combustion of
natural gas in the fired heater; (3) accounts for the same emissions as in (4)
plus those associated with the generation of the electricity and natural gas
consumed by the cycle; (2) includes the life cycle GHG emissions associated
with the construction of the cycle; and (1) is the summation of (2) and (3).
As observed, for high fuel cost values, the model tends to select the solar
energy over the natural gas. Consequently, the GWP is reduced because
the GHG emissions released during the operation of the cycle are decreased.
This reduction in GWP is not significant for fuel cost values lower than
0.065 C /kWh. This is because below this point the economic savings in
fuel expenditures are not compensated by the increase in capital cost due to
20
UNIVERSITAT ROVIRA I VIRGILI OPTIMIZATION OF ENVIRONMENTALLY FRIENDLY SOLAR ASSISTED ABSORPTION COOLING SYSTEMS Berhane Hagos Gebreslassie ISBN: 978-84-693-7673-7/DL:T-1752-2010

the purchase of solar collectors. Fig. 7 also shows how the GHG emissions
released during the manufacturing phase can be neglected, since their con-
tribution to the total GWP of the cycle is rather small. Furthermore, it can
be observed how the GHG emissions released in the combustion of natural
gas represent a large percentage of the total life cycle GHG emissions of the
process.
It should be noted that the results obtained in the environmental analysis
depend largely on the data used to calculate the life cycle inventory, which
in our case were retrieved from the Ecoinvent database.
7. Conclusions
This paper has addressed the use of solar collectors coupled with absorp-
tion cooling cycles as a manner to reduce the GHG emissions in the cooling
sector. The design of these systems has been formulated in mathematical
terms as a multi-objective nonlinear programming (NLP) problem that seeks
to minimize simultaneously the economic and environmental performance of
the cooling application.
This work has extended our previously developed methodology [25] in
the following ways: (i) it focuses on a different environmental performance
measure (i.e., global warming potential, GWP); (ii) it includes the option
of using solar energy as a heat source to activate the cooling system; (iii)
it assesses the impact that taxes on GHG emissions have on the optimal
absorption cycle configuration considering only the economic performance;
and (iv) it evaluates the impact of the fuel cost on the performance of the
integrated system.
The results obtained show that with the current energy price and with-
out considering governmental subsides on solar technologies, the use of solar
energy in cooling applications is not profitable.
The method presented in this paper is aimed at facilitating the task of
policy makers when deciding on the tax rates to be fixed in order to promote
more sustainable technological alternatives in the energy sector.
21
UNIVERSITAT ROVIRA I VIRGILI OPTIMIZATION OF ENVIRONMENTALLY FRIENDLY SOLAR ASSISTED ABSORPTION COOLING SYSTEMS Berhane Hagos Gebreslassie ISBN: 978-84-693-7673-7/DL:T-1752-2010
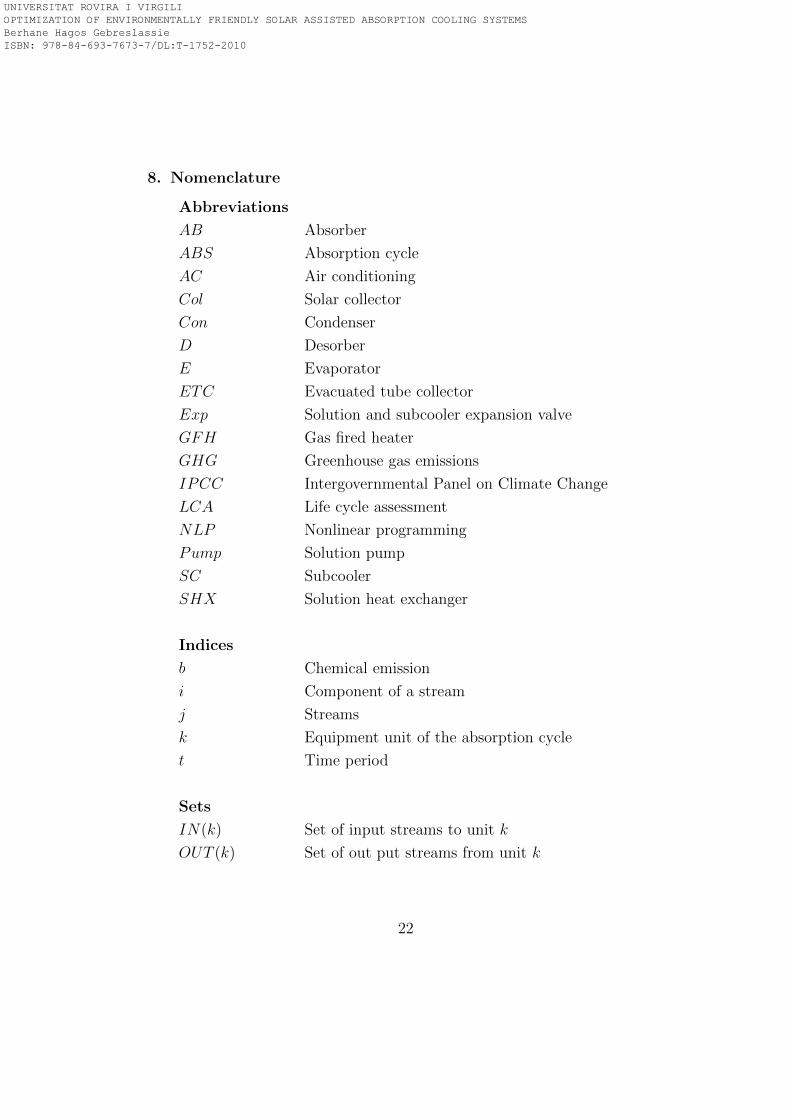
8. Nomenclature
Abbreviations
AB Absorber
ABS Absorption cycle
AC Air conditioning
Col Solar collector
Con Condenser
D Desorber
E Evaporator
ETC Evacuated tube collector
Exp Solution and subcooler expansion valve
GFH Gas fired heater
GHG Greenhouse gas emissions
IPCC Intergovernmental Panel on Climate Change
LCA Life cycle assessment
NLP Nonlinear programming
Pump Solution pump
SC Subcooler
SHX Solution heat exchanger
Indices
b Chemical emission
i Component of a stream
j Streams
k Equipment unit of the absorption cycle
t Time period
Sets
IN(k) Set of input streams to unit k
OUT (k) Set of out put streams from unit k
22
UNIVERSITAT ROVIRA I VIRGILI OPTIMIZATION OF ENVIRONMENTALLY FRIENDLY SOLAR ASSISTED ABSORPTION COOLING SYSTEMS Berhane Hagos Gebreslassie ISBN: 978-84-693-7673-7/DL:T-1752-2010
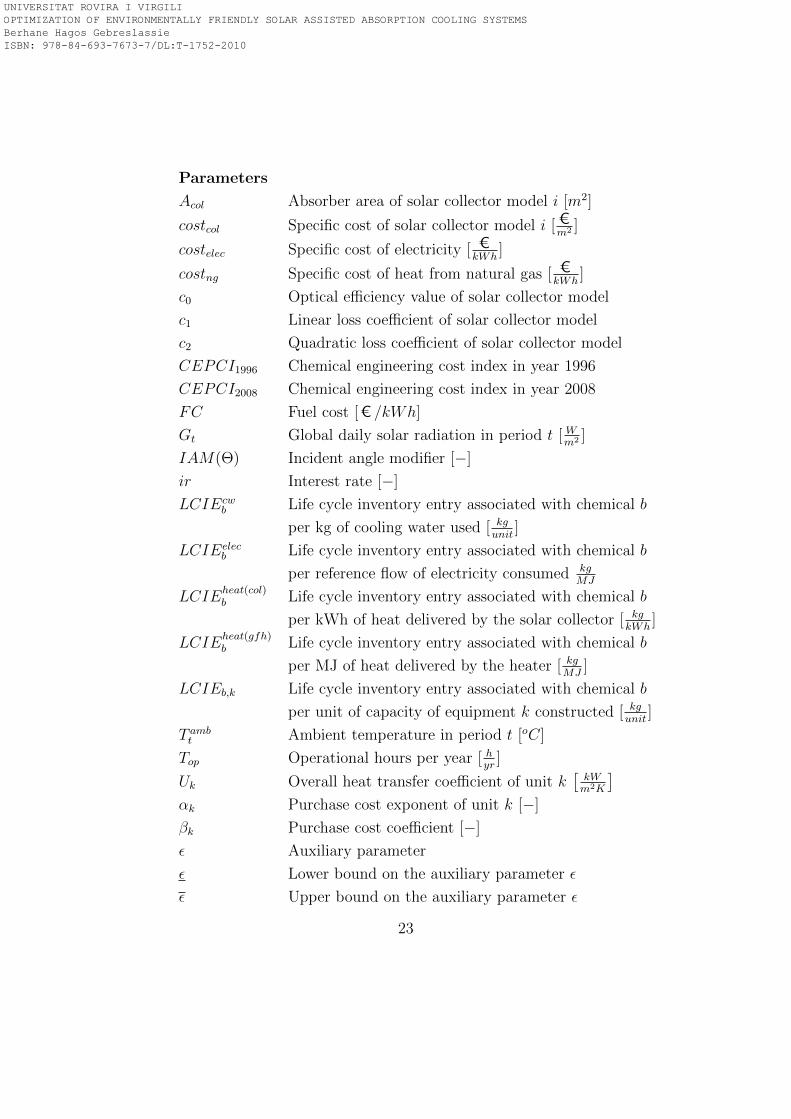
Parameters
Acol Absorber area of solar collector model i [m2]
costcol Specific cost of solar collector model i [ Cm2 ]
costelec Specific cost of electricity [ CkWh
]
costng Specific cost of heat from natural gas [ CkWh
]
c0 Optical efficiency value of solar collector model
c1 Linear loss coefficient of solar collector model
c2 Quadratic loss coefficient of solar collector model
CEPCI1996 Chemical engineering cost index in year 1996
CEPCI2008 Chemical engineering cost index in year 2008
FC Fuel cost [C /kWh]
Gt Global daily solar radiation in period t [ Wm2 ]
IAM(Θ) Incident angle modifier [−]
ir Interest rate [−]
LCIEcwb Life cycle inventory entry associated with chemical b
per kg of cooling water used [ kgunit
]
LCIEelecb Life cycle inventory entry associated with chemical b
per reference flow of electricity consumed kgMJ
LCIEheat(col)b Life cycle inventory entry associated with chemical b
per kWh of heat delivered by the solar collector [ kgkWh
]
LCIEheat(gfh)b Life cycle inventory entry associated with chemical b
per MJ of heat delivered by the heater [ kgMJ
]
LCIEb,k Life cycle inventory entry associated with chemical b
per unit of capacity of equipment k constructed [ kgunit
]
T ambt Ambient temperature in period t [oC]
Top Operational hours per year [ hyr]
Uk Overall heat transfer coefficient of unit k[
kWm2K
]
αk Purchase cost exponent of unit k [−]
βk Purchase cost coefficient [−]
ε Auxiliary parameter
ε Lower bound on the auxiliary parameter ε
ε Upper bound on the auxiliary parameter ε
23
UNIVERSITAT ROVIRA I VIRGILI OPTIMIZATION OF ENVIRONMENTALLY FRIENDLY SOLAR ASSISTED ABSORPTION COOLING SYSTEMS Berhane Hagos Gebreslassie ISBN: 978-84-693-7673-7/DL:T-1752-2010
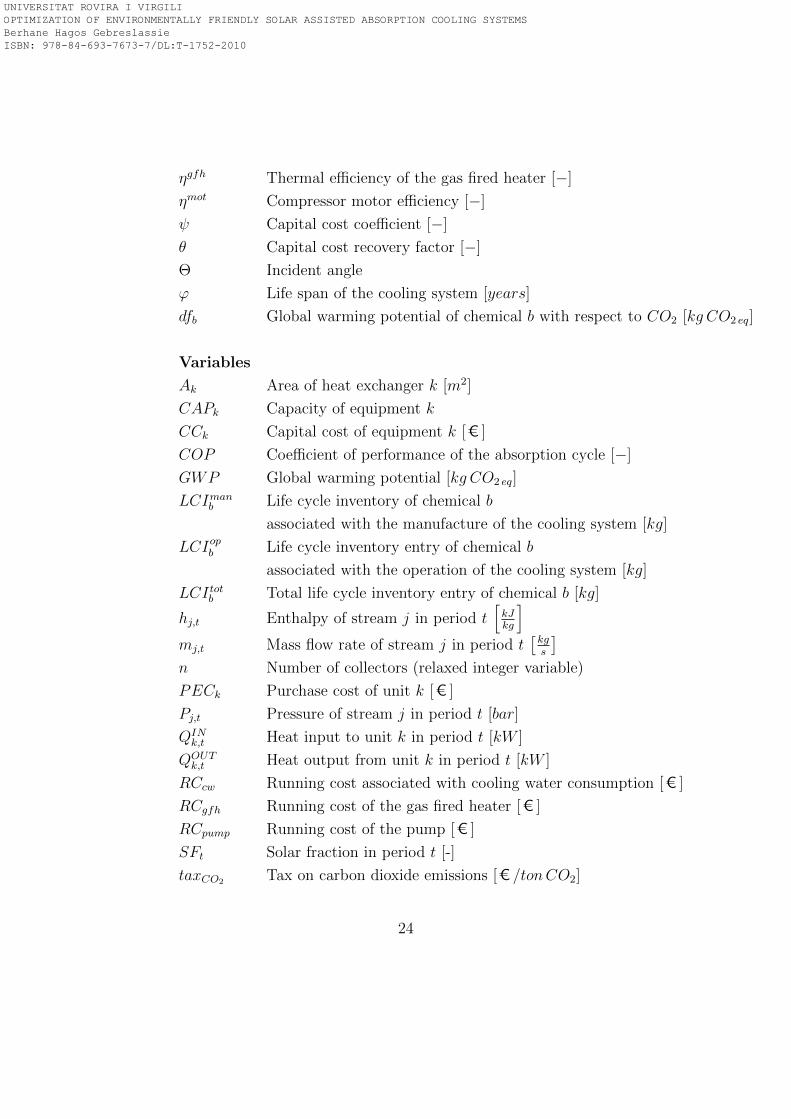
ηgfh Thermal efficiency of the gas fired heater [−]
ηmot Compressor motor efficiency [−]
ψ Capital cost coefficient [−]
θ Capital cost recovery factor [−]
Θ Incident angle
ϕ Life span of the cooling system [years]
dfb Global warming potential of chemical b with respect to CO2 [kg CO2 eq]
Variables
Ak Area of heat exchanger k [m2]
CAPk Capacity of equipment k
CCk Capital cost of equipment k [C ]
COP Coefficient of performance of the absorption cycle [−]
GWP Global warming potential [kg CO2 eq]
LCImanb Life cycle inventory of chemical b
associated with the manufacture of the cooling system [kg]
LCIopb Life cycle inventory entry of chemical b
associated with the operation of the cooling system [kg]
LCI totb Total life cycle inventory entry of chemical b [kg]
hj,t Enthalpy of stream j in period t[kJkg
]
mj,t Mass flow rate of stream j in period t[kgs
]
n Number of collectors (relaxed integer variable)
PECk Purchase cost of unit k [C ]
Pj,t Pressure of stream j in period t [bar]
QINk,t Heat input to unit k in period t [kW ]
QOUTk,t Heat output from unit k in period t [kW ]
RCcw Running cost associated with cooling water consumption [ C ]
RCgfh Running cost of the gas fired heater [ C ]
RCpump Running cost of the pump [C ]
SFt Solar fraction in period t [-]
taxCO2 Tax on carbon dioxide emissions [ C /tonCO2]
24
UNIVERSITAT ROVIRA I VIRGILI OPTIMIZATION OF ENVIRONMENTALLY FRIENDLY SOLAR ASSISTED ABSORPTION COOLING SYSTEMS Berhane Hagos Gebreslassie ISBN: 978-84-693-7673-7/DL:T-1752-2010
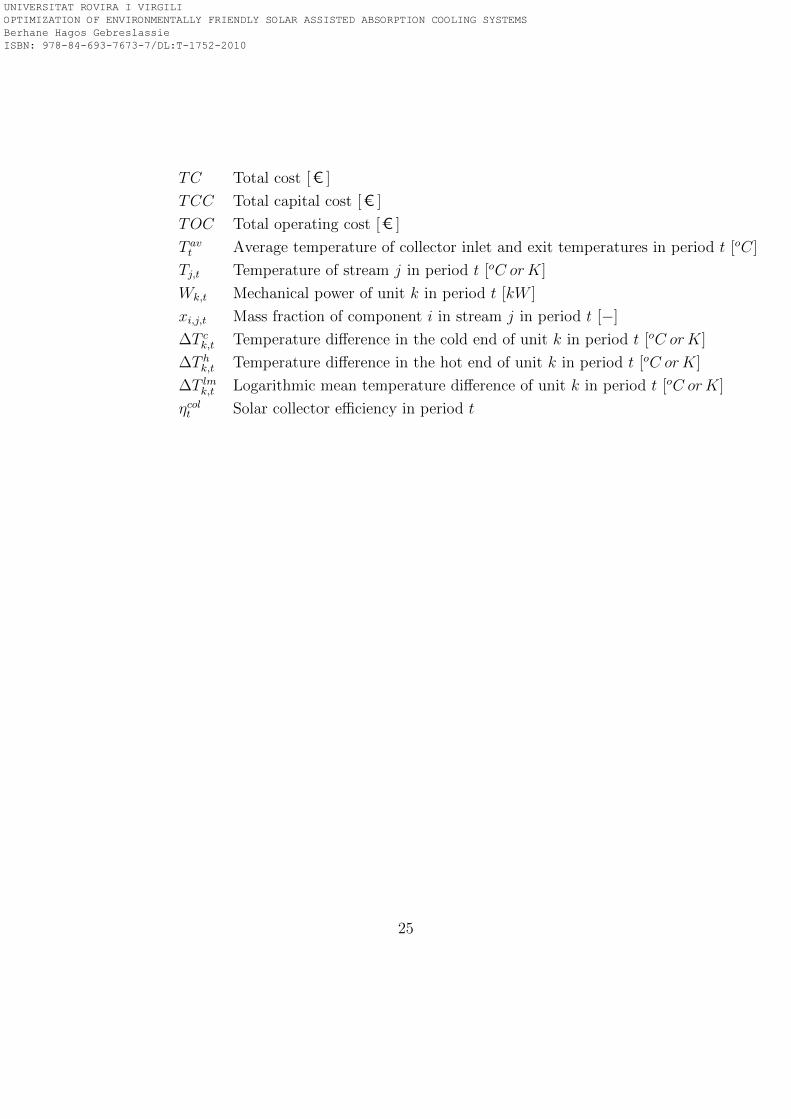
TC Total cost [C ]
TCC Total capital cost [C ]
TOC Total operating cost [ C ]
T avt Average temperature of collector inlet and exit temperatures in period t [oC]
Tj,t Temperature of stream j in period t [oC orK]
Wk,t Mechanical power of unit k in period t [kW ]
xi,j,t Mass fraction of component i in stream j in period t [−]
∆T ck,t Temperature difference in the cold end of unit k in period t [oC orK]
∆T hk,t Temperature difference in the hot end of unit k in period t [oC orK]
∆T lmk,t Logarithmic mean temperature difference of unit k in period t [oC orK]
ηcolt Solar collector efficiency in period t
25
UNIVERSITAT ROVIRA I VIRGILI OPTIMIZATION OF ENVIRONMENTALLY FRIENDLY SOLAR ASSISTED ABSORPTION COOLING SYSTEMS Berhane Hagos Gebreslassie ISBN: 978-84-693-7673-7/DL:T-1752-2010

Acknowledgements
Berhane H. Gebreslassie would like to acknowledge his gratitude for the
financial support received from the University Rovira i Virgili, the Spanish
Ministry of Education and Science (DPI2008-04099 and CTQ2009-14420-
C02) and the Spanish Ministry of External Affairs (A/016473/08, HS2007-
0006 and A/023551/09). We would also like to thank the MSc. student
Melanie Jimenez for helping to produce the numerical result for the case
studies.
26
UNIVERSITAT ROVIRA I VIRGILI OPTIMIZATION OF ENVIRONMENTALLY FRIENDLY SOLAR ASSISTED ABSORPTION COOLING SYSTEMS Berhane Hagos Gebreslassie ISBN: 978-84-693-7673-7/DL:T-1752-2010
References
[1] Commission of the European Communities . Towards a european strat-
egy for the security of energy supply. Tech. Rep.; 2001.
[2] PRe-Consultants. SimaPro 7 LCA software. The Netherlands
(www.pre.nl/simapro/default.htm); 2008.
[3] Casals XG. Solar absorption cooling in spain: Perspectives and out-
comes from the simulation of recent instalations. Renewable Energy
2006;31:1371–89.
[4] McMullan JT. Refrigeration and the environment – issues and strategies
for the future. International Journal of Refrigeration 2002;25:89–99.
[5] Jaruwongwittaya T, Chen G. A review: Renewable energy with absorp-
tion chillers in thailand. Renewable and Sustainable Energy Reviews
2010;14(5):1437 –44.
[6] Rosiek S, Batlles F. Integration of the solar thermal energy in the con-
struction: Analysis of the solar-assisted air-conditioning system installed
in CIESOL building. Renewable Energy 2009;34(6):1423 –31.
[7] Doukas H, Patlitzianas KD, Kagiannas AG, Psarras J. Renewable en-
ergy sources and rationale use of energy development in the countries of
gcc: Myth or reality? Renewable Energy 2006;31(6):755 –70.
[8] Henning HM. Solar-Assisted Air-Conditioning in Buildings. Springer
Wien/New York; ISBN: 3-211 - 00647-8; 2004.
[9] Azapagic A, Clift R. The application of life cycle assessment to process
optimisation. Computers and Chemical Engineering 1999;10:1509–26.
[10] Azapagic A, Clift R. Life cycle assessment and multiobjective optimi-
sation. Journal of Cleaner Production 1999;7:135–43.
27
UNIVERSITAT ROVIRA I VIRGILI OPTIMIZATION OF ENVIRONMENTALLY FRIENDLY SOLAR ASSISTED ABSORPTION COOLING SYSTEMS Berhane Hagos Gebreslassie ISBN: 978-84-693-7673-7/DL:T-1752-2010

[11] Guillen-Gosalbez G, Caballero JA, Esteller LJ. Application of life cycle
assessment to the structural optimization of process flowsheets. Indus-
trial & Engineering Chemistry Research 2008;47:777–89.
[12] Hugo A, Ciumei C, Buxton A, Pistikopoulos EN. Environmental impact
minimization through material substitution: a multi-objective optimiza-
tion approach. Green Chemistry 2004;6:407–17.
[13] Chavez-Islas LM, Heard CL. Design and analysis of an ammonia-water
absorption refrigeration cycle by means of an equation-oriented method.
Industrial & Engineering Chemistry Research 2009;48(4):1944–56.
[14] Gebreslassie BH, Guillen-Gosalbez G, Jimenez L, Boer D. Economic
performance optimization of an absorption cooling system under uncer-
tainity. Applied Thermal Engineering 2009;29:3491–500.
[15] Misra RD, Sahoo PK, Gupta A. Thermoeconomic evaluation and op-
timization of an aqua-ammonia vapour-absorption refrigeration system.
International Journal of Refrigeration 2006;29:47–59.
[16] Gebreslassie BH, Medrano M, Mendes F, Boer D. Optimum heat ex-
changer area estimation using coefficients of structural bonds: Appli-
cation to an absorption chiller. International Journal of Refrigeration
2010;33:529–37.
[17] Bernier E, Marechal F, Samson R. Multi-objective design optimization
of a natural gas-combined cycle with carbon dioxide capture in a life
cycle perspective. Energy 2010;35:1121–8.
[18] Molyneaux A, Leyland G, Favrat D. Environomic multi-objective op-
timisation of a district heating network considering centralized and de-
centralized heat pumps. Energy 2010;35:751 –8.
[19] Li H, Marechal F, Burer M, Favrat D. Multi-objective optimization of an
advanced combined cycle power plant including co2 separation options.
Energy 2006;31:3117 –34.
28
UNIVERSITAT ROVIRA I VIRGILI OPTIMIZATION OF ENVIRONMENTALLY FRIENDLY SOLAR ASSISTED ABSORPTION COOLING SYSTEMS Berhane Hagos Gebreslassie ISBN: 978-84-693-7673-7/DL:T-1752-2010
[20] Svensson E, Berntsson T. Economy and co2 emissions trade-off: A sys-
tematic approach for optimizing investments in process integration mea-
sures under uncertainty. Applied Thermal Engineering 2010;30(1):23–9.
[21] IRAM-ISO 14040. Environmental management-Life cycle assesment-
Principles and frame work. 2006.
[22] Azapagic A. Life cycle assessment and its application to process selec-
tion, design and optimisation. Chemical Engineering Journal 1999;73:1–
21.
[23] Guillen-Gosalbez G, Grossmann IE. A global optimization strategy for
the environmentally conscious design of chemical supply chains under
uncertainty in the damage assessment model. Computers & Chemical
Engineering 2010;34(1):42–58.
[24] The ecoinvent Center. A competence centre of ETH,PSI,EMA&ART,
http://www.ecoinvent.ch/. ecoinvent data v21.
[25] Gebreslassie BH, Guillen-Gosalbez G, Jimenez L, Boer D. Design of en-
vironmentally conscious absorption cooling systems via multi-objective
optimization and life cycle assesment. Applied Energy 2009;86:1712–22.
[26] Kalogirou SA. Solar thermal collectors and applications. Progress in
Energy and Combustion Science 2004;30(3):231 –95.
[27] Gian-Kasper P, Stocker T, Midgley P, Tignor M. IPCC Expert Meeting
on the Science of Alternative Metrics. 2009.
[28] Brooke A, Kendrik D, Meeraus A, Raman R, Rosenthal RE. GAMS -
A User’s Guide. GAMS Development Corporation, Washington; 1998.
[29] Drud A. CONOPT Solver Manual. ARKI Consulting and Development,
Bagsvaerd, Denmark; 1996.
29
UNIVERSITAT ROVIRA I VIRGILI OPTIMIZATION OF ENVIRONMENTALLY FRIENDLY SOLAR ASSISTED ABSORPTION COOLING SYSTEMS Berhane Hagos Gebreslassie ISBN: 978-84-693-7673-7/DL:T-1752-2010

[30] Solomon S, Qin D, Manning M, Chen Z, Marquis M, Averyt K, Tignor
M, Miller HL. Contribution of working group I to the fourth assess-
ment report of the intergovernmental panel on climate change. Tech.
Rep.Cambridge University Press, Cambridge, United Kingdom and New
York, NY, USA; 2007.
[31] Generalitat de Catalunya, Departament d’Industria, Comerc i Tur-
isme. ATLAS DE RADIACIO SOLAR A CATALUNYA. http :
//www20.gencat.cat/docs/icaen; 2000.
[32] F-Chart Software. Engineering equation solver, (EES).
www.fchart.com.
[33] Berube JF, Gendreau M, Potvin JY. An exact ε-constraint method for
bi-objective combinatorial optimization problems: Application to the
traveling salesman problem with profits. European Journal of Opera-
tional Research 2009;194(1):39 – 50.
[34] Patek J, Klomfar J. Simple functions for fast calculations of selected
thermodynamic properties of the ammonia-water system. International
Journal of Refrigeration 1995;18:228–34.
[35] Edgar TF, Himmelblau DM, Lasdon LS. Optimization of chemical pro-
cesses. McGraw-Hill; 2001.
[36] Bejan A, Tsatsaronis G, Moran M. Thermal Design & Optimization.
John Wiley & Sons Inc.; 1996.
[37] Turton R, Bailie RC, Whiting WB, Shaeiwitz JA. Analysis, Synthesis,
and Design of Chemical Processes. Prentice Hall PTR, New Jersey;
2003.
[38] Chemical Engineering. Chemical engineering plant cost index
(CEPCI). Tech. Rep., Chemical engineering. www.CHE.com; 2009.
30
UNIVERSITAT ROVIRA I VIRGILI OPTIMIZATION OF ENVIRONMENTALLY FRIENDLY SOLAR ASSISTED ABSORPTION COOLING SYSTEMS Berhane Hagos Gebreslassie ISBN: 978-84-693-7673-7/DL:T-1752-2010

List of Figures
1 Environmental analysis of the electricity and thermal energy
driven chillers. . . . . . . . . . . . . . . . . . . . . . . . . . . . 32
2 Solar assisted absorption chiller. . . . . . . . . . . . . . . . . . 33
3 Pareto optimal designs of the base case. . . . . . . . . . . . . . 34
4 Solar fraction in each month for the selected Pareto optimal
designs. . . . . . . . . . . . . . . . . . . . . . . . . . . . . . . 35
5 GWP during the operation of the cooling system for the se-
lected Pareto optimal designs. . . . . . . . . . . . . . . . . . . 36
6 Pareto optimal designs for different fuel prices. . . . . . . . . . 37
7 The minimum cost solutions GWP at different fuel costs of
the Pareto sets given in Fig. 6. In the figure, (1) refers to the
total life cycle GWP; (2) to the life cycle GWP associated with
the manufacturing of the cycle; (3) to the life cycle emissions
during the operation of the cooling system; and (4) to the CO2
emissions in the gas fired heater. . . . . . . . . . . . . . . . . . 38
31
UNIVERSITAT ROVIRA I VIRGILI OPTIMIZATION OF ENVIRONMENTALLY FRIENDLY SOLAR ASSISTED ABSORPTION COOLING SYSTEMS Berhane Hagos Gebreslassie ISBN: 978-84-693-7673-7/DL:T-1752-2010
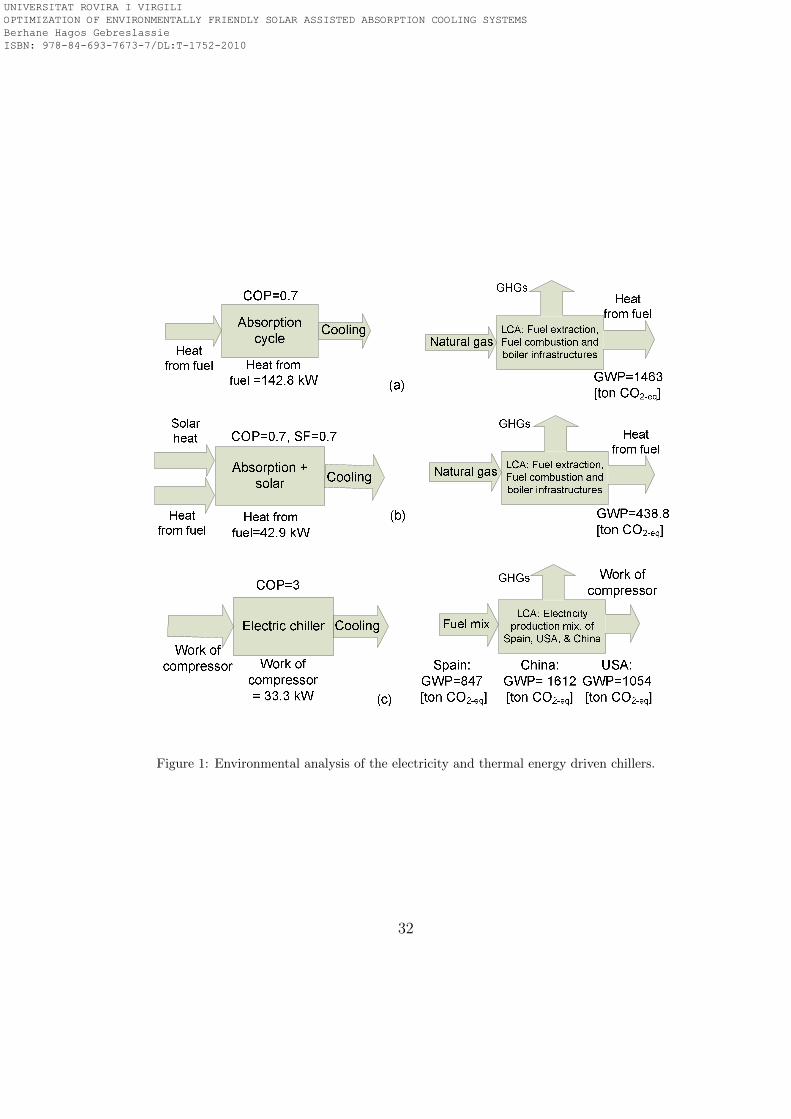
Figure 1: Environmental analysis of the electricity and thermal energy driven chillers.
32
UNIVERSITAT ROVIRA I VIRGILI OPTIMIZATION OF ENVIRONMENTALLY FRIENDLY SOLAR ASSISTED ABSORPTION COOLING SYSTEMS Berhane Hagos Gebreslassie ISBN: 978-84-693-7673-7/DL:T-1752-2010
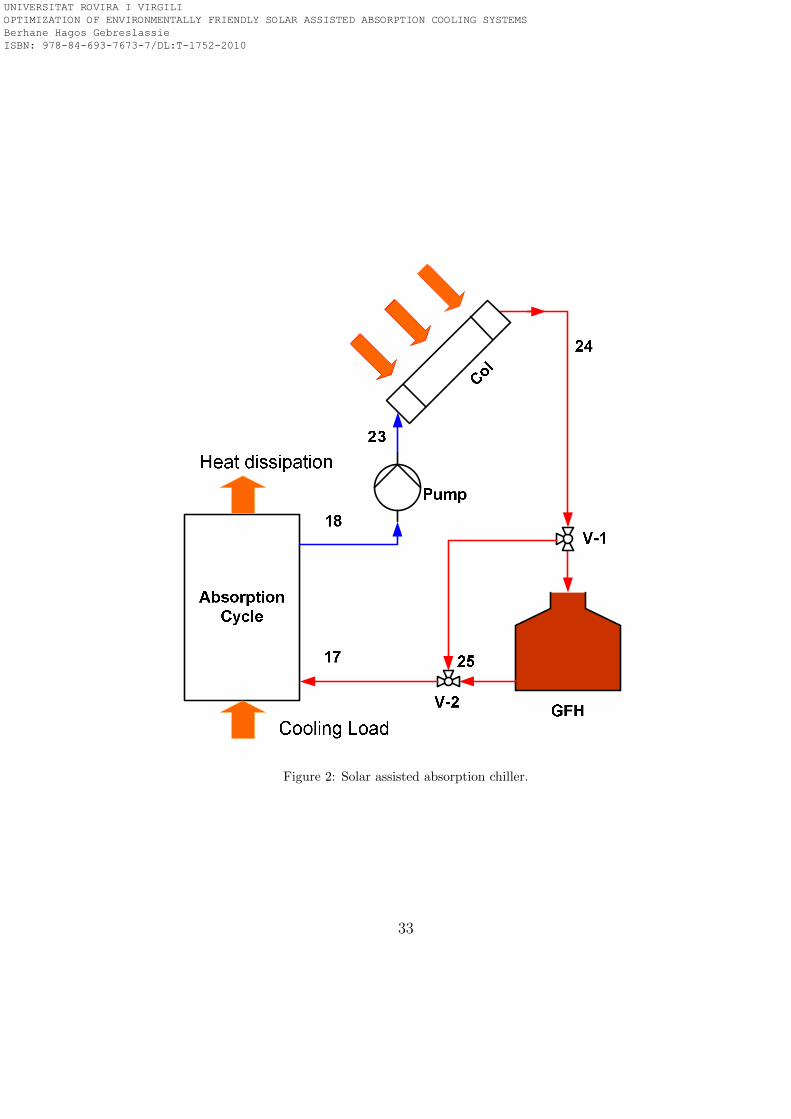
Col
Figure 2: Solar assisted absorption chiller.
33
UNIVERSITAT ROVIRA I VIRGILI OPTIMIZATION OF ENVIRONMENTALLY FRIENDLY SOLAR ASSISTED ABSORPTION COOLING SYSTEMS Berhane Hagos Gebreslassie ISBN: 978-84-693-7673-7/DL:T-1752-2010
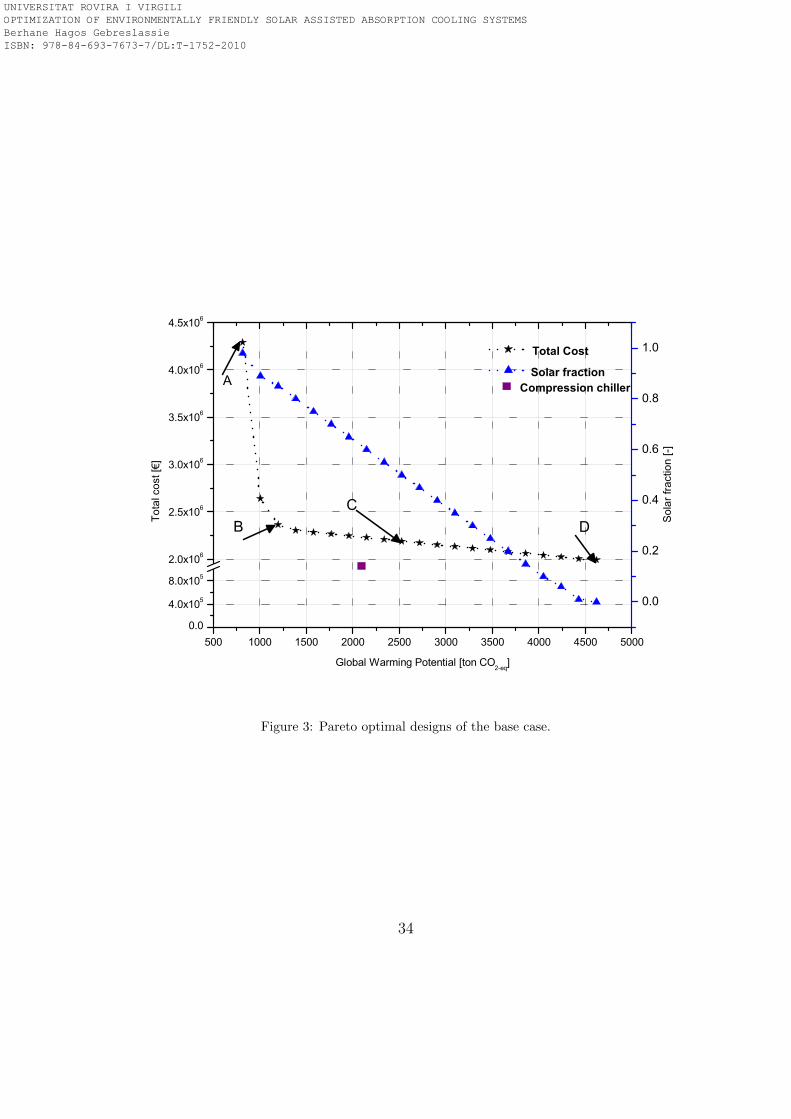
500 1000 1500 2000 2500 3000 3500 4000 4500 50000.0
4.0x10⁵
8.0x10⁵
2.0x10⁶
2.5x10⁶
3.0x10⁶
3.5x10⁶
4.0x10⁶
4.5x10⁶
Total Cost
Solar fraction
Global Warming Potential [ton CO2-eq]
Tota
l cos
t []
A
BC
D
Compression chiller
0.0
0.2
0.4
0.6
0.8
1.0
Sol
ar fr
actio
n [-]
Figure 3: Pareto optimal designs of the base case.
34
UNIVERSITAT ROVIRA I VIRGILI OPTIMIZATION OF ENVIRONMENTALLY FRIENDLY SOLAR ASSISTED ABSORPTION COOLING SYSTEMS Berhane Hagos Gebreslassie ISBN: 978-84-693-7673-7/DL:T-1752-2010
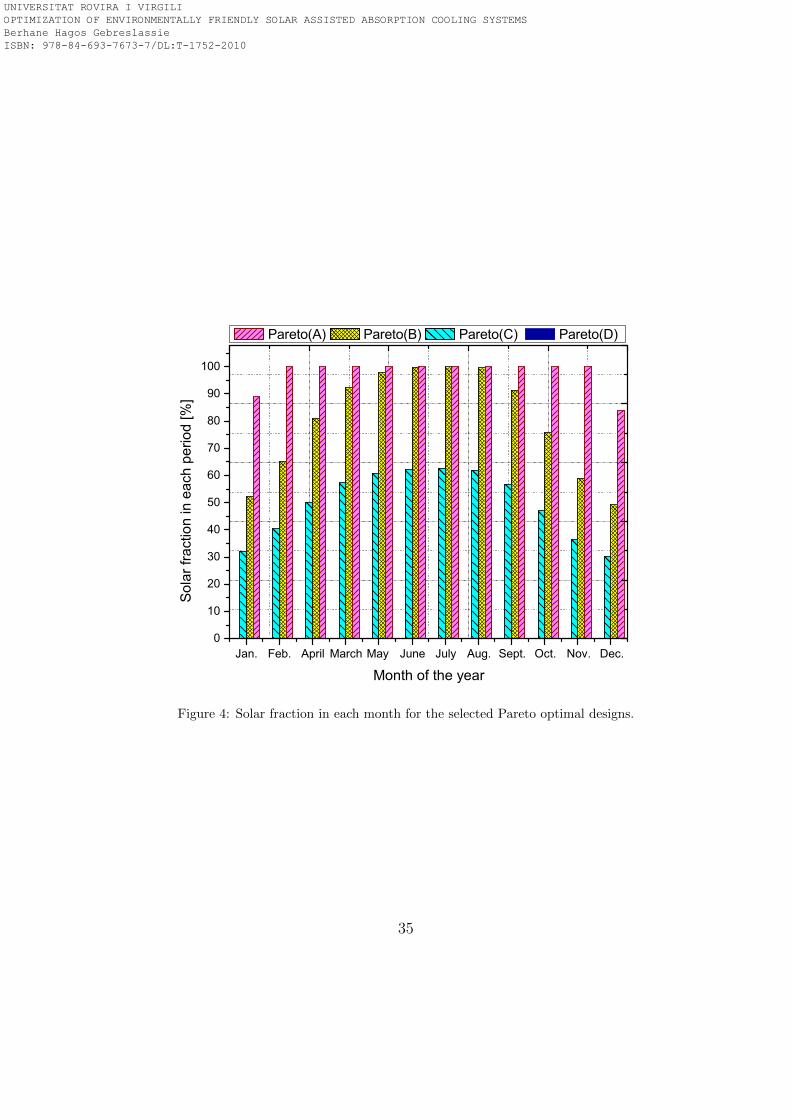
Jan. Feb. April March May June July Aug. Sept. Oct. Nov. Dec.0
10
20
30
40
50
60
70
80
90
100
Sol
ar fr
actio
n in
eac
h pe
riod
[%]
Month of the year
Pareto(A) Pareto(B) Pareto(C) Pareto(D)
Figure 4: Solar fraction in each month for the selected Pareto optimal designs.
35
UNIVERSITAT ROVIRA I VIRGILI OPTIMIZATION OF ENVIRONMENTALLY FRIENDLY SOLAR ASSISTED ABSORPTION COOLING SYSTEMS Berhane Hagos Gebreslassie ISBN: 978-84-693-7673-7/DL:T-1752-2010

Jan. Feb. April March May June July Aug. Sept. Oct. Nov. Dec.0
50
100
150
200
250
300
350
400
GW
P d
ue to
ope
ratio
n in
life
spa
n o
f the
sys
tem
[ton
CO
2-eq
]
Month of the year
Pareto(A) Pareto(B) Pareto(C) Pareto(D)
Figure 5: GWP during the operation of the cooling system for the selected Pareto optimal
designs.
36
UNIVERSITAT ROVIRA I VIRGILI OPTIMIZATION OF ENVIRONMENTALLY FRIENDLY SOLAR ASSISTED ABSORPTION COOLING SYSTEMS Berhane Hagos Gebreslassie ISBN: 978-84-693-7673-7/DL:T-1752-2010
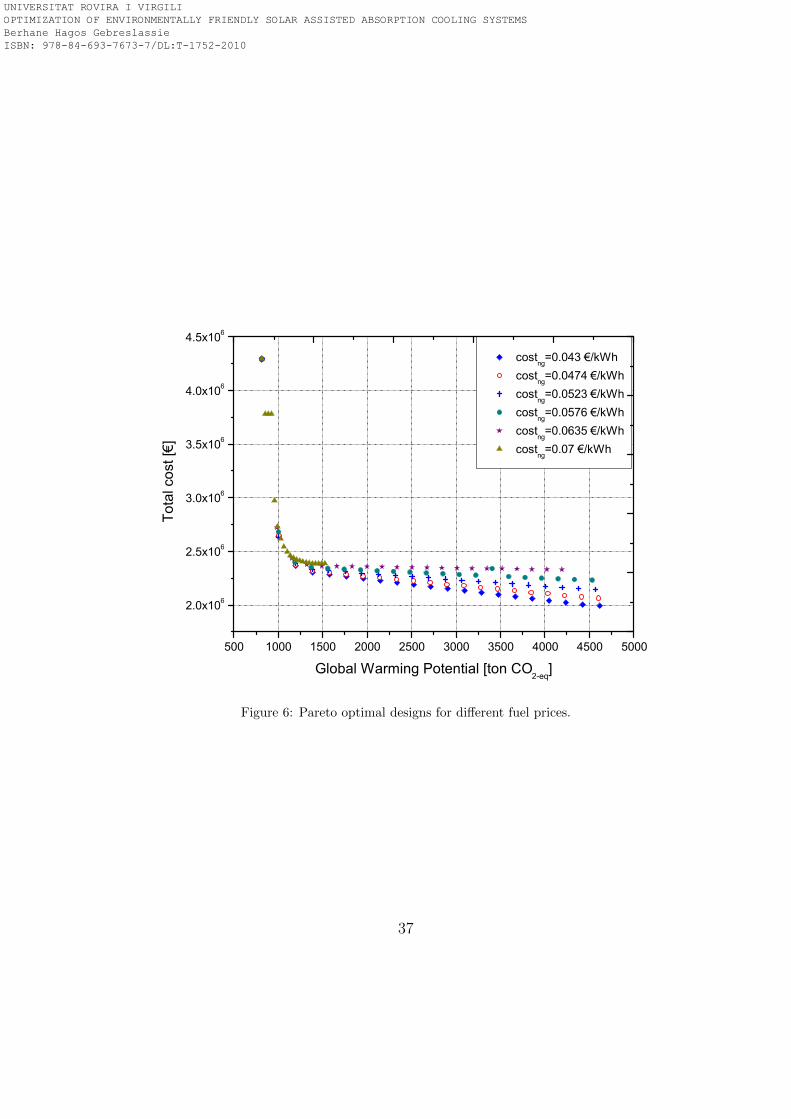
500 1000 1500 2000 2500 3000 3500 4000 4500 5000
2.0x10⁶
2.5x10⁶
3.0x10⁶
3.5x10⁶
4.0x10⁶
4.5x10⁶
costng=0.043 /kWh costng=0.0474 /kWh costng=0.0523 /kWh costng=0.0576 /kWh costng=0.0635 /kWh costng=0.07 /kWh
Tota
l cos
t []
Global Warming Potential [ton CO2-eq
]
Figure 6: Pareto optimal designs for different fuel prices.
37
UNIVERSITAT ROVIRA I VIRGILI OPTIMIZATION OF ENVIRONMENTALLY FRIENDLY SOLAR ASSISTED ABSORPTION COOLING SYSTEMS Berhane Hagos Gebreslassie ISBN: 978-84-693-7673-7/DL:T-1752-2010
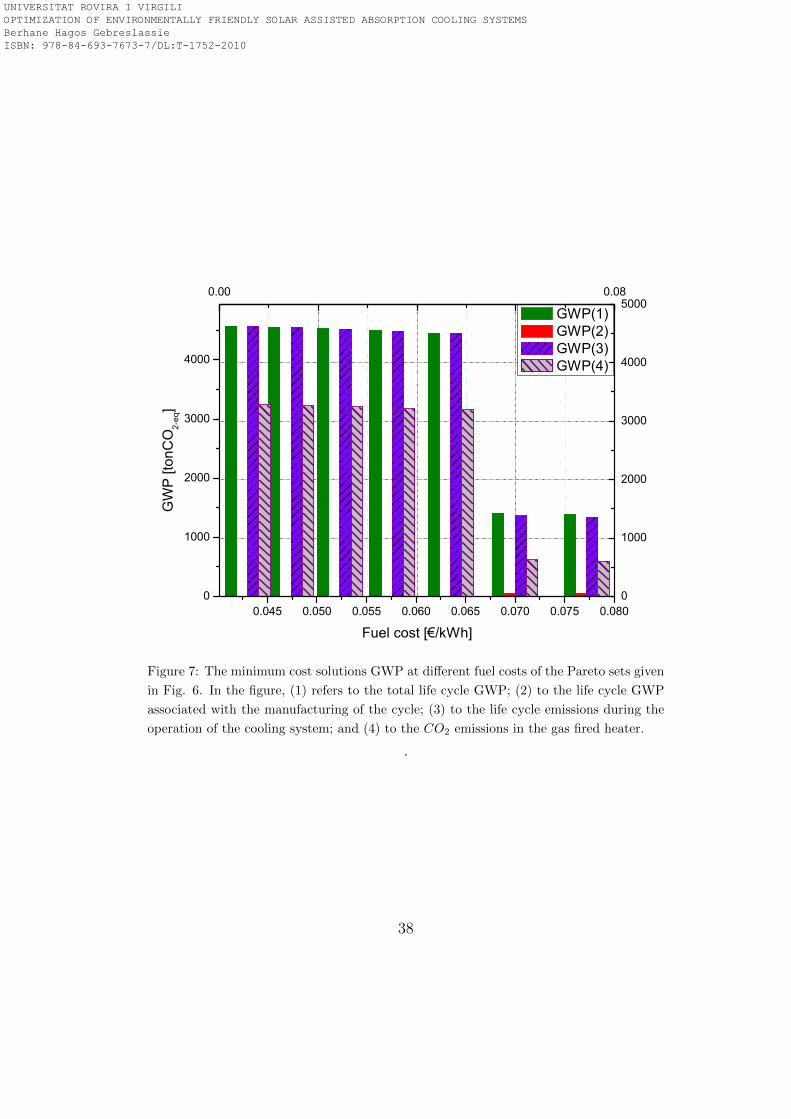
0.045 0.050 0.055 0.060 0.065 0.070 0.075 0.0800
1000
2000
3000
4000
GW
P [t
onC
O2-
eq]
Fuel cost [ /kWh]
GWP(1) GWP(2) GWP(3) GWP(4)
0.00 0.08
0
1000
2000
3000
4000
5000
Figure 7: The minimum cost solutions GWP at different fuel costs of the Pareto sets given
in Fig. 6. In the figure, (1) refers to the total life cycle GWP; (2) to the life cycle GWP
associated with the manufacturing of the cycle; (3) to the life cycle emissions during the
operation of the cooling system; and (4) to the CO2 emissions in the gas fired heater.
.
38
UNIVERSITAT ROVIRA I VIRGILI OPTIMIZATION OF ENVIRONMENTALLY FRIENDLY SOLAR ASSISTED ABSORPTION COOLING SYSTEMS Berhane Hagos Gebreslassie ISBN: 978-84-693-7673-7/DL:T-1752-2010

List of Tables
1 Barcelona daily global solar radiation and ambient tempera-
ture for 450 inclination. . . . . . . . . . . . . . . . . . . . . . . 40
2 The Pareto optimal design taxCO2 and solar fraction of Fig. 3. 41
3 GWP, Solar fraction and taxCO2 for some of the fuel costs of
the Pareto optimal designs shown in Fig. 6. . . . . . . . . . . 42
B.4 Economic Parameters . . . . . . . . . . . . . . . . . . . . . . . 47
39
UNIVERSITAT ROVIRA I VIRGILI OPTIMIZATION OF ENVIRONMENTALLY FRIENDLY SOLAR ASSISTED ABSORPTION COOLING SYSTEMS Berhane Hagos Gebreslassie ISBN: 978-84-693-7673-7/DL:T-1752-2010

Table 1: Barcelona daily global solar radiation and ambient temperature for 450 inclina-
tion.
Period Gt T ambt
[W/m2] [oC]
January 297.0 8.2
February 350.7 9.4
March 415.3 11.1
April 460.4 13.1
May 478.5 17.0
June 482.4 20.9
July 483.8 23.5
August 477.5 24.1
September 445.8 21.6
October 385.0 17.3
November 320.6 12.1
December 282.2 9.9
40
UNIVERSITAT ROVIRA I VIRGILI OPTIMIZATION OF ENVIRONMENTALLY FRIENDLY SOLAR ASSISTED ABSORPTION COOLING SYSTEMS Berhane Hagos Gebreslassie ISBN: 978-84-693-7673-7/DL:T-1752-2010
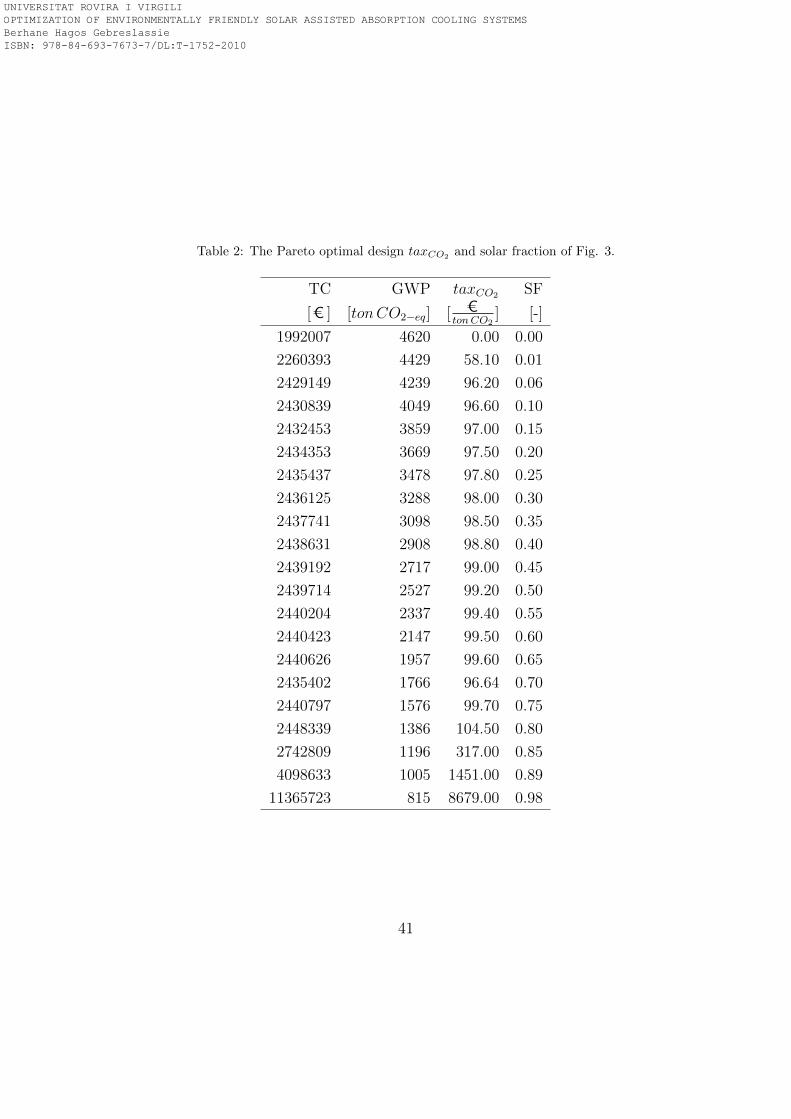
Table 2: The Pareto optimal design taxCO2 and solar fraction of Fig. 3.
TC GWP taxCO2 SF
[C ] [tonCO2−eq] [ CtonCO2
] [-]
1992007 4620 0.00 0.00
2260393 4429 58.10 0.01
2429149 4239 96.20 0.06
2430839 4049 96.60 0.10
2432453 3859 97.00 0.15
2434353 3669 97.50 0.20
2435437 3478 97.80 0.25
2436125 3288 98.00 0.30
2437741 3098 98.50 0.35
2438631 2908 98.80 0.40
2439192 2717 99.00 0.45
2439714 2527 99.20 0.50
2440204 2337 99.40 0.55
2440423 2147 99.50 0.60
2440626 1957 99.60 0.65
2435402 1766 96.64 0.70
2440797 1576 99.70 0.75
2448339 1386 104.50 0.80
2742809 1196 317.00 0.85
4098633 1005 1451.00 0.89
11365723 815 8679.00 0.98
41
UNIVERSITAT ROVIRA I VIRGILI OPTIMIZATION OF ENVIRONMENTALLY FRIENDLY SOLAR ASSISTED ABSORPTION COOLING SYSTEMS Berhane Hagos Gebreslassie ISBN: 978-84-693-7673-7/DL:T-1752-2010

Tab
le3:
GW
P,Solar
fraction
andtaxCO
2forsomeof
thefuel
costsof
theParetoop
timal
designsshow
nin
Fig.6.
fuel
cost=
0.0474
CkW
hfuel
cost=
0.0635
CkW
hfuel
cost=
0.07
CkW
h
GWP
taxCO
2SF
GWP
taxCO
2SF
GWP
taxCO
2SF
[ton
CO
2−e
q]
CtonCO
2]
[−]
[ton
CO
2−e
q]
CtonCO
2]
[−]
[ton
CO
2−e
q]
CtonCO
2]
[−]
4604
0.0
0.00
4194
0.0
0.08
1524
-18.4
0.77
4414
48.7
0.01
4025
10.2
0.11
1489
-18.3
0.78
4225
77.8
0.06
3856
11.0
0.16
1453
-14.1
0.79
4035
78.5
0.11
3687
11.3
0.20
1418
-11.2
0.80
3846
78.8
0.16
3518
11.6
0.24
1382
20.9
0.80
3657
79.0
0.21
3349
11.9
0.29
1347
109.0
0.81
3467
79.5
0.25
3180
12.2
0.33
1311
175.5
0.82
3278
79.8
0.30
3011
12.4
0.37
1276
221.8
0.83
3088
80.0
0.35
2842
12.6
0.42
1241
225.0
0.84
2899
80.3
0.40
2674
12.8
0.46
1205
271.5
0.85
2709
80.6
0.45
2505
13.0
0.51
1170
477.0
0.86
2520
80.7
0.50
2336
13.1
0.55
1134
636.0
0.86
2331
80.8
0.55
2167
13.2
0.60
1099
935.0
0.87
2141
81.0
0.60
1998
13.2
0.64
1063
1398.0
0.88
1952
81.0
0.65
1829
13.3
0.69
1028
2082.5
0.89
1762
81.1
0.70
1660
13.3
0.73
992
3180.0
0.89
1573
81.2
0.75
1491
13.3
0.78
957
6861.0
0.90
1383
86.5
0.80
1322
69.5
0.82
922
7597.1
0.91
1194
304.0
0.85
1153
356.5
0.86
886
7597.1
0.91
1005
1460.0
0.89
984
1694.0
0.90
851
7597.1
0.91
815
8671.0
0.98
815
9325.0
0.98
815
14608.0
0.98
42
UNIVERSITAT ROVIRA I VIRGILI OPTIMIZATION OF ENVIRONMENTALLY FRIENDLY SOLAR ASSISTED ABSORPTION COOLING SYSTEMS Berhane Hagos Gebreslassie ISBN: 978-84-693-7673-7/DL:T-1752-2010

Appendices
Appendix A. Energy and material balance applied to each unit of
the cooling system
The model of the integrated absorption cycle is based on mass and energy
conservation laws. It includes also equations for assessing the economic and
environmental performance of the cooling system. We provide next the main
constraints of the model. Further details can be found in [14, 25].
• Mass balance: The total mass of component i that enters unit k in
period t is equal to the total mass of the same component i that leaves
the unit.∑
j∈IN(k)
mj,txi,j,t −∑
j∈OUT (k)
mj,txi,j,t = 0 ∀k, i, t (A.1)
In this equation, mj,t is the mass flow rate of stream j in time period
t, xi,j,t is the composition of component i in stream j and period t, and
IN(k) and OUT (k) are the set of input and output streams associated
with unit k.
• Energy balance: The difference in heat content between the inlet and
outlet streams of a unit k plus the difference in heat supplied (QINk,t )
and removed (QOUTk,t ) minus the work done (Wk,t) must equal zero in
each period t. Furthermore, the input and output heat terms are zero
in some units of the cycle.∑
j∈IN(k)
mj,thj,t−∑
j∈OUT (k)
mj,thj,t+QINk,t−QOUT
k,t −Wk,t = 0 ∀k, t (A.2)
QINk,t = 0 if k =
Absorber (AB)
Condenser (Con)
Subcooler (SC)
Solution heat exchanger (SHX)
Pump (Pump)
Expansion valves (Exp)
(A.3)
43
UNIVERSITAT ROVIRA I VIRGILI OPTIMIZATION OF ENVIRONMENTALLY FRIENDLY SOLAR ASSISTED ABSORPTION COOLING SYSTEMS Berhane Hagos Gebreslassie ISBN: 978-84-693-7673-7/DL:T-1752-2010
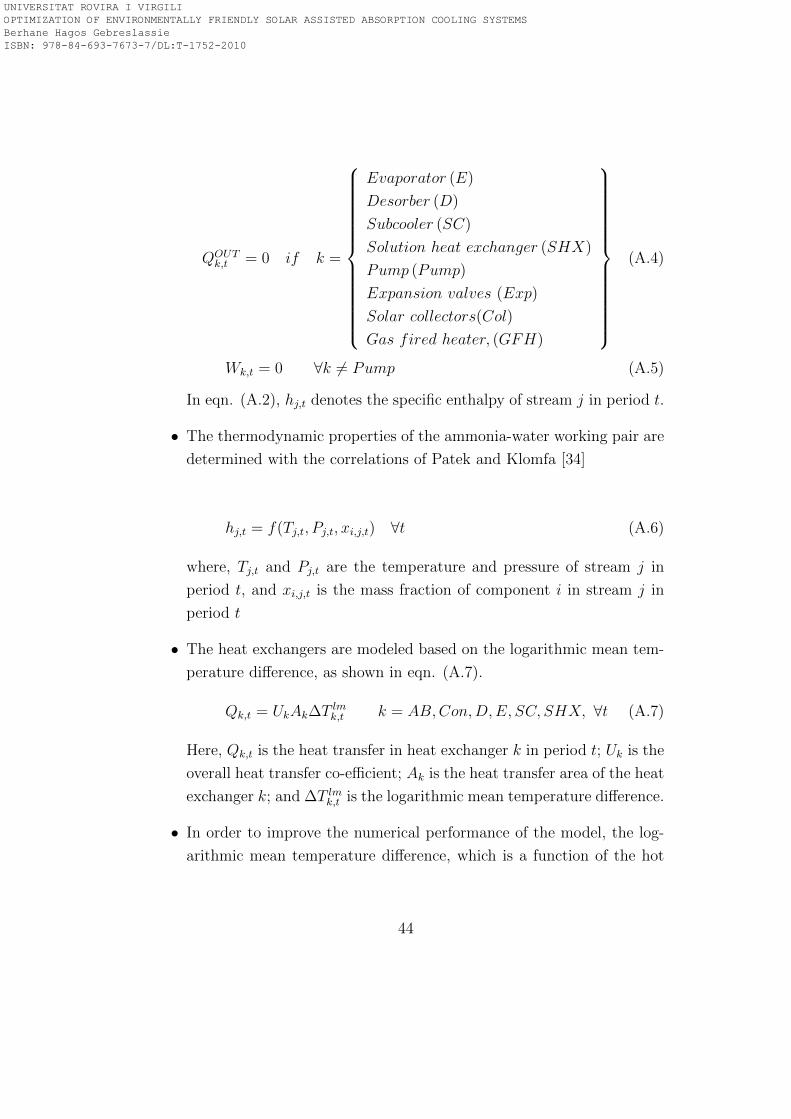
QOUTk,t = 0 if k =
Evaporator (E)
Desorber (D)
Subcooler (SC)
Solution heat exchanger (SHX)
Pump (Pump)
Expansion valves (Exp)
Solar collectors(Col)
Gas fired heater, (GFH)
(A.4)
Wk,t = 0 ∀k 6= Pump (A.5)
In eqn. (A.2), hj,t denotes the specific enthalpy of stream j in period t.
• The thermodynamic properties of the ammonia-water working pair are
determined with the correlations of Patek and Klomfa [34]
hj,t = f(Tj,t, Pj,t, xi,j,t) ∀t (A.6)
where, Tj,t and Pj,t are the temperature and pressure of stream j in
period t, and xi,j,t is the mass fraction of component i in stream j in
period t
• The heat exchangers are modeled based on the logarithmic mean tem-
perature difference, as shown in eqn. (A.7).
Qk,t = UkAk∆T lmk,t k = AB,Con,D,E, SC, SHX, ∀t (A.7)
Here, Qk,t is the heat transfer in heat exchanger k in period t; Uk is the
overall heat transfer co-efficient; Ak is the heat transfer area of the heat
exchanger k; and ∆T lmk,t is the logarithmic mean temperature difference.
• In order to improve the numerical performance of the model, the log-
arithmic mean temperature difference, which is a function of the hot
44
UNIVERSITAT ROVIRA I VIRGILI OPTIMIZATION OF ENVIRONMENTALLY FRIENDLY SOLAR ASSISTED ABSORPTION COOLING SYSTEMS Berhane Hagos Gebreslassie ISBN: 978-84-693-7673-7/DL:T-1752-2010
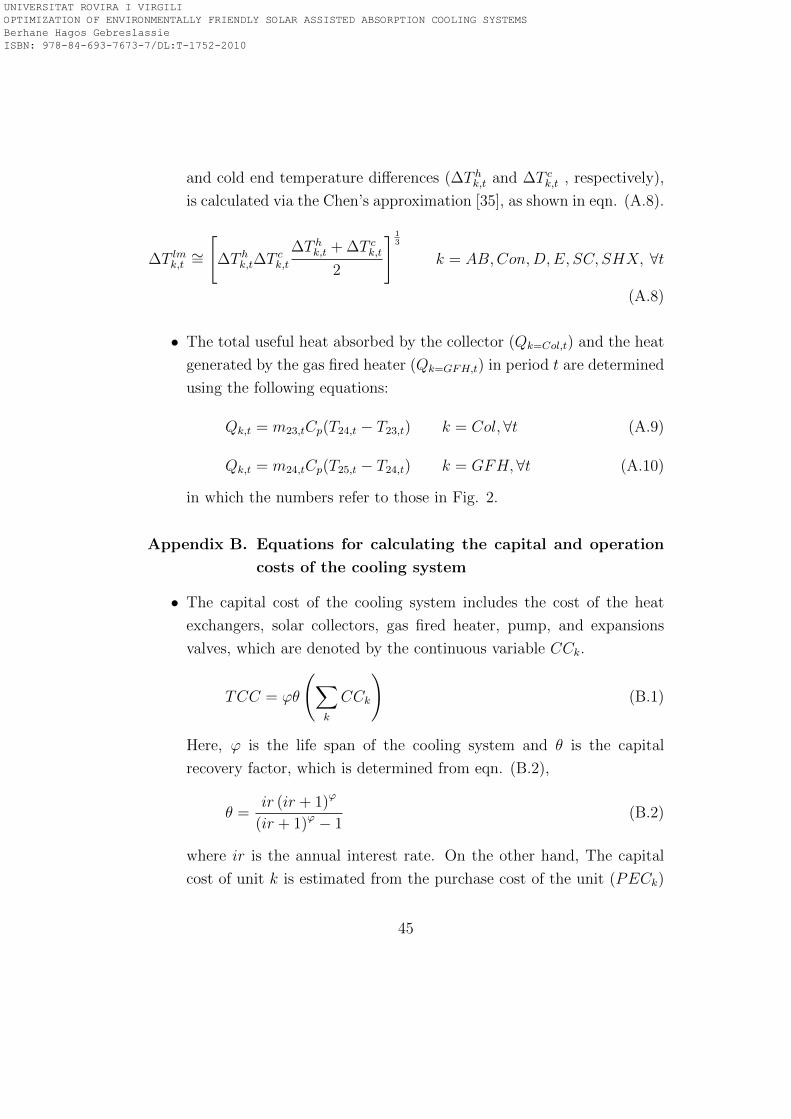
and cold end temperature differences (∆T hk,t and ∆T c
k,t , respectively),
is calculated via the Chen’s approximation [35], as shown in eqn. (A.8).
∆T lmk,t
∼=[∆T h
k,t∆T ck,t
∆T hk,t +∆T c
k,t
2
] 13
k = AB,Con,D,E, SC, SHX, ∀t
(A.8)
• The total useful heat absorbed by the collector (Qk=Col,t) and the heat
generated by the gas fired heater (Qk=GFH,t) in period t are determined
using the following equations:
Qk,t = m23,tCp(T24,t − T23,t) k = Col, ∀t (A.9)
Qk,t = m24,tCp(T25,t − T24,t) k = GFH, ∀t (A.10)
in which the numbers refer to those in Fig. 2.
Appendix B. Equations for calculating the capital and operation
costs of the cooling system
• The capital cost of the cooling system includes the cost of the heat
exchangers, solar collectors, gas fired heater, pump, and expansions
valves, which are denoted by the continuous variable CCk.
TCC = ϕθ
(∑
k
CCk
)(B.1)
Here, ϕ is the life span of the cooling system and θ is the capital
recovery factor, which is determined from eqn. (B.2),
θ =ir (ir + 1)ϕ
(ir + 1)ϕ − 1(B.2)
where ir is the annual interest rate. On the other hand, The capital
cost of unit k is estimated from the purchase cost of the unit (PECk)
45
UNIVERSITAT ROVIRA I VIRGILI OPTIMIZATION OF ENVIRONMENTALLY FRIENDLY SOLAR ASSISTED ABSORPTION COOLING SYSTEMS Berhane Hagos Gebreslassie ISBN: 978-84-693-7673-7/DL:T-1752-2010

given by eqn. (B.5) and the cost parameter ψ, which has been taken
from Bejan et al. [36].
CCk = ψPECk ∀k 6= Col, ∀t (B.3)
The purchase cost of unit k in year 1996 (PEC1996k ) is estimated fol-
lowing Turton et al. [37].
PEC1996k = βk (CAPk)
αk ∀k 6= Col (B.4)
Where CAPk is the capacity measure of unit k. αk and βk are the cost
parameters, which are given in Table B.4, that have been obtained from
Turton et al. [37]. The purchase equipment cost is updated from year
1996 to year 2008 using the Chemical Engineering plant cost index [38]
as follows:
PECk = PEC1996k
CEPCI1996CEPCI2008
∀k (B.5)
Here, the parameters CEPCI1996 and CEPCI2008 refer to the Chemical
Engineering plant cost index in years 1996 and 2008, respectively.
The capital cost of the solar collector, which is given by eqn. (B.6),
is a function of the number of collectors (n), absorber area (Acol) and
collector cost per m2 of absorber area [8].
CCk = nAcolcostcol k = Col (B.6)
• The operating cost (TOC) of the cooling system accounts for the run-
ning cost of the gas fired heater (RCgfh), the running cost of the pump
(RCpump), and the cooling water cost (RCcw):
TOC = RCgfh +RCpump +RCcw (B.7)
RCgfh =costngϕTop
12ηgfh
(∑t
Qk,t
)k = GFH (B.8)
46
UNIVERSITAT ROVIRA I VIRGILI OPTIMIZATION OF ENVIRONMENTALLY FRIENDLY SOLAR ASSISTED ABSORPTION COOLING SYSTEMS Berhane Hagos Gebreslassie ISBN: 978-84-693-7673-7/DL:T-1752-2010
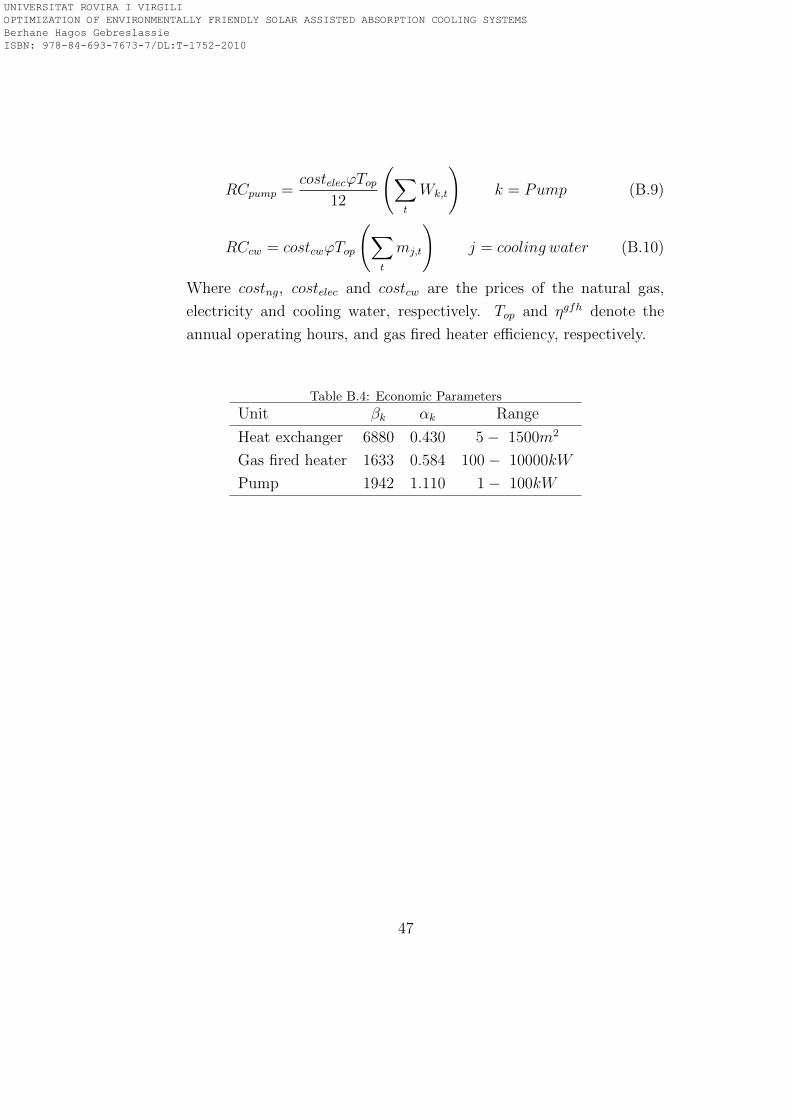
RCpump =costelecϕTop
12
(∑t
Wk,t
)k = Pump (B.9)
RCcw = costcwϕTop
(∑t
mj,t
)j = cooling water (B.10)
Where costng, costelec and costcw are the prices of the natural gas,
electricity and cooling water, respectively. Top and ηgfh denote the
annual operating hours, and gas fired heater efficiency, respectively.
Table B.4: Economic Parameters
Unit βk αk Range
Heat exchanger 6880 0.430 5− 1500m2
Gas fired heater 1633 0.584 100− 10000kW
Pump 1942 1.110 1− 100kW
47
UNIVERSITAT ROVIRA I VIRGILI OPTIMIZATION OF ENVIRONMENTALLY FRIENDLY SOLAR ASSISTED ABSORPTION COOLING SYSTEMS Berhane Hagos Gebreslassie ISBN: 978-84-693-7673-7/DL:T-1752-2010
Related Documents