Bulgarian Chemical Communications, Special Issue J, (pp. 364 – 375) 2016 364 Optimization of drilling parameters by analysis of formation strength properties with using mechanical specific energy A. Davarpanah 1 , M.M. Nassabeh 2 1 Department of Petroleum Engineering, Science and Research Branch, Islamic Azad University, Tehran, Iran. 2 Department of Petroleum Engineering, Islamic Azad University, Omidiyeh, Iran. Received May 17, 2017, Revised September 4, 2017 By increasing the daily needs of human energy, human manipulation of natural energy sources are expanded and encouraged the human society to developing science, knowledge and technology. Mechanical specific energy is required energy for drilling the unit of formation volume of oil wells. This parameter can be used for functional analysis of drilling, drilling bit optimization and investigating of instability has been made during drilling operations. This parameter can be used for decreasing of drilling costs of oil wells by increasing drilling speed, optimized the useful life of the drilling bit and determine the right time to replace the drilling bit, and in some cases reduced to a minimum amount. In South Pars field in Iran many wells have been drilled, however detailed statistics processes hadn’t done for optimizing drilling parameters and their impact on mechanical specific energy. By results of this study we can use to analyze performance and drilling parameters such as weight on drilling bit, rotational speed, penetration rate, etc. In most cases, mechanical specific energy at the end of each drilled wells, because of reducing movement speed has been increased. Although by investigating middle formations in section of 12.25 inch, all existing wells on a platform in one of the phases of Iran's South Pars field are being studied, which contains formations such as Hith, Surmeh, Neyriz, Dashtak and Kangan. Studies was done in two parts. In the first part, the range of optimized drilling parameters that is increasing drilling speed and reducing the required amount of energy for drilling formation. This process by investigating mechanical specific energy and its relationship with uniaxial compressive strength in five studied formation have been presented. In the second part, correlations to predict the mechanical specific energy in this area by statistical methods by SPSS software, presented and reviewed. Then, by the most appropriate relationship, the most influential drilling parameters on mechanical specific energy have been set. However, for drilling the next wells in this area drilling parameters with the most priority influences on mechanical specific energy, proposed in the optimum range, will be recommended. Keywords: mechanical specific energy, drilling bit penetration rate, compressive strength, statistical methods, oil wells. INTRODUCTION Special mechanical energy, is the required amount of energy for drilling the formation. This parameter is a function of drilling parameters such as weight on bit, rotational speed, torque, drilling penetration rate in the formation and the well diameter. Although if you used mud pumps, this parameter depended to proportion of speed to flow rate, the maximum rate of torque and maximum rate of pressure difference. Mechanical specific energy for both relational concept and correlational was introduced in 1964 by Tail. Since this parameter used in the diagnosis of instability during drilling operations was valuable. Drilling engineers are always by applying different weights on bit, speed of rotation and mud flow rate within the range of normal operation. They try to minimize the amount of mechanical specific energy and maximize the penetration rate of bit on the formation. Drilling engineers always try to approach mechanical specific energy within current formation compressive strength. Unexpected changes in mechanical specific energy may indicate changes in the rock properties or drilling instabilities or both of them. In an ideal process, there is a relationship between input energy and an accurate compressive strength of a formation. However, this one by one relationship to compare with uniaxial compressive strength due to the effect of hydrostatic pressure of mud column on the depth, does not remain. By optimizing of mechanical specific energy, we can reduce unappreciable non-beneficial times and also drilling costs by using drilling optimization parameters for increasing beneficial life of bit, increasing penetration rate to maximum limit( without types of bit) and obtain optimum time for changing bit(when the performance of bit is lower than optimum limit). By accurate using of mechanical specific energy within analysis of this parameter, it can be diagnosed for slowing bit speed or damaged bits, choosing efficient bit for current formation, To whom all correspondence should be sent: E-mail: [email protected] 2017 Bulgarian Academy of Sciences, Union of Chemists in Bulgaria

Welcome message from author
This document is posted to help you gain knowledge. Please leave a comment to let me know what you think about it! Share it to your friends and learn new things together.
Transcript
Bulgarian Chemical Communications, Special Issue J, (pp. 364 – 375) 2016
364
Optimization of drilling parameters by analysis of formation strength properties with
using mechanical specific energy
A. Davarpanah1, M.M. Nassabeh2
1Department of Petroleum Engineering, Science and Research Branch, Islamic Azad University, Tehran, Iran. 2Department of Petroleum Engineering, Islamic Azad University, Omidiyeh, Iran.
Received May 17, 2017, Revised September 4, 2017
By increasing the daily needs of human energy, human manipulation of natural energy sources are expanded and
encouraged the human society to developing science, knowledge and technology. Mechanical specific energy is
required energy for drilling the unit of formation volume of oil wells. This parameter can be used for functional analysis
of drilling, drilling bit optimization and investigating of instability has been made during drilling operations. This
parameter can be used for decreasing of drilling costs of oil wells by increasing drilling speed, optimized the useful life
of the drilling bit and determine the right time to replace the drilling bit, and in some cases reduced to a minimum
amount. In South Pars field in Iran many wells have been drilled, however detailed statistics processes hadn’t done for
optimizing drilling parameters and their impact on mechanical specific energy. By results of this study we can use to
analyze performance and drilling parameters such as weight on drilling bit, rotational speed, penetration rate, etc. In
most cases, mechanical specific energy at the end of each drilled wells, because of reducing movement speed has been
increased. Although by investigating middle formations in section of 12.25 inch, all existing wells on a platform in one
of the phases of Iran's South Pars field are being studied, which contains formations such as Hith, Surmeh, Neyriz,
Dashtak and Kangan.
Studies was done in two parts. In the first part, the range of optimized drilling parameters that is increasing drilling
speed and reducing the required amount of energy for drilling formation. This process by investigating mechanical
specific energy and its relationship with uniaxial compressive strength in five studied formation have been presented. In
the second part, correlations to predict the mechanical specific energy in this area by statistical methods by SPSS
software, presented and reviewed. Then, by the most appropriate relationship, the most influential drilling parameters
on mechanical specific energy have been set.
However, for drilling the next wells in this area drilling parameters with the most priority influences on mechanical
specific energy, proposed in the optimum range, will be recommended.
Keywords: mechanical specific energy, drilling bit penetration rate, compressive strength, statistical methods, oil
wells.
INTRODUCTION
Special mechanical energy, is the required amount
of energy for drilling the formation. This parameter
is a function of drilling parameters such as weight
on bit, rotational speed, torque, drilling penetration
rate in the formation and the well diameter.
Although if you used mud pumps, this parameter
depended to proportion of speed to flow rate, the
maximum rate of torque and maximum rate of
pressure difference.
Mechanical specific energy for both relational
concept and correlational was introduced in 1964
by Tail. Since this parameter used in the diagnosis
of instability during drilling operations was
valuable. Drilling engineers are always by applying
different weights on bit, speed of rotation and mud
flow rate within the range of normal operation.
They try to minimize the amount of mechanical
specific energy and maximize the penetration rate
of bit on the formation. Drilling engineers always
try to approach mechanical specific energy within
current formation compressive strength.
Unexpected changes in mechanical specific energy
may indicate changes in the rock properties or
drilling instabilities or both of them. In an ideal
process, there is a relationship between input
energy and an accurate compressive strength of a
formation. However, this one by one relationship to
compare with uniaxial compressive strength due to
the effect of hydrostatic pressure of mud column on
the depth, does not remain.
By optimizing of mechanical specific energy,
we can reduce unappreciable non-beneficial times
and also drilling costs by using drilling
optimization parameters for increasing beneficial
life of bit, increasing penetration rate to maximum
limit( without types of bit) and obtain optimum
time for changing bit(when the performance of bit
is lower than optimum limit).
By accurate using of mechanical specific energy
within analysis of this parameter, it can be
diagnosed for slowing bit speed or damaged bits,
choosing efficient bit for current formation, To whom all correspondence should be sent:
E-mail: [email protected]
2017 Bulgarian Academy of Sciences, Union of Chemists in Bulgaria

A. Davarpanah&M.M. Nassabeh: Optimization of drilling parameters by analysis of formation strength properties…
365
efficient rotation per minute and inhabitation of
poor mud circulation.
In Iran, despite drilling many wells in South
Pars field, statistical research to optimize
independent drilling parameters such as weight on
bit, bit rotational speed, drilling speed and also its
impact on each of the relevant parameters
(mechanical specific energy) has not been done.
Also due to high costs of hiring drilling rigs and
limit use of some tools such as bit and borehole
assembly that we have in Iran, this research is done
for optimizing drilling parameters due to formation
strength parameters by using mechanical specific
energy.by investigating mechanical specific energy
and its relationship with uniaxial compressive
strength with increasing drilling speed, lengthen
beneficial life of bit and borehole assembly, we can
optimize costs that it is the main concern of
petroleum companies.
WORKING PROCEDURE
The principal of this research can be divided
into two parts.
In the first part, the data are collected in the
study area. Then which points that have higher
drilling speed and also have lower mechanical
specific energy and the ratio of mechanical specific
energy to uniaxial compressive strength, in each
well and formation to formation are separately
recognized. Drilling parameters are collected at
these point and with summarizing all of these data
in all wells, for formations such as Hith, Surmeh,
Neyriz, Dashtak and Kangan, range of optimum
drilling parameters and so the amount of increasing
penetration rate and decreasing mechanical specific
energy will be determined.
In the second part, firstly descriptive statistics,
including the number of samples, the highest and
lowest dispersion and its causes will examine.
Then, in inferential statistics, there are some
correlations for estimating mechanical specific
energy by SPSS software in the studied area and
their accuracy are investigated and optimum linear
and non-linear correlation are determined. Then
with the most appropriate correlation the most
influential independent parameters on mechanical
specific energy will be obtained.
A total of first and second stages, for appropriate
optimization of mechanical specific energy during
drilling, efficient drilling parameters on mechanical
specific energy(obtained in the second stage),in the
optimal range, increasing drilling speed and reduce
mechanical specific energy, for drilling other wells
in this area (South Pars field in Iran) is
recommended. More detailed statistical and
inferential methods are further summarized.
CASE STUDY
1. Data collection
To collect and summarize all information related
to wells 1 to 10, in Table 1-1 range of each
independent parameters such as weight on bit ,
pressure difference, rotation per minute and flow
rate, dependent drilling parameters, including
penetration rate mechanical specific energy for
section with 12.25 inch diameter that Total
investigated wells are examined for each formation.
In studied area range of independent drilling
parameters including the rotational velocity in the
range of 0 to 120 (RPM), weight on bit from 0 to
223 (kIbs), mud flow rate from 200 to 9000 (psi),
the pressure difference of 10 to 1270 (psi) and of
torque from 0 to 29 (kFT-Ib) is. This has led to a
range of dependent drilling parameters include
penetration rate of between 0.96 to 107.69 (ft / hr)
and particularly mechanical specific energy
between the 0 to 34292.5 (MPa).
2- Identify the optimum points in each of the
formations
In the following tables, the areas with the
highest drilling velocity, the lowest mechanical
specific energy and the ratio of the lowest amount
of mechanical specific energy to uniaxial
compressive strength are the optimum points.by
determining these points independent drilling
parameters appropriate with those data that
prepared these optimum points. This information is
then presented in Tables 1-1 to 1-5.

A.Davarpanah, M.M. Nassabeh: Optimization of drilling parameters by analysis of formation strength properties …
366
Table 1-1: Optimization of drilling in the formation Hith
For
mati
on
we
ll
Original
Points From To
Dril
led ROP
rp
m
m
in
W
O
B
m
a
x
W
O
B
Flo
w ∆P
m
in
T
Q
m
ax
T
Q
MES MES/U
CS
Hith
1
MSE(min)
1853.
2
1882.
1 28.9
12.84
44 40
1
5
2
0 843
34
0
1
0 13 69.551 0.46
rop(max) 1930 1939 9 18 70
2
0
2
2 845
29
0 8 14
70.859
5 0.469
MSE/UCS(
min)
1853.
2
1882.
1 28.9
12.84
44 40
1
5
2
0 843
34
0
1
0 13 69.551 0.46
4
MSE(min) 1840 1854 14.4 13.7 40
1
5
2
2 855
18
0 9 14 37.867 0.25
rop(max) 1911 1939 28.3 24.8
12
0
1
9
2
4 855
30
0 5 13 81.858 0.542
MSE/UCS(
min) 1840
1854.
4 14.4
13.71
43 40
1
5
2
2 855
18
0 9 14 37.867 0.25
5
MSE(min) 1980 1986 6
3.529
41 90
1
2
1
5 795
28
0 0 0
0.0001
2
6.62E+
07
rop(max) 2020
2030.
9 10.9
16.02
94 90
1
3
1
6 795
31
0
1
3 17
191.98
1 1.271
MSE/UCS(
min) 1980 1986 6
3.529
41 90
1
2
1
5 795
28
0 0 0
0.0001
2
6.62E+
07
6
MSE(min) 1877 1892 15
18.98
73 40
1
8
2
4 900
30
0 7 11
33.080
2 0.219
rop(max) 1877 1892 15
18.98
73 40
1
8
2
4 900
30
0 7 11
33.080
2 0.219
MSE/UCS(
min) 1877 1892 15
18.98
73 40
1
8
2
4 900
30
0 7 11
33.080
2 0.219
7
MSE(min) 1908 1911 3
9.090
91 30 3
1
2 820
12
0
1
0 15
40.598
5 0.268
rop(max)
1990.
5 2019 28.5
21.11
11
10
0
1
8
2
0 800
24
0
1
0 18
130.53
7 0.864
MSE/UCS(
min) 1908 1911 3
9.090
91 30 3
1
2 820
12
0
1
0 15
40.598
5 0.268
9
MSE(min)
1766.
5
1767.
5 1 10 90 4
2
5 822
11
0 6 11
86.828
5 0.575
rop(max) 1835 1845 10
19.23
08
10
5
1
9
2
1 835
25
0 5 13 126.76 0.839
MSE/UCS(
min)
1766.
5
1767.
5 1 10 90 4
2
5 822
11
0 6 11
86.828
5 0.575
10
MSE(min) 1752 1772 20
41.66
67 50
1
5
1
8 797
22
0
1
0 12
25.802
7 0.17
rop(max) 1752 1772 20
41.66
67 50
1
5
1
8 797
22
0
1
0 12
25.802
7 0.17
MSE/UCS(
min) 1752 1772 20
41.66
67 50
1
5
1
8 797
22
0
1
0 12
25.802
7 0.17
12
MSE(min) 1795
1809.
8 14.8
13.21
43 60
1
5
2
0 800
30
0 8 15 112.6 0.745
rop(max) 1868 1895 27
26.73
27
11
0
2
3
2
5 910
31
0
1
0 15
114.61
3 0.759
MSE/UCS(
min) 1795
1809.
8 14.8
13.21
43 60
1
5
2
0 800
30
0 8 15 112.6 0.745
14 MSE(min)
1781.
4 1799 17.6
9.166
67 70
1
8
2
4 900
20
5 8 13
166.91
2 1.105
rop(max)
1838.
5 1867 28.5
11.53
85
10
0
1
8
2
5 900
24
0 8 17
290.01
3 1.92

A. Davarpanah&M.M. Nassabeh: Optimization of drilling parameters by analysis of formation strength properties…
367
MSE/UCS(
min)
1781.
4 1799 17.6
9.166
67 70
1
8
2
4 900
20
5 8 13
166.91
2 1.105
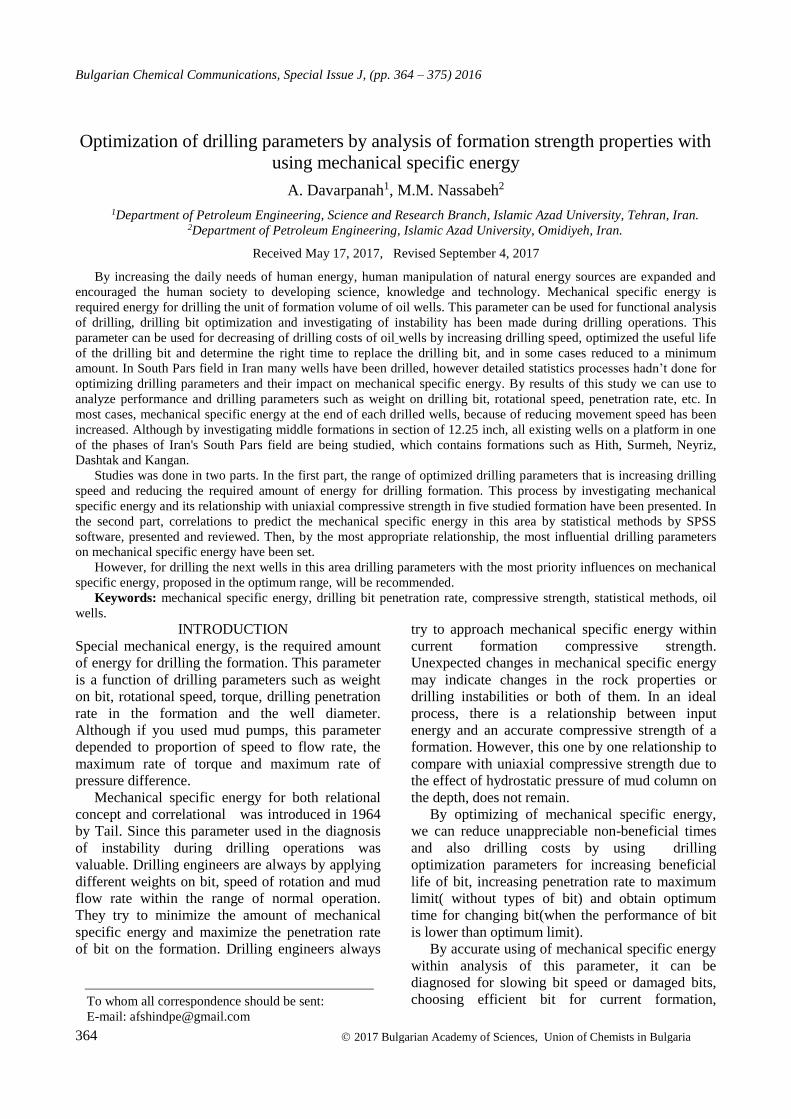
Table 1-2: Optimization of drilling in the formation Surmeh
Fo
rm
ati
on
we
ll
Original
Points
Fro
m To
Dril
led ROP rpm
m
in
W
O
B
m
a
x
W
O
B
Flo
w ∆P
m
in
T
Q
m
ax
T
Q
MES MES/U
CS
Su
rm
eh
1
MSE(min) 2566 2567 1 5.26 0
3
0
3
5 875 90 0 0 0.00028
2.82E-
06
rop(max) 2069
2081.
4
12.
4 56.3636 115
1
8
2
4 875 440 7 13 51.2784
0.33959
2
MSE/UCS(
min) 2566 2567 1 5.26 0
3
0
3
5 875 90 0 0 0.00028
2.82E-
06
4
MSE(min) 2397 2411 14 7.25389 0 1
1
0 800 100 0 0
4.67E-
05 5.1E-06
rop(max)
2194
.5 2207
12.
5 69.4444 120
2
0
2
5 900 300 7 17 45.2235 0.32
MSE/UCS(
min)
2163
8
2174.
6 6.6 5.40698 0 5 8 900 180 0 0
5.52E-
05 5.1E-06
5
MSE(min) 2300 2304 4 9.09091 0 3 5 840 50 0 0
3.40E-
05
3.06E-
07
rop(max) 2590 2600 10 43.4783 120 6
1
5 843 350 15 25 118.843 1.7
MSE/UCS(
min) 2094
2099.
5 5.5 5.28846 0 4 5 795 50 0 0
3.82E-
05
3.06E-
07
6
MSE(min) 1908 1914 6 5.40541
1
0
2
0 900 140 0 0 0.00013
6.62E-
07
rop(max) 2092 2092 12 70.5882 100
2
0
2
8 900 180 8 14 42.0923 0.298
MSE/UCS(
min) 1908 1914 6 5.40541
1
0
2
0 900 140 0 0 0.00013
6.62E-
07
7
MSE(min) 2981
2992.
5
11.
5 7.41936
1
0
2
0 850 160 0 0 0.00013
1.02E-
05
rop(max) 3005 3008 3 50 120
1
0
1
2 850 270 11 22 114.001 1.163
MSE/UCS(
min) 2822
2825.
6 3.6 3.39623 0 5
2
5 800 150 0 0 0.00013
1.02E-
05
9
MSE(min)
2162
.5 2165
2.5
5 3.89438 0 2 5 833 70 5 13
2.97E-
05
2.11E-
07
rop(max) 2469 2475 6 35.2941 105 1
1
0 900 280 6 13 66.6123 0.662
MSE/UCS(
min)
2162
.5 2165
2.5
5 3.89438 0 2 5 833 70 5 13 3E-05
2.11E-
07
10
MSE(min) 2326
2330.
4 4.4 3.89381 0 1 5 800 40 0 0
2.55E-
05
3.06E-
07
rop(max)
2204
.8
2233.
5
28.
7 37.2727 70
1
0
2
0 800 220 10 17 45.7477 0.56
MSE/UCS(
min)
1954
.5
1969.
3
14.
8 5.32374 0 0 5 800 100 0 0 2.6E-05
1.99E-
07
11
MSE(min)
2618
.3 2621 2.7 10.3846 5
1
0 950 100 14 22
6.37E-
05
5.56E-
07
rop(max) 3050
3050.
8 0.8 40
8
0
8
0 898 70 0 0 0.00068
6.93E-
05
MSE/UCS(
min)
3050
.8 2621
-
430 10.3846 5
1
0 950 100 14 22 6.4E-05
5.56E-
07
12 MSE(min)
1981 2000.
1
14.
8 39.7917 110
1
9
2
3 905 350 11 17 97.3658 0.644
A.Davarpanah, M.M. Nassabeh: Optimization of drilling parameters by analysis of formation strength properties …
368
rop(max)
2009
.6
2038.
5 27 46.6129 110
2
0
2
5 905 445 10 18 105.678 0.699
MSE/UCS(
min) 1981
2000.
1
14.
8 39.7917 110
1
9
2
3 905 350 11 17 97.3658 0.644
14
MSE(min) 1979 1982
17.
6 42.8571 105
1
0
1
8 850 200 5 16 64.3015 0.425
rop(max)
2066
.5 2073
28.
5 43.3333 105
1
2
2
0 850 375 6 19 145.324 1.03
MSE/UCS(
min) 1979 1982
17.
6 42.8571 105
1
0
1
8 850 200 7 16 64.3015 0.425
Table 1-3: Optimization of drilling in the formation Neyriz
For
mat
ion
w
e
ll
Original
Points From To
Dril
led ROP rpm
m
in
W
O
B
m
a
x
W
O
B
Flo
w ∆P
m
in
T
Q
m
ax
T
Q
MES MES/UC
S
NE
YR
IZ
1
MSE(min
) 2990
2998.
7 8.7
28.064
5 120 7 9 845 160 8 18 55.09 5.60E-01
rop(max)
2998.
7 3004 5.3
31.174
7 120 4 6 845 330 8 16
196.98
97 0.927
MSE/UC
S(min) 2990
2998.
7 8.7
28.064
5 120 7 9 845 160 8 18 55.09 0.56
4
MSE(min
) 2927
2955.
5 28.5 22.8 120 8
2
1 850 260 8 18
2.19E+
02 2.356
rop(max) 2927
2955.
5 28.5 22.8 120 8
2
1 850 260 8 18
2.19E+
02 2.356
MSE/UC
S(min) 2927
2955.
5 28.5 22.8 120 8
2
1 850 260 8 18
2.19E+
02 2.356
5
MSE(min
)
3289.
8
3295.
3 5.8 14.5 120 8
1
1 922 130 15 22
1.53E+
02
1.56E+0
0
rop(max)
3295.
3
3306.
5 11.2
15.555
6 120 6
1
0 922 200 17 22 231.89 2.366
MSE/UC
S(min)
3289.
8
3295.
3 5.8 14.5 120 8
1
1 922 130 15 22
1.53E+
02
1.56E+0
0
6
MSE(min
)
2789.
8 2818 28.2
17.735
9 120
1
5
1
8 900 325 8 19
96.713
03
4.58E+0
0
rop(max)
2789.
8 2818 28.2
17.735
9 120
1
5
1
8 900 325 8 19
96.713
03 4.577
MSE/UC
S(min)
2789.
8 2818 28.2
17.735
9 120
1
5
1
8 900 325 8 19
96.713
03 4.577
7
MSE(min
)
3033.
6
3061.
3 27.7
15.054
4 120
1
5
2
5 750 300 10 21
395.20
3 2.224
rop(max)
3033.
6
3061.
3 27.7
15.054
4 120
1
5
2
5 750 300 10 21
395.20
3 2.224
MSE/UC
S(min)
3033.
6
3061.
3 27.7
15.054
4 120
1
5
2
5 750 300 10 21
395.20
3 2.224
9
MSE(min
) 2773 2788 15 20.548 120
1
0
2
0 895 350 6 13
1.77E+
02
1.63E+0
0
rop(max) 2773 2788 15 20.548 120
1
0
2
0 895 350 6 13
177.46
22 1.625
MSE/UC
S(min) 2773 2788 15 20.548 120
1
0
2
0 895 350 6 13
177.46
22 1.625
1
0
MSE(min
)
2689.
9
2718.
7 28.8
28.235
3 60 9
2
2 800 330 5 17
6.33E+
01 9.35E-01
rop(max)
2689.
9
2718.
7 28.8
28.235
3 60 9
2
2 800 330 5 17
63.266
08 0.935
MSE/UC
S(min)
2689.
9
2718.
7 28.8
28.235
3 60 9
2
2 800 330 5 17
63.266
08 9.35E-01
A. Davarpanah&M.M. Nassabeh: Optimization of drilling parameters by analysis of formation strength properties…
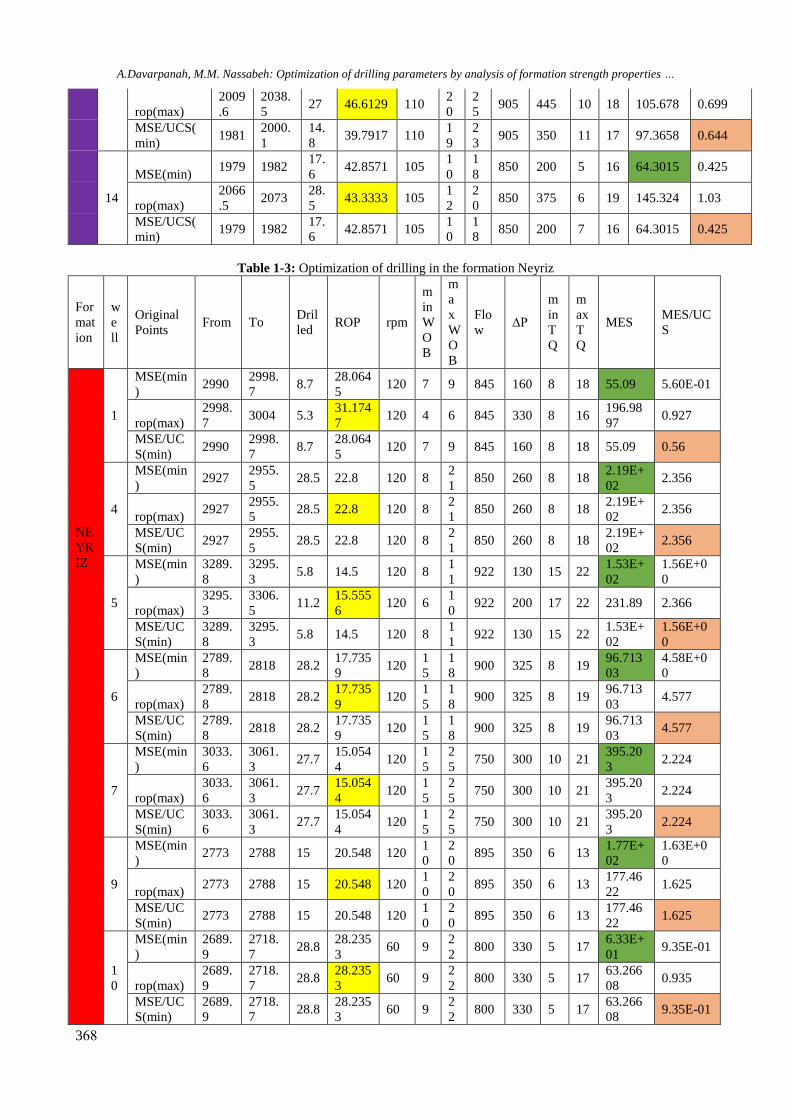
369
1
1
MSE(min
)
3430.
4 3459 28.6
16.725
2 100 5
1
0 950 160 14 26
3.82E+
02
2.66E+0
0
rop(max)
3430.
4 3459 28.6
16.725
2 100 5
1
0 950 160 14 26
382.49
8 2.657
MSE/UC
S(min)
3430.
4 3459 28.6
16.725
2 100 5
1
0 950 160 14 26
382.49
8 2.657
1
2
MSE(min
)
3072.
7 3101 28.3
13.412
3 120
1
5
2
3 905 220 10 20
429.27
71 2.536
rop(max)
3072.
7 3101 28.3
13.412
3 120
1
5
2
3 905 220 10 20
429.77
71 2.536
MSE/UC
S(min)
3072.
7 3101 28.3
13.412
3 120
1
5
2
3 905 220 10 20
429.27
71 2.536
1
4
MSE(min
)
2785.
3 2814 28.7
18.993
4 120
1
0
1
5 880 170 9 16
143.14
83 1.409
rop(max)
2785.
3 2814 28.7
18.993
4 120
1
0
1
5 880 170 9 16
143.14
83 1.409
MSE/UC
S(min)
2785.
3 2814 28.7
18.993
4 120
1
0
1
5 880 170 9 16
143.14
83 1.409
Table 1-4: Optimization of drilling in the formation Dashtak
For
mat
ion
w
e
ll
Original
Points From To
Drill
ed ROP
rp
m
m
in
W
O
B
m
ax
W
O
B
Flow ∆P
mi
n
T
Q
ma
x
TQ
MES MES/UC
S
Das
hta
k
1
MSE(min)
3314
.5
3315
.5 1
3.448
28
11
5 20 30 857 10 11 13 10.91976 7.50E-01
rop(max) 3004
3007
.9 3.9
27.85
71
12
0 1 2 845
26
0 8 16
45.1.339
6 0.818
MSE/UCS(
min)
3314
.5
3315
.5 1
3.448
28
11
5 20 30 857 10 11 13 10.91976 0.75
4
MSE(min) 2997
3003
.7 6.7
3.526
32 0 10 22 850
16
0 0 0 1.36E-04 1.02E-06
rop(max) 2958 2960 2 25
12
0 10 18 850
15
0 8 18
1.03E+0
2 1.0911
MSE/UCS(
min) 2997
3003
.7 6.7
3.526
32 0 10 22 850
16
0 0 0 1.36E-04 1.02E-06
5
MSE(min)
3323
.4 3334 10.6
14.32
43
12
0 10 15 922
18
0 15 24
2.67E+0
2 1.77E+00
rop(max)
3493
.4 3514 20.2
19.23
81
12
0 20 25 920
24
0 21 24 259.6177 1.643
MSE/UCS(
min) 3514
3522
.1 8.1
16.53
06
12
0 18 23 920
19
5 20 24
2.40E+0
2 1.52E+00
6
MSE(min) 2826 2827 1
6.666
67
10
0 2 6 900 60 9 12 94.46068 7.37E-01
rop(max) 2827 2830 3
13.63
64
10
0 9 12 900
24
0 9 26 307.8718 2.405
MSE/UCS(
min) 2826 2827 1
6.666
67
10
0 2 6 900 60 9 12 94.46068 0.737
7
MSE(min) 3443 3444 1
8.333
33 80 5 8 620 85 13 19 160.62 1.46
rop(max) 3374 3388 14
21.21
21
12
0 10 15 800
34
0 12 26 2982.986 2.838
MSE/UCS(
min) 3443 3444 1
8.333
33 80 5 8 620 85 13 19 160.62 1.46
9 MSE(min)
3164 3165 1 12.5 80 15 20 835 24
0 6 12
1.34E+0
2 1.41E+00
rop(max) 2801
2807
.5 6.5
17.56
76
10
5 14 16 900
37
0 7 11 163.24 1.275

A.Davarpanah, M.M. Nassabeh: Optimization of drilling parameters by analysis of formation strength properties …
370
MSE/UCS(
min) 2994 2995 1
3.703
7 80 1 5 800
10
0 7 14 137.397 0.869
1
0
MSE(min) 2747
2775
.7 28.7
19.79
31 60 18 22 800
32
0 7 12
7.86E+0
1 6.14E-01
rop(max)
2718
.7 2747 28.3
21.43
94 60 15 22 800
32
0 8 16 91.66605 0.935
MSE/UCS(
min) 2747
2775
.7 28.7
19.79
31 60 18 22 800
32
0 7 12 78.60491 6.14E-01
1
1
MSE(min)
3587
.5
3587
.7 0.2
6.666
67 10 1 1 200 10 20 20
3.20E+0
0 2.40E-02
rop(max) 3459
3482
.4 23.4
15.19
48
10
0 10 25 950
22
2 14 26 311.5558 4.058
MSE/UCS(
min)
3587
.9
3587
.7 0.2
6.666
67 10 1 1 200 10 20 20 3.198676 0.024
1
2
MSE(min) 3427
3427
.5 0.5
3.571
43 50 10 10 905 30 17 17 83.04912 0.525
rop(max)
3441
.1
3469
.5 28.4
16.79
29
10
0 20 25 905
26
0 17 20 333.1624 2.289
MSE/UCS(
min) 3427
3427
.5 0.5
3.571
43 50 10 10 905 30 17 17 83.04912 0.525
1
4
MSE(min) 3199 3213 14
107.6
92
10
0 20 25 880
15
0 10 15 23.20481 0.174
rop(max) 3199 3213 14
107.6
92
10
0 20 25 880
15
0 10 15 23.20481 0.174
MSE/UCS(
min) 3199 3213 14
107.6
92
10
0 20 25 880
15
0 10 15 23.20481 0.174

A. Davarpanah&M.M. Nassabeh: Optimization of drilling parameters by analysis of formation strength properties…
371
Ta
ble
1-5
: O
pti
miz
ati
on o
f d
rill
ing i
n t
he
form
atio
n K
angan
Fo
r
mat
i
on
wel
l O
rigin
al
Po
ints
F
rom
T
o
Dri
l
led
R
OP
rp
m
m in
W O B
m a x
W O B
Flo
w
∆P
mi
n
T Q
m ax
T Q
ME
S
ME
S/U
CS
Kan
gan
1
MS
E
(min
) 3
75
0
37
58
8
10
.389
6
11
5
2 5
2 8
84
6
29
0
13
15
42
9.0
90
7
3.9
0E
+0
0
Ro
p
(max
) 3
75
8
37
66
8
10
.810
8
11
5
2 5
2 8
84
6
33
5
13
15
47
6.3
61
7
2.9
77
MS
E/U
CS
(min
)
37
66
37
68
2
10
10
5
2 5
2 8
84
6
19
0
13
15
47
0.2
04
3
2.9
38
5
MS
E
(min
)
41
21
.
6
41
27
5.4
5
1
20
1 8
2 1
80
0
15
0
20
25
1.4
4E
+0
3
9.0
0E
+0
0
Ro
p
(max
)
41
21
.
6
41
27
5.4
5
1
20
1 8
2 1
80
0
15
0
20
25
14
39
.4
8.9
96
MS
E/U
CS
(min
)
41
21
.
6
41
27
5.4
5
1
20
1 8
2 1
80
0
15
0
20
25
14
39
.4
9.0
0E
+0
0
6
MS
E
(min
) 3
44
1
34
42
1
1.9
607
8
11
0
3 0
3 3
90
0
80
9
11
71
7.7
81
2
6.5
3E
+0
0
Ro
p
(max
) 3
46
0
34
62
.5
2.5
2
.23
21
4
11
0
3 0
3 3
90
0
12
0
9
14
16
73
.30
7
10
.458
MS
E/U
CS
(min
)
34
41
34
42
1
1.9
607
8
11
0
3 0
3 3
90
0
80
9
11
71
7.7
81
2
6.5
25
11
MS
E
(min
)
42
53
.
8
42
61
7.2
2
.75
86
2
11
0
2 0
3 0
85
0
11
0
25
29
2.5
3E
+0
3
2.3
0E
+0
1
Ro
p
(max
)
42
53
.
8
42
61
7.2
2
.75
86
2
11
0
2 0
3 0
85
0
11
0
25
29
25
25
.42
8
22
.958
MS
E/U
CS
(min
)
42
53
.
8
42
61
7.2
2
.75
86
2
11
0
2 0
3 0
85
0
11
0
25
29
25
25
.42
8
22
.958
14
MS
E
(min
) 3
52
6
35
50
24
6.4
1
20
2 4
2 8
87
5
16
0
11
16
80
9.6
62
9
7.3
6
Ro
p
(max
) 3
52
6
35
50
24
6.4
1
20
2 4
2 8
87
5
16
0
11
16
80
9.6
62
9
7.3
6
MS
E/U
CS
(min
)
35
26
35
50
24
6.4
1
20
2 4
2 8
87
5
16
0
11
16
80
9.6
62
9
7.3
6

A.Davarpanah, M.M. Nassabeh: Optimization of drilling parameters by analysis of formation strength properties …
372
Table 1-6: optimum range of independent drilling parameters in total investigated wells
Formati
on
N(RPM) WOB(kIbs) Flow(gal/min) ∆P(psi) TQ(KFT-Ib)
mi
n
ma
x
Averag
e
(Aroun
d)
mi
n
ma
x
Averag
e
(Aroun
d)
mi
n
ma
x
Averag
e
(Aroun
d)
mi
n
ma
x
Averag
e
(Aroun
d)
mi
n
ma
x
Averag
e
(Aroun
d)
Hith 30 12
0 66.85 3 25 17.55
79
5
91
0 840.77
11
0
34
0 243.33 0 18 10.22
Surmeh 0 12
0 77.5 0 80 35.75
79
5
95
0 864.4 40
44
5 195.33 0 25 7.43
Neyriz 60 12
0 111 4 25 33.65
75
0
95
0 869.7
13
0
35
0 248.5 5 26 14.15
Dashtak 0 12
0 81.5 1 30 33.63
20
0
95
0 808.36 10
37
0 163.9 0 26 13.61
Kangan 10
5
12
0 114.33 18 33 25.7
80
0
90
0 854.2 80
33
5 157 9 29 17.5
Table 1-7: optimum range of dependent drilling parameters in total investigated wells
Formatio
n
ROP(ft/hr) MSE(Mpa) MSE/UCS
min max
Average
(Around
)
min max Average
(Around) min max
Average
(Around)
Hith 3.53 41.66 17.13 0.00075842
3
1999.54
9 578.7459
4.57E-
06
13.2379
3 3.73695845
Surmeh 3.4 70.59 25.16 1.75E-04 1001.94
6 243.1781
1.37E-
06
11.7210
9 2.11669048
Neyriz 13.4
1 31.14 19.745
379.832178
6
2959.71
2 1508.78
3.86106
4 31.5573 14.3410951
Dashtak 3.44 107.6
9 21.73
0.00093079
2
2297.07
1 816.0635
7.03E-
06
27.9789
3 7.27396893
Kangan 1.96 10.81 5.32 2598.47140
1
17412.1
6 8645.06 20.2568
158.289
8 69.4991534
STATISTICAL METHOD
1.Descriptive statistics
In this research to determine display
characteristics of descriptive properties, a
collection set data, the range of changes,
minimum and maximum average, offset scale and
gear ratio of changes are provided in the Table 1-8
that the purpose of this investigate to affect any of
the existing parameters on mechanical specific
energy. That’s why parameters (TQ, P, Q,
WOB, N, ROP and drilled) become independent
variables. Changes in these parameters will
change in the MSE as a dependent parameter.
Table 1-8: Descriptive characteristics of data collection that are used
Parameter Unit Range of
changes
Minim
um
Maximu
m average Offset scale
Ratio of
changes
riDlled m 29.6 0 29.6 10.36 9.033 0.872
ROP ft/hr 38.49 1.3 39.79 11.75 8.31 0.707
N RPM 110 20 130 103.89 19.938 0.192
WOB Klbs 32.5 1 33.5 18.96 7.381 0.389
Q GPM 300 650 950 866.75 49.171 0.057
ΔP psi 510 10 520 225.49 81.034 0.359
TQ Kft.lbs 20 7 27 15.04 4.694 0.312
MSE ksi 3366.97 19.62 3386.59 494.53 468.977 0.948
A. Davarpanah&M.M. Nassabeh: Optimization of drilling parameters by analysis of formation strength properties…
373
The number of collection samples are 1485 that
show the importance of derived correlations from
the investigated formations in different wells. The
range of changes and the offset scale, is important
indicators for measuring volume dispersion amount
one variable a. Average is the most important and
easiest central index data. Using the average it can
be compared many number of variables together.
Gear ratio of the changes obtained from divided
offset scale of one variable on average, relative
index for comparing different variables, whatever
the gear ratio of the changes to be more, variable
distribution will be more.
Mechanical Specific energy has the biggest
range of changes, the offset scale and gear ratio of
changes. High dispersion of this variable, due to the
different resistor properties in different lithology.
After mechanical specific energy, pressure
difference has the highest scope of the changes and
the offset scale, low pressure difference relevant to
low special weight and high pressure difference
represents high special weight of cuttings in that
part. The least range of changes and the offset scale
related to the torque and the lowest gear ratio of
changes related to the mud flow rate that is revealed
parameters were close and less distribution.
The histogram is a method to display the
distribution of data in different quantity categories.
The range of parameters related to this region in
addition to the table descriptive characteristics
specified in Fig1-1. Proposal relations related to
this ranges and if we use this equations for outside
parameters of the range it needs more careful
nesses and more caution.
2, Inferential statistics
As we know, this statistical method can refer to
regression method. In the inferential statistics,
linear correlations and non-linear correlations are
evaluated.
3. Wrap up
in this case firstly descriptive statistics that
includes number of samples, the most and the least
dispersion and their reasons are review. For the
studied area, investigated descriptive characteristics
shows the range of the changes, the offset scale and
high gear ranges of mechanical specific energy,
pressure differences and true vertical depth that
shows more dispersion on this variables. Low
amount of these parameters such as torque,
rotational speed and mud flow rate, revealed low
dispersion for this parameters.
Then, in inferential statistics there were
correlations to predict mechanical specific energy
in the studied area by using statistical methods with
SPSS software was presented. The most appropriate
Linear and non-linear correlations were
investigated.by investigating suggested correlations
in the studied field and compare their accuracy , the
following results were obtained:
-In the proposed linear equations, linear correlation
without intercept, with number of test 383/946 ,
correlation coefficients 0/904 and coefficients of
determination 0/818 , is superior and more reliable
than linear correlation with intercept , the statistic
test 344/567 , correlation coefficients 0/788 and
coefficient of determination is 0/62.
In comparison of non-linear correlation,
proposed non-linear correlation with a coefficient
of determination 0/775, the two proposed non-
linear correlations to state that we didn’t use the
mud pump in the well coefficient of determination
were 0/819 and 0/813. When we use the mud pump
in the well coefficient of determination were 0/837
and 0/832 that compared to other non-linear
correlations were higher. This represents a further
connection between the parameters and higher
accuracy, especially in mechanical specific energy
correlation with other independent drilling
parameters into two correlations.
RESULTS AND DISCUSSION
1. To use the results of this study, it should be
considered that the range of parameters provided, in
addition to the descriptive specification table, in
normal curve and drilling histogram parameters are
specified. As well as from a variety of statistical
methods, SPSS software was used in this research.
Several proposed correlations for mechanical
specific energy was done by this software.

Bulgarian Chemical Communications, Special Issue J, (pp. 364 – 375) 2016
374
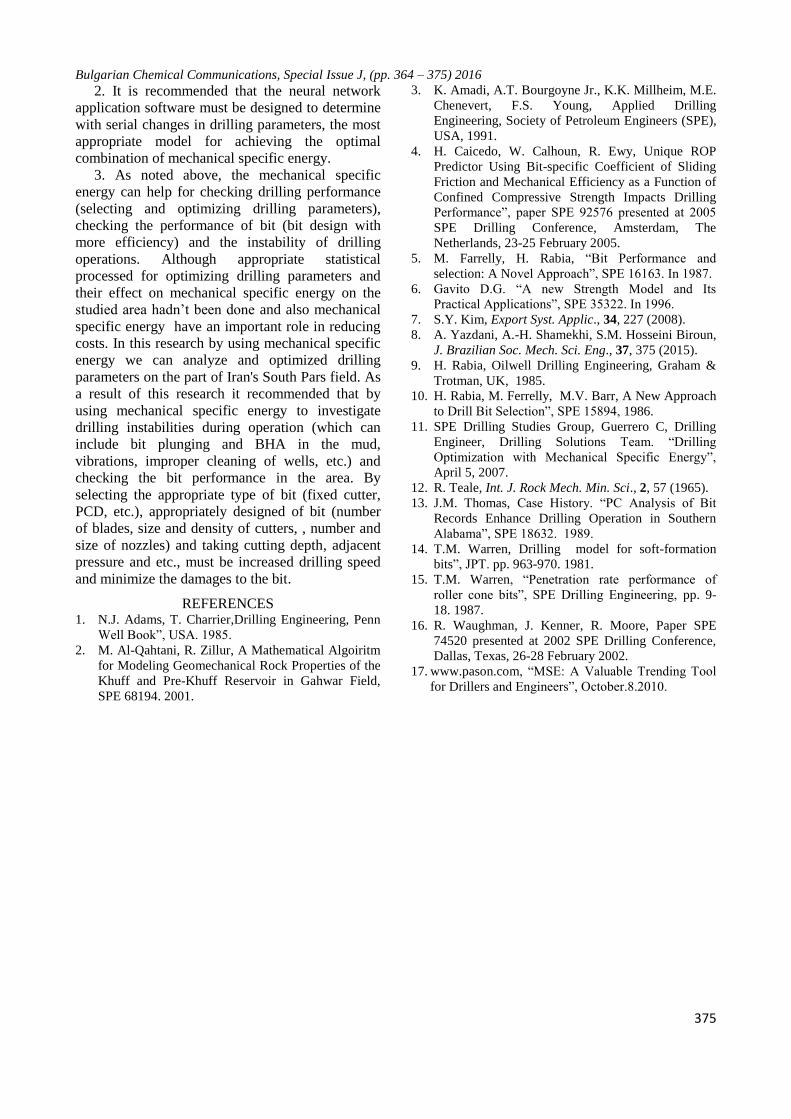
Fig 1-1: Normal curve and histogram of drilling parameters. a)Drilled; b) ROP.c) N, d) WOB, e) Q f) ,
g) TQ , h) MSE
Bulgarian Chemical Communications, Special Issue J, (pp. 364 – 375) 2016
375
2. It is recommended that the neural network
application software must be designed to determine
with serial changes in drilling parameters, the most
appropriate model for achieving the optimal
combination of mechanical specific energy.
3. As noted above, the mechanical specific
energy can help for checking drilling performance
(selecting and optimizing drilling parameters),
checking the performance of bit (bit design with
more efficiency) and the instability of drilling
operations. Although appropriate statistical
processed for optimizing drilling parameters and
their effect on mechanical specific energy on the
studied area hadn’t been done and also mechanical
specific energy have an important role in reducing
costs. In this research by using mechanical specific
energy we can analyze and optimized drilling
parameters on the part of Iran's South Pars field. As
a result of this research it recommended that by
using mechanical specific energy to investigate
drilling instabilities during operation (which can
include bit plunging and BHA in the mud,
vibrations, improper cleaning of wells, etc.) and
checking the bit performance in the area. By
selecting the appropriate type of bit (fixed cutter,
PCD, etc.), appropriately designed of bit (number
of blades, size and density of cutters, , number and
size of nozzles) and taking cutting depth, adjacent
pressure and etc., must be increased drilling speed
and minimize the damages to the bit.
REFERENCES 1. N.J. Adams, T. Charrier,Drilling Engineering, Penn
Well Book”, USA. 1985.
2. M. Al-Qahtani, R. Zillur, A Mathematical Algoiritm
for Modeling Geomechanical Rock Properties of the
Khuff and Pre-Khuff Reservoir in Gahwar Field,
SPE 68194. 2001.
3. K. Amadi, A.T. Bourgoyne Jr., K.K. Millheim, M.E.
Chenevert, F.S. Young, Applied Drilling
Engineering, Society of Petroleum Engineers (SPE),
USA, 1991.
4. H. Caicedo, W. Calhoun, R. Ewy, Unique ROP
Predictor Using Bit-specific Coefficient of Sliding
Friction and Mechanical Efficiency as a Function of
Confined Compressive Strength Impacts Drilling
Performance”, paper SPE 92576 presented at 2005
SPE Drilling Conference, Amsterdam, The
Netherlands, 23-25 February 2005.
5. M. Farrelly, H. Rabia, “Bit Performance and
selection: A Novel Approach”, SPE 16163. In 1987.
6. Gavito D.G. “A new Strength Model and Its
Practical Applications”, SPE 35322. In 1996.
7. S.Y. Kim, Export Syst. Applic., 34, 227 (2008).
8. A. Yazdani, A.-H. Shamekhi, S.M. Hosseini Biroun,
J. Brazilian Soc. Mech. Sci. Eng., 37, 375 (2015).
9. H. Rabia, Oilwell Drilling Engineering, Graham &
Trotman, UK, 1985.
10. H. Rabia, M. Ferrelly, M.V. Barr, A New Approach
to Drill Bit Selection”, SPE 15894, 1986.
11. SPE Drilling Studies Group, Guerrero C, Drilling
Engineer, Drilling Solutions Team. “Drilling
Optimization with Mechanical Specific Energy”,
April 5, 2007.
12. R. Teale, Int. J. Rock Mech. Min. Sci., 2, 57 (1965).
13. J.M. Thomas, Case History. “PC Analysis of Bit
Records Enhance Drilling Operation in Southern
Alabama”, SPE 18632. 1989.
14. T.M. Warren, Drilling model for soft-formation
bits”, JPT. pp. 963-970. 1981.
15. T.M. Warren, “Penetration rate performance of
roller cone bits”, SPE Drilling Engineering, pp. 9-
18. 1987.
16. R. Waughman, J. Kenner, R. Moore, Paper SPE
74520 presented at 2002 SPE Drilling Conference,
Dallas, Texas, 26-28 February 2002.
17. www.pason.com, “MSE: A Valuable Trending Tool
for Drillers and Engineers”, October.8.2010.
Related Documents