Geosci. Instrum. Method. Data Syst., 1, 197–208, 2012 www.geosci-instrum-method-data-syst.net/1/197/2012/ doi:10.5194/gi-1-197-2012 © Author(s) 2012. CC Attribution 3.0 License. Geoscientific Instrumentation Methods and Data Systems Open Access Optimization of CPMG sequences to measure NMR transverse relaxation time T 2 in borehole applications M. Ronczka and M. M ¨ uller-Petke Leibniz Institute for Applied Geophysics, Hannover, Germany Correspondence to: M. Ronczka ([email protected]) Received: 3 May 2012 – Published in Geosci. Instrum. Method. Data Syst. Discuss.: 19 July 2012 Revised: 9 October 2012 – Accepted: 25 October 2012 – Published: 21 November 2012 Abstract. Nuclear Magnetic Resonance (NMR) can provide key information such as porosity and permeability for hy- drological characterization of geological material. In partic- ular the NMR transverse relaxation time T 2 is used to esti- mate permeability since it reflects a pore-size dependent re- laxation process. The measurement sequence (CPMG) usu- ally consists of several thousands of electromagnetic pulses to densely record the relaxation process and to avoid relax- ation processes that are due to diffusion. These pulses are equidistantly spaced by a time constant t E . In NMR borehole applications the use of CPMG se- quences for measuring the transverse relaxation time T 2 is limited due to requirements on energy consumption. For measuring T 2 , it is state-of-the-art to conduct at least two sequences with different echo spacings (t E ) for recording fast and slow relaxing processes that correspond to differ- ent pore-sizes. We focus on conducting only a single CPMG sequence and reducing the amount of energy while obtaining both slow and fast decaying components and minimizing the influence of relaxation due to diffusion. Therefore, we tested the usage of CPMG sequences with an increasing t E and a decreasing number of pulses. A synthetic study as well as laboratory measurements on samples of glass beads and granulate material of different grain size spectra were conducted to evaluate the effects of an increasing t E . We show that T 2 distributions are broadened if the number of pulses is decreasing and the mean grain size is increasing, which is mostly an effect of a significantly short- ened acquisition time. The shift of T 2 distributions to small decay times as a function of t E and the mean grain size dis- tribution is observed. We found that it is possible to conduct CPMG sequences with an increased t E . According to the acquisition time and increasing influence of relaxation due to diffusion, the se- quence parameters need to be chosen carefully to avoid misinterpretations. 1 Introduction The method of nuclear magnetic resonance (NMR), discov- ered in the forties of the last century (Bloch et al., 1946; Pur- cell et al., 1946), has found widespread use in scientific and daily life. It was not later than the sixties that a first bore- hole tool was developed (Brown and Gamson, 1960) to take advantages of the unique properties of NMR in geophysics. It allows a direct detection and quantification of water since the initial amplitude of an NMR signal corresponds to the amount of protons exited. Furthermore, the measured relax- ation times (longitudinal relaxation time T 1 , transverse relax- ation time T 2 ) depend on the pore geometry and can therefore be used to estimate hydraulic permeabilities (Seevers, 1966). In laboratory-NMR, artificial magnetic fields and se- quences to measure T 2 were early available. These CPMG sequences (Carr and Purcell, 1954; Meiboom and Gill, 1958) with several thousand pulses and a short equidistant pulse spacing (t E ) allow for densely recording the decaying signal, ensuring a sufficient acquisition time and minimize relax- ation processes due to diffusion. Each of these pulses causes an NMR echo to be the measured signal (Hahn, 1950). Thus, t E is referred to as the echo spacing of a CPMG sequence. In borehole-NMR, there has been significant changes in the design of borehole tools in the nineties (Miller et al., 1990) using artificial magnetic fields and measuring T 2 us- ing a CPMG. This made NMR a frequently used tool in oil and gas exploration. However, due to limitations on available Published by Copernicus Publications on behalf of the European Geosciences Union.

Welcome message from author
This document is posted to help you gain knowledge. Please leave a comment to let me know what you think about it! Share it to your friends and learn new things together.
Transcript

Geosci. Instrum. Method. Data Syst., 1, 197–208, 2012www.geosci-instrum-method-data-syst.net/1/197/2012/doi:10.5194/gi-1-197-2012© Author(s) 2012. CC Attribution 3.0 License.
RGB
Geoscientific Instrumentation Methods and Data SystemsD
iscu
ssio
ns
Geoscientific Instrumentation Methods and Data SystemsO
pen
Acce
ss
Optimization of CPMG sequences to measure NMR transverserelaxation time T2 in borehole applications
M. Ronczka and M. Muller-Petke
Leibniz Institute for Applied Geophysics, Hannover, Germany
Correspondence to:M. Ronczka ([email protected])
Received: 3 May 2012 – Published in Geosci. Instrum. Method. Data Syst. Discuss.: 19 July 2012Revised: 9 October 2012 – Accepted: 25 October 2012 – Published: 21 November 2012
Abstract. Nuclear Magnetic Resonance (NMR) can providekey information such as porosity and permeability for hy-drological characterization of geological material. In partic-ular the NMR transverse relaxation timeT2 is used to esti-mate permeability since it reflects a pore-size dependent re-laxation process. The measurement sequence (CPMG) usu-ally consists of several thousands of electromagnetic pulsesto densely record the relaxation process and to avoid relax-ation processes that are due to diffusion. These pulses areequidistantly spaced by a time constanttE.
In NMR borehole applications the use of CPMG se-quences for measuring the transverse relaxation timeT2 islimited due to requirements on energy consumption. FormeasuringT2, it is state-of-the-art to conduct at least twosequences with different echo spacings (tE) for recordingfast and slow relaxing processes that correspond to differ-ent pore-sizes. We focus on conducting only a single CPMGsequence and reducing the amount of energy while obtainingboth slow and fast decaying components and minimizing theinfluence of relaxation due to diffusion. Therefore, we testedthe usage of CPMG sequences with an increasingtE and adecreasing number of pulses.
A synthetic study as well as laboratory measurements onsamples of glass beads and granulate material of differentgrain size spectra were conducted to evaluate the effects of anincreasingtE. We show thatT2 distributions are broadened ifthe number of pulses is decreasing and the mean grain size isincreasing, which is mostly an effect of a significantly short-ened acquisition time. The shift ofT2 distributions to smalldecay times as a function oftE and the mean grain size dis-tribution is observed.
We found that it is possible to conduct CPMG sequenceswith an increasedtE. According to the acquisition time and
increasing influence of relaxation due to diffusion, the se-quence parameters need to be chosen carefully to avoidmisinterpretations.
1 Introduction
The method of nuclear magnetic resonance (NMR), discov-ered in the forties of the last century (Bloch et al., 1946; Pur-cell et al., 1946), has found widespread use in scientific anddaily life. It was not later than the sixties that a first bore-hole tool was developed (Brown and Gamson, 1960) to takeadvantages of the unique properties of NMR in geophysics.It allows a direct detection and quantification of water sincethe initial amplitude of an NMR signal corresponds to theamount of protons exited. Furthermore, the measured relax-ation times (longitudinal relaxation timeT1, transverse relax-ation timeT2) depend on the pore geometry and can thereforebe used to estimate hydraulic permeabilities (Seevers, 1966).
In laboratory-NMR, artificial magnetic fields and se-quences to measureT2 were early available. These CPMGsequences (Carr and Purcell, 1954; Meiboom and Gill, 1958)with several thousand pulses and a short equidistant pulsespacing (tE) allow for densely recording the decaying signal,ensuring a sufficient acquisition time and minimize relax-ation processes due to diffusion. Each of these pulses causesan NMR echo to be the measured signal (Hahn, 1950). Thus,tE is referred to as the echo spacing of a CPMG sequence.
In borehole-NMR, there has been significant changes inthe design of borehole tools in the nineties (Miller et al.,1990) using artificial magnetic fields and measuringT2 us-ing a CPMG. This made NMR a frequently used tool in oiland gas exploration. However, due to limitations on available
Published by Copernicus Publications on behalf of the European Geosciences Union.
198 M. Ronczka and M. Muller-Petke: Optimization of CPMG sequences to measure NMR
pulse power for conduction of several thousands of pulses,until now it is common to obtainT2 distribution based onconducting at least two different CPMG sequences in NMRborehole measurements. While slow decaying componentsare acquired with a sequence consisting of 1000 pulses anda large echo spacing (tE), fast decaying components can bemeasured with only a few dozen echos and short echo spac-ing (Kruspe et al., 2009). Recently and in addition to ob-tainingT2, there is an increasing interest in measuring multi-dimensional distributions involving diffusion and relaxationbased on sequences, such as presented inHurlimann andVenkataramanan(2002).
Beside applications in oil and gas exploration, NMR bore-hole measurements are needed in near-surface groundwa-ter investigation. There are several reasons NMR logginghas just started for this purpose. Standard NMR logging ofgroundwater monitoring wells is far too expensive with com-mon oil and gas tools and service. Monitoring wells are ofdiameters as small as two inches, so a large diameter NMRtool cannot be used. A first commercially available small di-ameter NMR tool was introduced by Vista-Clara in 2011.This tool is designed for slimhole boreholes and hydroge-ological investigations. An external surface station providesthe necessary pulse power from the surface to the probe thatis lowered into the well. This currently limits the tool to bore-hole depths of about 220 m (Vista Clara, 2011). The Lar-mor frequency for this tool can be switched between 245 and290 kHz. This ensures a sufficient penetration depth (190 mmfrom the tool center), even for drilling in unconsolidated ma-terial. Nevertheless, NMR measurements conducted with alow Larmor frequency provide a low signal-to-noise ratio,which has to be compensated by a high number of stacks.This leads to logging usually performed as point measure-ments. In cases of shallow boreholes and unconsolidated ma-terial that need sufficient penetration depth to obtain reliableresults, this is probably the best way to design an NMR bore-hole tool; however, it is not applicable for deeper boreholesand incompatible with standard logging equipment.
It is this huge energy needed for CPMG pulse sequencesthat limits the construction of a small diameter tool that is in-terchangeable with logging equipment usually used in near-surface logging business. Additionally, if a borehole toolshould operate in depths up to 1000 m, it is inevitable thatall electronics for generating a NMR pulse sequence have tobe implemented in the borehole tool. Therefore, research fordeveloping an NMR borehole tool to characterize groundwa-ter layers is still needed.
At the current state, we do not focus on a developmentof sequences that allow for estimating multi-dimensional re-lationships of diffusion and relaxation. To our knowledgea single CPMG measurement will not be sufficient for thispurpose. We focus on conducting a single CPMG sequencethat allows for obtaining slow and fast decaying compo-nents, minimizing the influence of relaxation due to diffusionand reducing the amount of energy. This can be reached by
reducing the number of pulses and adjusting the echo spacing(tE) between the pulses. We evaluated our optimized CPMGsequence with different parameter sets and various waysof increasingtE in a synthetic study. The synthetic studyis based on simpleT2 relaxation processes. We are awareof complex spin dynamic that may occur due to changedecho spacing within one sequence. But numerical modelingbased on the modified Bloch-Torrey equation (Torrey, 1956)would be beyond the scope of this paper. However, to proveour findings we conducted laboratory experiments. In orderto have sufficient control on pore-size, laboratory measure-ments were conducted on samples of glass beads and gran-ular material of different grain size spectra. This helps tocover a broad range of material that may be observed in fieldexperiments.
2 NMR – T2 relaxation
2.1 Free induction decay
As a property of matter, namely the spin, a hydrogen protonposses a microscopic magnetic moment. In a static magneticfield B0, a torque is applied that leads to an orientation of themagnetic moments along the stream lines of that field. Ac-cording to the field strength ofB0, the protons precess withthe Larmor frequencyωL =γ · B0 about the stream lines ofB0, whereγ [Hz T−1] is the gyromagnetic ratio. If an elec-tromagnetic pulse (B1) with the frequencyωL perpendicularto B0 is applied, the protons can be flipped about an angledependent on the pulse duration and amplitude. Immediatelyafter termination of the excitation pulse, all affected protonsreturn (relax) to the equilibrium state, i.e., the direction ofthe external static magnetic field (B0). During relaxation theprotons precess about the stream lines ofB0. If the streamlines of B0 denote the z-direction, the relaxation process isobserved in the x-y plane. The decay in the x-y plane can bedescribed by Eq. (1).
Mxy(t) = M0 · e
(−tT2
)(1)
Here,M0 is the initial amplitude,T2 the transverse relaxationtime andMxy the magnetisation in the x-y plane. For furtherinformation on basic NMR theory we refer toDunn et al.(2002) or Coates et al.(1999). Basic parameters of interestare the initial amplitudeM0 at t = 0, due to its sensitivity towater content and the relaxation timeT2 as an indicator ofpore space properties. Hence, the transverse relaxation timeT2 denotes how fast or slow the magnetisation decreases inthe x-y plane.
However, the relaxation process in the x-y plane might besignificantly influenced by inhomogeneities in the magneticfield, i.e., magnetic gradients. These inhomogeneities can beon macro scale like variations in the field strength ofB0,or small scaled due to particles with a significant magnetic
Geosci. Instrum. Method. Data Syst., 1, 197–208, 2012 www.geosci-instrum-method-data-syst.net/1/197/2012/

M. Ronczka and M. Muller-Petke: Optimization of CPMG sequences to measure NMR 199
susceptibility in the porous medium. Variations of the mag-netic field intensities lead to slightly different Larmor fre-quencies and therefore to a loss of phase coherence in the x-yplane. The precession of protons in the x-y-plane under theinfluence of magnetic gradients is illustrated schematically inFig.1. At t = t0 all protons are coherent. The slightly differentLarmor frequencies lead to a dephasing of the protons, whichresults in a reduced transverse magnetization. This relaxationtime observed is mostly referred to asT ∗
2 (Dunn et al., 2002).This relaxation timeT ∗
2 of water in porous media consistsof three parts: the bulk relaxationT2,B, the surface relaxationT2,S, and the relaxation due to any kind of dephasingT2,P. Allparts are parallel processes and sum up toT ∗
2 , the relaxationtime of the free induction decay (FID) as decribed in Eq. (2)(Mohnke and Yaramanci, 2008).
1
T ∗
2=
1
T2,B+
1
T2,S+
1
T2,P(2)
The bulk relaxationT2,B denotes the relaxation time of freewater, the surface relaxationT2,S describes any influences ofthe pore surface to the protons in the vicinity of the surface,and T2,P includes all kinds of magnetic gradients (macro-scopic, microscopic).
2.2 T2-relaxation
By conducting a CPMG sequence (Carr and Purcell, 1954;Meiboom and Gill, 1958), influences of magnetic gradientscan be minimized. Due to the CPMG sequence,T2,P can besimplified to a diffusion termT2,D. The relaxation due to dif-fusionT2,D occurs if a proton moves through magnetic gra-dients either macroscopic or microscopic. While moving, theproton passes through regions with varying magnetic fieldstrengths, which results in changing Larmor frequencies. Ac-cording to different pathways of single protons within a set ofprotons and therefore differences in the Larmor frequencies,the set of protons lose their phase coherence. This diffusioneffect is non-removable. The diffusion term can be expressedvia Eq. (3) (e.g.,Kleinberg and Horsfield, 1990):
1
T2,D= D
(γ GtE/2)2
3, (3)
with the gradientG [G cm−1] of the magnetic field,γ[Hz T−1] the gyromagnetic ratio,D [m2 s−1] the diffusioncoefficient andtE [s] the spacing between an echo and theinducing pulse. AsT2,P can be reduced toT2,D, Eq. (2) trans-forms to Eq. (4), which now describes all effects that influ-ences theT2 decay time.
1
T2=
1
T2,B+
1
T2,S+ D
(γ GtE/2)2
3(4)
According to Eq. (3), diffusion effects can be minimized bychoosing a smalltE while conducting a CPMG sequence.
Fig. 1.Loss of phase coherence of protons due to differences in theLarmor frequency in the presence of magnetic gradients.
Equation (3) also indicates that diffusion effects take moreeffect if the echo spacingtE is too large. If the diffusion termcan be assumed to be negligible, onlyT2,B andT2,S affect thedecay time in Eq. (4).
2.3 Estimation of pore size by means ofT2
According to Eq. (4), the transverse relaxation timeT2 mea-sured by a CPMG sequence consists ofT2,B andT2,S. Thebulk relaxationT2,B denotes the relaxation of free water. Herethe protons are only affected by other protons during relax-ation. The surface relaxationT2,S includes all effects of thegrain surface that lead to a faster relaxation. These effects im-ply magnetic properties and the structure of the inner surfaceof the material. The surface relaxation, assuming a fast dif-fusion regime (Brownstein and Tarr, 1979), can be expressedby Eq. (5):
1
T2,S= ρ
S
V, (5)
whereasρ [m s−1] denotes the surface relaxivity,S [m2] thesurface area andV [m3] the volume of a pore. In a porousmedia, V and S refer to the volume and the surface areaof the whole sample. In this case the surface relaxivity is amean value of all water-filled pores. According to Eq. (5),the influence of surface relaxation increases for small poresand/or large surface relaxivities. Due to these dependenciesfine material with small pores will create a faster decayingsignal compared to coarse material. Thus, by knowing thesurface relaxivity (ρ) of a sample it is possible to calculate amean pore radius. If, for example, a spherical pore geometryis assumed, the surface to volume ratio (S
V) equals6
d; or if
a cylindrical geometry is assumed,SV
= 1d
(without top andbottom).
3 CPMG sequences
3.1 Classic CPMG
The CPMG sequence consists of an excitation pulse (P90),which flips the orientation of the macroscopic magnetisation
www.geosci-instrum-method-data-syst.net/1/197/2012/ Geosci. Instrum. Method. Data Syst., 1, 197–208, 2012
200 M. Ronczka and M. Muller-Petke: Optimization of CPMG sequences to measure NMR
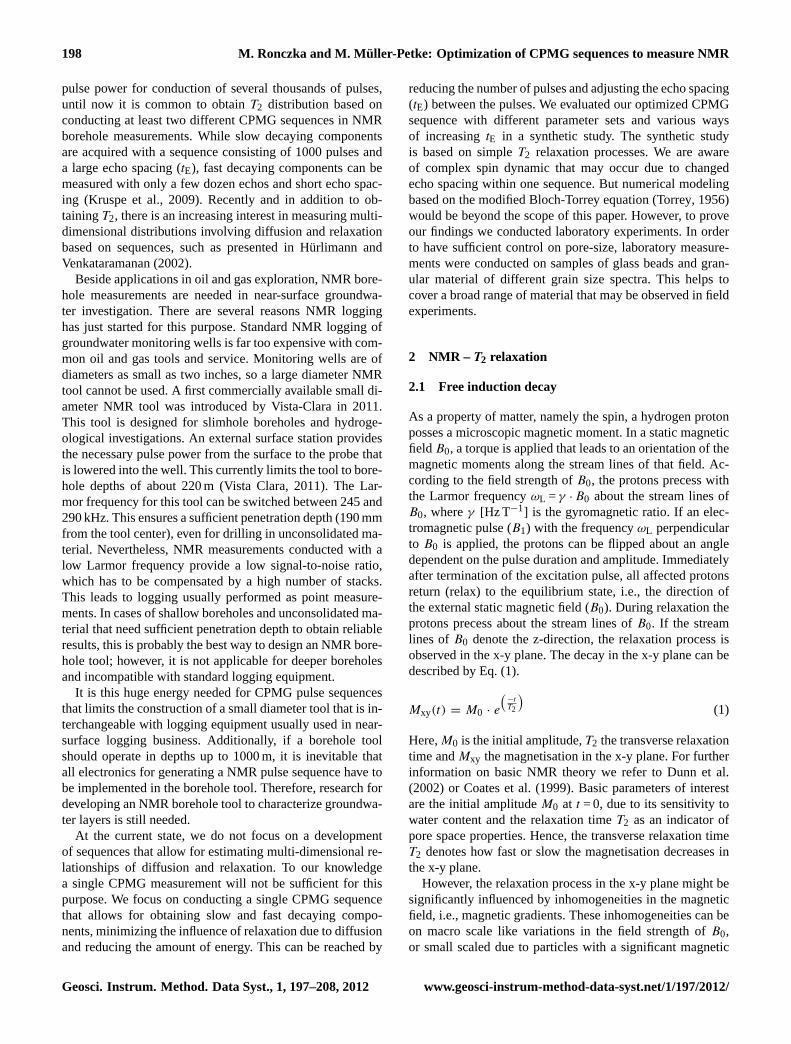
about 90◦ from the z-direction into the x-y plane and severalrefocusing pulses (P180), which flip the protons about 180◦
in the x-y plane. After the excitation pulse (P90), the pro-tons lose their phase coherence due to slightly different Lar-mor frequencies caused by magnetic gradients. After a timespanτ , a refocusing pulse (P180) is applied, which flips theprotons in a manner that those with a higherωL lag behindthose with a lower one. Due to refocusing, an echo is build upand reaches its maximum aftertE = 2τ . The maximum of theecho marks the point of maximal coherence of the protons.
In general,τ is constant over the whole CPMG sequenceand has to be very small to ensure that the diffusion termis negligible, otherwise the protons are not refocused com-pletely, which leads to a reduced amplitude of the echo. Inlaboratory measurements,τ is typically set between 100–300 µs. In order to acquire the whole decay process a largenumber of echos (necho) is needed. Commonly in laboratorymeasurements several thousand echos are performed withinone CPMG sequence. The maximum of all echos detectedgives the relaxation curve for estimating theT2 relaxationtime. A classical CPMG sequence is shown in Fig.2a. Notethat, if for a smallτ diffusion can be neglected, then one canconduct a number of CPMG with differentτ to measure dif-fusion processes.
3.2 CPMG with variable τ spacing
For the purpose of using NMR as a borehole tool, a signifi-cant reduction of energy is needed for conducting a CPMGdue to logging requirements for transport and storage of en-ergy. This is equivalent to a reduction of pulses used (accord-ingly necho) for a sequence. As a result of simply reducing thenumber of echos, the acquisition time is significantly short-ened. This leads to errors in the estimated relaxation time ifthe decay process is not recorded completely. For compen-sation, i.e., to extent the acquisition time, the echo spacingtE = 2τ can be increased. As mentioned before, this wouldincrease the diffusion effects according to Eq. (3) from thebeginning of the sequence, which is not intended. Addition-ally, the density of data points that forms theT2 decay curveis reduced. Thus, it can happen that too few data points inthe beginning of the decay curve are not sufficient for de-tecting fast decaying components. However, a CPMG withan increased constantτ causes insufficient sampling of fastdecaying components in the beginning of the decay curve.Thus, it can be expected that a wrong decay time could beestimated. Additionally, diffusion effects will increase too,according to Eq. (3).
We investigated the effect of different variableτ spacingson the estimated decay time. We designed CPMG sequenceswith a variableτ , as schematically depicted in Fig.2b. Theimportant parameters for constructing a CPMG sequenceswith a variableτ spacing are the number of echos (necho)and a minimum and maximumτ . For generating a sequencewith an increasingτ we fixed the values ofτmin and τmax.
2τ 4τ 6τ 8τ 10τ−1
−0.50
0.51
a.u.
(a)
2τ1 2τ + 2τ1 2 2τ + 2τ + 2τ1 2 3
−1−0.5
00.51
time [s]
a.u.
(b)
Fig. 2. (a) Classical CPMG sequence with a P90 excitation pulseand several P180 pulses for refocusing. After each P180 pulse anechos appears. The envelope of all detected echos gives theT2 decaycurve.(b) First pulses and the resulting echos for a CPMG sequencewith variableτ spacing.
Between these, an amount ofnecho linearly increased; expo-nentially equidistant and logarithmically equidistantτ is cal-culated. Starting with the lowest possibleτmin (τ1 in Fig.2b),the fast decaying components are sampled as accurately aspossible, while the components with a slow decay are alreadyappropriately sampled.
For the sake of clarity, the development of single CPMGsequence with a variable echo spacing does not allow for es-timating diffusion or internal gradient at pore scale like ex-periments as described inHurlimann and Venkataramanan(2002) or Song (2003). The intension of this optimizedCPMG is to measureT2 as appropriate as possible under thescope of reducing the number of pulses.
4 Synthetic study
We conducted a synthetic study to test the evolution of errorsfor the estimated transverse relaxation timeT2 from CPMGsequences with different approaches of increasingτ . First wegenerated synthetic data of a simple mono-exponential sig-nal to get an overview of the different sequences. Secondly asynthetic multi-exponential signal was generated to evaluateif fast and slow decaying parts are distinguishable and canbe determined correctly. Therefore, we used a bi-exponentialsignal with the transverse relaxation timesT2,1 andT2,2 andfitted the data via a decay time distribution. Finally, to exam-ine influences of diffusion on the data due to an increasedτ ,a diffusive part was added to the synthetic data.
We should note that forward modeling based on Eq. (4)is not the most rigorous approach to evaluate the influenceof increasingτ . Changing the symmetry, i.e., the constantecho spacing, may cause complex spin dynamics that can bestudied based on the Bloch-Torrey equation (Torrey, 1956).However, this would be beyond the scope of this paper. Wedecided to support our finding of the synthetic study by con-ducting laboratory-NMR experiments.
Geosci. Instrum. Method. Data Syst., 1, 197–208, 2012 www.geosci-instrum-method-data-syst.net/1/197/2012/
M. Ronczka and M. Muller-Petke: Optimization of CPMG sequences to measure NMR 201
τ cons
t = 0
.1 m
s
T2 tr
ue
noise = 1%
20 50 100 500
0.01
0.08
1
noise = 5%
20 50 100 500
0.01
0.08
1
noise = 10%
20 50 100 500
0.01
0.08
1
τ cons
t = 1
ms
T2 tr
ue
20 50 100 500
0.01
0.08
120 50 100 500
0.01
0.08
120 50 100 500
0.01
0.08
1
τ lin
incr
ease
T2 tr
ue
20 50 100 500
0.01
0.08
120 50 100 500
0.01
0.08
120 50 100 500
0.01
0.08
1
τ ex
p eq
ui.d
ist.
T2 tr
ue
20 50 100 500
0.01
0.08
120 50 100 500
0.01
0.08
120 50 100 500
0.01
0.08
1
number of echos
τ lo
g eq
ui.d
ist
T2tr
ue
20 50 100 500
0.01
0.08
1
number of echos20 50 100 500
0.01
0.08
1
number of echos
20 50 100 500
0.01
0.08
1
0
5
10
15
20
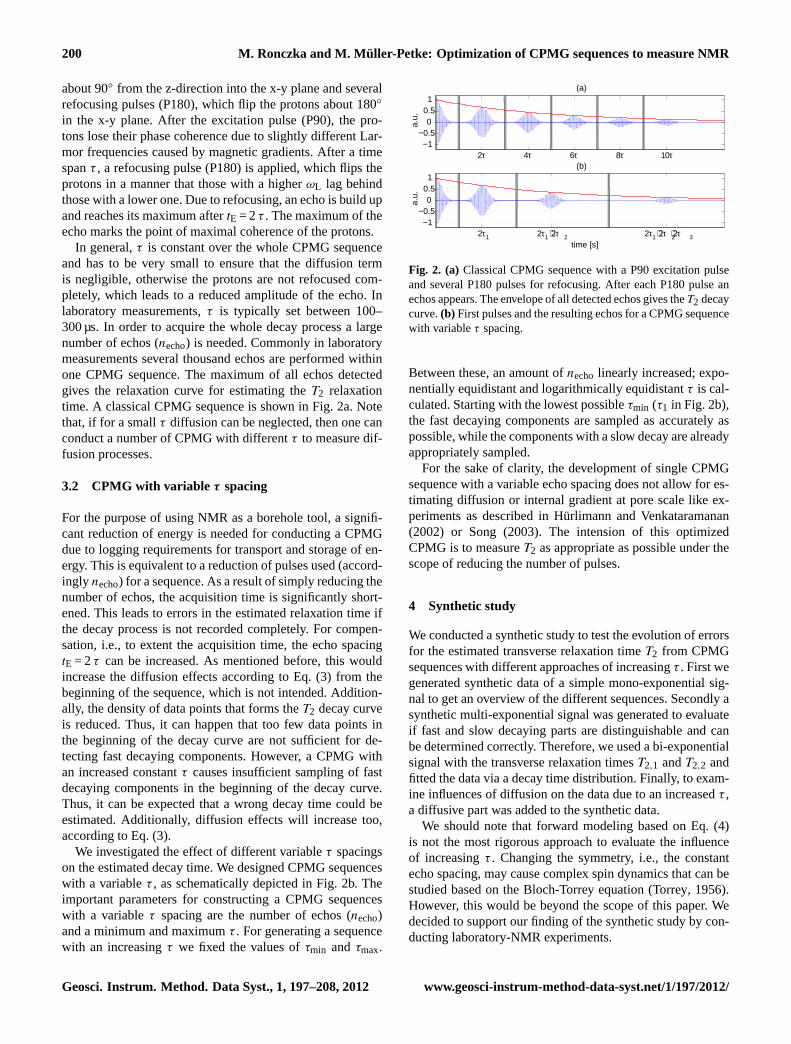
Fig. 3. The evolution of error for different signal-to-noise ratio. Standard deviations between the true transverse decay timeT true2 and the
estimatedT2 depending on the number of echos for mono-exponential synthetic data is shown. All errors over 20 % are red coloured.
4.1 Mono-exponential signal
A mono-exponential signal can be generated using Eq. (1).The set of model parameters are the initial transverse mag-netisationM0 and the transverse decay timeT2. Here,M0 isset to 1 and the decay time for generating the synthetic data isnamedT true
2 and is varied between 1 ms and 1 s. Standard de-viations between the true transverse decay timeT true
2 (fixedmodel parameter) and the estimatedT2 of CPMG sequenceswith a variableτ spacing were calculated for three differentnoise levels and are plotted in Fig.3, each as a function of thetrue decay time (T true
2 ) andnecho. All deviations above 20 %are red coloured.
The results for sequences conducted with a small and largeconstantτ are displayed in the first two rows of Fig.3. Asexpected, the error of the estimated decay times increases ifnecho decreases or the true decay time increases, i.e., slowdecaying signals. This is a result of an insufficient acquisi-tion time. If the noise increases, the range of high errors isextended to highernecho and smallerT true
2 (see first row inFig. 3). Additional errors for small decay times occur if theecho spacing (τ ) is increased (second row of Fig.3), which isprobably caused by a bad sampling of fast decaying signals.
Thus, increasing a constantτ to compensate for the reductionof necho is not an appropriate approach.
All three sequences with a variableτ spacing, illustrated inthe last three rows of Fig.3, exhibit more or less the same be-haviour for the range of errors. Comparing CPMG-sequenceswith a variableτ spacing with the one using a constant smallτ (Fig. 3, first row), smaller errors occur for decreasingnechodue to the elongated acquisition time. Compared to the se-quence with a constant largeτ (Fig. 3, second row), all op-timized sequences show smaller errors for fast decaying sig-nals, which is a result of a tighter sampling of the decay curveat early times. As the noise level increases, the errors over20 % expand to sequences with largernecho and smaller de-cay times too.
4.2 Bi-exponential signal
In the next step a bi-exponential signal was generated to ex-amine if both the fast and the slow decaying parts of thesignal can be estimated while reducingnecho. For generat-ing the synthetic data, Eq. (1) was extended to a sum of twoexponentials with the transverse decay timesT2,1 andT2,2.The decay times were chosen in a manner that they are farapart from each other. Therefore, the synthetic decay curve
www.geosci-instrum-method-data-syst.net/1/197/2012/ Geosci. Instrum. Method. Data Syst., 1, 197–208, 2012

202 M. Ronczka and M. Muller-Petke: Optimization of CPMG sequences to measure NMR
10−3
10−2
10−1
100
1010
0.01
0.02
0.03
0.04
0.05
0.06
ampl
itude
[a.u
.]
necho
= 1000
10−3
10−2
10−1
100
1010
0.01
0.02
0.03
0.04
0.05
0.06
necho
= 500
10−3
10−2
10−1
100
1010
0.01
0.02
0.03
0.04
0.05
0.06
decay time [s]
ampl
itude
[a.u
.]
necho
= 200
10−3
10−2
10−1
100
1010
0.01
0.02
0.03
0.04
0.05
0.06
decay time [s]
necho
= 100
τconst
=0.1ms
τconst
=1ms
τlin
τexp
τlog
d)c)
a) b)
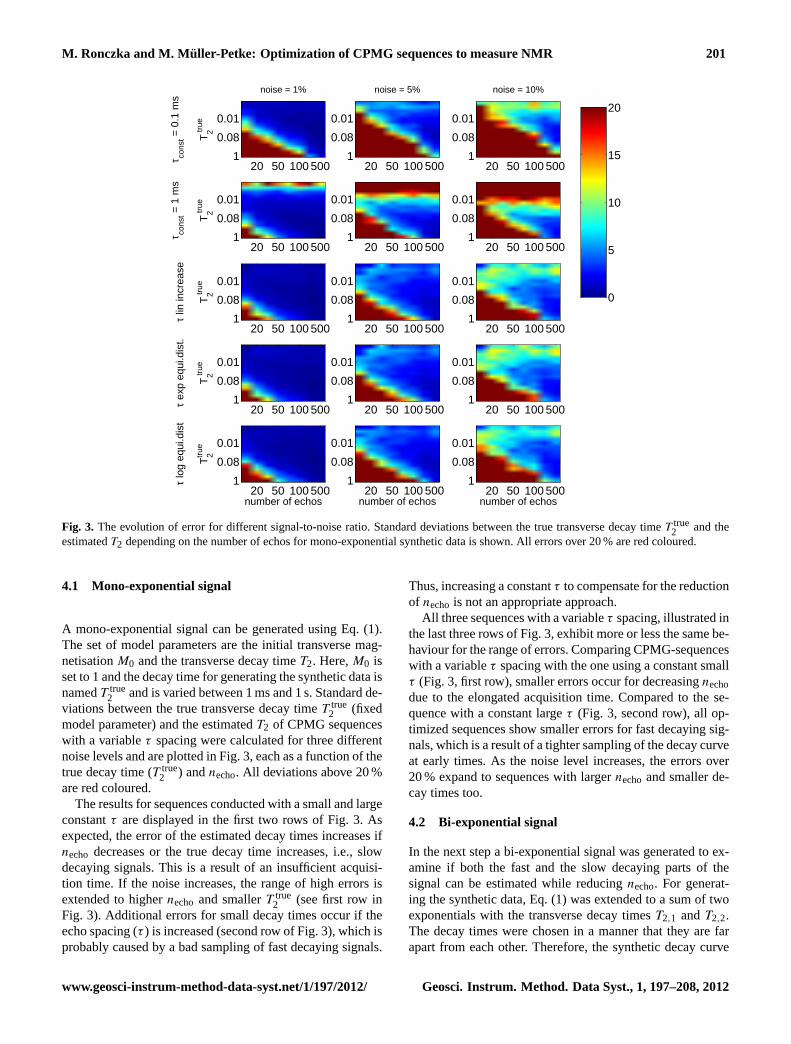
Fig. 4. T2 distributions of bi-exponential signals with differentnecho beginning with 1000 echos(a) to 100 echos(d), all with 5 % noiseadded. Sequences with linearly increasing, exponentially equidistant and logarithmically equidistantτ spacing withτmax = 2 ms are plotted.Additionally two sequences with an constantτ spacing are shown.
is composed of the decay timesT2,1 = 0.01 s andT2,2 = 1 swith 5 % noise added. For all sequences with different vari-ableτ spacing, the recordednechowere reduced successivelyfrom 1000 to 100 echos.
The decay curves were fitted with a multi-exponential ap-proach using an inverse Laplace transformation. This calcu-lates corresponding amplitudes to a predefined amount of de-cay times. For smoothness constraints a Tikhonov regulari-sation of first kind was used. The regularisation parameterwas determined via the L-curve criterion that gives a solutionclosest to the corner of the L-curve (Aster et al., 2005). TheT2 distributions of the fitted signals are illustrated in Fig.4and consist of 100 logarithmically-equidistant-spaced decaytimes within a range ofT2 ∈ [10−3, 101].
In Fig. 4a the signal is sampled withnecho= 1000. In allcurves a bi-exponential behaviour is observable. Sequenceswith a small constantτ (blue curve in Fig.4) cannot resolvethe slow decaying parts of the signal due to a short acqui-sition time (about 0.2 s). As a result theT2 distribution isbroadened and decay times above 3 s are fitted, which ex-ceeds the maximal possible transverse decay time (T2) ofwater. Thus, a logarithmic mean decay time of thisT2 dis-tribution will be overestimated.
In contrast, fast decaying components of the signal cannotbe resolved by a CPMG sequence with a large constantτ
spacing (see the black curve in Fig.4a). This can also beseen inKleinberg(1994).
Both parts of the signal can be more or less resolved byall sequences with a variableτ spacing. The sequence with
an exponentially equidistantτ spacing shows a broadenedT2distribution for fast decaying components, which is a resultof a fast increasingτ that lead to an insufficient sampling ofthe decay curve for early times.
In general, ifnechodecreases, the bi-exponential behaviourvanishes in conjunction with a broadenedT2 distributiondue to the shortened acquisition time. Ifnecho is reducedto 200 echos (see Fig.4c), only sequences with a linearlyincreased and exponentially-equidistantτ spacing exhibit amaximum for slow decaying components. The fast decayingcomponent is resolvable by all sequences.
4.3 Bi-exponential signal with diffusion
According to Eq. (4), theτ spacing is the only sequence pa-rameter that influences the diffusion term of an NMR signal.Thus, different kinds of increasingτ lead to different impactsof the diffusion on the measured signal. To examine this ef-fect we added a diffusion component to the signal.
According toCoates et al.(1999), the magnetic gradientis influenced by three factors. One depends on the tool de-sign (i.e., tool size, frequency and shape of the used magnet).The second one handles conditions of the formation, such asthe temperature. The third factor is described by gradients in-duced by the applied magnetic field, which are the result ofdifferences in the magnetic susceptibility of grains and porefluid and are referred to as internal gradients. The magneticgradient of an MRIL tool (Coates et al., 1999) is denotedwith 17 G cm−1, but Kenyon (1997) stated that a commonmagnetic gradient from commercial NMR logging tools are
Geosci. Instrum. Method. Data Syst., 1, 197–208, 2012 www.geosci-instrum-method-data-syst.net/1/197/2012/
M. Ronczka and M. Muller-Petke: Optimization of CPMG sequences to measure NMR 203
10−3
10−2
10−1
100
1010
0.02
0.04
0.06
0.08
ampl
itude
[a.u
.]
necho
= 1000
10−3
10−2
10−1
100
1010
0.02
0.04
0.06
0.08
necho
= 500
10−3
10−2
10−1
100
1010
0.02
0.04
0.06
decay time [s]
ampl
itude
[a.u
.]
necho
= 200
10−3
10−2
10−1
100
1010
0.02
0.04
0.06
decay time [s]
necho
= 100
τconst
=0.1ms
τconst
=1ms
τlin
τexp
τlog
d)c)
a) b)
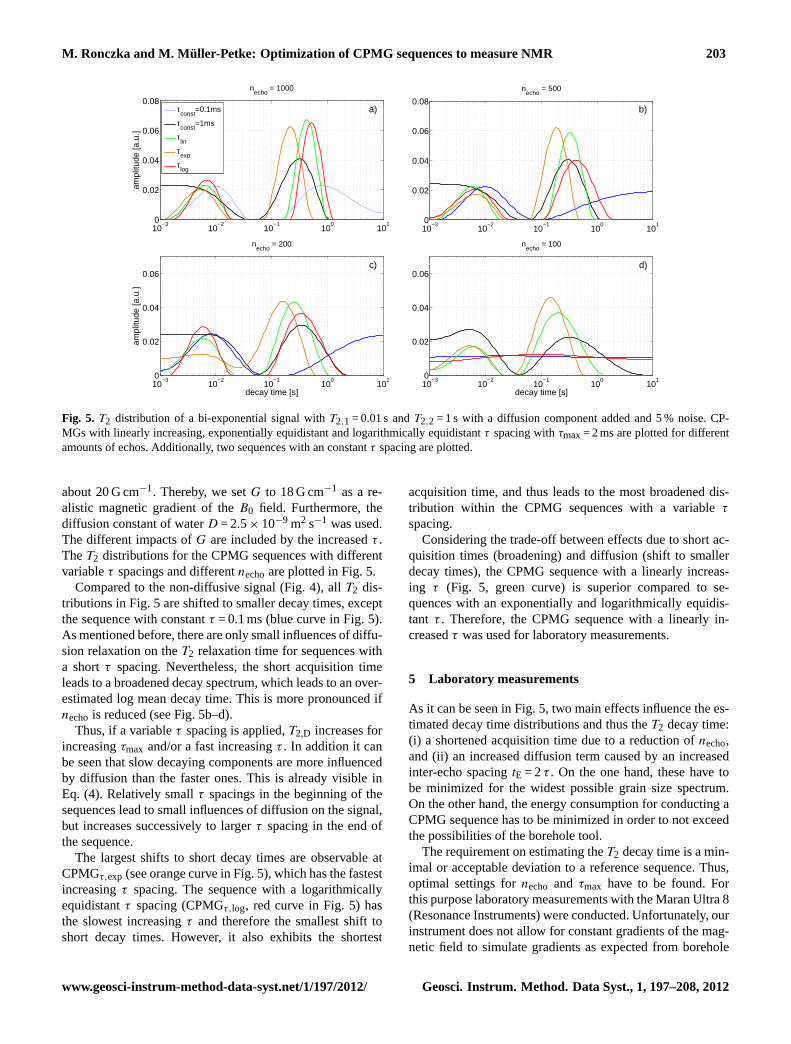
Fig. 5. T2 distribution of a bi-exponential signal withT2,1 = 0.01 s andT2,2 = 1 s with a diffusion component added and 5 % noise. CP-MGs with linearly increasing, exponentially equidistant and logarithmically equidistantτ spacing withτmax= 2 ms are plotted for differentamounts of echos. Additionally, two sequences with an constantτ spacing are plotted.
about 20 G cm−1. Thereby, we setG to 18 G cm−1 as a re-alistic magnetic gradient of theB0 field. Furthermore, thediffusion constant of waterD = 2.5× 10⁻⁹ m2 s−1 was used.The different impacts ofG are included by the increasedτ .TheT2 distributions for the CPMG sequences with differentvariableτ spacings and differentnechoare plotted in Fig.5.
Compared to the non-diffusive signal (Fig.4), all T2 dis-tributions in Fig.5 are shifted to smaller decay times, exceptthe sequence with constantτ = 0.1 ms (blue curve in Fig.5).As mentioned before, there are only small influences of diffu-sion relaxation on theT2 relaxation time for sequences witha shortτ spacing. Nevertheless, the short acquisition timeleads to a broadened decay spectrum, which leads to an over-estimated log mean decay time. This is more pronounced ifnecho is reduced (see Fig.5b–d).
Thus, if a variableτ spacing is applied,T2,D increases forincreasingτmax and/or a fast increasingτ . In addition it canbe seen that slow decaying components are more influencedby diffusion than the faster ones. This is already visible inEq. (4). Relatively smallτ spacings in the beginning of thesequences lead to small influences of diffusion on the signal,but increases successively to largerτ spacing in the end ofthe sequence.
The largest shifts to short decay times are observable atCPMGτ,exp (see orange curve in Fig.5), which has the fastestincreasingτ spacing. The sequence with a logarithmicallyequidistantτ spacing (CPMGτ,log, red curve in Fig.5) hasthe slowest increasingτ and therefore the smallest shift toshort decay times. However, it also exhibits the shortest
acquisition time, and thus leads to the most broadened dis-tribution within the CPMG sequences with a variableτ
spacing.Considering the trade-off between effects due to short ac-
quisition times (broadening) and diffusion (shift to smallerdecay times), the CPMG sequence with a linearly increas-ing τ (Fig. 5, green curve) is superior compared to se-quences with an exponentially and logarithmically equidis-tant τ . Therefore, the CPMG sequence with a linearly in-creasedτ was used for laboratory measurements.
5 Laboratory measurements
As it can be seen in Fig.5, two main effects influence the es-timated decay time distributions and thus theT2 decay time:(i) a shortened acquisition time due to a reduction ofnecho,and (ii) an increased diffusion term caused by an increasedinter-echo spacingtE = 2τ . On the one hand, these have tobe minimized for the widest possible grain size spectrum.On the other hand, the energy consumption for conducting aCPMG sequence has to be minimized in order to not exceedthe possibilities of the borehole tool.
The requirement on estimating theT2 decay time is a min-imal or acceptable deviation to a reference sequence. Thus,optimal settings fornecho and τmax have to be found. Forthis purpose laboratory measurements with the Maran Ultra 8(Resonance Instruments) were conducted. Unfortunately, ourinstrument does not allow for constant gradients of the mag-netic field to simulate gradients as expected from borehole
www.geosci-instrum-method-data-syst.net/1/197/2012/ Geosci. Instrum. Method. Data Syst., 1, 197–208, 2012

204 M. Ronczka and M. Muller-Petke: Optimization of CPMG sequences to measure NMR
Table 1. Grain size spectra of different samples for glass beadsand granular material used in laboratory measurements, with gU– coarse silt; mS, gS – medium, coarse sand.
glass beads granular materiald [µm] d [µm]
gU 40–70 –mS 250–500 250–500gS 1250–1650 1000–1600
tools. Thus, the influence of diffusion that is observed be-longs to internal gradients at pore scale and inhomogeneitiesof the artificial magnetic field.
5.1 Sample preparation and parameter sets of CPMGsequences
Samples of glass beads and granular material with grain sizespectra varying from coarse silt (gU) to coarse sand (gS)were used. The grain size spectra of the used material aregiven in Table1.
For each grain size distribution, three samples were pre-pared. The material was filled in small cylindrical vesselswith a height ofh = 2.6 cm and a diameter ofd = 3.6 cm. Thesample material was trickled into the vessel, which was filledwith distilled water. To assure comparability of porosity be-tween the three samples of the same material, an ultrasonicbath was used to raise the packing density to a maximum.Afterwards the samples were filled up and sealed with a foilto minimize evaporation effects during NMR measurements.To avoid further heating during NMR measurements and thustemperature effects on the initial amplitude and the decaytime (Godefroy et al., 2001), the samples were heated up to25–30◦C. The samples were weighed before and after NMRmeasurements to determine if evaporation occurred duringthe NMR measurements. Variations of the mass less than 1 %were observed.
If a sample is completely water saturated, the porosity canbe calculated using the initial amplitude. A comparison be-tween the NMR- and gravimetric-porosity is illustrated inFig. 6, which is an easy way to determine if any faults weremade during the preparation or measurement.
We performed 9 CPMG sequences per sample with dif-ferent values ofτmax and necho. The logarithmic mean ofthe T2 distribution was compared with the log mean de-cay time (T2,lg) of the reference sequence, which consists of5000 pulses and a constantτ of 300 µs. The pulse–echo spac-ing increased in a linear manner, staring withτmin = 100 µs,while τmax was set between 400 and 4000 µs. The minimalecho spacing (τmin) was the lowest possible value that couldbe realized with the Maran Ultra 8. The number of echos wasdecreased, beginning withnecho= 500 down tonecho= 50. Bychoosing these sequence parameters, an outline of the effecton the acquisition time together with diffusion effects for
Table 2.Sequence parameter for the tested CPMG sequences. Start-ing from a fixedτmin = 100 µs, the echo spacing was increased upto τmax, which equals to the total acquisition timettot given incolumn 3.
necho τmax [ms] ttot [s]
4000 2.05500 1000 0.55
400 0.25
4000 0.82200 1000 0.22
400 0.1
4000 0.20550 1000 0.055
400 0.025
0.25 0.3 0.35 0.40.26
0.28
0.3
0.32
0.34
0.36
0.38
0.4
gravimetric porosity [m3/m3]
NM
R p
oros
ity
datay = 0.94588x + 0.017818
c = 0.982
Fig. 6. Cross-plot of porosities determined via NMR- andgravimetric-measurements. The NMR-porosity is in excellentagreement with the gravimetric ones, which is validated by the cor-relation coefficient ofc = 0.982.
different grain sizes, i.e., signals with different decay times,could be obtained. A full list of the main sequence param-etersnecho and τmax together with the resulting acquisitiontime ttot is given in Table2.
5.2 Results
5.2.1 T2 distribution of glass beads
TheT2 distribution of different glass beads are illustrated inFig. 7. The mean grain size spectra increases from top tobottom, in which samples of coarse silt (40–70 µm) are de-picted in the first row (Fig.7a–c), samples of medium sand(250–500 µm) in the second row (Fig.7d–f) and samples ofcoarse sand (1250–1650 µm) in the third row. The echos de-crease from left to right, starting withnecho= 500 down to
Geosci. Instrum. Method. Data Syst., 1, 197–208, 2012 www.geosci-instrum-method-data-syst.net/1/197/2012/

M. Ronczka and M. Muller-Petke: Optimization of CPMG sequences to measure NMR 205
Table 3. Logarithmic mean decay timeT2,lg for all CPMG sequences conducted on glass beads. The second column denotesT2,lg of thereference sequence conducted withnecho= 5000 and a constantτ = 300 µs.
sample T2,lg [ms] τmax [µs] necho: 500 200 50(reference) (T2,lg [ms]) (T2,lg [ms]) (T2,lg [ms])
silt 400 91.55 81.78 75.02(40–70 µm) 73.25 1000 76.91 68.22 53.40
4000 59.38 46.7 30.85
medium-grained 400 592.58 761.54 1083.6(250–500 µm) 487.68 1000 508.07 461.41 454.01
4000 457.52 424.97 378.58
coarse-grained 400 1721.7 1869.1 1824.6(1250–1650 µm) 1320.1 1000 1543.1 1728.4 2057.6
4000 1366.6 1589.1 1405.8
10−3
10−2
10−1
100
101
0
10
20
30
40
50
ampl
itude
[a.u
.]
10−3
10−2
10−1
100
101
0
10
20
30
40
50
decreasing necho
10−3
10−2
10−1
100
101
0
10
20
30
40
50
10−3
10−2
10−1
100
101
0
10
20
30
40
50
decaytime [s]
ampl
itude
[a.u
.]
10−3
10−2
10−1
100
101
0
10
20
30
40
50
decaytime [s]
10−3
10−2
10−1
100
101
0
10
20
30
40
50
decaytime [s]
10−3
10−2
10−1
100
101
0
10
20
30
40
50
incr
easi
ng g
rain
size
am
plitu
de [a
.u.]
necho
=5000; τconst
=0.3 ms
necho
=500; τmax
=0.4 ms
τmax
= 1 ms
τmax
= 4 ms
10−3
10−2
10−1
100
101
0
10
20
30
40
50
n
echo=5000; τ
const=0.3 ms
necho
=200; τmax
= 0.4 ms
τmax
= 1 ms
τmax
= 4 ms
10−3
10−2
10−1
100
101
0
10
20
30
40
50
necho
=5000; τconst
=0.3 ms
necho
=50; τmax
=0.4 ms
τmax
= 1 ms
τmax
= 4 ms
a) c)
d)
g) h)
f)e)
i)
b)
Fig. 7. T2 distribution of glass beads for CPMG sequences with a linearly increasedτ . Columns indicate a decreasingnecho (500–200–50,also given in the legends). The grain size increases from top to bottom (first row – coarse silt; second row – fine sand; third row – coarsesand).
necho= 50. Within each subplot of Fig.7, the blue colouredT2 distribution is associated with the reference sequence. Theother curves denote CPMG sequences with a linearly increas-ing τ spacing and differentτmax values. The correspondinglog mean decay times of the distribution are given in Table3.
For necho= 500 (Fig. 7a) the T2 distribution for fine-grained glass beads are displayed. Compared to the referencesequence a shift of the main peaks to smaller decay times isobserved, which is more distinctive for an increasingτmax.For a constantnecho theτ spacing increases faster for largerτmax. Thus, considering Eq. (3), a largerτ leads to a higher
attenuation due to diffusion and results in a larger shift tosmaller decay times.
Fornecho= 500 and increasing grain size (from top to bot-tom), it shows that a shift to small decay times is observedfor all grain sizes. For the fine-grained sample (Fig.7a) thedifference of the main peak to the reference signal is about55.65 ms considering the sequence withτmax= 4000 ms,while the shift for the medium-grained sample (Fig.7d)is (with a difference of 164 ms) increased. In contrast, forcoarse sand samples the shift decreases with a largerτmax,which is due to the short acquisition time. For coarse-grained
www.geosci-instrum-method-data-syst.net/1/197/2012/ Geosci. Instrum. Method. Data Syst., 1, 197–208, 2012

206 M. Ronczka and M. Muller-Petke: Optimization of CPMG sequences to measure NMR
0 2 4 6 8 100
5
10
x
y
incr
easi
ng g
rain
size
10−3
10−2
10−1
100
101
0
5
10
15
20
25
decaytime [s]
ampl
itude
[a.u
.]
necho
=5000; τconst
=0.3 ms
necho
=500; τmax
=0.4 ms
τmax
= 1 ms
τmax
= 4 ms
10−3
10−2
10−1
100
101
0
5
10
15
20
25
decaytime [s]
ampl
itude
[a.u
.]
10−3
10−2
10−1
100
101
0
5
10
15
20
25
decaytime [s]
ampl
itude
[a.u
.]
10−3
10−2
10−1
100
101
0
5
10
15
20
25
decaytime [s]
ampl
itude
[a.u
.]
necho
=5000; τconst
=0.3 ms
necho
=200; τmax
=0.4 ms
τmax
= 1 ms
τmax
= 4 ms
decreasing necho
a) b)
c) d)
Fig. 8. T2 distribution of granular material for pulse sequences with a linearly increasedτ . necho is decreasing from left to right beginning(necho= 500–200). The grain size increases from top (medium sand) to bottom (coarse sand).
material, NMR signals decay more slowly due to a decreaseof S
Vof the surface relaxationT2,S. Thus, maintaining the se-
quence parameter (necho, τmax), the acquisition time becomesinsufficiently short for slow decaying signals and smallτmax.Furthermore, the shorter acquisition time leads to a broaden-ing of the distribution.
For decreasingnecho (from left to right) and fine-grainedmaterial, the same effect of broadening is observed; how-ever, in addition to fully acquiring the signal, the samplingof the decay curve is the key factor. If the decay is com-pletely acquired by the CPMG sequence, as it is the case forthe fine-grained material and sequences withτmax= 4000 µs,the reduction of data points due to decreasednecho leads to abroadening of theT2 distributions. If the signal is not com-pletely acquired, as it is the case forτmax= 400 µs, a furtherbroadening is observed.
For decreasingnechoand increasing the grain size, it showsthat the effect of acquiring the complete signal dominates thedata sampling effect. Theoretically a shortened acquisitiontime due to a reduction ofnecho can be compensated by alargerτmax; however, this leads to higher diffusion.
5.2.2 Log mean decay time of glass beads
The corresponding log mean decay times to theT2 distribu-tions of glass beads are given in Table3. For each sampleand amount of echos (necho), a systematic decrease ofT2,lgfor an increasingτmax is observable. On the one hand, thiscan be explained by an attenuated diffusion for fast decay-ing signals, which are fully acquired. On the other hand, forslower decaying signals the decrease ofT2,lg results from the
broadening of theT2 distribution due to an insufficient acqui-sition time.
If nechois reducedT2,lg decreases for silt and medium sandsamples withτmax= 1000/4000 µs, which is also an effect ofacquisition time. In contrast, the sequence withτmax= 400 µsof medium sand and all sequences of coarse sand samplesshow an increasingT2,lg if necho decreases. This is a resultof a flattenedT2 distribution with large decay times (beyond3 s) fitted to explain the data.
Sequences conducted for example withnecho= 500 andτmax= 400 µs seems to overestimateT2,lg compared to thereference sequence (silt and medium-grained glass beads inTable3), although the decay process is recorded completely.Compared to the reference sequence, fast decaying compo-nents vanish in theT2 distributions (see Fig.7). A cut-offtime for calculatingT2,lg could possibly solve this problem.
5.2.3 Comparison ofT2 distributions between samplesof granular material and glass beads
TheT2 distributions for samples of granular material are il-lustrated in Fig.8. Sequences withnecho= 50 are neglectedbecause theT2 distribution of glass beads (see Fig.7c, fand i) showed that the acquisition time is too short for get-ting appropriate results. Also, the results for fine gravel areneglected because these large grained materials are assumedto have already good hydraulic properties, whose estimationwas one of the major focuses.
In comparison to the glass beads, theT2 distribution ofgranular material exhibits a bi-exponential behaviour that ismore distinctive at coarse sand (Fig.8c and d). Consistent
Geosci. Instrum. Method. Data Syst., 1, 197–208, 2012 www.geosci-instrum-method-data-syst.net/1/197/2012/
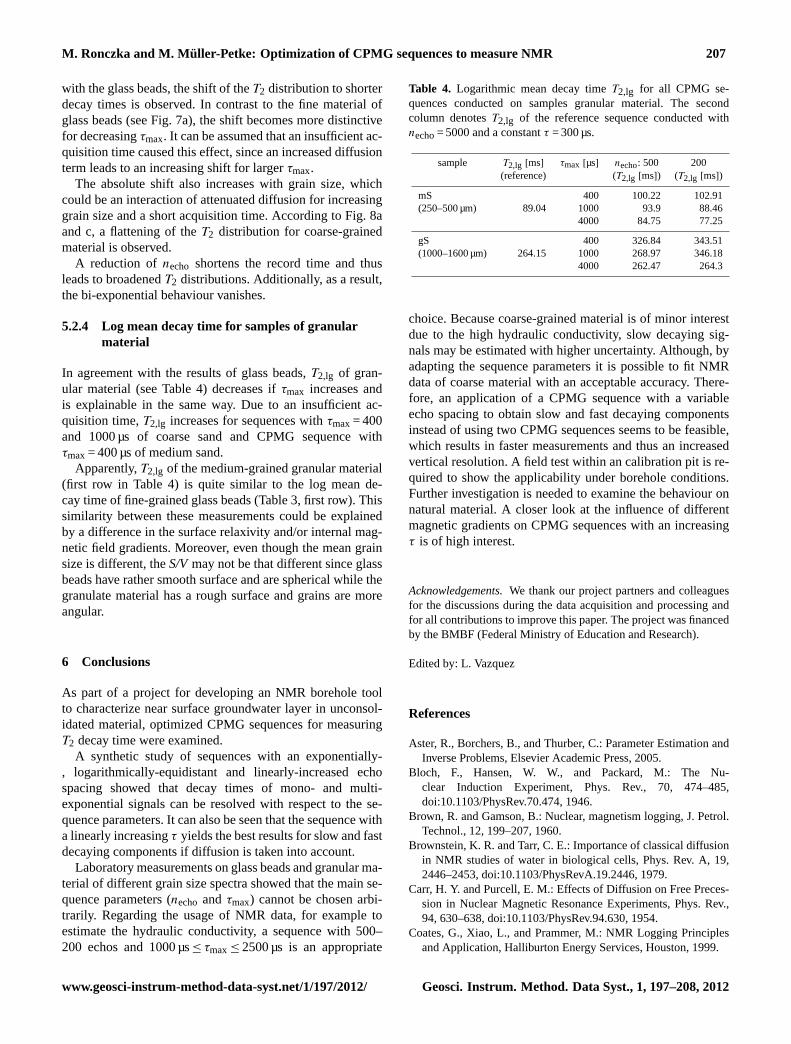
M. Ronczka and M. Muller-Petke: Optimization of CPMG sequences to measure NMR 207
with the glass beads, the shift of theT2 distribution to shorterdecay times is observed. In contrast to the fine material ofglass beads (see Fig.7a), the shift becomes more distinctivefor decreasingτmax. It can be assumed that an insufficient ac-quisition time caused this effect, since an increased diffusionterm leads to an increasing shift for largerτmax.
The absolute shift also increases with grain size, whichcould be an interaction of attenuated diffusion for increasinggrain size and a short acquisition time. According to Fig.8aand c, a flattening of theT2 distribution for coarse-grainedmaterial is observed.
A reduction ofnecho shortens the record time and thusleads to broadenedT2 distributions. Additionally, as a result,the bi-exponential behaviour vanishes.
5.2.4 Log mean decay time for samples of granularmaterial
In agreement with the results of glass beads,T2,lg of gran-ular material (see Table4) decreases ifτmax increases andis explainable in the same way. Due to an insufficient ac-quisition time,T2,lg increases for sequences withτmax= 400and 1000 µs of coarse sand and CPMG sequence withτmax= 400 µs of medium sand.
Apparently,T2,lg of the medium-grained granular material(first row in Table4) is quite similar to the log mean de-cay time of fine-grained glass beads (Table3, first row). Thissimilarity between these measurements could be explainedby a difference in the surface relaxivity and/or internal mag-netic field gradients. Moreover, even though the mean grainsize is different, theS/Vmay not be that different since glassbeads have rather smooth surface and are spherical while thegranulate material has a rough surface and grains are moreangular.
6 Conclusions
As part of a project for developing an NMR borehole toolto characterize near surface groundwater layer in unconsol-idated material, optimized CPMG sequences for measuringT2 decay time were examined.
A synthetic study of sequences with an exponentially-, logarithmically-equidistant and linearly-increased echospacing showed that decay times of mono- and multi-exponential signals can be resolved with respect to the se-quence parameters. It can also be seen that the sequence witha linearly increasingτ yields the best results for slow and fastdecaying components if diffusion is taken into account.
Laboratory measurements on glass beads and granular ma-terial of different grain size spectra showed that the main se-quence parameters (necho andτmax) cannot be chosen arbi-trarily. Regarding the usage of NMR data, for example toestimate the hydraulic conductivity, a sequence with 500–200 echos and 1000 µs≤ τmax≤ 2500 µs is an appropriate
Table 4. Logarithmic mean decay timeT2,lg for all CPMG se-quences conducted on samples granular material. The secondcolumn denotesT2,lg of the reference sequence conducted withnecho= 5000 and a constantτ = 300 µs.
sample T2,lg [ms] τmax [µs] necho: 500 200(reference) (T2,lg [ms]) (T2,lg [ms])
mS 400 100.22 102.91(250–500 µm) 89.04 1000 93.9 88.46
4000 84.75 77.25
gS 400 326.84 343.51(1000–1600 µm) 264.15 1000 268.97 346.18
4000 262.47 264.3
choice. Because coarse-grained material is of minor interestdue to the high hydraulic conductivity, slow decaying sig-nals may be estimated with higher uncertainty. Although, byadapting the sequence parameters it is possible to fit NMRdata of coarse material with an acceptable accuracy. There-fore, an application of a CPMG sequence with a variableecho spacing to obtain slow and fast decaying componentsinstead of using two CPMG sequences seems to be feasible,which results in faster measurements and thus an increasedvertical resolution. A field test within an calibration pit is re-quired to show the applicability under borehole conditions.Further investigation is needed to examine the behaviour onnatural material. A closer look at the influence of differentmagnetic gradients on CPMG sequences with an increasingτ is of high interest.
Acknowledgements.We thank our project partners and colleaguesfor the discussions during the data acquisition and processing andfor all contributions to improve this paper. The project was financedby the BMBF (Federal Ministry of Education and Research).
Edited by: L. Vazquez
References
Aster, R., Borchers, B., and Thurber, C.: Parameter Estimation andInverse Problems, Elsevier Academic Press, 2005.
Bloch, F., Hansen, W. W., and Packard, M.: The Nu-clear Induction Experiment, Phys. Rev., 70, 474–485,doi:10.1103/PhysRev.70.474, 1946.
Brown, R. and Gamson, B.: Nuclear, magnetism logging, J. Petrol.Technol., 12, 199–207, 1960.
Brownstein, K. R. and Tarr, C. E.: Importance of classical diffusionin NMR studies of water in biological cells, Phys. Rev. A, 19,2446–2453,doi:10.1103/PhysRevA.19.2446, 1979.
Carr, H. Y. and Purcell, E. M.: Effects of Diffusion on Free Preces-sion in Nuclear Magnetic Resonance Experiments, Phys. Rev.,94, 630–638,doi:10.1103/PhysRev.94.630, 1954.
Coates, G., Xiao, L., and Prammer, M.: NMR Logging Principlesand Application, Halliburton Energy Services, Houston, 1999.
www.geosci-instrum-method-data-syst.net/1/197/2012/ Geosci. Instrum. Method. Data Syst., 1, 197–208, 2012
208 M. Ronczka and M. Muller-Petke: Optimization of CPMG sequences to measure NMR
Dunn, K. J., Bergman, D. J., and Latorraca, G. A.: Nuclear magneticresonance, 1st Edn., Pergamon, 2002.
Godefroy, S., Fleury, M., Deflandre, F., and Korb, J.-P.: Tempera-ture effect on NMR surface relaxation, in: SPE Annual TechnicalConference and Exhibition, 30 September–3 October 2001, NewOrleans, Louisiana,doi:10.2118/71700-MS, 2001.
Hahn, E. L.: Spin Echoes, Phys. Rev., 80, 580–594,doi:10.1103/PhysRev.80.580, 1950.
Hurlimann, M. D. and Venkataramanan, L.: Quantitative Measure-ment of Two-Dimensional Distribution Functions of Diffusionand Relaxation in Frossly Inhomogeneous Fields, J. Magnet. Re-son., 157, 31–42,doi:10.1006/jmre.2002.2567, 2002.
Kenyon, W. E.: Petrophysical Principles of Applications of NMRLogging, Log Analyst, 38, 21–43, 1997.
Kleinberg, R. L.: Pore size distributions, pore coupling, and trans-verse relaxation spectra of porous rocks, Proceedings of the Sec-ond International Meeting on Recent Advances in MR Applica-tions to Porous Media, Magnet. Reson. Imaging, 12, 271–274,doi:10.1016/0730-725X(94)91534-2, 1994.
Kleinberg, R. L. and Horsfield, M. A.: Transverse relaxation pro-cesses in porous sedimentary rock, J. Magnet. Reson., 88, 9–19,doi:10.1016/0022-2364(90)90104-H, 1990.
Kruspe, T., Thern, H. F., Kurz, G., Blanz, M., Akkurt, R., Ruwaili,S., Seifert, D., and Marsala, A. F.: Slimhole Application ofMagnetic Resonance While Drilling, in: SPWLA 50th AnnualLogging Symposium, 21–24 June 2009, The Woodlands, Texas,p. 15, 2009.
Meiboom, S. and Gill, D.: Modified Spin-Echo Method for Measur-ing Nuclear Relaxation Times, Rev. Sci. Instrum., 29, 688–691,doi:10.1063/1.1716296, 1958.
Miller, M., Paltiel, Z., Gillen, M., Granot, J., and Bouton, J.: SpinEcho Magnetic Resonance Logging: Porosity and Free Fluid In-dex Determination, SPE paper 20561, New Orleans, Louisiana,1990.
Mohnke, O. and Yaramanci, U.: Pore size distributions andhydraulic conductivities of rocks derived from Magnetic Res-onance Sounding relaxation data using multi-exponentialdecay time inversion, J. Appl. Geophys., 66, 73–81,doi:10.1016/j.jappgeo.2008.05.002, 2008.
Purcell, E. M., Torrey, H. C., and Pound, R. V.: Resonance Absorp-tion by Nuclear Magnetic Moments in a Solid, Phys. Rev., 69,37–38,doi:10.1103/PhysRev.69.37, 1946.
Seevers, D.: A nuclear magnetic method for determining the perme-ability of sandstones, Paper L, Society of Professional Well LogAnalysts Transactions, Tulsa, Oklahoma, 1–14, 1966.
Song, Y.-Q.: Using internal magnetic fields to obtain pore size dis-tributions of porous media, Concept. Magnet. Reson. A, 18, 97–110,doi:10.1002/cmr.a.10072, 2003.
Torrey, H. C.: Bloch Equations with Diffusion Terms, Phys. Rev.,104, 563–565,doi:10.1103/PhysRev.104.563, 1956.
Vista Clara, I.: Javelin – Manual and Documentation, 1.2 Edn., VistaClara, Inc., Mukilteo, USA, 2011.
Geosci. Instrum. Method. Data Syst., 1, 197–208, 2012 www.geosci-instrum-method-data-syst.net/1/197/2012/
Related Documents