Int.J.Curr.Microbiol.App.Sci (2018) 7(7): 1910-1920 1910 Original Research Article https://doi.org/10.20546/ijcmas.2018.707.226 Optimization of Blending Apple (Malus × domestica) Bars using Response Surface Methodology Manpreet Kaur 1 *, Naveet Kaushal 3 , Ajay Singh 2 and Namneet Kaur 2 1 Department of Agriculture, 2 Department of Food Technology, Mata Gujri College, 3 Department of Agriculture, Fatehgarh Sahib, India *Corresponding author ABSTRACT Introduction Apple (Malus × domestica) is the fourth most important fruit crop after citrus, grapes and banana and one of the commercially most important horticultural crops grown in temperate parts of the world (Ferree and Warrington,2003). Apple belongs to the Rosaceae family which includes many well- known genera with economically important fruits, particularly edible, temperate-zone fruits and berries such as apple, pear, almond, apricot, cherries, peach, plum, strawberries and raspberries. It is fourth important cash crop in the world (Janick et al., 2013). China being the first for apple production annually (Javed, 2013; Afandi, 2012; Khair et al., 2006). In India apple cultivated area is 277000ha whereas its production and productivity is 2242000 mt and 8 mt/ha(nhb.gov.in, 2016-2017). Major apple producing states in India are Jammu&Kashmir, Himachal Pradesh, Arunachal Pradesh, Uttranchal. Himachal Pradesh is also known as ‘‘apple bowl” of India. Apple fruit also known as king of temperate fruits. Apples contain over 84% water and a rich source of antioxidant, pytonutrients, flavonoids and polyphenolics. Flavonoids in apples are quercetin and International Journal of Current Microbiology and Applied Sciences ISSN: 2319-7706 Volume 7 Number 07 (2018) Journal homepage: http://www.ijcmas.com Firm ripe apple fruits mature and healthy red delicious apple variety was bought from the local market used for the study. Apple contains higher antioxidant compounds. It has the potential to be used as a healthy food. For the optimization of apple bar by response surface methodology, the experiments were conducted according to Central Composite Rotatable Design (CCRD) with three variables at five levels. The low and high levels of the variables were 7 and 10% invert syrup, 1000 and 1600 W temperature, 0.3 and 0.6% pectin, respectively. Out of twenty treatments, the best treatment with desirability one having invert syrup (7%), pectin(6%), temperature(1600W). Keywords Optimization, Apple, Response surface methodology, Invert syrup, Pectin, Citric acid Accepted: 15 June 2018 Available Online: 10 July 2018 Article Info

Welcome message from author
This document is posted to help you gain knowledge. Please leave a comment to let me know what you think about it! Share it to your friends and learn new things together.
Transcript
Int.J.Curr.Microbiol.App.Sci (2018) 7(7): 1910-1920
1910
Original Research Article https://doi.org/10.20546/ijcmas.2018.707.226
Optimization of Blending Apple (Malus × domestica)
Bars using Response Surface Methodology
Manpreet Kaur1*, Naveet Kaushal
3, Ajay Singh
2 and Namneet Kaur
2
1Department of Agriculture,
2Department of Food Technology, Mata Gujri College,
3Department of Agriculture, Fatehgarh Sahib, India
*Corresponding author
A B S T R A C T
Introduction
Apple (Malus × domestica) is the fourth most
important fruit crop after citrus, grapes and
banana and one of the commercially most
important horticultural crops grown in
temperate parts of the world (Ferree and
Warrington,2003). Apple belongs to the
Rosaceae family which includes many well-
known genera with economically important
fruits, particularly edible, temperate-zone
fruits and berries such as apple, pear, almond,
apricot, cherries, peach, plum, strawberries
and raspberries. It is fourth important cash
crop in the world (Janick et al., 2013). China
being the first for apple production annually
(Javed, 2013; Afandi, 2012; Khair et al.,
2006). In India apple cultivated area is
277000ha whereas its production and
productivity is 2242000 mt and 8
mt/ha(nhb.gov.in, 2016-2017). Major apple
producing states in India are
Jammu&Kashmir, Himachal Pradesh,
Arunachal Pradesh, Uttranchal. Himachal
Pradesh is also known as ‘‘apple bowl” of
India. Apple fruit also known as king of
temperate fruits. Apples contain over 84%
water and a rich source of antioxidant,
pytonutrients, flavonoids and polyphenolics.
Flavonoids in apples are quercetin and
International Journal of Current Microbiology and Applied Sciences ISSN: 2319-7706 Volume 7 Number 07 (2018) Journal homepage: http://www.ijcmas.com
Firm ripe apple fruits mature and healthy red delicious apple variety was
bought from the local market used for the study. Apple contains higher
antioxidant compounds. It has the potential to be used as a healthy food. For
the optimization of apple bar by response surface methodology, the
experiments were conducted according to Central Composite Rotatable Design
(CCRD) with three variables at five levels. The low and high levels of the
variables were 7 and 10% invert syrup, 1000 and 1600 W temperature, 0.3 and
0.6% pectin, respectively. Out of twenty treatments, the best treatment with
desirability one having invert syrup (7%), pectin(6%), temperature(1600W).
K e y w o r d s
Optimization, Apple, Response surface
methodology, Invert
syrup, Pectin, Citric
acid
Accepted:
15 June 2018
Available Online: 10 July 2018
Article Info
Int.J.Curr.Microbiol.App.Sci (2018) 7(7): 1910-1920
1911
procyanidin B2. Additionally, they are also
good in tartaric acid that gives tart flavour to
them. Apple fruit contains good quantities of
vitamin-C, betacarotene, minerals (K, Mg, Ca,
and Na) trace elements (Zn, Mn, Cu, Fe, B, F,
Se, Mo) and have high fiber content.
Fruit leathers or bars are dehydrated fruit
based products in which the destruction of
original fruit structure by pureeing and
restructuring in dehydrated sugar-acid- pectin
gels provide attractive, coloured products, on
which research is enhanced now-a- days. Fruit
leathers also allow left over ripe fruits to be
preserved (Natalia et al., 2011). Fruit leathers
are dried sheets of fruit pulp that have a soft,
rubbery texture and sweet taste. They are
produced by dehydrating of fruit puree into a
leathery sheet (Raab and Oehler, 1999). Apple
bar can also be prepared by using apple juice
concentrate (AJC), invert syrup, pectin and
citric acid. In this way, the AJC could be used
to give a natural sweet taste to the fruit leather.
Invert syrup is sweeter than ordinary sugar
and provides texture to fruit leather.
Moreover, incorporation of pectin would
improve the physicochemical and sensory
properties of the product. Citric acid act as
preservative and also add acidic taste to fruit
leather (Huang, et al., 2005). The aim of this
work was to standardize the method of
preparation of apple bar with different
concentration of invert syrup, pectin,
temperature and constant concentration of
citric acid, using response surface
methodology with the purpose of achieving
maximum possible colour and appearance,
mouthfeel and texture, reducing sugar,
polyphenols and overall acceptability.
Materials and Methods
Experimental design
For the optimization of apple bar by response
surface methodology, the experiments were
conducted according to Central Composite
Rotatable Design (CCRD) with three variables
at five levels. The independent variables were
invert syrup, power, and pectin. The low and
high levels of the variables were 7 and 10%
invert syrup, 1000 and 1600W power,0.3 and
0.6% pectin, respectively (Ade- Omowaye et
al., 2002). The relationship between levels of
different coded and uncoded form of
independent variables is given in Table 1. The
experiments plan in coded and uncoded form
of process variables along with results is as
given in Table 2. The experiments were
conducted randomly to minimize the effects of
unexplained variability in the observed
responses because of external factors.
Preparation of sample
Good quality fresh, mature and healthy Red
Delicious apple variety was bought from the
local market. The uniform sized healthy,
disease free fruits with full maturation and
firm texture were selected and washed with
water in order to remove dust, dirt and any
other foreign material. The fruit was peeled,
trimmed, cut and blanched in boiling water at
96°C temperature for 3 min. and then
immediately the slices were dipped into cold
water for 4 min. to prevent oxidation. The TSS
was measured with Erma hand refractrometer.
The main ingredients used to prepare apple
leather/bar were apple juice, invert syrup,
pectin and citric acid with different
formulations as per predicted/designed by
response surface methodology.
Fruit bar preparation
Flow chart for preparation of apple fruit
bar
Selection of apple fruits
↓
Washing with clean water
↓
Int.J.Curr.Microbiol.App.Sci (2018) 7(7): 1910-1920
1912
Blanching of fruits
↓
Juice extraction
↓
Blending with pectin
↓
Concentrate juice by continuous boiling upto
¼th
of volume
↓
Addition of invert syrup
↓
Boiling and juding end point (drop test)
↓
Addition of citric acid
↓
Spreading on trays (0.5-1 cm thick layer)
↓
Cutting in to pieces and packing in butter
paper
↓
Storage in ziplock bags
Statistical analysis and optimization
Design expert software was used to estimate
the response of the dependent variables. The
response function (y) was related to coded
variable (xi, i= 1,2,3) by second polynomial
equation as given below:
Y= b0+ b 1 x1+b2x2 + b3x3+ b 12x1 x2 +b 13x1
x3+b23 x2 x3+b11 x12+ b 22x2
2+ b33x3
2+ ε -----(1)
The variance for each factor assumed was
partitioned into linear, quadratic and
interactive components. The coefficient of the
polynomial were represented by b0 (constant),
b1 b2 b3 (linear effect), b12 b13 b23 (interaction
terms), b11, b22, b33 (quadratic effect) and ε
(random error). The significance of all the
term in the polynomial function was assumed
statistically using F value at probability (P) of
0.05.
The response surface and contour plots were
generated for different interaction of any two
independent variables, while holding the value
of third variable as constant (at the central
value). Such three dimensional surfaces could
give accurate geometrical representation and
provide useful information about the behavior
of the system within the experimental design.
The optimization of apple bar process was
aimed at finding the levels of independent
variables viz. invert syrup, power, and pectin,
which would give maximum possible colour
and apperance, mouthfeel and texture, overall
acceptability. It will also help to make the
product shelf stable at ambient conditions
Response surface methodology was applied to
the experimental data using commercial
statistical package, Design–Export version
8.01 (Trail version; Statease Inc.,
Minneapolis, MN,USA). The same software
was used for the generation of response
surface plots, superimposition of contour
plots, and optimization of process variables.
Mathematical calculations
Reducing sugar
The results were calculated using formula
stated below and were expressed as percentage
of reducing sugars.
Reducing sugars(%)=
Factor x dilution
× 100
Weight of fresh sample x titre reading
Polyphenols
The DPPH radical scavenging activity of
drying apples was determined according to the
method of Yen etal. [1996]. The DPPH
solution (1 mL) was added to 1 mL of centri-
fuged methanol extracts with 3 mL of ethanol.
The mixture was shaken vigorously and
allowed to stand at room temperature in the
dark for 10 min. The decrease in absorbance
Int.J.Curr.Microbiol.App.Sci (2018) 7(7): 1910-1920
1913
was measured at 517 nm using a Shimadzu
UV-2401 PC spectrophotometer. Ethanol was
used to zero spectrophotometer. All
determinations were performed in triplicate.
The results were corrected for dilution and
expressed in μmol Trolox per 100 g dry
weight (dw).
mg/100gm sample total polyphenols =
Sensory evaluation of apple bar
Organoleptic quality of apple bar determined
with the help of a 10-member consumer panel,
using a 9-point hedonic scale, following
standard procedure. The aspects considered
for apple bar were colour, appearance, taste,
favour, and overall acceptability. The average
scores of all the 10 panelists were computed
for different characteristics.
Results and Discussion
Fitted model and surface plots for colour
and appearance
The results of second-order response surface
model in the form of analysis of variance
(ANOVA) are given in Tables 3, 4 and
5.ANOVA results in table showed that the
linear terms of pectin had significant effect at
P<0.0001 where other process variables had
no significant value and also effect of pectin
on response variables show in Fig. 1(a).A
product’s value is related in part to its good
appearance. Analysis of variance (ANOVA)
was used to test the significance of the product
formulation on the color parameters. The fit of
the model was expressed by R-squared, which
was found to be 0.9150 indicating that 91.50%
of the variability of the response could be
explained by the model.
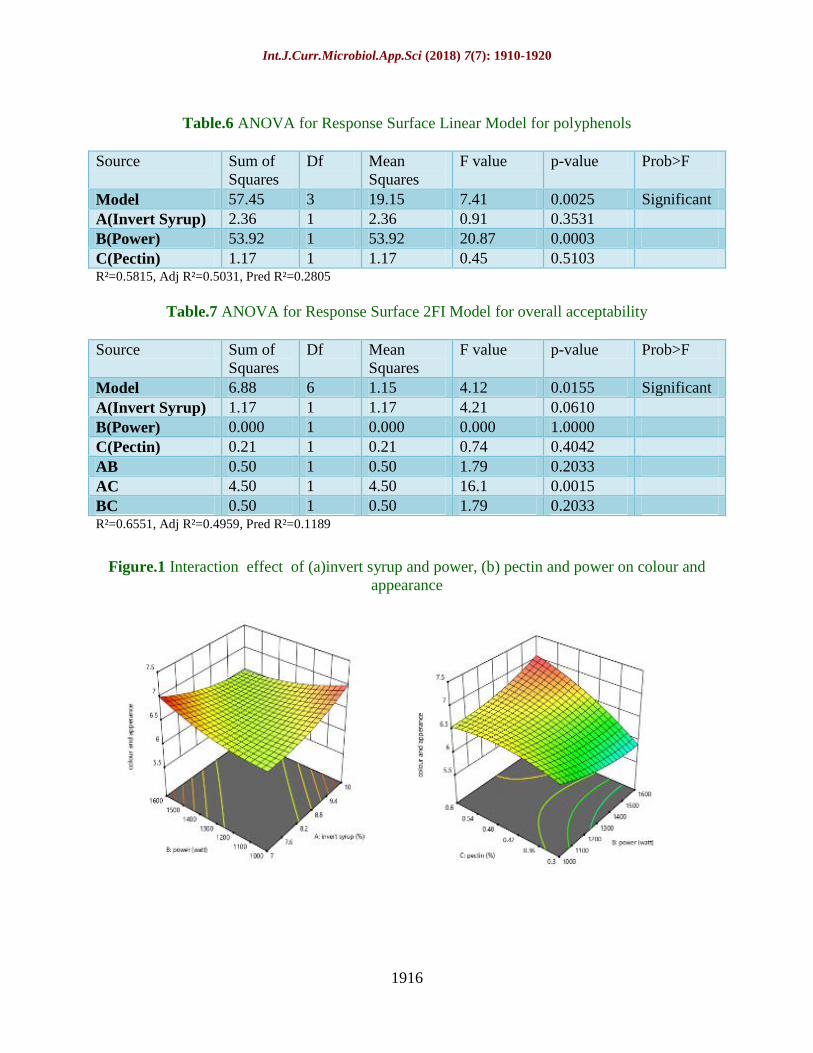
The following graphs (Fig.1) showed
interactions between different process
variables on colour and appearance. Fig. 1(a)
shows that no significant effect of invert syrup
and power on colour and appearance of
product. Fig. 1(b) shows that interaction effect
of power and pectin on colour and appearance.
Pectin shows significant effect on colour and
appearance of product.
Fitted model and surface plots for
mouthfeel and texture
This study analysed the effect of the invert
syrup, pectin and power on the mouthfeel and
texture of the apple fruit bar. The linear and
quadratic model found to be significant as
depicted in (Table 4). In this case B, C, BC are
significant model terms. Pectin and Power has
shown a significant effect on response
variable. The addition of invert syrup and
pectin enhanced the response of mouthfeel and
on the texture attributes in Fig.4 depicted a
significant effect of pectin and invert syrup.
The linear, quadratic and cubic model found to
be significant but quadratic model was used
for ANOVA (Table 4). The values of prob>F
less than 0.0500 indicate model terms are
significant. The fit of the model was expressed
by R-squared, which was found to be 0.7527
indicating that 75.27% of the variability of the
response could be explained by model.
Concentration of polyphenols from graph × 5 × 100/Weight of sample
×1/100 Aliquot taken for estimation
Int.J.Curr.Microbiol.App.Sci (2018) 7(7): 1910-1920
1914
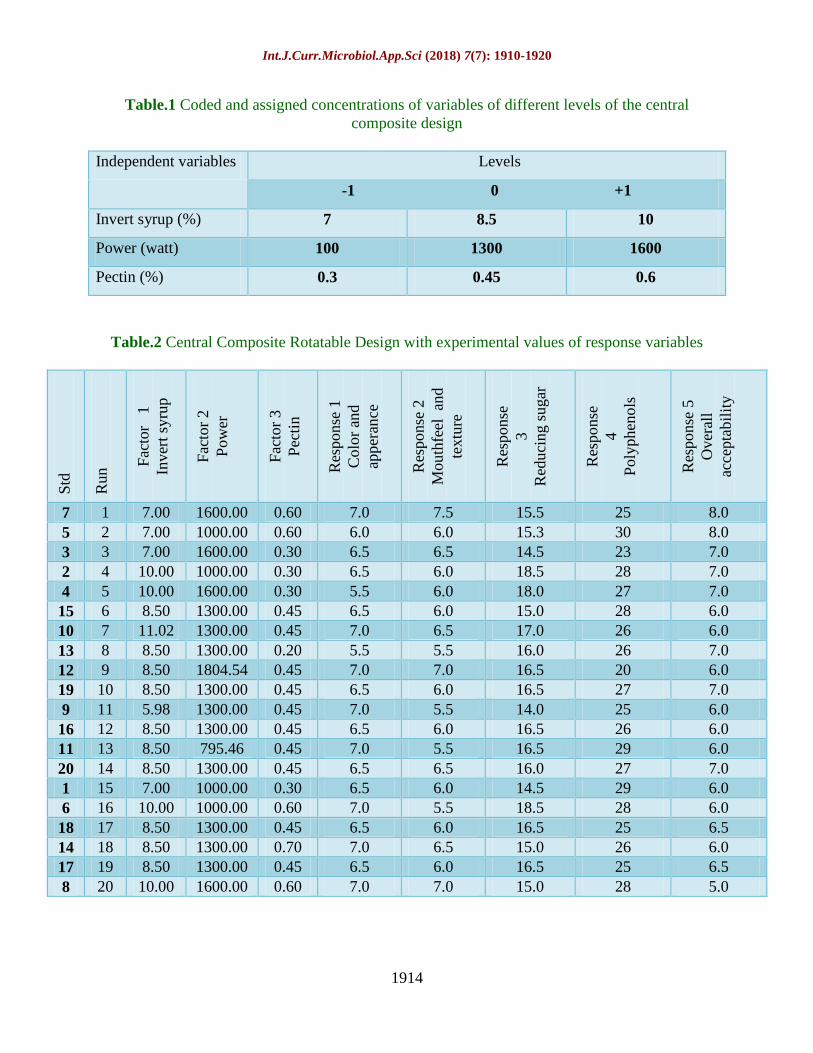
Table.1 Coded and assigned concentrations of variables of different levels of the central
composite design
Independent variables Levels
-1 0 +1
Invert syrup (%) 7 8.5 10
Power (watt) 100 1300 1600
Pectin (%) 0.3 0.45 0.6
Table.2 Central Composite Rotatable Design with experimental values of response variables
Std
Run
Fac
tor
1
Inver
t sy
rup
Fac
tor
2
Pow
er
Fac
tor
3
Pec
tin
Res
ponse
1
Colo
r an
d
apper
ance
Res
ponse
2
Mouth
feel
an
d
textu
re
Res
ponse
3
Red
uci
ng s
ugar
Res
ponse
4
Poly
phen
ols
Res
ponse
5
Over
all
acce
pta
bil
ity
7 1 7.00 1600.00 0.60 7.0 7.5 15.5 25 8.0
5 2 7.00 1000.00 0.60 6.0 6.0 15.3 30 8.0
3 3 7.00 1600.00 0.30 6.5 6.5 14.5 23 7.0
2 4 10.00 1000.00 0.30 6.5 6.0 18.5 28 7.0
4 5 10.00 1600.00 0.30 5.5 6.0 18.0 27 7.0
15 6 8.50 1300.00 0.45 6.5 6.0 15.0 28 6.0
10 7 11.02 1300.00 0.45 7.0 6.5 17.0 26 6.0
13 8 8.50 1300.00 0.20 5.5 5.5 16.0 26 7.0
12 9 8.50 1804.54 0.45 7.0 7.0 16.5 20 6.0
19 10 8.50 1300.00 0.45 6.5 6.0 16.5 27 7.0
9 11 5.98 1300.00 0.45 7.0 5.5 14.0 25 6.0
16 12 8.50 1300.00 0.45 6.5 6.0 16.5 26 6.0
11 13 8.50 795.46 0.45 7.0 5.5 16.5 29 6.0
20 14 8.50 1300.00 0.45 6.5 6.5 16.0 27 7.0
1 15 7.00 1000.00 0.30 6.5 6.0 14.5 29 6.0
6 16 10.00 1000.00 0.60 7.0 5.5 18.5 28 6.0
18 17 8.50 1300.00 0.45 6.5 6.0 16.5 25 6.5
14 18 8.50 1300.00 0.70 7.0 6.5 15.0 26 6.0
17 19 8.50 1300.00 0.45 6.5 6.0 16.5 25 6.5
8 20 10.00 1600.00 0.60 7.0 7.0 15.0 28 5.0
Int.J.Curr.Microbiol.App.Sci (2018) 7(7): 1910-1920
1915
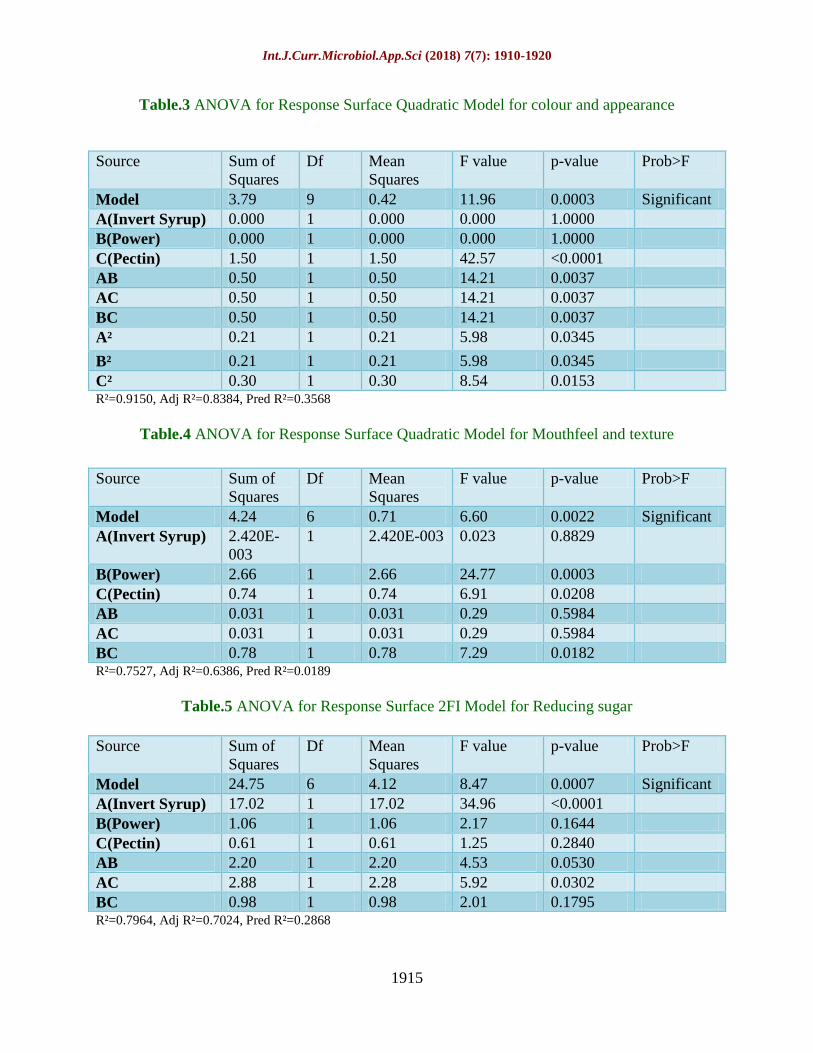
Table.3 ANOVA for Response Surface Quadratic Model for colour and appearance
Source Sum of
Squares
Df Mean
Squares
F value p-value Prob>F
Model 3.79 9 0.42 11.96 0.0003 Significant
A(Invert Syrup) 0.000 1 0.000 0.000 1.0000
B(Power) 0.000 1 0.000 0.000 1.0000
C(Pectin) 1.50 1 1.50 42.57 <0.0001
AB 0.50 1 0.50 14.21 0.0037
AC 0.50 1 0.50 14.21 0.0037
BC 0.50 1 0.50 14.21 0.0037
A² 0.21 1 0.21 5.98 0.0345
B² 0.21 1 0.21 5.98 0.0345
C² 0.30 1 0.30 8.54 0.0153
R²=0.9150, Adj R²=0.8384, Pred R²=0.3568
Table.4 ANOVA for Response Surface Quadratic Model for Mouthfeel and texture
R²=0.7527, Adj R²=0.6386, Pred R²=0.0189
Table.5 ANOVA for Response Surface 2FI Model for Reducing sugar
R²=0.7964, Adj R²=0.7024, Pred R²=0.2868
Source Sum of
Squares
Df Mean
Squares
F value p-value Prob>F
Model 4.24 6 0.71 6.60 0.0022 Significant
A(Invert Syrup) 2.420E-
003
1 2.420E-003 0.023 0.8829
B(Power) 2.66 1 2.66 24.77 0.0003
C(Pectin) 0.74 1 0.74 6.91 0.0208
AB 0.031 1 0.031 0.29 0.5984
AC 0.031 1 0.031 0.29 0.5984
BC 0.78 1 0.78 7.29 0.0182
Source Sum of
Squares
Df Mean
Squares
F value p-value Prob>F
Model 24.75 6 4.12 8.47 0.0007 Significant
A(Invert Syrup) 17.02 1 17.02 34.96 <0.0001
B(Power) 1.06 1 1.06 2.17 0.1644
C(Pectin) 0.61 1 0.61 1.25 0.2840
AB 2.20 1 2.20 4.53 0.0530
AC 2.88 1 2.28 5.92 0.0302
BC 0.98 1 0.98 2.01 0.1795
Int.J.Curr.Microbiol.App.Sci (2018) 7(7): 1910-1920
1916
Table.6 ANOVA for Response Surface Linear Model for polyphenols
Source Sum of
Squares
Df Mean
Squares
F value p-value Prob>F
Model 57.45 3 19.15 7.41 0.0025 Significant
A(Invert Syrup) 2.36 1 2.36 0.91 0.3531
B(Power) 53.92 1 53.92 20.87 0.0003
C(Pectin) 1.17 1 1.17 0.45 0.5103 R²=0.5815, Adj R²=0.5031, Pred R²=0.2805
Table.7 ANOVA for Response Surface 2FI Model for overall acceptability
Source Sum of
Squares
Df Mean
Squares
F value p-value Prob>F
Model 6.88 6 1.15 4.12 0.0155 Significant
A(Invert Syrup) 1.17 1 1.17 4.21 0.0610
B(Power) 0.000 1 0.000 0.000 1.0000
C(Pectin) 0.21 1 0.21 0.74 0.4042
AB 0.50 1 0.50 1.79 0.2033
AC 4.50 1 4.50 16.1 0.0015
BC 0.50 1 0.50 1.79 0.2033 R²=0.6551, Adj R²=0.4959, Pred R²=0.1189
Figure.1 Interaction effect of (a)invert syrup and power, (b) pectin and power on colour and
appearance
Int.J.Curr.Microbiol.App.Sci (2018) 7(7): 1910-1920
1917
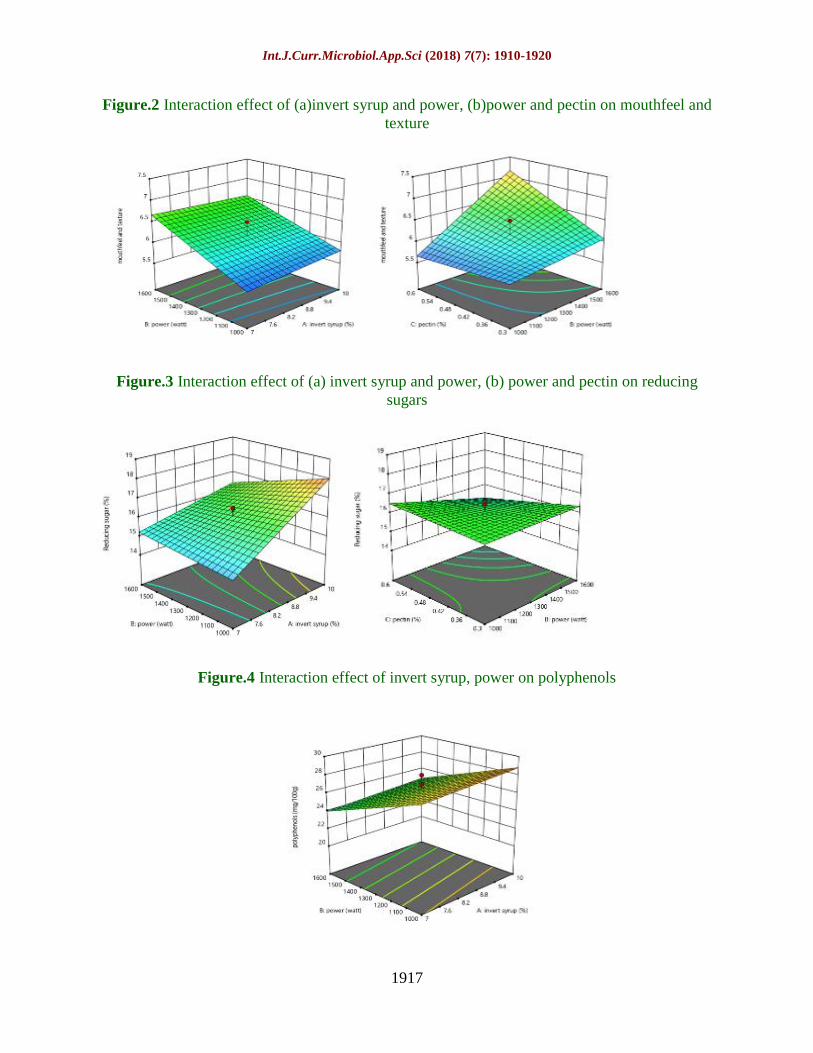
Figure.2 Interaction effect of (a)invert syrup and power, (b)power and pectin on mouthfeel and
texture
Figure.3 Interaction effect of (a) invert syrup and power, (b) power and pectin on reducing
sugars
Figure.4 Interaction effect of invert syrup, power on polyphenols
Int.J.Curr.Microbiol.App.Sci (2018) 7(7): 1910-1920
1918
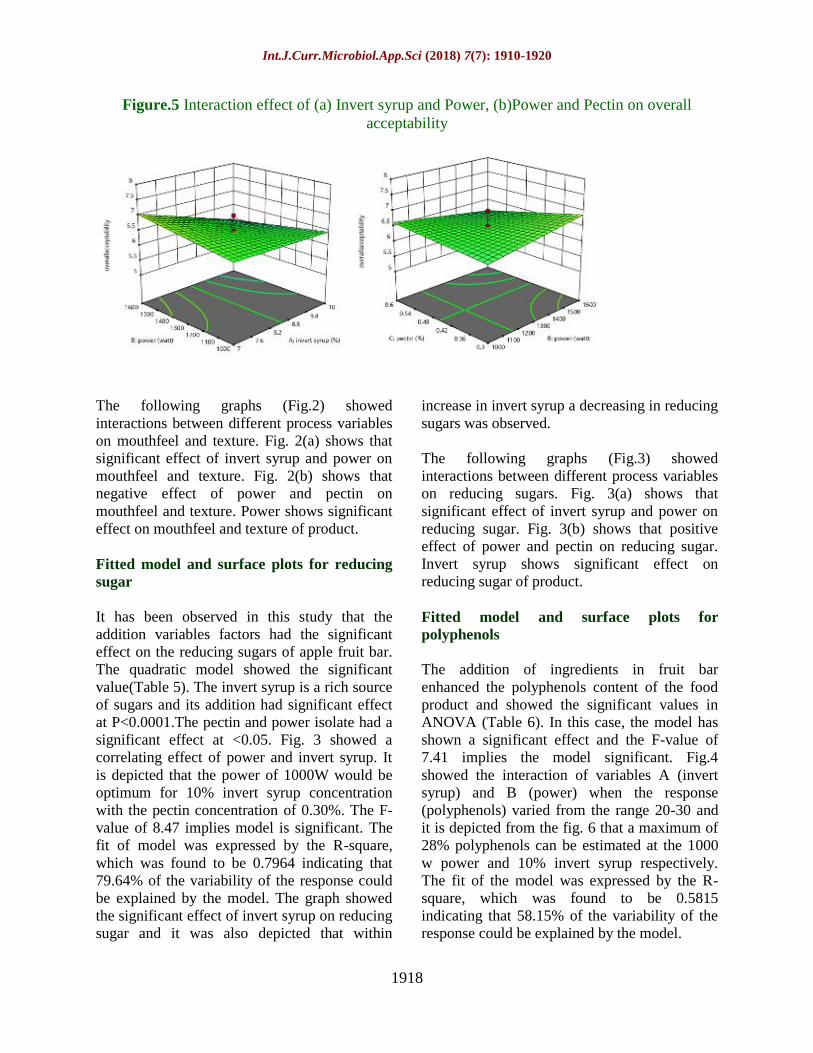
Figure.5 Interaction effect of (a) Invert syrup and Power, (b)Power and Pectin on overall
acceptability
The following graphs (Fig.2) showed
interactions between different process variables
on mouthfeel and texture. Fig. 2(a) shows that
significant effect of invert syrup and power on
mouthfeel and texture. Fig. 2(b) shows that
negative effect of power and pectin on
mouthfeel and texture. Power shows significant
effect on mouthfeel and texture of product.
Fitted model and surface plots for reducing
sugar
It has been observed in this study that the
addition variables factors had the significant
effect on the reducing sugars of apple fruit bar.
The quadratic model showed the significant
value(Table 5). The invert syrup is a rich source
of sugars and its addition had significant effect
at P<0.0001.The pectin and power isolate had a
significant effect at <0.05. Fig. 3 showed a
correlating effect of power and invert syrup. It
is depicted that the power of 1000W would be
optimum for 10% invert syrup concentration
with the pectin concentration of 0.30%. The F-
value of 8.47 implies model is significant. The
fit of model was expressed by the R-square,
which was found to be 0.7964 indicating that
79.64% of the variability of the response could
be explained by the model. The graph showed
the significant effect of invert syrup on reducing
sugar and it was also depicted that within
increase in invert syrup a decreasing in reducing
sugars was observed.
The following graphs (Fig.3) showed
interactions between different process variables
on reducing sugars. Fig. 3(a) shows that
significant effect of invert syrup and power on
reducing sugar. Fig. 3(b) shows that positive
effect of power and pectin on reducing sugar.
Invert syrup shows significant effect on
reducing sugar of product.
Fitted model and surface plots for
polyphenols
The addition of ingredients in fruit bar
enhanced the polyphenols content of the food
product and showed the significant values in
ANOVA (Table 6). In this case, the model has
shown a significant effect and the F-value of
7.41 implies the model significant. Fig.4
showed the interaction of variables A (invert
syrup) and B (power) when the response
(polyphenols) varied from the range 20-30 and
it is depicted from the fig. 6 that a maximum of
28% polyphenols can be estimated at the 1000
w power and 10% invert syrup respectively.
The fit of the model was expressed by the R-
square, which was found to be 0.5815
indicating that 58.15% of the variability of the
response could be explained by the model.
Int.J.Curr.Microbiol.App.Sci (2018) 7(7): 1910-1920
1919
The following graphs (Fig.4) showed
interactions between different process variables
on polyphenols. Fig.4 shows that positive effect
of invert syrup and power on polyphenols.
Power shows significant effect on polyphenols
of product.
Fitted model and surface plots for overall
acceptability
The color, texture and flavour of the products
with different formulations were analysed on
the hedonic scale 0-9.The high amount of invert
syrup and pectin lowered the textural quality of
product as it increased the hardness and product
lost its firmness. A quadratic model was found
to be significant in (Table 7).A quadratic model
was used for ANOVA analysis. The invert
syrup and pectin isolates showed the significant
values. The affect of invert syrup and pectin on
overall acceptability shows in Fig.5. The effect
of invert syrup on overall acceptability
expressed by the R-square, which was found to
be 0.6551 indicating that 65.51% of the
variability of response could be explained by
the model.The model expressed that overall
acceptability increase within concentration of
invert syrup.
The following graphs (Fig.5) showed
interactions between different process variables
on overall acceptability. Fig. 5(a) shows that
significant effect of invert syrup and power on
overall acceptability. Fig. 5(b) shows that
negative effect of power and pectin on overall
acceptability. Invert syrup and pectin shows
significant effect on overall acceptability.
References
Ade-Omowaye, B.I.O., Rastogi, N. K.,
Angersbach, A. and Knorr, D., 2002.
Osmotic dehydration behavior of red
paprika (Capsicum annuum L.). Journal
of Food Science, 67:1790–1796.
Alonso-Salces D, Barranco A, (2004).
Polyphenolic Profiles of Basque Cider
Apple Cultivars and Their
Technological Properties. Journal of
Agricultural and Food Chemistry
52(10): 2938-2952.
Bandaru VVR, Somalanka SR, Mendu D R,
Madicheria N R and Chityala A (2006)
Optimization of fermentation conditions
for the production of ethanol from sago
starch by co- immobilized
amyloglucosidase and cells of
Zymomonas mobilis using response
surface methodology. Enzyme Microbial
Technol 38: 209-14.
Budi, S, Ahmad Suaeman, David W. Giraud,
and Judy A. Driskell. 2001. Carotenoid
content of selected Indonesian fruits.
Journal of Food Composition and
Analysis. 14: 169-176.
BeveridgeT, Franz KY, Harrison JE, (1986).
Clarified natural apple juice: production
and storage stability of juice and
concentrate. Journal of Food Science
51: 411-414.
Cherian, B and Cheriayan, S. 2003.
Acceptability study on blended papaya
leather. Journal Food Science and
Technology. 40(3): 293-295.
Downing D, (1989). Processed apple products.
New York Van Nostrad Reinhold
Eberhardt MV, Lee CY, Liu RH, (2000).
Antioxidant activity of fresh apples.
Nature 405(6789): 903- 904.
Gowda DIN, Dan A and Ramanjaneya KH.
1995. Studies on mango fruit bar
preparation. Indian Food Packer. 49
(2): 17-24.
Garcia-Alonso M, Pascual-Teresa S, Santos-
Buelga C and Rivas-Gonzalo JC.
2004.Gujral,
H. S., & Khanna, G. (2002). Effect of skim milk
powder, soy protein concentrate and
sucrose on the dehydration behaviour,
texture, color and acceptability of
mango leather. Journal of Food
Engineering, 55(4), 343-348.
Harsimrat, K. and Dhawan, S. S. 1998.
Preparation of guava fruit bar. Poster
abstrct. IFCON O-04: 533.
Larmand, E. 1977.Lab. Method of sensory
evaluation of food. Pub. Canada, Deptt.
Agric. Ottawa. Seymour G. B. & Knox
Int.J.Curr.Microbiol.App.Sci (2018) 7(7): 1910-1920
1920
J. P. 2002.
Lee KW, Kim YJ, Lee HJ, Lee CY, (2003).
Major Phenolics in Apple and Their
Contribution to the Total Antioxidant
Capacity. Journal of Agricultural and
Food Chemistry 51(22): 6516-6520.
Lee, W.C., Yusof, S., Hamid N.S.A. and
Baharin, B.S., 2006. Optimizing
conditions for enzymatic, Clarification
of banana juice using response surface
methodology (RSM). Journal of Food
Engineering, 73: 55-63.
Lane, J.H. and Eynon, L. 1923. Determination
of reducing sugars by means of
Fehling’s solution with methylene blue
as internal indicator. J. Soc. Chem. Ind.
Trans. 42:32-36.
Mahony MO. 1985. Sensory evaluation of food:
statistical methods and procedures.
Marcel Dekker.New York. 168-169.
Moyls, A. L. 1981. Drying of apple purees.
Journal of Food Science, 46(3): 939-
942.
Marcus-Karel DBL, (2003). Physical Principles
of Food Preservation. New York CRC
Press
Mudahar, G.S., Toledo, R.T., Floros, J.D. and
Jen, J. J., 1989. Optimization of carrot
dehydration process using response
surface methodology. Journal of Food
Science, 54:714- 719.
Namiki, M. (1988). Chemistry of Maillard
reactions: recent studies on the
browning reaction mechanism and the
development of antioxidants and
mutagens. Advances in Food Research.
32:115–143.
National Horticulture Board DataBase. 2012-
13. http://www.nhb.gov.in.
Oszmianski, J., Wolniak, M., Wojdylo, A., &
Wawer, I. (2008). Influence of apple
purée preparation and storage on
polyphenol contents and antioxidant
activity.Food Chemistry, 107(4), 1473-
1484.
Oszmianski J, Wolniak M, Wojdyło A, Wawer
I, (2007). Comparative study of
polyphenolic content and antiradical
activity of cloudy and clear apple juices.
Journal of the Science of Food and
Agriculture 87(4): 573-579.
Pectins and their manipulation. Blackwell
publishing, Boca Raton, Florida, Eds.;
Blackwell Publishing Professional:
Ames, IA, USA, 2008; pp. 237–272
Padmashree, A, Gopal kumar Sharma, Srihari,
K.A, and Amarinder Singh Bawa. 2012.
Development of shelf stable protein rich
composite cereal bar. Food Sci. Tecnol.
49(3): 335-341.
Sanoner P, Guyot S, Marnet N, (1999). Yağcı S,
Göğüş F, (2008). Response surface
methodology for evaluation of physical
and functional properties of extruded
snack foods developed from food-by-
products. Journal of Food Engineering
86(1): 122-132. Journal of Agricultural
and Food Chemistry 47(12): 4847-48
Visser J. and Voragen A. 1995. Pectins and
Pectinases. Elsevier Science B.V.,
Amsterdan, Holand.
Wanasundara and Shahidi, F., 1996.
Optimization of hexa metaphosphate-
Assisted Extraction of Flaxseed Proteins
Using Response Surface Methodology.
Journal of Food Science, 61
(3):604�607.
Wu, J., Gao, H., Zhao, L., Liao, X., Chen, F.,
&Wang, Z. (2007). Chemical
compostion characterization of some
apple cultivars. Food Chemistry, 103(1),
88-93.
How to cite this article:
Manpreet Kaur, Naveet Kaushal, Ajay Singh and Namneet Kaur. 2018. Optimization of Blending
Apple (Malus × domestica) Bars using Response Surface Methodology.
Int.J.Curr.Microbiol.App.Sci. 7(07): 1910-1920. doi: https://doi.org/10.20546/ijcmas.2018.707.226
Related Documents