University of South Florida Scholar Commons Graduate eses and Dissertations Graduate School January 2012 Optimization of Bio-Impedance Sensor for Enhanced Detection and Characterization of Adherent Cells Dorielle T. Price University of South Florida, [email protected] Follow this and additional works at: hp://scholarcommons.usf.edu/etd Part of the American Studies Commons , Biomedical Engineering and Bioengineering Commons , and the Electrical and Computer Engineering Commons is Dissertation is brought to you for free and open access by the Graduate School at Scholar Commons. It has been accepted for inclusion in Graduate eses and Dissertations by an authorized administrator of Scholar Commons. For more information, please contact [email protected]. Scholar Commons Citation Price, Dorielle T., "Optimization of Bio-Impedance Sensor for Enhanced Detection and Characterization of Adherent Cells" (2012). Graduate eses and Dissertations. hp://scholarcommons.usf.edu/etd/4208

Welcome message from author
This document is posted to help you gain knowledge. Please leave a comment to let me know what you think about it! Share it to your friends and learn new things together.
Transcript
University of South FloridaScholar Commons
Graduate Theses and Dissertations Graduate School
January 2012
Optimization of Bio-Impedance Sensor forEnhanced Detection and Characterization ofAdherent CellsDorielle T. PriceUniversity of South Florida, [email protected]
Follow this and additional works at: http://scholarcommons.usf.edu/etd
Part of the American Studies Commons, Biomedical Engineering and Bioengineering Commons,and the Electrical and Computer Engineering Commons
This Dissertation is brought to you for free and open access by the Graduate School at Scholar Commons. It has been accepted for inclusion inGraduate Theses and Dissertations by an authorized administrator of Scholar Commons. For more information, please [email protected].
Scholar Commons CitationPrice, Dorielle T., "Optimization of Bio-Impedance Sensor for Enhanced Detection and Characterization of Adherent Cells" (2012).Graduate Theses and Dissertations.http://scholarcommons.usf.edu/etd/4208
Optimization of Bio-Impedance Sensor for Enhanced Detection and
Characterization of Adherent Cells
by
Dorielle T. Price
A dissertation submitted in partial fulfillment of the requirements for the degree of
Doctor of Philosophy Department of Electrical Engineering
College of Engineering University of South Florida
Co-Major Professor: Shekhar Bhansali, Ph.D. Co-Major Professor: Andrew Hoff, Ph.D.
Mark Jaroszeski, Ph.D. Meera Nanjundan, Ph.D. Stephen Saddow, Ph.D.
Shivshankar Sundaram, Ph.D.
Date of Approval: November 22, 2011
Keywords: spectroscopy, ECIS, microelectrode, cancer cells, microfluidics
Copyright © 2012, Dorielle T. Price

Acknowledgements I would like to thank all the individuals, families, organizations, and fellowship
programs that have supported me through this process. I was financially supported by
the Ford Foundation (Predoctoral) Fellowship Program, NSF Graduate Research
Program, McKnight Doctoral Fellowship (Florida Education Fund), and NSF’s Bridge to
the Doctorate Program. Thank you to my church family at First Baptist Church of College
Hill for encouraging me and providing me with moral and spiritual support (along with
great Sunday dinners and babysitting). To the BD family, thank you for your endless
support, listening ears, and stress-relieving events. I obtained academic guidance and
support from my advisor Dr. Shekhar Bhansali. I would like to thank him for bringing me
on as a researcher in his group, developing me into a well-rounded student/researcher,
and teaching me to always look at the “big picture”. Thanks to Bernard Batson for all of
his help in proposal writing, resume and professional development, and financial aid.
Thank you to all of my committee members for their support and for taking the time to
serve on my committee. And I would like to thank Dr. Frances Ligler for allowing me to
join her research team for a semester at the Naval Research Lab.
Thank you to my husband, Tony Price, for his love, support, encouragement, and
hard work through this entire process. To my sons, Tre and DJ, thank you for inspiring
me to develop a work-family-life balance, and for pushing me to finish up the doctoral
process. Last but not least, I would like to thank my late grandma (Beulah), parents
(James and Dorothy), sister (Jamelah), and family for encouraging me and instilling in
me the importance of education and a solid work ethic.

i
Table of Contents
List of Tables .................................................................................................................... iv
List of Figures .................................................................................................................... v
Abstract ........................................................................................................................... viii
Chapter 1 Introduction ...................................................................................................... 1 1.1 Motivation .................................................................................................. 1 1.2 Problem Definition ..................................................................................... 2 1.3 Research Objectives .................................................................................. 3 1.4 Dissertation Structure ................................................................................ 3
Chapter 2 Background ..................................................................................................... 5 2.1 Electromagnetic Techniques ..................................................................... 5 2.2 Cell Characterization Techniques .............................................................. 7 2.3 Impedimetric Measurement Theory ........................................................... 9
2.3.1 Visualization and Equivalent Circuit Analysis .............................. 10 2.3.2 Constant-Phase Element (CPE) .................................................. 12 2.3.3 Complex Non-Linear Least Squares Fitting (CNLS) .................... 13 2.3.4 Biological Dispersions .................................................................. 17 2.3.5 Two- vs. Four-Electrode Impedance Measurements ................... 18
Chapter 3 State-of-the-Art and Applications of Impedance Spectroscopy ..................... 20 3.1 Impedance Detection of Normal and Abnormal Cells .............................. 20 3.2 State-of-the-Art: Adherent Cell Characterization ..................................... 22
3.2.1 Electric Cell-Substrate Impedance Sensing (ECIS) ..................... 23 3.2.2 Applications of ECIS in Literature ................................................ 25 3.2.3 xCELLigence ................................................................................ 28 3.2.4 Electrode Optimization ................................................................. 30
Chapter 4 Electrode Optimization for High-Frequency Impedance Measurements ....... 32 4.1 Introduction .............................................................................................. 32 4.2 Fabrication ............................................................................................... 33 4.3 Theory ..................................................................................................... 36 4.4 Effect of Increasing the Passivation Coating Thickness .......................... 37 4.5 Effect of Decreasing the Coating Area .................................................... 39 4.6 Design Rule ............................................................................................. 40 4.7 Design Rule Applied to ECIS Commercial Devices ................................. 41

ii
Chapter 5 Comparison of Measurement Sensitivity Between 2- and 4-Electrode Configurations ............................................................................................... 43
5.1 Introduction .............................................................................................. 43 5.2 Theory ..................................................................................................... 44
5.2.1 Interfacial Impedance ................................................................... 46 5.2.2 Bulk Impedance ........................................................................... 48
5.3 Methods and Fabrication ......................................................................... 50 5.3.1 Electrode Fabrication ................................................................... 50 5.3.2 Microchannel ................................................................................ 51 5.3.3 Immobilization Chemistry ............................................................. 52 5.3.4 E. coli Assay Preparation ............................................................. 53 5.3.5 Flow Simulations .......................................................................... 53 5.3.6 Confocal Microscopy .................................................................... 54 5.3.7 Electrical Impedance Measurements ........................................... 55
5.4 Results and Discussion ........................................................................... 56 5.4.1 COMSOL Simulations and Confocal Microscopy ........................ 56 5.4.2 Baseline and E. coli Measurements ............................................. 58
5.5 Conclusions ............................................................................................. 64
Chapter 6 Multi-Device, Multi-Electrode Bio-Impedance System ................................... 65 6.1 Introduction .............................................................................................. 65 6.2 Methods and Materials ............................................................................ 67
6.2.1 Cell Culture .................................................................................. 67 6.2.2 Fabrication of 8-Electrode Arrays ................................................ 68 6.2.3 Switch Circuit ............................................................................... 69 6.2.4 Impedance Measurements .......................................................... 70
6.3 Impedance Theory ................................................................................... 70 6.4 Results and Discussion ........................................................................... 72
6.4.1 Baseline Impedance Measurements ............................................ 72 6.4.2 Impedance Measurements of Ovarian Cancer Cells ................... 73 6.4.3 Modeling of Impedance Data ....................................................... 76
6.5 Conclusion ............................................................................................... 81
Chapter 7 Electrical Comparison of Healthy and Cancer Ovarian Cells ........................ 83 7.1 Introduction .............................................................................................. 83 7.2 Methods and Materials ............................................................................ 85
7.2.1 Cell Culture .................................................................................. 85 7.2.2 Impedance Measurements .......................................................... 85
7.3 Results and Discussion ........................................................................... 87 7.3.1 Experiment 1: No Culture Medium Change ................................. 87 7.3.2 Experiment 2: Culture Medium Change ....................................... 90 7.3.3 Experiment 3: Increased Cell Confluence .................................... 92 7.3.4 Comparison of T80 and HEY Cell Impedance Signatures ........... 97
7.4 Conclusion ............................................................................................... 99
Chapter 8 Conclusions and Future Work ..................................................................... 100
List of References ......................................................................................................... 103

iii
Appendices ................................................................................................................... 112 Appendix A: Copyright Permissions .................................................................. 113
About the Author ................................................................................................. End Page

iv
List of Tables Table 2-1: Comparison of weighting types on data sets. ................................................ 16
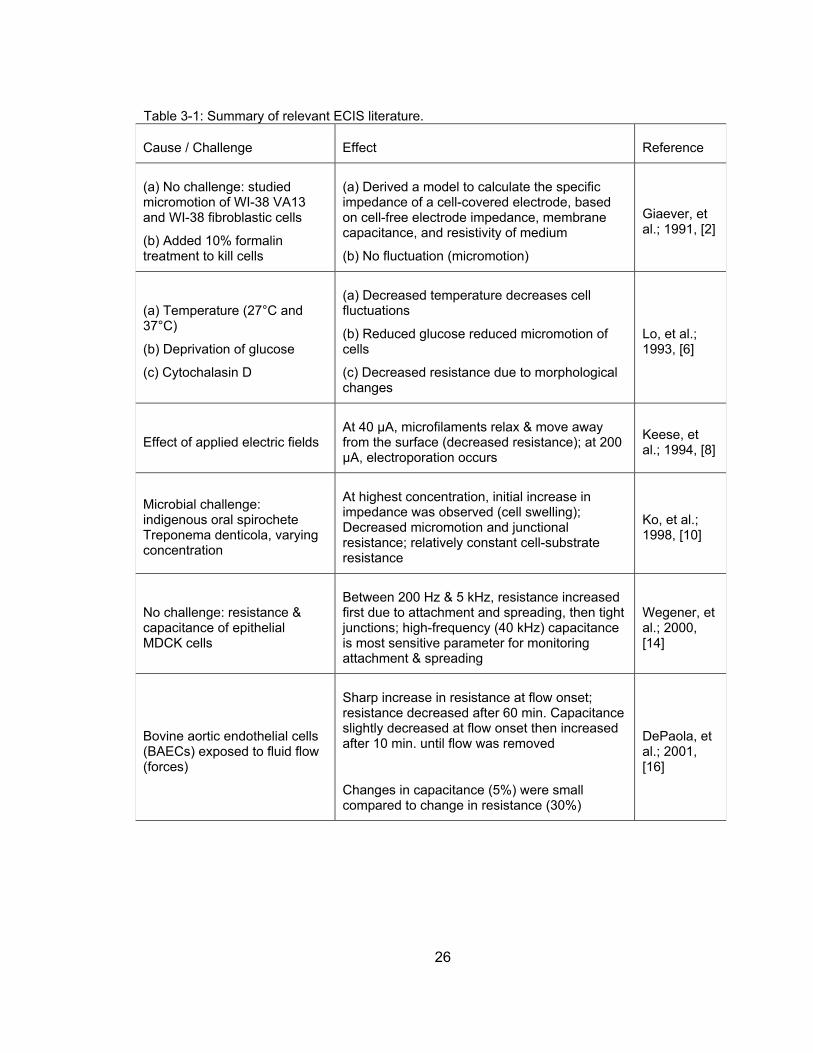
Table 3-1: Summary of relevant ECIS literature. ............................................................ 26
Table 4-1: Ratio of coating area to coating thickness of 500µm and 30µm trace-width devices of varying sensor diameters. ................................................... 41
Table 5-1: Baseline and E. coli resistance and capacitance values for the 2-electrode configuration sensor ...................................................................... 59
Table 5-2: Baseline and E. coli resistance and capacitance values for the 4-electrode configuration sensor ...................................................................... 59
Table 6-1: Extracted system parameters (solution resistance, Rs; double layer capacitance, Cdl; cell resistance, Rcell; cell capacitance, Ccell; and sum squared error, SSE) 12 hours after the introduction of 0, 10, 25, 50µM of As2O3 (averages and standard deviations). ..................................... 78
Table 7-1: Significant time points from Experiments 1, 2, and 3 for the T80 and HEY cells ....................................................................................................... 95
Table 7-2: Impedances and capacitances of the T80 and HEY cells after 20 hours of monitoring, for the three experiments ........................................................ 98

v
List of Figures Figure 2-1: Frequency spectrum of electromagnetic medical imaging techniques ........... 6
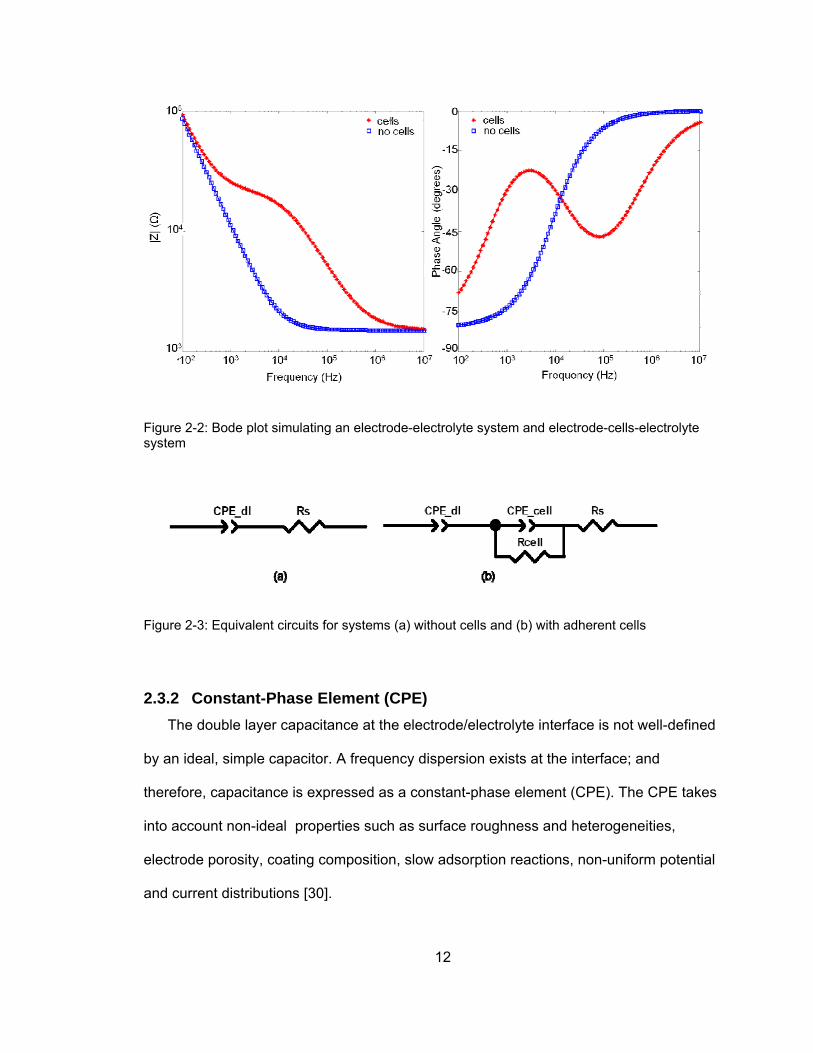
Figure 2-2: Bode plot simulating an electrode-electrolyte system and electrode-cells-electrolyte system ................................................................................. 12
Figure 2-3: Equivalent circuits for systems (a) without cells and (b) with adherent cells ............................................................................................................... 12
Figure 2-4: Frequency dependence of the relative permittivity and specific conductivity of complex biological tissue ....................................................... 18
Figure 3-1: Schematic of current flow in tissue culture medium with and without cells present on electrode .............................................................................. 21
Figure 3-2: Photograph of commercial ECIS device ....................................................... 24
Figure 3-3: Applied Biophysic's ECIS device 8W2x1E .................................................... 25
Figure 3-4: Photograph of xCELLigence system and enlarged image of microelectrode, circle-in-line design .............................................................. 29
Figure 4-1: Fabrication process for microelectrode devices. ........................................... 33
Figure 4-2: Schematic of electroplating setup ................................................................. 35
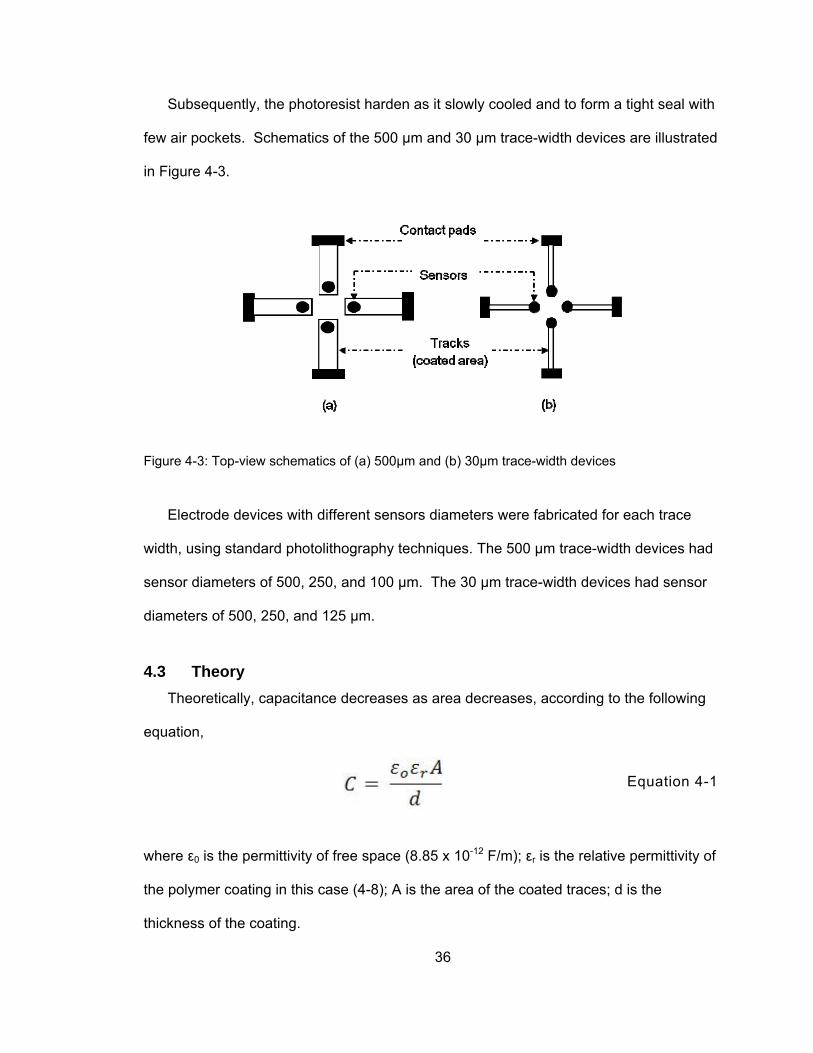
Figure 4-3: Top-view schematics of (a) 500µm and (b) 30µm trace-width devices ......... 36
Figure 4-4: Bode plot of 500 µm trace-width devices, of varying sensor diameters, with 2 µm-thick resist and 20 µm-thick resist. .. ............................................. 38
Figure 4-5: Bode plot of 30 µm trace-width devices with 2 µm-thick coating of varying sensor diameters... ........................................................................... 40
Figure 5-1: Equivalent circuit of electrode-electrolyte (medium) system; where Rb and Cb are the bulk resistance and capacitance of the conductive medium and Cdl represents the double layer capacitance at the sensing electrodes. ........................................................................................ 45
Figure 5-2: Modified equivalent circuits for 4- and 2-electrode measurement configurations. ............................................................................................... 45
Figure 5-3: A point-electrode model for the tetrapolar configuration where the current is injected in the outer two electrodes and voltage is sensed from the inner two.. ........................................................................................ 49

vi
Figure 5-4: (a) A top-view schematic of the gold electrodes and microfluidic channel, along with their corresponding dimensions. .................................... 52
Figure 5-5: COMSOL simulations (top) and the corresponding cross-section images from confocal microscopy (bottom) with sheath-to-sample flow-rates of 50:2 and 200:2 (in µL/min).. .............................................................. 57
Figure 5-6: (a) Confocal images for sheath-to-sample flow rates (in μL/min) of 50:1, 100:2 and 200:4 (FRR = 50) are shown.. ............................................. 62
Figure 5-7: Sample and sheath flow rates were increased while keeping the FRRs constant (-- -- = FRR of 50, —♦— = FRR of 25).. ....................................... 63
Figure 6-1: Photographs of (a) fabricated electrode device with attached cloning cylinder and (b) power board and switching circuit before being enclosed in aluminum box. ............................................................................ 69
Figure 6-2: Equivalent circuit used to model (a) cell-free or non-adherent cell data; (b) adherent cell data.. ................................................................................... 72
Figure 6-3: Bode plot (magnitude impedance and phase vs. frequency) of baseline measurements using potassium chloride (KCl), showing minimal variation between the eight electrodes of a single device. ............................ 73
Figure 6-4: Averaged |Z| vs. time at 16.69 kHz of HEY cells introduced to 0, 10, 25, and 50 µM As2O3.. ......................................................................................... 75
Figure 6-5: Microscopic images of cells 24 hours after the introduction of (a) 0, (b) 10, (c) 25, (d) 50µM of As2O3.. ...................................................................... 76
Figure 6-6: Bode plot of measured and fitted data 12 hours after the introduction of 10µM of As2O3 for a single electrode (Electrode #2).. ................................... 77
Figure 6-7: (a) Extracted cell resistance and (b) cell capacitance 12 hours after the introduction of 0, 10, 25, 50µM of As2O3 for each independent electrode within the four wells.. ..................................................................................... 80
Figure 7-1: Photograph of ECIS 8W1E device (Applied Biophysics) .............................. 86
Figure 7-2: Experiment 1- Impedance vs. time plots of (A) T80 and (B) HEY cells, where As2O3 was added to existing medium 8 hours after seeding cells.. ............................................................................................................. 89
Figure 7-3: Experiment 2- Impedance vs. time plots of (A) T80 and (B) HEY cells from Experiment 2, where As2O3 was added through a medium change 8 hours after seeding cells.. ........................................................................... 91
Figure 7-4: Experiment 3- Impedance vs. time plots of (A) T80 and (B) HEY cells from Experiment 3, where As2O3 was added through a medium change 24 hours after seeding cells. .......................................................................... 93

vii
Figure 7-5: Microscopic images of HEY cells 24 hours after the addition of 0, 10, 25, and 50µM of As2O3. . ............................................................................... 94
Figure 7-6: Microscopic images of HEY cells 0, 1, 1.5, and 2 hours after the introduction of 25 µM As2O3. ......................................................................... 96
Figure 7-7: Comparison of the impedances of T80 and HEY ovarian cells from Experiment 1, 0 µM As2O3.. .......................................................................... 97

viii
Abstract This research focuses on the detection and characterization of cells using
impedance-based techniques to understand the behavior and response of cells to
internal/environmental changes. In combination with impedimetric sensing techniques,
the biosensors in this work allow rapid, label-free, quantitative measurements and are
very sensitive to changes in environment and cell morphology. The biosensor design
and measurement setup is optimized to detect and differentiate cancer cells and healthy
(normal) cells. The outcome of this work will provide a foundation for enhanced 3-
dimensional tumor analysis and characterization; thus creating an avenue for earlier
cancer detection and reduced healthcare costs.
The magnitude of cancer-related deaths is a result of late-diagnosis and the fact that
cancer is challenging to treat, due to the non-uniform nature of the tumor. In order to
characterize and treat individual cells based on their malignant potential, it is important
to have a measurement technique with enhanced spatial resolution and increased
sensitivity. This requires the study of individual or small groups of cells that make up the
entire tissue mass.
The overall objective of this research is to optimize a microelectrode biosensor and
obtain statistically relevant data from a cell culture using an independent multi-electrode
design. This would provide a means to explore the feasibility of electrically characterizing
cells with greater accuracy and enhanced sensitivity.

1
Chapter 1 Introduction
This research focuses on the detection and characterization of cells using
impedance-based techniques to understand the behavior and response of cells to
internal/environmental changes. The biosensors in this work, unlike the patch clamp
technique, use whole cells in culture as the primary transducer to detect a change in
environment or physiological conditions. In combination with impedimetric sensing
techniques, they allow rapid, label-free, quantitative measurements and are very
sensitive to changes in environment and cell morphology. This research optimizes the
biosensor design and measurement setup in order to detect and differentiate cancer
cells and healthy (normal) cells. The outcome of this work provides a foundation for
enhanced 3-dimensional tumor analysis and characterization; thus creating an avenue
for earlier cancer detection and reduced healthcare costs.
1.1 Motivation Cancer diagnosis and treatment in healthcare is a major area of concern in the
United States today. Billions of dollars are being spent annually on medical research in
order to develop devices and strategies to prevent, detect, and/or cure cancer and other
illnesses. Annually, nearly 1 in 4 deaths are due to cancer [18, 19]. The four most
common cancers include breast (women), prostate (men), lung and bronchus (men and
women), and colon and rectum (men and women). The magnitude of cancer-related
deaths is a result of late-diagnosis and the fact that cancer is challenging to treat, due to
the non-uniform nature of the tumor. All cancer cells do not have equal malignant or
invasive potential and thus need to be uniquely treated [20]. In order to characterize and

2
treat individual cells based on their malignant potential, it is important to have a
measurement technique with enhanced spatial resolution and increased sensitivity. This
requires the study of individual or small groups of cells that make up the entire tissue
mass. This research investigates methods to enhance cancer cell detection and provide
fundamental information about cancer cell characteristics, through the design and
optimization of a whole-cell biosensor and impedance-based measurement techniques.
This research has the potential to advance drug discovery and ultimately lead to
implementation of personalized healthcare.
1.2 Problem Definition Successful development of the impedance biosensor will provide a means to
electrically differentiate normal and cancer cells and quantify toxicology studies.
Chemotherapeutic drugs, for instance, require extensive characterization and validation
before they can be used clinically. This can be a cumbersome task, as many variables
are present when determining the effectiveness of a drug, including concentration, time,
cell line, and microenvironment. Qualitative methods, such as the use of biomarkers,
light microscopy, staining, scanning electron microscopy (SEM), western analysis, are
typically used to identify and validate chemotherapeutic drugs. However, such methods
are time consuming and labor intensive.
Impedance spectroscopy, as a quantitative measure, can be used as a prerequisite
tool to refine or design qualitative experiments by pinpointing specific time frames and
drug concentrations; thus removing much of the guess-work and excess experimental
trials. Long-term, continuous impedance measurements can capture the reactions of the
cells to a stimulant at numerous time points. Thus, when a reaction is observed,
qualitative measurements can be performed at that specific time point(s) to probe for

3
further information. Impedance measurements can also aid in obtaining fundamental
information about cellular responses and behaviors.
Repeatability, accuracy, spatial resolution, and high signal-to-noise ratios are
required to successfully implement bioimpedance measurements for cell differentiation
and toxicology studies. Therefore, this work aims to address these problems through
electrode design optimization, designing multi-electrode devices, and automating data
collection and analysis for large data sets.
1.3 Research Objectives The objective of this research is to optimize a microelectrode biosensor and obtain
statistically relevant data from a cell culture using an independent multi-electrode design.
This would provide a means to explore the feasibility of electrically characterizing cells
with greater accuracy and enhanced sensitivity. The specific objectives include:
a) Investigate the effect of electrode geometry on bioimpedance measurements
b) Explore methods to reduce measurement parasitic and enhance spatial
resolution
c) Characterize and differentiate normal and abnormal cells
1.4 Dissertation Structure Chapter 2 of the dissertation provides background information cancer,
electromagnetic techniques, cell characterization techniques, impedance spectroscopy
theory and modeling, and biological dispersion.

4
Chapter 3 describes the state-of-the-art and applications of impedance
spectroscopy, including a comparison of this work’s optimized electrode devices to
existing commercial impedance systems.
Chapter 4 details the optimization of a microelectrode sensor design to eliminate the
parasitic effects of the passivation coating. A design rule was derived to apply to future
microelectrode designs.
Chapter 5 explores the use of the 4-electrode measurement setup to compare
measurement sensitivity between the 2- and 4-electrode configurations in a microfluidic
system.
Chapter 6 describes the optimized 8-electrode device and measurements performed
on ovarian cancer cells.
In chapter 7, the commercial ECIS instrument was used to compare healthy and
cancer ovarian cells, and validate measurements using the 8-electrode device.

5
Chapter 2 Background
The word cancer has been used by some researchers to describe both benign and
malignant tumors; others have reserved the word specifically for malignant tumors [21].
In this research, the term ‘cancer’ will refer to malignant tumors and the term ‘abnormal’
will generally refer to both benign and malignant tumors. A tumor is defined as a mass of
cells. Benign tumors do not invade local tissues and are generally harmless. Malignant
tumors invade adjacent tissues and can spread throughout the body, causing
deterioration or death. In general, tumor masses are less organized and structured than
normal tissues. There are various degrees of abnormality of cells within tumors. Slightly
abnormal tumors can contain only an excessive amount of cells, whereas in more
abnormal tumors, the cells take on an irregular appearance. These cytological changes
may include variability in the nuclear size, increased mitotic activity, and lack of
cytoplasmic features [21]. Morphological changes in cells can be detected through
impedance measurements, as changes in the structural features alter or restrict the path
of the applied electrical signal. These structural changes in individual cells have a major
impact on the tumor mass as a whole. In order to understand the functionality of a more
complex tumor mass, small groups of cells will first be studied and characterized
separately in this research.
2.1 Electromagnetic Techniques The biosensor used in this work is a form of electromagnetic sensor. Medical
imaging using electromagnetic waves, including X-rays and magnetic resonance
imaging (MRI), has been traditionally used for many decades to detect abnormalities in

6
tissues. The first medical use of X-rays occurred in 1896 [22] and over a century later, X-
ray mammography is currently the standard screening technique for breast cancer.
These techniques are well-established and are conducted across a wide frequency
range. MRIs are performed between a few to hundreds of megahertz and X-rays are
performed within 1016 and 1019 Hz. Electrical impedance tomography (EIT) and
microwave imaging (MI) are newer technologies that are still in their trial stages. Figure
2-1 shows some of the most common electromagnetic medical imaging techniques and
the frequency ranges in which they operate. This research expands on the existing
technologies by increasing the traditionally used frequency spectrum and determining if
additional information can be obtained to complement the existing techniques.
X-ray, MRI, EIT, and MI are all techniques used to image bone density, soft tissues,
and/or organs. This research, however, begins with the study and characterization of
cells, the foundation of these more complex structures.
Impedance spectroscopy is not the only known method of characterizing cells in
culture. There are many existing methods that are used to study and characterize cell
cultures, including but not limited to the use of electrochemistry/biomarkers, microscopy
and fluorescence.
Figure 2-1: Frequency spectrum of electromagnetic medical imaging techniques
100Hz
1kHz
10kHz
100kHz
1MHz
10MHz
100MHz
1GHz
10GHz
100GHz
MI
EITMRI
X-ray
Proposed Research
f (Hz)102 104 106 108 1010 1012 1014 1016 1018 1020

7
2.2 Cell Characterization Techniques Conventional methods used in cancer cell biology include fluorescent imaging and
radioactive detection; however, these techniques are costly, labor-intensive, and unable
to provide continuous monitoring [23]. Optical microscopy is also standard practice used
by pathologists or clinicians trained to identify suspicious regions or morphologies.
Although reliable, this technique is qualitative and highly dependent on the expertise and
experience of the clinician. In addition, such human resources are not always readily
available, especially in areas with limited healthcare resources. Although these
techniques are well-studied and widely used, they do not fit the criteria of being cost
efficient, automated, and objective, as does the proposed sensor.
Biomarkers are indicators of normal biological processes, pathogenic processes, or
pharmacologic responses; and they can be used for classification and staging of
diseases, monitoring of clinical responses, and as diagnostic tools [24]. Biomarkers are
typically associated with proteomics and genomics, the large-scale study of proteins and
DNA/RNA respectively. Despite their great potential, only a few biomarkers are being
used clinically due to the long and difficult path from discovery to clinical assay.
Successful biomarker detection requires high sensitivity and high specificity, and the use
of several biomarkers is often required to obtain such standards. Small sample sizes
also make it probable that many protein biomarker candidates will be false positives [25].
Generally, the methods employed to study cellular properties could be classified into
three major categories: microscopy/optical, biochemical, and electrochemical methods.
In the abovementioned microscopic and biochemical methods, the protocols considered
are known as endpoint assays. They provide a one-time analysis about a cell system at
the end of an observation point. They require pre-labeling, post-labeling, and fixation.
Optical techniques are limited by the use of expensive and bulky equipment that is not

8
suitable for miniaturized, low-cost, automated systems [26]. In cases where the sample
needs to be modified in order to obtain measurements, unknown, adverse effects could
be imposed on the cells.
Alternatively, electrochemical sensors are inexpensive, sensitive, simple, and easily
miniaturized. An electrochemical biosensor converts a biological recognition event to an
electrical signal. Two of the most commonly used transducers are amperometric and
potentiometric [27]. Amperometric biosensors apply a constant potential and monitor
the current associated with the reduction and oxidation processes. They have been
used to monitor and detect oxygen, glucose, nitric acid, adenosine triphosphate (ATP),
and many more such analytes. However, lack of selectivity is a common disadvantage
of amperometric cell biosensors [28]. Potentiometric biosensors convert the
biorecognition process into a change in potential signal as a result of due to ion
accumulation or depletion at the electrode surface [27, 28]. A limitation of this type of
transducer is that it requires a very stable reference electrode [28].
Another electrochemical technique, normally placed in a category of its own, is
electrochemical impedance spectroscopy (EIS). It can be separated into 2 different
categories: non-faradaic and faradaic. Non-faradaic EIS describes a system in which a
small AC signal is applied at equilibrium. The response is linear, and no charge-transfer
reactions occur within the electrochemical system. A common non-faradaic EIS
technique is Electrical cell-substrate impedance spectroscopy/sensing (ECIS), which will
be discussed later in further detail. In faradaic EIS, electrons are transferred across the
metal-solution interface, causing oxidation and reduction to occur. The cells create a
barrier between the redox probe and the electrode surface, thus increasing the electron
transfer resistance (Ret), which is related to the number of cells present (or change in

9
number of cells due to proliferation or apoptosis) and changes to the electrode surface
[28]. Faradaic EIS is a simple method for continuous monitoring of cell numbers;
however, the recognition complex often leads to minute or undetectable changes in
interface impedance, resulting in reduced reproducibility [28].
Non-faradaic impedance spectroscopy was chosen for this research due to its
sensitivity, simplicity, cost-efficiency, and non-invasive properties, with a wide-range of
applications (i.e. monitor cellular viability, morphology, adhesion, cell number,
proliferation, apoptosis, and screening of medicinal compounds in drug development).
Impedance spectroscopy may be combined with the abovementioned techniques to
improve selectivity and sensitivity. Throughout the remainder of this text, the term
impedance spectroscopy or sensing (IS) will refer to non-faradaic EIS, unless otherwise
specified.
2.3 Impedimetric Measurement Theory Electrical impedance measurement technique has the following advantages with
respect to cell measurements: (1) small, non-destructive applied voltage signals, (2)
ability to provide quantitative information about cell morphology, motility, attachment and
spreading, mitosis, and apoptosis, and (3) sensitive measurements in a label-free and
mediator-free environment.
This research implements the use of impedance sensing due to the above
mentioned advantages, as well as (1) the ease of incorporation into a portable system,
(2) the potential to be cost efficient, and (3) the ability to automate long-term
measurements and data analysis. EIS can be used to characterize biological cells over
a wide range of frequencies. Information about cell morphology, adhesion, and
movement is obtained at low- to mid-range frequencies since most of the current flows
10
around the dielectric cell membrane. At higher frequencies, the current penetrates the
membrane and provides information about the cell interior. This research implements
the use of impedance spectroscopy due to the above mentioned advantages, as well as
the ease of incorporation into a portable system, the potential to be cost efficient, and
the ability to automate long-term measurements and data analysis.
Microfabricated electrodes have properties which are useful for a wide range of
applications. The use of microelectrodes would improve the signal to noise ratio, with
minimal loss of sensitivity. An electrode array would impart the required sensitivity as
well as amplify any discernible electrical response. Such a platform could be easily
tailored to offer adequate isolation of cells and their immediate environment, which
reduces background biological noise and interference. Implementation of
microelectrodes would facilitate sensitive detection of cellular responses to either
external or internal stimuli.
The impedance data can be used to differentiate between cells without the need for
cell markers, which can adversely modify the cells. This is a major advantage of IS; thus
eliminating the need for pre- and post-processing of cells and providing rapid,
quantitative analysis.
Bioimpedance measurements are performed with small applied signals to (1) realize
non-invasive measurements of biological cells/tissues and (2) confine measurements
within a pseudo-linear region [29].
2.3.1 Visualization and Equivalent Circuit Analysis Once the impedance spectroscopy data is collected, it can be visualized in several
ways. One of the most common forms of presentation is the bode plot of the impedance

11
Figure 2-2. In a bode plot, the magnitude of the impedance and phase is plotted as a
function of frequency on a log scale. The bode plot explicitly shows the frequency at
which each data point was taken. This form of data presentation can be used to extract
the parameters of the measured system, such as solution resistance, electrode
polarization impedance, and cell resistance and capacitance. A slope in the bode
magnitude diagram accompanied by a change of phase in the bode-phase plot is
referred to as a dispersion. Figure 2-2 illustrates an electrode system with and without
the presence of cells. When there are no cells present, a single dispersion is seen; and
when cells are present on the electrode surface, a second dispersion develops, relevant
to cellular characteristics. In the absence of cells (electrode-electrolyte system), the low-
frequency slope of the bode magnitude plot is representative of the electrode
polarization impedance (or double layer capacitance); whereas the mid- to high-
frequency plateau corresponds to the solution resistance. In this simulation, the double
layer capacitance value is 35 nF and the solution resistance is 1.5 kΩ. At low
frequencies, the phase is -90°, thus signifying a capacitive (double layer) component.
The phase approaches 0° as the frequency increases, thereby denoting a transition to a
resistive component. When cells are present in the system, there is a noticeable change
in the mid-frequency range of the bode plot, as seen in Figure 2-2. The simulated cell
layer capacitance and resistance values are 5 nF and 20 kΩ respectively. Parameters
from these systems can be extracted using equivalent circuit models and complex
nonlinear least squares (CNLS) fitting. The equivalent circuits for the systems with and
without cells are shown in Figure 2-3.
12
2.3.2 Constant-Phase Element (CPE) The double layer capacitance at the electrode/electrolyte interface is not well-defined
by an ideal, simple capacitor. A frequency dispersion exists at the interface; and
therefore, capacitance is expressed as a constant-phase element (CPE). The CPE takes
into account non-ideal properties such as surface roughness and heterogeneities,
electrode porosity, coating composition, slow adsorption reactions, non-uniform potential
and current distributions [30].
Figure 2-3: Equivalent circuits for systems (a) without cells and (b) with adherent cells
Figure 2-2: Bode plot simulating an electrode-electrolyte system and electrode-cells-electrolyte system

13
Equation 2-1 expresses the impedance of an ideal capacitor, as compared to
Equation 2-2, which expresses the impedance of a CPE.
Equation 2-1
Equation 2-2
where j = √ 1, ω = 2πf, C is the ideal capacitance, Y is the CPE, and n is a factor
between 0 and 1. When n = 1, ZCPE = ZC. The phase angle of ZCPE is equal to –90*n in
degrees.
2.3.3 Complex Non-Linear Least Squares Fitting (CNLS) CNLS is a technique used to simultaneously fit data to a model (mathematical or
equivalent circuit) of unknown parameters; and yields parameter estimates associated
with the data. Advantages of this technique are that it provides uncertainty estimates to
declare the “goodness of fit” of the estimated parameters; and very complex models with
greater than 10 unknown parameters can be fit using this technique [31].
In CNLS, the sum of squares, SS, is minimized:
∑ Equation 2-3
where fexp is the experimental data and fth is the theoretical model data, both as a
function of frequency.

14
For a complex (impedance) data set,
∑ , , , , Equation 2-4
where Z’ and Z’’ are the real and imaginary components of the impedance, respectively,
and n is the number of data points.
The aforementioned sum of squares is not weighted, also termed unity-weighted. To
prevent the larger values from dominating the calculation of the sum of squares,
weighting is performed when impedance values in a data set differ over several orders of
magnitude. Equation 2-1 can then be re-written as
SS ∑ w f f Equation 2-5
where w is the weighting factor. There are multiple types of data weighting. Ideally,
weights are determined by replicating experiments and calculating the experimental
standard deviations
w , w Equation 2-6
where σa and σb are the experimental standard deviations, separated into two parts, for
complex data (i.e. real and imaginary). Similarly, wa and wb are the weights, separated
into two parts.
When replication is impractical, one can assume that the relative errors are constant,
and the following relationship is applied.
σ f , σ f Equation 2-7

15
Equation 2-7 is known as proportional weighting (PWT). In PWT, σ is proportional to
the experimental data values.
Similarly, the theoretical value, fth, can be used to determine the weight,
σ f , σ f Equation 2-8
thus, this is known as function proportional weighting (FPWT) [32].
Another form of weighting is modulus weighting (MWT) or function modulus
weighting (FMWT), in which σ is equivalent to the magnitude of the experimental and
theoretical data, respectively. Modulus weighting is suitable when the magnitudes of the
real and imaginary data values are similar across the entire data set; however, this is
normally not the case [33]. In general, FPWT and FMWT lead to less biased data fitting
than PWT and MWT; though PWT can me more reasonable than FPWT when one is
uncertain about the fitting model [33]. FPWT is used in this work due to the drawbacks
of the other weighting types and the use of established circuit models. This selection of
weighting type was experimentally confirmed as the best weighting method for this work.
The table below shows the different abovementioned weighting types applied to the
same data sets of four different devices with and without confluent cells on the electrode
surface.

16
The devices consist of gold electrodes with 500µm-diameter sensors. D1 and D2
have confluent cell monolayers on the sensor surfaces, whereas D3 and D4 contain
cells that are not yet confluent on the sensors. Details about the equivalent circuit model
and extracted parameters will be explained later. From Table 2-1, it can be seen that
FPWT yields the smallest error (weighted sum of squares), followed by PWT, FMWT,
and lastly MWT, with the largest SS.
Table 2-1: Comparison of weighting types on data sets.
MWT Rsp (kΩ)
Ydl(nF) ndl Rcell
(kΩ) Ycell(nF) ncell SS
D1 1.25 1.96 0.95 6.65 39.12 0.66 7.32E-03 D2 2.41 2.12 0.91 -2.37 5.18 6.51 2.94E+00 D3 1.12 1.87 0.96 -- -- -- 3.35E-02 D4 1.35 1.60 0.95 -- -- -- 8.72E-02
Average 7.66E-01
FMWT Rsp (kΩ)
Ydl(nF) ndl Rcell
(kΩ) Ycell(nF) ncell SS
D1 1.22 1.93 0.95 7.04 48.17 0.64 5.82E-03 D2 1.31 1.52 0.95 4.51 53.38 0.63 2.44E-03 D3 1.13 1.87 0.96 -- -- -- 3.33E-02 D4 1.36 1.58 0.95 -- -- -- 8.51E-02
Average 3.17E-02
PWT Rsp (kΩ)
Ydl(nF) ndl Rcell
(kΩ) Ycell(nF) ncell SS
D1 1.26 1.88 0.95 7.00 38.91 0.66 8.08E-04 D2 1.34 1.55 0.95 4.08 33.97 0.66 1.55E-03 D3 1.11 1.74 0.96 -- -- -- 1.71E-02 D4 1.34 1.53 0.95 -- -- -- 8.82E-02
Average 2.69E-02
FPWT Rsp (kΩ)
Ydl(nF) ndl Rcell
(kΩ) Ycell(nF) ncell SS
D1 1.22 1.91 0.95 7.35 54.67 0.64 1.11E-03 D2 1.36 1.58 0.95 3.97 29.69 0.67 1.66E-03 D3 1.11 1.81 0.96 -- -- -- 3.61E-02 D4 1.15 1.58 0.95 0.25 13.99 0.79 1.31E-03
Average 1.00E-02

17
Applying the FPWT technique to calculate the sum of squares of impedance data
yields
SS ∑Z , Z ,
Z ,
Z , Z ,
Z , Equation 2-9
where n is the number of data points.
In CNLS fitting, ensuring that the minimum is found is a common issue. This problem
has been addressed in [34] by implementing one program that usually converges,
followed by a second program that uses the input of the first program. The second
program converges only when a set of parameter values lead to an absolute or a good
local minimum [31]. It is also recommended that data should be fitted in the form it was
measured to reduce bias in the fitted results, caused by taking the inverse of data with
errors [31]. In example, if the real and imaginary components of the impedance are
measured, fitting should be done with the real and imaginary components and not the
magnitude and phase components. A good fit is established when the relative standard
deviations of the fitted parameters are less than 30% [31].
2.3.4 Biological Dispersions Microelectrodes will be used in this work to perform IS measurements, which will
provide frequency-dependent information about biological materials. Figure 2-4 shows a
plot of the frequency dependence of relative permittivity and specific conductivity of
biological tissue, reprinted from [35]. This plot shows three regions, originally defined by
Schwan [36], as alpha (α), beta (β), and gamma (γ) dispersions, at low, mid, and high
frequencies respectively. As measurement frequency increases, tissue conductivity
increases and permittivity decreases.

18
Each of these dispersions is caused by a physical process. The alpha dispersion,
which occurs below 10 kHz, is due to ionic diffusion in layers of the cell culture medium
[37]. Within the beta dispersion region, between 1 MHz and 100 MHz, the electric field
begins to penetrate the cell interior. According to Tamura et al., the beta-dispersion is
dependent on the charging properties of the cell membranes, along with intra- and extra-
cellular fluids [38]. Above 10 GHz (gamma dispersion), it has been shown that measured
quantities tend to vary over frequency in proportion to the water content of the cells [39].
In this research, the region of interest is the beta dispersion in order to identify changes
in cellular membrane structure.
2.3.5 Two- vs. Four-Electrode Impedance Measurements The most common measurement configurations are performed with 2 and 4
electrodes. In 2-electrode measurements (primarily used in this research) current is
Figure 2-4: Frequency dependence of the relative permittivity and specific conductivity of complex biological tissue

19
passed and voltage and measured between the same set of electrodes. One electrode
in the set is identified as the working electrode and the other, usually larger, electrode is
named the counter electrode. If the area of the counter electrode is at least 300-times
greater than the area of the working electrode, the impedance of the system is
dominated by the impedance of the working electrode [14]; thus simplifying the analysis
of the system. Alternatively, in 4-electrode measurements, current is passed through one
pair of electrodes and voltage is measured between another pair. Normally, the voltage
sensing electrodes are placed linearly between the current carrying electrodes. Both
measurement configurations have advantages and disadvantage. For 2-electrode
measurements, electrode polarization impedance, caused by the adsorption of
electrolytic ions/molecules on the electrode surface, is geometry dependent. As
electrode area decreases, the effect of electrode polarization impedance becomes
greater, causing relevant data to be masked at lower frequencies. On the other hand,
electrode polarization impedance has negligible effects 4-electrode measurements since
the current passing and voltage sensing electrodes are separate. However, with this
configuration, multi-electrode array configurations are not easily achieved for increased
spatial resolution.
Impedance detection, using either configuration, can be performed continuously and
long-term since the measurements are non-destructive and label-free. This research
leverages on noninvasive, nondestructive, label-free characteristics of impedance
measurements for long-term analysis of cells and their surrounding environment.

20
Chapter 3 State-of-the-Art and Applications of Impedance Spectroscopy
3.1 Impedance Detection of Normal and Abnormal Cells Impedance measurements of adherent cells have been shown to detect changes in
cell morphology on the order of nanometers [6], providing sensitivity much greater than
that obtained through visual inspection. Cellular morphology is one of the most important
parameters in cancer biology [23]. There are numerous examples in literature
demonstrating a change in impedance with a corresponding change in the physical
properties of cells [1, 2, 9, 40]. In general, impedance measurements can detect a
change in cellular capacitance and resistance at the electrode interface. When cells
attach and spread onto the surface of the electrode, the measured impedance increases
because the cell membranes act as insulators and block current flow. A schematic of the
current flow in tissue culture medium with and without cells is shown in Figure 3-1, from
[41]. A small current is passed through the electrodes, thus making the measurements
non-invasive and non-destructive.
Beginning in the 1920s with Frick and Morse, significant capacitive differences have
been found between malignant breast tumors and normal tissues [42]. Due to increased
cellular water and salt content, altered membrane permeability, and changed packing
density, malignant tumors typically exhibited a lower electrical impedance [42]. Han et
al. demonstrated that cancer cells at different stages had unique impedance signatures.
Since the cell membrane of cancer cells are more permeable, a decrease in capacitance
resulted, relative to the stage of cancer [43]. A study by Beetner et al. demonstrated

21
differences between basal cell carcinoma (BCC), benign lesions, and normal skin using
electrical impedance measurements. They noted that BCC had a larger nuclei and
smaller intercellular spacing, causing a difference in measured impedance [44].
The basis of this research originates from the findings of the abovementioned work,
which verifies that there are measurable impedance differences between normal and
cancer cells.
Some differential electrical characteristics between normal and cancer cells are
summarized below:
Cancer cells have a lower electrical membrane potential and lower electrical
impedance than normal cells [45]
Cancer cells have an accumulation of an excessive amount of negative charges
on their exterior surface [46]
Figure 3-1: Schematic of current flow in tissue culture medium with and without cells present on electrode
No cells
Adherent cells

22
Electrical conductivity and permittivity of cancerous cells is greater than that of
normal cells [47]
In a controlled, static environment, cell characterization can provide fundamental
information about cells’ long-term behavior, functional characteristics, and growth-cycle.
This fundamental information can prove to be invaluable with applications such as
cancer research, toxicology and cytopathic studies, drug screenings, wound healing,
personalized healthcare, and development of flow-through cell characterization systems.
Development of a practical biosensor for cancer research requires (1) sensor design
optimization, (2) configuration and optimization of measurement setup, and (3) sensitive
detection and differentiation of cancer cells.
3.2 State-of-the-Art: Adherent Cell Characterization The interactions between in vitro cells and substrates have been studied for many
decades to obtain vital information about the condition of cells. Normal anchorage-
dependent cells secrete extracellular matrix (ECM) proteins and proteoglycans that
adhere to the substrate to attain traction for migration and acquire signals for growth and
differentiation from the ECM. Other cell functions such as gene induction, motility,
wound healing, and tumor metastasis are all dependent on the binding of cells to ECM
[48]. The study of cell-substrate interactions has applications in drug screenings, toxicity
and cytotoxicity studies, cancer research, wound healing, and cytopathic studies.
Analysis of cell attachment using a microscope has been a commonly used
technique; however the analysis is qualitative and performed at a single point in time.
Cinematography is used to continuously record an event; however, data quantification is
difficult and requires extensive data manipulation [49]. Some other quantitative methods
that measure cell substrate interactions include quartz crystal microbalance (QCM),

23
optical waveguide lightmode spectroscopy (OWLS), and electric cell-substrate
impedance sensing/spectroscopy (ECIS) [50]. QCM monitors changes in resonant
frequency of piezoelectric quartz crystals to measure cell adhesion, proliferation, and
cytotoxicity. OWLS uses evanescent waves to monitor cell adhesion and proliferation.
A detailed review of these techniques, along with a few others, can be found in [51,
52]. OWLS and QCM, both being optical-based techniques, would add expense and
complexity to the measurement setup. The use of ECIS-based measurements was
chosen for this research due to its simplicity, ease of miniaturization, and wide range of
applications.
3.2.1 Electric Cell-Substrate Impedance Sensing (ECIS) ECIS was developed by Giaever and Keese in 1984 to study the electrical properties
of adherent cells. A small, 250µm diameter, gold working electrode and a larger counter
electrode is used in the two-electrode system. When cells attach and spread onto the
surface of the electrode, the measured impedance increases because the cell
membranes act as insulators and block current flow. The sensitivity of these
measurements is on the order of nanometers [6], meaning that changes in morphology
or micromotion can be detected on a nanoscale. A photograph of a commercial ECIS
device is shown in Figure 3-2.

24
Equivalent circuit modeling and/or numerical analyses can be performed to quantify
and monitor system parameters such as cell membrane capacitance, solution
resistance, cell-cell junction resistance, and cell-substratum contact resistance. ECIS is
very sensitive to micromotion, the constant movement of cells on the electrode surface
driven by their microfilaments [8]. Therefore, small changes can be detected even
before observations are visible under a microscope.
Applied Biophysics offers various electrode designs, including one with 2
independent working electrodes within a cell culture chamber, shown in Figure 3-3. It is
a well-known and widely accepted technique; however, some of its shortcomings include
limited frequency range and preset data points, and minimal spatial resolution. The high
end of the frequency range is limited by the presence of the passivation layer over the
unexposed gold traces. This results in a parasitic coating capacitance at higher
frequencies, where current preferentially travels through the least resistive pathway [53].
Spatial resolution and statistically relevant data can be enhanced by implementing more
independent working electrodes to obtain multiple impedance datasets within a cell
culture chamber.
Figure 3-2: Photograph of commercial ECIS device
250µm-diameter working electrode
Common counterelectrode

25
The final device described in this research contains 8 independent electrodes to
improve statistical relevance of measured data and obtain information position-
dependent data across the cell culture.
3.2.2 Applications of ECIS in Literature Many studies have been performed in literature using ECIS to study the effects of
toxin, drugs, and environmental changes on normal and cancerous cells [1, 2, 4-9, 11,
12, 15, 17, 54]. In general, when the adherent cells were faced with an adverse
challenge (bacterial/viral infection, deprivation of glucose, induced apoptosis), they
retract from the electrode surface and neighboring cells, causing a decrease in
resistance and increase in capacitance. A review of this literature is summarized in
Table 3-1. From the literature review, it has been shown that cells faced with various
challenges can be identified using ECIS measurements. This research fills-in the gaps
by optimizing electrodes for ECIS-based measurements and designing multi-electrode
devices to obtain multiple data points from within a cell culture, resulting in statistically
relevant data, to electrically characterize cells for subsequent microfluidic impedance
sensing and 3-dimentional tumor spheroid cultures.
Figure 3-3: Applied Biophysics' ECIS device 8W2x1E
26
Table 3-1: Summary of relevant ECIS literature.
Cause / Challenge Effect Reference
(a) No challenge: studied micromotion of WI-38 VA13 and WI-38 fibroblastic cells
(b) Added 10% formalin treatment to kill cells
(a) Derived a model to calculate the specific impedance of a cell-covered electrode, based on cell-free electrode impedance, membrane capacitance, and resistivity of medium
(b) No fluctuation (micromotion)
Giaever, et al.; 1991, [2]
(a) Temperature (27°C and 37°C)
(b) Deprivation of glucose
(c) Cytochalasin D
(a) Decreased temperature decreases cell fluctuations
(b) Reduced glucose reduced micromotion of cells
(c) Decreased resistance due to morphological changes
Lo, et al.; 1993, [6]
Effect of applied electric fields At 40 µA, microfilaments relax & move away from the surface (decreased resistance); at 200 µA, electroporation occurs
Keese, et al.; 1994, [8]
Microbial challenge: indigenous oral spirochete Treponema denticola, varying concentration
At highest concentration, initial increase in impedance was observed (cell swelling); Decreased micromotion and junctional resistance; relatively constant cell-substrate resistance
Ko, et al.; 1998, [10]
No challenge: resistance & capacitance of epithelial MDCK cells
Between 200 Hz & 5 kHz, resistance increased first due to attachment and spreading, then tight junctions; high-frequency (40 kHz) capacitance is most sensitive parameter for monitoring attachment & spreading
Wegener, et al.; 2000, [14]
Bovine aortic endothelial cells (BAECs) exposed to fluid flow (forces)
Sharp increase in resistance at flow onset; resistance decreased after 60 min. Capacitance slightly decreased at flow onset then increased after 10 min. until flow was removed
Changes in capacitance (5%) were small compared to change in resistance (30%)
DePaola, et al.; 2001, [16]

27
Table 3-1 (Continued)
Addition of metastatic cell suspensions to confluent human umbilical vein endothelial cells
Endothelial cell junctions retracted; thus impedance decreased; Change in impedance correlated with the strength of the metastatic cells
Keese, et al.; 2002, [1]
Wounding of African green monkey kidney cells, NRK cells, MDCK cells with elevated current pulses ( 3V at 40kHz)
Wounding resulted in drop in resistance and increase in capacitance from 1 nF to 5 nF. Resistance increased back to level of cell-covered electrode after a few hours due to migration of cells
Keese, et al.; 2003, [3]
Addition of mercuric chloride at various concentrations
Cells died; Impedance decreased. Resistance changed as a function of cell attachment, spreading, mitosis, and cytotoxicity effect
Xiao, et al.; 2003, [5]
Induced apoptosis in porcine brain capillary endothelial cells (PBCECs) using cycloheximide (CHX)
25 µM CHX: Impedance decreased after ~30 min.; impedance reached cell-free value after 6 hours. Values for cell-cell resistance, cell-substrate resistance, & cell membrane capacitance were extracted
Arndt, et al.; 2004, [9]
Introduced toxins (tamoxifen and menadione) to Human hepatocellular carcinoma cell (HepG2)
Dead cells detached and impedance decreased. Change in impedance consistent with intensity of fluorescence using conventional fluorescent assays
Yeon, et al.; 2005, [12]
Addition of influenza A viral infection to MDCK cells
Cells became rounded and detached from surface. Impedance decreased in dose-dependent manner
McCoy, et al.; 2005, [15]
(a) Differentially coated surfaces
(b) Integrin and actin cytoskeleton disrupting agent
(c) Interfering with Src tyrosine kinase expression and activity
(a) Increase in cell index (resistance) correlated with cell attachment and spreading; able to distinguish adhesion quality
(b) Function-blocking antibodies prevented cell attachment and spreading
(c) Cell attachment and spreading was inhibited, indicated by decrease in cell index
Atienza, et al.; 2005, [17]

28
Table 3-1 (Continued)
3.2.3 xCELLigence The xCELLigence system, also known as the real-time cell electronic sensing (RT-
CES) system, was developed in the early 2000’s. It has similar traits to the ECIS setup;
though one major difference is that the xCELLigence system incorporates a circle-on-
line electrode design that covers approximately 80% of the surface area of 16, 96, 384-
well plate chambers [55]. Each individual electrode has a diameter of 90 µm, and the
spacing between two rows of electrodes is approximately 10 µm. The design mirrors that
CHSE-214 cells infected with infectious pancreatic necrosis virus (IPNV)
EPC carp cells infected with infectious hematopoietic necrosis virus (IHNV)
Resistance increased with initial attachment and spreading. Resistance decreased & capacitance increased due to cell death ~ 50 hours after introduction of virus. Virus had no effect at room temperature; its effect was dose-dependent
Campbell, et al.; 2007, [4]
Aspirin added to HT-29 colon cancer cells after 24 hours
Inhibited HT-29 cell growth; Impedance decreased
Changes most sensitive at 40 kHz
Yin, et al.; 2007, [7]
(a) No challenge: studied NCI-H460 cancer cell attachment on collagen
(b) NCI-H460 concentration (1x10⁴ vs. 3x10⁴ cells/chip)
(c) Effect of antibodies against β1 & α2β1-integrin
(a) Impedance change increased with time
(b) 92-135% difference in impedance change when cell concentration increased; highest sensitivity reported
(c) Increased antibody concentration decreased total impedance change
Chen, et. al;
2008, [11]
Wound edges formed using SAMs to inhibit cell adherence
(a) Measured migration speed of 4 cell lines (CaSki, HeLa, Vero-E6, & NIH-3T3) with/without serum
(b) Effect of migration inhibition agent (colchicine)
(a) Speed of migration significantly higher in media with serum; NIH-3T3 (fibroblast cells) showed the highest migration speed
(b) Colchicine inhibited cell migration in a concentration-dependent manner
Wang, et al.; 2008, [13]

29
of interdigitated electrodes. An image of the system and electrode, from the Roche
Applied Science website (http://www.roche-applied-science.com/sis/xcelligence), is
shown in Figure 3-4.
This system uses a measure termed cell-index, (CI) which can be associated to
monitor cell viability, number, morphology, and adhesion. The CI is a dimensionless
number that is proportional to the ratio of the measured impedance with cells present
and without cells. As cells attach and spread onto the electrodes, the CI increases from
zero. Impedance measurements are taken at 10, 25, and 50 kHz, though 10 kHz is
primarily used to calculate the cell index. CI is defined by the following equation:
Equation 3-1
where Rcell and Rb is the frequency-dependent resistance when cells are attached and
when no cells are attached, respectively [56]. Further reading and illustrations can be
found in [57, 58]. Advantages of the optimized electrode design in this research include
Figure 3-4: Photograph of xCELLigence system and enlarged image of microelectrode, circle-in-line design

30
independent working electrodes, and impedance spectroscopy to characterize
frequency-dependent system parameters.
3.2.4 Electrode Optimization Impedance characterization of biological cells, using microelectrodes, is an emerging
diagnostic tool for studying electrophysiological and biophysical changes due to viral
infections [15], cancer detection [59], and drug response [60]. Microelectrodes offer
many advantages over their conventional counterparts including: economy due to batch
fabrication [61], small signal and large current densities (current per unit area) due to
enhanced mass transport [62], and the ability to integrate electrodes with other
instrumentation to develop portable measurement systems [63]. The small currents
associated with microelectrodes have the potential to perform non-destructive
measurements and facilitate the study of high resistivity samples [64].
There are also disadvantages associated with microelectrodes, commonly resulting
in measurement error. At low frequencies, microelectrodes are challenged with
interfacial polarization impedance in 2-electrode measurements. Interfacial, or double
layer, capacitance is indirectly proportional to interfacial impedance and arises from the
inability of charge carriers to move across the solid–liquid barrier [65]. The result of this
barrier is accumulation of charges in response to an applied potential to the electrode;
thus giving rise to a capacitive effect. Since capacitance is directly proportional to area,
in the case of microelectrodes, this effect can lead to very large impedances, particularly
at low frequencies.
Researchers have performed experiments to optimize the electrode designs for
various applications. Fosdick and Anderson [66] optimized the geometry of a
microelectrode array flow detector; with respect to amperometric response; and Min and

31
Baeumner [67] investigated geometric parameters (i.e. electrode height, material, gap
size, and electrode width) of interdigitated ultramicroelectrode array (IDUAs) to optimize
oxidation and reduction reactions of ferro/ferrihexacyanide. Sandison and coworkers [68]
studied electrode sensor array geometry (center-to-center spacing and diameter) and
porosity of electrode sensors using Si3N4-coated silicon substrate and Lempka and
coworkers [69] optimized silicon-substrate microelectrodes for neural activity recordings.
While the aforementioned works studied the optimization of electrodes for flow
detectors, neural recordings, and microfluidic biosensors; design rules for optimization of
microelectrodes for ECIS-based measurements had received little attention in published
literature. One example of ECIS-based optimization was performed by Wang and
colleagues. They investigated the sensitivity and frequency characteristics of
interdigitated array microsensors for ECIS [70]. Other studies have been performed for
numerical optimization of cell data analysis [71], and determination of the most robust
and sensitive cell lines for field-portable toxicology studies [72]. Part of this work focuses
on optimizing ECIS-based electrodes to reduce measurement noise. The other part of
this research uses this optimized electrode design to characterize and differentiate
normal and cancer cells with enhanced detection sensitivity and statistically-significant
data. This research will serve as a foundation for cancer cell characterization and
detection.

32
Chapter 4 Electrode Optimization for High-Frequency Impedance
Measurements
4.1 Introduction As mentioned previously, microelectrode designs need to be optimized to reduce
interfacial impedance as well as to extend the useful frequency probing range. One of
the objectives of this research is to suppress these parasitics and optimize
microelectrode design for ECIS-based measurements within the beta dispersion region.
Electrode design optimization of microelectrodes is critical to the efficient employment of
detection techniques in drug discovery, cancer research, and toxicology studies. Pejcic
and De Marco [73] reiterate that sensor optimization is one of the most crucial steps in
the realization of an electroanalytical device.
In this work, a design rule was derived for optimization of microelectrodes used in
Electric Cell–Substrate Impedance Sensing (ECIS) up to 10 MHz [53]. Previous work
[74], studying the effect of electrode geometry (sensor diameter), demonstrated the
parasitic effects of the passivation coating at higher frequencies. The effect of electrode
design (electrode area, lead trace widths, and passivation coating thickness) on the
contribution of the passivation coating impedance was experimentally evaluated using
Electrochemical Impedance Spectroscopy (EIS) measurements. The parasitic coating
impedance was successfully minimized by designing electrodes with either a thicker
coating layer or a smaller lead trace width. It was observed that passivated lead trace
area to coating thickness ratio has a critical value of 5.5, under which the impedance
contribution of the coating is minimized.

33
The optimized design of ECIS-based microelectrode devices reported in this work
will make it possible to probe the entire beta dispersion region of adherent biological cell
layers.
4.2 Fabrication Gold microelectrode devices were fabricated on glass wafers using standard
photolithography and metal deposition techniques. The fabrication process flow is
illustrated in Figure 4-1 (a-f).
Four-inch glass wafers were solvent cleaned (acetone and methanol) and dried with
nitrogen. Chromium (200 Ǻ) and gold (1000 Ǻ) were thermally evaporated onto the
Figure 4-1: Fabrication process for microelectrode devices. (a) clean glass substrate and thermally evaporate chromium and gold layers; (b) apply and pattern photoresist; (c) electroplate gold onto uncovered electrode sensors, traces, and contact pads; (d) lift-off; (e) wet etch to remove evaporated gold and chromium; (f) apply and pattern photoresist to insulate the traces and expose the sensors and contact pads

34
wafers. Next, the wafers were solvent cleaned in preparation for the first of two
photolithography steps. The first photolithography process, performed with NR1-3000PY
(Futurrex) negative photoresist, opened patterns in the resist in the shape of the
electrode device seen in Figure 4-3. 3000PY was spun at 3000 rpm for 30 seconds. The
wafers were soft-baked on a hotplate for 1 minute at 155°C. (Note: the bake times are
double the times typically seen on data sheets because the data sheets are optimized
for silicon; however, glass, being insulating, requires longer bake times). The photoresist
was exposed for 60 seconds using an EVG mask aligner, followed by a 2-minute post
exposure bake at 110°C. Lastly, the resist was developed in RD6 (Futurrex) for 18
seconds. Subsequently, gold was electroplated onto the exposed evaporated gold.
Electroplated gold is rougher than evaporated gold. The rougher surface increases the
surface area of the electrode sensors and thus reduces the effect of the parasitic
impedance caused by the double layer at low frequencies. Approximately 1 µm of gold
was electroplated onto the evaporated gold, which acted as a seed layer. Electroplating
was performed using RTU TG25E (Technic) gold plating solution. The solution was
warmed to 55°C on a hotplate with a magnetic stirrer (Figure 4-2).
The negative terminal of a current source was connected to the wafer and the
positive terminal was connected to a platinum mesh. The gold plating solution contains
positively charged gold metal salt, which is attracted to the negatively charged wafer and
reduced to metallic form. A 2 mA DC current was applied for 30 minutes, resulting in
approximately 0.4 µm of gold. Profilometer measurements were completed before and
after plating to confirm the height of the gold.

35
Next, the 3000PY photoresist was removed by solvent cleaning the wafers. The
evaporated gold (seed layer) was removed via wet etching in gold etchant for
approximately 20 seconds. The seed layer is removed; however, sufficient electroplated
gold remains since the electroplated gold is 10 times greater than that of the evaporated
gold. The chromium seed layer is subsequently removed by wet etching with a
chromium etchant for approximately seven seconds. The wafers a solvent cleaned and
prepared for the second photolithography step.
The wafers were diced into single devices and cloning cylinders were attached to
serve as the electrolyte reservoir. The cylinders were centered and attached around the
four sensors by slowly heated photoresist around the outer circumference of cylinder,
using a hotplate.
Figure 4-2: Schematic of electroplating setup
36
Subsequently, the photoresist harden as it slowly cooled and to form a tight seal with
few air pockets. Schematics of the 500 µm and 30 µm trace-width devices are illustrated
in Figure 4-3.
Electrode devices with different sensors diameters were fabricated for each trace
width, using standard photolithography techniques. The 500 µm trace-width devices had
sensor diameters of 500, 250, and 100 µm. The 30 µm trace-width devices had sensor
diameters of 500, 250, and 125 µm.
4.3 Theory Theoretically, capacitance decreases as area decreases, according to the following
equation,
Equation 4-1
where ε0 is the permittivity of free space (8.85 x 10⁻¹² F/m); εr is the relative permittivity of
the polymer coating in this case (4-8); A is the area of the coated traces; d is the
thickness of the coating.
Figure 4-3: Top-view schematics of (a) 500µm and (b) 30µm trace-width devices

37
Therefore, decreasing the polymer-covered trace area or increasing the thickness of
the coating should decrease the coating capacitance. In previous work [74],
experiments were performed on electrode devices with a 500 µm trace width and 2 µm-
thick resist. The area of coating exposed to the electrolyte was approximately 1 mm2,
and the coating impedance appeared at approximately 1 MHz. This is a result of current
flowing through the coating, a pathway of lower resistance at higher frequencies. To
validate this theory, new electrode devices were designed and fabricated with a 30 µm
trace-width; thus reducing the coating area to 7.65 x 10⁻² mm2, more than an order of
magnitude smaller than the devices with a 500 µm trace width.
4.4 Effect of Increasing the Passivation Coating Thickness Impedance measurements were performed on the 500 µm trace-width devices to
investigate the effect of increasing the coating thickness on upper-frequency impedance
measurements using potassium chloride (KCl) as the electrolyte. When the resist
thickness was increased from 2 µm to 20 µm, there was a significant reduction in the
coating impedance component. A comparison of measurements with 2 µm- and 20 µm–
thick coatings is illustrated in the bode plot of Figure 4-4.
The coating impedance calculated at 10 MHz was less than the spreading resistance
for the devices with 2 µm-thick coating for all sensor diameters; hence current flows
through the coating as seen with the 250 µm sensor diameter, 2 µm-thick resist trace ()
in Figure 4-4.

38
In contrast, the coating impedance of the devices with 20µm-thick coating is less
than the spreading resistance for sensor diameters less than 250µm; so the coating
capacitance component is not seen on the 250 µm (◊) and 500 µm (*) traces in Figure
4-4, however it is slightly apparent in the 100 µm sensor diameter, 20 µm thick resist
trace (x). The results confirm that increasing the coating thickness to 20 µm eliminates
the coating component for devices with sensor diameters of 250 µm or greater.
Figure 4-4: Bode plot of 500 µm trace-width devices, of varying sensor diameters, with 2 µm-thick resist and 20 µm-thick resist. * (500 µm sensor diameter, 20 µm thick resist); ◊ (250 µm sensor diameter, 2 µm thick resist); x (100 µm sensor diameter, 20 µm thick resist); (250 µm sensor diameter, 20 µm thick resist). Increasing the coating thickness to 20µm suppressed the coating

39
4.5 Effect of Decreasing the Coating Area To study the effect of trace width, electrodes were designed and fabricated with 30
µm trace width and impedance was measured using KCl as the electrolyte. Decreasing
the coating area from 1.1 mm2 to 7.65x10⁻² mm2 eliminated the high-frequency coating
component on all measured sensors, including the 500µm, 250µm, 125µm-diameter
sensors, as illustrated in Figure 4-5.
The theoretical coating impedances (at 10 MHz) of the 30 µm trace-width devices
averaged 9.6 x 10³ Ω, a value greater than the spreading resistances of the 500µm
diameter sensor (Rsp = 1.4 x 10³ Ω), 250µm diameter sensor (Rsp = 2.8 x 10³ Ω) and
125µm-diameter sensor (Rsp = 5.6 x 10³ Ω). This demonstrates that theoretically as well
as experimentally, the coating component is no longer dominant at high frequencies on
the 30 µm trace-width devices.
By removing the high-frequency coating component, the equivalent circuit of the KCl-
electrode system was simplified to a resistor-constant phase element (CPE) series
circuit. The simplified R-CPE series circuit was used to fit the data and the extracted
system parameters. The percent error of each fitted parameter was no greater than
3.5%, indicating a good fit with the R-CPE series circuit. This demonstrates that the
coating capacitance component was successfully eliminated up to 10 MHz.
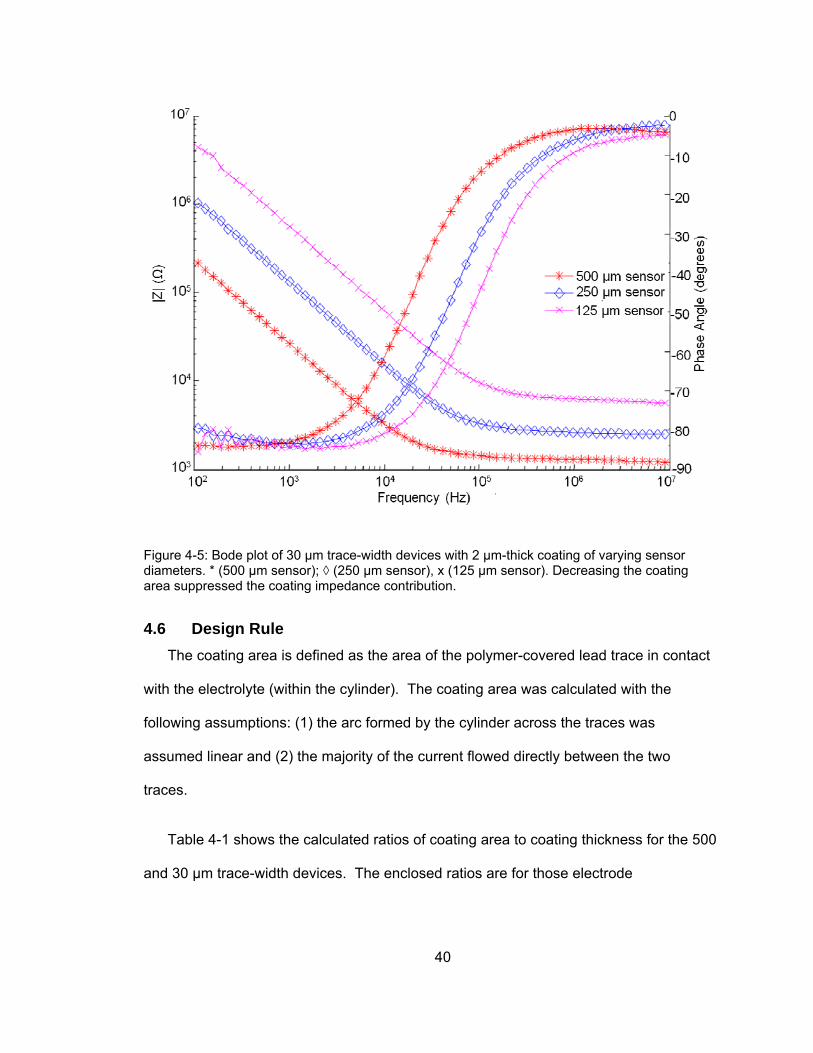
40
4.6 Design Rule The coating area is defined as the area of the polymer-covered lead trace in contact
with the electrolyte (within the cylinder). The coating area was calculated with the
following assumptions: (1) the arc formed by the cylinder across the traces was
assumed linear and (2) the majority of the current flowed directly between the two
traces.
Table 4-1 shows the calculated ratios of coating area to coating thickness for the 500
and 30 µm trace-width devices. The enclosed ratios are for those electrode
Figure 4-5: Bode plot of 30 µm trace-width devices with 2 µm-thick coating of varying sensor diameters. * (500 µm sensor); ◊ (250 µm sensor), x (125 µm sensor). Decreasing the coating area suppressed the coating impedance contribution.
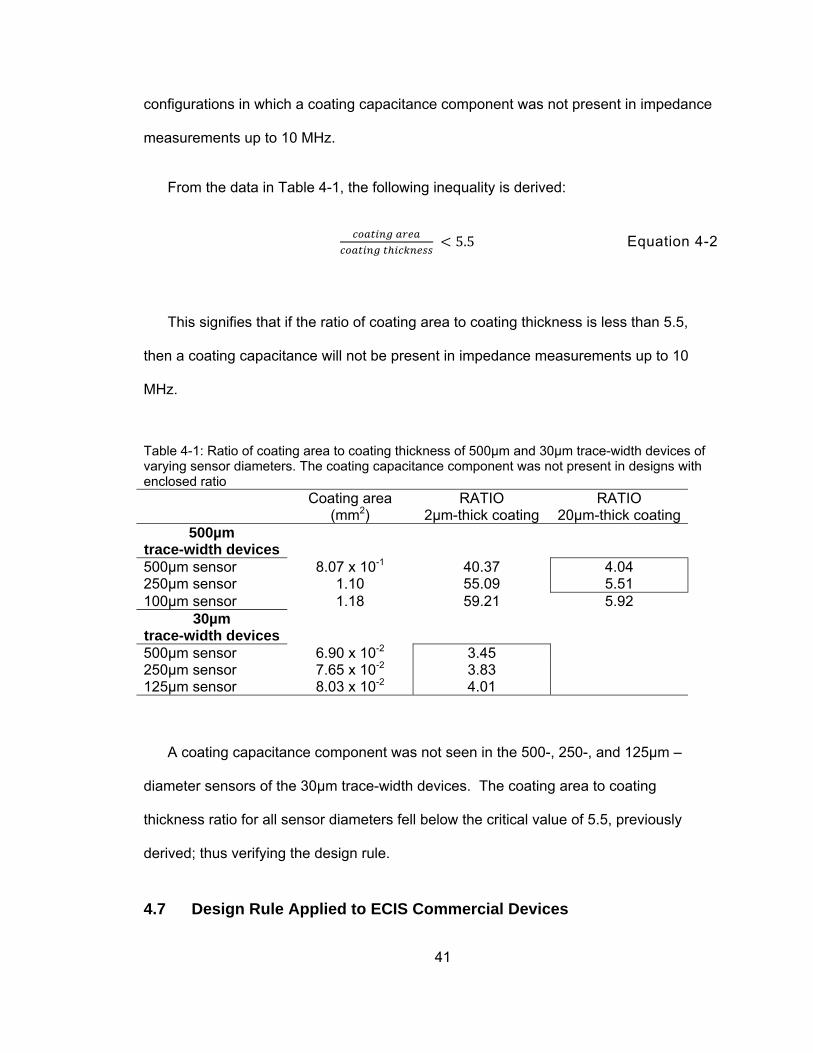
41
configurations in which a coating capacitance component was not present in impedance
measurements up to 10 MHz.
From the data in Table 4-1, the following inequality is derived:
5.5 Equation 4-2
This signifies that if the ratio of coating area to coating thickness is less than 5.5,
then a coating capacitance will not be present in impedance measurements up to 10
MHz.
A coating capacitance component was not seen in the 500-, 250-, and 125µm –
diameter sensors of the 30µm trace-width devices. The coating area to coating
thickness ratio for all sensor diameters fell below the critical value of 5.5, previously
derived; thus verifying the design rule.
4.7 Design Rule Applied to ECIS Commercial Devices
Table 4-1: Ratio of coating area to coating thickness of 500µm and 30µm trace-width devices of varying sensor diameters. The coating capacitance component was not present in designs with enclosed ratio
Coating area (mm2)
RATIO 2µm-thick coating
RATIO 20µm-thick coating
500µm trace-width devices
500µm sensor 8.07 x 10⁻¹ 40.37 4.04 250µm sensor 1.10 55.09 5.51 100µm sensor 1.18 59.21 5.92
30µm trace-width devices
500µm sensor 6.90 x 10⁻² 3.45 250µm sensor 7.65 x 10⁻² 3.83 125µm sensor 8.03 x 10⁻² 4.01

42
The commercial 8W1E ECIS (Applied BioPhysics) cell culture impedance device has
a coated area of approximately 14 mm2. For a coating thickness of 2 µm, the coating
area to coating thickness ratio is calculated to be approximately 700, which is much
greater than the critical ratio of 5.5. From this calculation, it can be inferred that the
8W1E ECIS device has a coating capacitance component at high frequencies. This was
verified with previous measurements [75].
It has been experimentally proven that microelectrode devices, particularly those
used for ECIS measurements, can be optimized by decreasing the coating (trace) area
and/or increasing the coating thickness to eliminate the high-frequency coating
component. A relationship between coating area and coating thickness was derived to
aid in the design of ECIS-based microelectrode devices for high-frequency impedance
measurements. A critical ratio of 5.5 (coating area to coating thickness) was defined in
order to completely eliminate the coating capacitance component. The redesigned
system reduces measurement artifacts and improves the quality of data across the beta-
dispersion region. The new design will enable the use of the commonly used ECIS
technique to measure real-time cellular properties in high frequency ranges (beta
dispersion) that was not possible thus far.

43
Chapter 5 Comparison of Measurement Sensitivity Between 2- and 4-
Electrode Configurations
5.1 Introduction This work was performed in collaboration with the Naval Research Laboratory’s
Center for Biomolecular Science and Engineering. The effects of diffusion between non-
conductive sheath and conductive sample fluids in an impedance-based biosensor were
investigated using 2- and 4- electrode impedance configurations. Sections of this work,
namely the surface chemistry, E. coli culture, and confocal microscopy, were performed
by co-authors of this work published in [http://dx.doi.org/10.1039/C005257D] –
Reproduced by permission of The Royal Society of Chemistry.
Hydrodynamic focusing addresses the problem of clogged channels by using laminar
flow streams to provide virtual channels with flexible interfaces that can be much smaller
than the physical dimensions of the solid channel. Biosensors employing hydrodynamic
focusing have been reported for cell or particle detection [76], cytometry [77, 78], sorting
[79] and mixing applications [80, 81]. Most incorporate optical analysis, usually
fluorescence, for increased sensitivity and specificity. However, such systems include
bulky optical components which are not easily integrated into lab-on-a-chip systems [82].
An alternative is to achieve target detection of species with techniques based on
measurement of electrical signal, especially impedance.
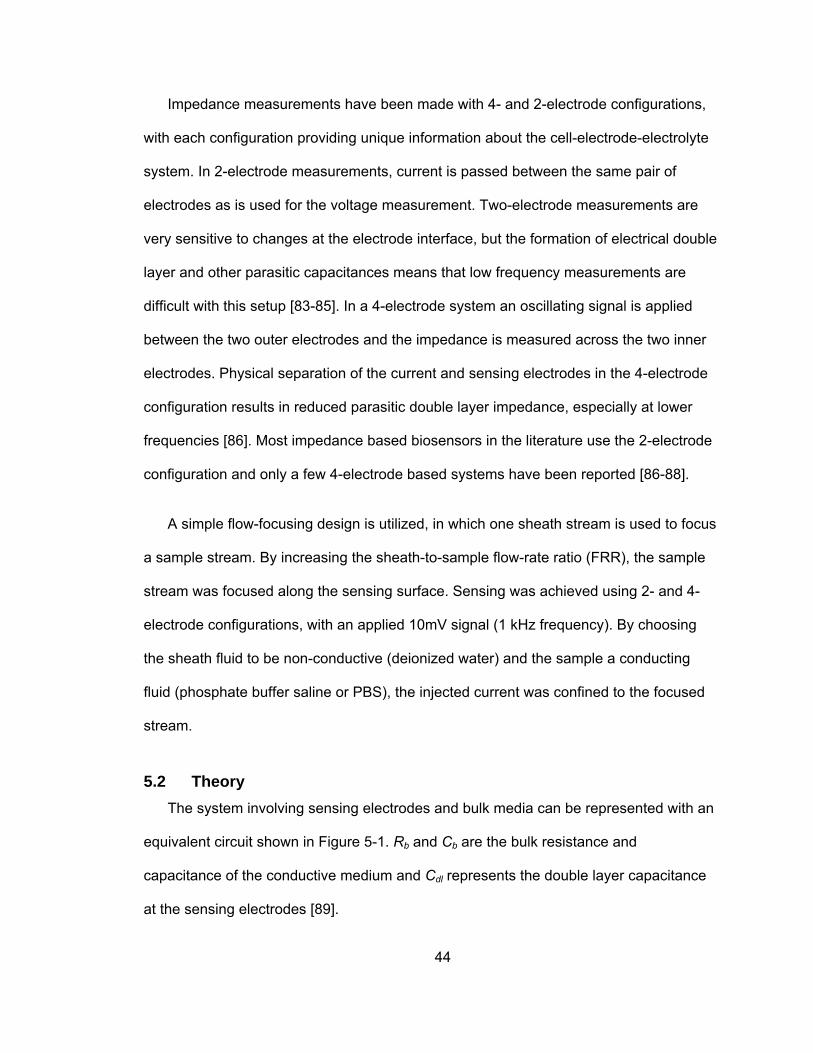
44
Impedance measurements have been made with 4- and 2-electrode configurations,
with each configuration providing unique information about the cell-electrode-electrolyte
system. In 2-electrode measurements, current is passed between the same pair of
electrodes as is used for the voltage measurement. Two-electrode measurements are
very sensitive to changes at the electrode interface, but the formation of electrical double
layer and other parasitic capacitances means that low frequency measurements are
difficult with this setup [83-85]. In a 4-electrode system an oscillating signal is applied
between the two outer electrodes and the impedance is measured across the two inner
electrodes. Physical separation of the current and sensing electrodes in the 4-electrode
configuration results in reduced parasitic double layer impedance, especially at lower
frequencies [86]. Most impedance based biosensors in the literature use the 2-electrode
configuration and only a few 4-electrode based systems have been reported [86-88].
A simple flow-focusing design is utilized, in which one sheath stream is used to focus
a sample stream. By increasing the sheath-to-sample flow-rate ratio (FRR), the sample
stream was focused along the sensing surface. Sensing was achieved using 2- and 4-
electrode configurations, with an applied 10mV signal (1 kHz frequency). By choosing
the sheath fluid to be non-conductive (deionized water) and the sample a conducting
fluid (phosphate buffer saline or PBS), the injected current was confined to the focused
stream.
5.2 Theory The system involving sensing electrodes and bulk media can be represented with an
equivalent circuit shown in Figure 5-1. Rb and Cb are the bulk resistance and
capacitance of the conductive medium and Cdl represents the double layer capacitance
at the sensing electrodes [89].

45
The main advantage of the 4-electrode setup is that the double layer capacitance at
the current electrodes does not play a part since the current and sense electrodes are
physically separated and therefore it can be ignored. The equivalent impedance (Zeq)
consists of the Rb in parallel with Cb (Figure 5-2).
The LCR meter measures the real RM and imaginary XM components of the equivalent
circuit impedance, Zeq,
Zeq= RM+ jXM Equation 5-1
Parallel combination of the bulk resistor and capacitor results in the following
relationships, relating the bulk counterparts to the real and imaginary components.
Figure 5-2: Modified equivalent circuits for 4- and 2-electrode measurement configurations.
Figure 5-1: Equivalent circuit of electrode-electrolyte (medium) system; where Rb and Cb are the bulk resistance and capacitance of the conductive medium and Cdl represents the double layer capacitance at the sensing electrodes.

46
Equation 5-2
Equation 5-3
The two equations can be solved to find the desired Rb and Cb values, using
Equation 5-4
Equation 5-5
In the 2-electrode system the current and sense electrodes are the same and
therefore double layer capacitance cannot be ignored, especially at the low signal
frequencies used in this study (1 kHz). In the simplest approximation, Cb is generally
negligible as compared to Cdl and may be ignored. The equivalent circuit, as shown in
Figure 5-2, thus includes Rb in series with Cdl (at each electrode). The resistance and
capacitance measured by the LCR in this case are related to the circuit elements
through
Equation 5-6
Equation 5-7
5.2.1 Interfacial Impedance The gold electrodes in this system are considered completely polarizable and thus
pass no faradaic current. In addition, impedance measurements are performed with a
small AC signal applied at equilibrium; thus the response is linear, and no charge-
transfer reactions occur within the electrochemical system. When the electrodes are in

47
contact with the liquid electrolyte,, the electrodes attract ions and form a double layer
across the electrode/electrolyte interface with a thickness on the order of angstroms.
The double layer consists of a layer of ions that are specifically adsorbed to the surface
of the electrodes and a diffuse layer, in which ions are dispersed perpendicularly away
from the electrode surface due to thermal motion. The thickness of the diffuse layer
increases in more dilute solutions. Since the adsorbed (ads) and diffuse (diff) layers are
in series, the equivalent double layer (dl) capacitance can be described by the following
equation
Equation 5-8
At sufficiently high conductivities of electrolytes the thickness of the diffuse layer
decreases (Cdiff increases) [90] and
Equation 5-9
The typical values are in the range of 10 to 40 µF/cm2 [89, 91]. In 2-electrode
configurations, in the absence of any Faradaic processes, the equivalent impedance is
thus described by the series combination of double layer capacitance and solution (bulk)
resistance.

48
The corresponding double layer impedance Zdl is inversely proportional to capacitance
as described by
Equation 5-10
where j is the standard imaginary unit with the property j2 = −1 and ω is angular
frequency. Thus as the electrode area increases, the double layer capacitance
increases and in turn the impedance decreases. For 4-electrode configurations, the
contribution of the double layer capacitance is negligible and equivalent impedance is
found by a parallel combination of bulk resistance and capacitance.
5.2.2 Bulk Impedance Bulk resistance for coplanar electrodes is given by
Equation 5-11
where ρ is the measured resistivity of the focused stream, κ is geometric factor called
the cell constant. This equation holds for the 2- and 4-electrode systems although the
expression for cell constant is different in each case.
The bulk capacitance of the 4-electrode system is inversely proportional to its cell
constant. The cell constant of the 4-electrode configuration can be estimated using a
point-electrode model shown in Figure 5-3. The model consists of four electrodes that
are located on the surface of the glass slide. The electrodes are in contact with the
focused sample stream of thickness z which is sandwiched by the sheath stream from
the top. The resistivity of glass ρGlass is assumed to be infinite for the purpose of this
model.

49
Using the imaging method the cell constant can be approximated to the first order by
2Γ√
Equation 5-12
where a is the distance between current and sense electrodes and b is the distance
between sense electrodes [92]. The interface between the high conductivity focused
stream and low conductivity sheath stream is seen as a semi-transparent mirror having a
reflection coefficient Γ defined as
Γ Equation 5-13
where ρ1 and ρ2 are the resistivities of sample and sheath fluids respectively [93]. In an
aqueous solution, there is also a capacitive pathway for the current, which can be
modeled as a capacitor in parallel with the resistance of the sample.
Figure 5-3: A point-electrode model for the tetrapolar configuration where the current is injected in the outer two electrodes and voltage is sensed from the inner two. The distance between current and sense electrodes is a and between sense electrodes is b. The conductive focused stream with resistivity ρ1 has a height x. The non-conductive sheath with resistivity ρ2 extends infinitely above the focused stream in this model.

50
The bulk capacitance is given by
where ε0 is the permittivity of vacuum and εr is the relative permittivity of the conductive
PBS [94]. The permittivity of ionic solutions is inversely proportional to conductivity and
approaches the permittivity of water (~78) as the conductivity decreases [95, 96]. For the
frequency range of 1k Hz used in our data, the permittivity can be assumed to be
constant [95]. From Equations 5-11 and 5-12 it can be seen that as the thickness of the
focused stream decreases, the resistance increases while Equation 5-14 suggests that
bulk capacitance decreases as the focused layer thickness decreases. The cell constant
for a 2-electrode model has been found using conformal mapping techniques elsewhere
[94, 97].
5.3 Methods and Fabrication
5.3.1 Electrode Fabrication Standard photolithography techniques were used to fabricate the electrodes.
Borosilicate glass microscope slides (Daigger, Vernon Hills, IL ) were used as the
substrate. The slides were thoroughly cleaned to allow good adhesion of electrodes to
the glass surface. The slides were initially cleaned with HCl:MeOH 1:1 v:v for 30 minutes
and then rinsed with water. This was followed by immersion in H2SO4 for 30 minutes and
then rinsing in water. Finally, the slides were placed in 100°C water for 10 minutes and
dried with nitrogen.
Clean slides were dehydrated on a 150°C plate for 5 minute and subjected to O2
plasma for 4 minutes just before the photolithography step. A 1μm thick layer of negative
photoresist (NR7 1000PY-Futurex, Franklin, NJ) was patterned using a transparency
Equation 5-14

51
mask (Pageworks, Boston, MA). An electron beam evaporator was used to deposit a film
of gold (300 nm) onto the slides with a thin film of titanium (30 nm) as the adhesion
layer. The electrodes were defined by photoresist lift-off in acetone. The current
electrodes were 1000 µm wide while the widths of the sense electrodes and the inter-
electrode distances were both 500 µm. A schematic of the electrode device is shown in
Figure 5-4a.
5.3.2 Microchannel The microchannel design used in this study had two inlets for the sheath and sample
fluids and one outlet. The sheath inlet (0.5 x 1 mm2) was oriented at 90° with respect to
the sample and focusing channels. The sample channel had a smaller cross-section
(0.15 x 0.3 mm2) than the focusing channel (0.25 x 1 mm2); the sheath fluid focused the
sample from the sides as well as the top with this geometry. The length of the channel
from the sample inlet to the outlet was 30 mm.
The devices were milled from polymethyl methacrylate (PMMA) (Plexiglas G, Atofina
Chemical, Inc. Philadelphia, PA) using a HAAS Mini Mill (HAAS Automation, Inc.,
Oxnard, CA). The sheath inlet and the focusing channel were machined with a 0.254mm
long-reach endmill, and a 0.787mm endmill respectively. The sample channel was
machined with a 0.254mm endmill (Harvey Tool, Rowley, MA). A 0.5mm wide trench
was milled around the microchannel and inlets using a 0.381mm endmill. This trench
prevents the glue from running into the microchannel [98]. A bench top drill press was
used to widen the upper half of the inlets and outlet where 0.58mm wide metal tubing
was inserted and glued into place using 5-minute epoxy (Devcon, Danvers, MA).

52
The PMMA pieces with milled microchannels and metal tubing were glued to the
microscope slides with prepared electrodes and antibodies using UV-curable adhesive
(Optical adhesive #72, Norland Products, Cranbury, NJ). Figure 5-4b shows the
representation of a fully assembled device.
5.3.3 Immobilization Chemistry The electrode patterned slides were cleaned with O2 plasma for 2 minutes prior to
protein immobilization. To immobilize the antibody directly onto the gold electrode, the
procedure used by Chatrathi et al. was employed [99]. Briefly, 250 µg of goat anti-E. coli
antibody (2 mg/ml in PBS, Fitzgerald Industries International, Concord, MA) was
incubated with 40µl 20 mM sulfo-LC-SPDP(Pierce, Rockford, IL) for 60 minutes at room
temperature with mixing. To the mixture, 150 mM DTT in acetate buffer pH 4.5 was
Figure 5-4: (a) A top-view schematic of the gold electrodes and microfluidic channel, along with their corresponding dimensions. Outer electrodes (1 and 3) supply current while the inner two (2 and 4) sense the signal. The width of the sensing electrodes as well as the spacing between them is 0.5 mm while the current electrodes are 1mm wide. The sample channel width is 0.3mm which increases to 1mm in the focusing channel. (b) Figure of an assembled microchannel and electrodes. The channel machined in PMMA is glued to the glass slide using a UV curable glue. The inset shows the channel junction where sheath and sample streams meet.

53
added and incubated with mixing for 30 min. The entire mixture was then exposed to
the gold electrodes for 60 minutes. The slides were rinsed with water, dried, and stored
at 4°C until use.
5.3.4 E. coli Assay Preparation The cells used for this study were E. coli rosetta and were cultured in LB broth with
1% glucose and 0.1% ampicillin. For the assays, 1.5 mL of cell culture was spun down
in an Eppendorf tube at 3000 rpm for 5 min. The supernatant was removed and 1 mL 50
mM borate buffer pH 8.0 was added to the cells. A tube of Cy3 monoreactive
succinimide ester (GE Health care, Piscataway, NJ) was dissolved in 50 µL DMSO.
Fifteen microliters of the dye was added to the cell solution and the sample was
incubated for 30 min at room temperature in the dark with shaking. The cells were
respun and the supernatent was removed. The cells were washed 3 times with PBS pH
7.4 (Sigma Chemical, St Louis, MO) and stored in 1 ml PBS at 4°C until use. The cells
were used within 24 hours. Cell concentrations were typically 109 cfu/ml.
5.3.5 Flow Simulations Finite element modeling of the channels was performed using the COMSOL
Multiphysics finite element analysis package (COMSOL Inc., Palo Alto CA). The
channel dimensions in the model were chosen to be identical to the ones used in
experiment. However, in order to reduce computation time, only half of the width of the
channel was used in simulations, assuming channel symmetry.
Relative sample and sheath flow rates were varied to simulate changing cross-
sectional area of the focused stream. The simulations were conducted in two steps. In
the first step, the flow model was solved for incompressible flow. A zero-slip velocity
boundary condition was assumed on the channel walls. The inlet boundary conditions

54
were specified by the desired volumetric flow rate, and outlet boundary conditions were
fixed at atmospheric pressure. Flow in the inlets was specified to be fully developed.
After the velocity field was determined, the second step simulated mass transport to
provide the concentration distribution, assuming a diffusion coefficient typical of a low
molecular weight solute (1x10⁻⁹ m2/s). The presence of conducting ions in sample
stream had an initial concentration of 1 in the diffusion/convection simulation. Similarly,
the initial concentration of the sheath stream, which was devoid of ions, was chosen to
be 0. An automesh with tetrahedral elements was used for all simulations. In order to
accurately resolve the mass transport along the interface between the sheath and
sample streams, adaptive meshing was used to increase mesh density in subsequent
simulations. The mesh refinement process was repeated until no change in result was
observed (h-method). It was assumed that there were no chemical reactions and the
ionic nature of the sample does not affect the outcome of simulations; therefore the only
factors affecting the distribution of the model species were diffusion and convection.
The details of the multiphysics modules and the equations used to define flow and mass
transport characteristics were previously [88].
5.3.6 Confocal Microscopy Visualization of flow focusing in the channel was performed using a Nikon Eclipse
TE2000-E inverted microscope equipped with a Nikon D-Eclipse C1si confocal spectral
imaging system (Nikon, Japan). Confocal images were obtained by scanning in the
region downstream from where the sheath and sample streams intersect. The
hydrodynamic focusing experiments were performed using de-ionized water for the
sheath flow and de-ionized water mixed with FWT Red Powder fluorescent dye (Bright
Dyes, Miamisburg, OH) for visualization of the flow from sample stream inlet.

55
A dual syringe pump (Harvard Apparatus Model 33) provided precise control of the
flow rates and flow-rate ratios. Confocal microscopy was performed using a 10X
objective (NA 0.45, WD 4.00 Dry). Image resolution was 512 x 512 pixels, with a Z-step
size spacing of 5 µm and a pixel dwell time of 7.06 µsec. A 40 mW Argon laser was
used at the 514.5 nm excitation line, and the spectral detector of the confocal imaging
system was set to detect emission between 583-593 nm. Image stacks were rendered
and analyzed in three-dimensions using NIS-Elements AR confocal image processing
software (Nikon, Japan).
5.3.7 Electrical Impedance Measurements An Agilent 4284A LCR meter was used to perform all 2- and 4-electrode impedance
measurements using a 10 mV, 1 kHz signal. For the 2-electrode system, the current
was applied and the response was measured from the inner two electrodes. Baseline
measurements were performed after bovine serum albumin (BSA) was passed through
the channel to prevent nonspecific binding. Phosphate buffer solution (PBS) with a
conductivity of 12.8 mS/cm was used as the sample fluid, and deionized (DI) water with
a conductivity of 0.08 mS/cm was used as the sheath fluid. Impedance data was
collected at different sheath-to-sample flow-rate ratios (FRRs) and flow velocities. In
order to increase the focusing, the FRR was increased by increasing the sheath flow
rate while the sample flow rate remained constant at 2 µL/min. In other cases, flow rates
of both sheath and sample were increased proportionally to maintain a FRR of 50. A
Labview program was developed to control the syringe pump and automate data
collection from the LCR meter. After the baseline measurements were completed, E.
coli was passed through the channel and allowed to settle and bind for 20 minutes to the
immobilized antibodies. Unbound bacteria were flushed out of the channel, and
impedance measurements were conducted. Both baseline and E. coli measurements

56
were repeated three times. Resistance and reactance values were extracted from the
measured impedance data.
5.4 Results and Discussion
5.4.1 COMSOL Simulations and Confocal Microscopy Figure 5-5 illustrates transverse slices of the COMSOL simulations of a microfluidic
channel for FRRs of 25 and 100. Since only half of the channel was simulated, the
cross-sections were mirrored and stitched to allow easier comparison with confocal
images. All cross-sections were taken 3mm downstream from sheath inlet. The
electrodes are positioned at the bottom surface along the length of the channel. The
concentration value of 0 of the nonconductive sheath fluid is shown as blue and the
concentration value of 1 of the conductive sample fluid is shown as red. The
intermediate colors signify the diffusion between the two streams. Figure 5-5 shows
confocal microscopy images of an actual channel with a 0.25 mm height and 1 mm
width. The decrease in image brightness in confocal images is attributed to the diffusion
between the sheath and sample fluids.

57
The channel cross-sections from simulations and confocal demonstrate how the
sheath fluid focused the sample stream from both sides and the top, resulting in a half
ellipse-shaped focused stream. Furthermore, both modes of investigation show that an
increase in FRR resulted in greater flow focusing toward the electrode surface. The
degree of focusing at a specified FRR was roughly the same for both simulations and
confocal experiments. The width of the focused stream remained fairly constant due to
the geometry of the channel but the change in the height was significant. Thus the
effective cross-section of the sample fluid was significantly reduced without minimizing
the physical dimensions of the channel.
As the FRR became higher, the sample stream was focused more and thus pushed
closer to the bottom channel wall. The focused layer heights for FRR of 25 and 100 were
roughly 64μm and 30μm respectively. The velocity profiles for the flow in the focusing
channel are parabolic. Although the fluid was flowing faster and the residence time was
Figure 5-5: COMSOL simulations (top) and the corresponding cross-section images from confocal microscopy (bottom) with sheath-to-sample flow-rates of 50:2 and 200:2 (in µL/min). The same channel was used for the confocal experiment in both cases. The outline shows the boundary of the channel. The diffusion co-efficient for the simulations was 109 m2/s. The concentration is specified by the color bar with 0 (blue) as the minimum and 1 (red) as the maximum. The intermediate colors show diffusion region between the sheath and sample streams. The confocal cross-sections were taken 3mm downstream from the junction where sheath and sample streams met.

58
smaller when FRR was 100, the characteristic length over which the diffusion took place
was also more significant as compared to focused layer height. The higher FRR resulted
in a smaller cross-sectional stream with lower overall concentration of sample
electrolyte. In confocal images, this lowering of sample concentration manifested as a
reduction in brightness of the focused region for 200:2 µL/min as compared to 50:2
µL/min and was also accurately predicted by the simulations (Figure 5-5).
Diffusion in parallel laminar flow streams inside microchannels has been studied
previously [100-102] and has also been used for biosensing applications [103, 104].
However, for impedance sensors that rely on flow-focusing for enhancement of detection
sensitivity, this diffusion has deleterious effects. The electric field confinement relies on a
sharp gradient between the conducting sample and non-conducting sheath streams.
Therefore, any mixing due to transverse diffusion between sheath and sample fluids
reduces the confinement of the electric field. The overall effect is a loss in detection
sensitivity.
5.4.2 Baseline and E. coli Measurements Baseline and E. coli measurements were performed using 2- and 4-electrode
configurations at different FRRs (25, 50, and 100). The resistance and reactance
components of the impedance were measured using the LCR meter, and resistance and
capacitance values were extracted assuming parallel RC circuit for the 4-electrode case
and series RC circuit for the 2-electrode case.
Table 5-1 and Table 5-2 list mean values and standard deviations of three repeated
impedance measurements using the 2- and 4-electrode configurations.
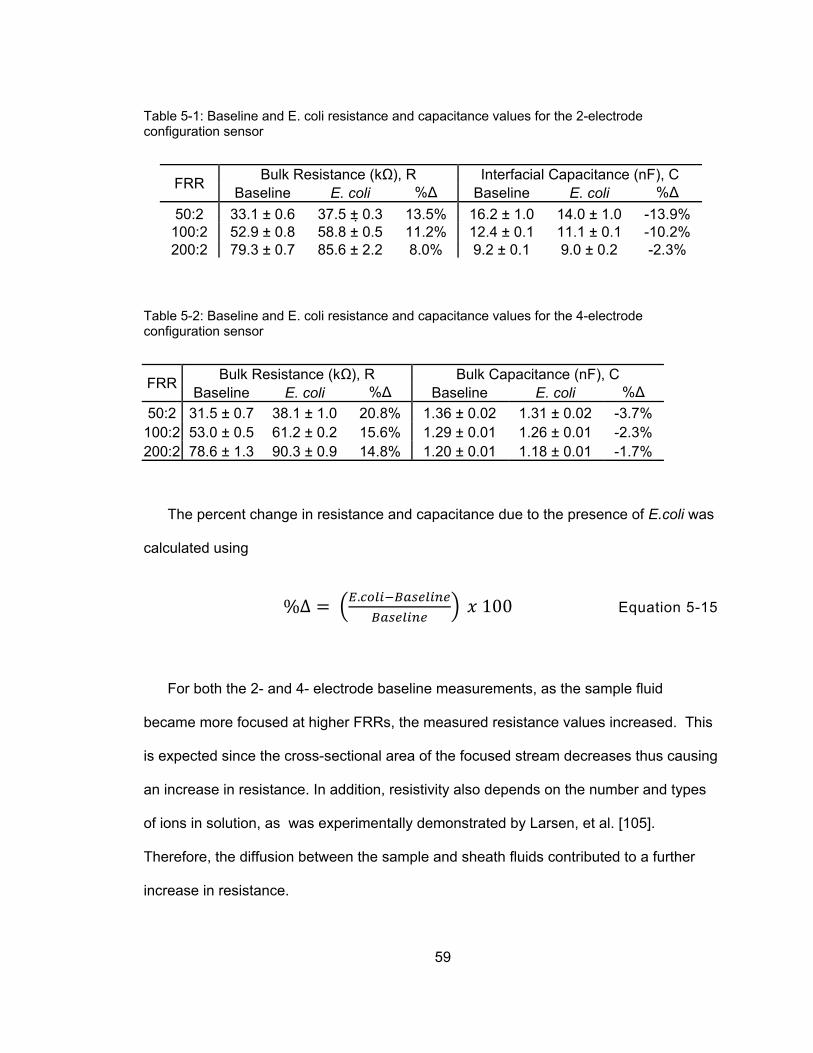
59
The percent change in resistance and capacitance due to the presence of E.coli was
calculated using
%Δ . 100 Equation 5-15
For both the 2- and 4- electrode baseline measurements, as the sample fluid
became more focused at higher FRRs, the measured resistance values increased. This
is expected since the cross-sectional area of the focused stream decreases thus causing
an increase in resistance. In addition, resistivity also depends on the number and types
of ions in solution, as was experimentally demonstrated by Larsen, et al. [105].
Therefore, the diffusion between the sample and sheath fluids contributed to a further
increase in resistance.
Table 5-2: Baseline and E. coli resistance and capacitance values for the 4-electrode configuration sensor
FRR Bulk Resistance (kΩ), R Bulk Capacitance (nF), C Baseline E. coli %Δ Baseline E. coli %Δ
50:2 31.5 ± 0.7 38.1 ± 1.0 20.8% 1.36 ± 0.02 1.31 ± 0.02 -3.7% 100:2 53.0 ± 0.5 61.2 ± 0.2 15.6% 1.29 ± 0.01 1.26 ± 0.01 -2.3% 200:2 78.6 ± 1.3 90.3 ± 0.9 14.8% 1.20 ± 0.01 1.18 ± 0.01 -1.7%
Table 5-1: Baseline and E. coli resistance and capacitance values for the 2-electrode configuration sensor
FRR Bulk Resistance (kΩ), R Interfacial Capacitance (nF), C Baseline E. coli %Δ Baseline E. coli %Δ
50:2 33.1 ± 0.6 37.5 ± 0.3 13.5% 16.2 ± 1.0 14.0 ± 1.0 -13.9% 100:2 52.9 ± 0.8 58.8 ± 0.5 11.2% 12.4 ± 0.1 11.1 ± 0.1 -10.2% 200:2 79.3 ± 0.7 85.6 ± 2.2 8.0% 9.2 ± 0.1 9.0 ± 0.2 -2.3%

60
For the 2-electrode baseline measurements, the reduction in interfacial capacitance
with increased FRR was mostly due to the decrease in the width of the focused stream
which effectively decreased the electrode area as described by Equation 5-8. In the 4-
electrode system, the slight decrease in the bulk capacitance was attributed to an
increase in cell constant (Equation 5-14). As seen from Equation 5-12, the cell constant
is inversely proportional to the focused layer height, which decreased with increasing
FRR.
The resistance and capacitance values with immobilized E. coli followed the same
trend as the baseline measurements. The presence of E. coli caused an increase in the
resistance and a decrease in capacitance in both configurations. Bacteria and other cells
act as insulators due to the impermeability of cell membrane at low frequencies [106].
The increase in resistance demonstrated that the E. coli were insulating and partially
blocking the current paths on the electrodes, and thus contributed an additional
impedance component to the system. The presence of insulting bacteria resulted in a
decrease in capacitance which was due to a decrease in the effective electrode area as
per Equation 5-8. The two-electrode system was more sensitive to changes at the
electrode surface, as is highlighted by a greater change in capacitance due to the
presence of the E. coli cells on the electrodes.
Interestingly, when the FRR was increased, the percent change in resistance and
capacitance decreased. This effect is attributed to the diffusion of ions from the
conducting stream into the non-conducting sheath fluid. As shown earlier, the amount of
diffusion was roughly the same, but the characteristic length over which the diffusion
occurred became more significant as the cross-sectional area of the focused stream
decreased. This increased the bulk resistance and competed with the insulating effect of

61
the E. coli. The overall effect was a decrease in percent change in resistance as FRR
increased. From Equations 5-11 and 5-14, it can be seen that an increase in resistivity
also caused an increase in the capacitance which counteracted the decrease in
capacitance due to presence of cells on the electrodes. Overall, the percent change in
capacitance decreased slightly as FRR was increased. Thus as the sample fluid became
more focused, the diffusion had more impact on the measured data (also seen in Figure
5-5).
The amount of diffusion between the sheath and sample is dictated by the residence
time or the time sheath and sample streams are in contact with each other and the
distance over which transverse diffusion takes place. As the FRR increased, fluid flowed
faster in the channel and decreased the residence time and, therefore, the diffusion of
the ions out of the sample fluid. At the same time, increasing the FRR pushed the
focused stream closer to the channel wall decreasing the mean distance of an ion to the
sample-sheath interface.
In order to delineate these two phenomena, confocal microscopy, simulations and
impedance measurements were performed for cases with same FRR but with increasing
sheath and sample flow velocities. As the fluid flowed faster, the residence time
decreased and resulted in less diffusion within a fixed distance. Figure 5-6 shows
confocal images of sample only, and sheath-to-sample flow rates of 50:1, 100:2 and
200:4 µL/min. All three cases have FRR equal to 50; however, the sheath and sample
fluids of the 200:4 ratio were flowing 4-times faster (13.6 mm/s).

62
Both confocal images and simulations show that there was relatively little change in
focused stream height since the FRR was unchanged. The results also showed that
more diffusion occurred when the fluids were flowing slower, as signified by the loss in
brightness of the focused region at slower flow velocities. COMSOL simulation results
further confirmed this finding. Based on the results shown in Figure 5-5 and Figure 5-6, it
is clear that in order to improve the detection sensitivity, without introducing the
deleterious effects of diffusion, both the FRR and absolute flow velocities must be
increased simultaneously.
At the highest flow velocities, 200:4 µL/min and 500:10 µL/min in Figure 5-6, as the
Re increased, the sheath stream lost its ability to focus the sample stream from the sides
and this resulted in widening of the focused stream along the bottom surface of the
channel wall. A further increase in the flow velocities led to the splitting of the sample
Figure 5-6: (a) Confocal images for sheath-to-sample flow rates (in μL/min) of 50:1, 100:2 and 200:4 (FRR = 50) are shown. The contrast was adjusted by same measure for all cross-sections to allow easier visualization of focused stream. (b) Channel cross-sections show concentration distributions from COMSOL simulations. Flow velocities of both sheath and sample streams were increased proportionally to maintain the FRR at 50. The diffusion coefficient was 1 x10⁻⁹ m2/s for all cases. The concentrations are specified by the color bar with 0 (blue) as the minimum and 1 (red) as the maximum.
50:1
200:4
500:10
50:1

63
stream into two focused streams. The optimal condition for this design to provide
maximum focusing but with the least effect of diffusion appears to be for sheath-to-
sample flow rates of 100:2 µL/min (FRR = 50, Re = 2.7). The diffusion between sheath
and sample fluid can also be reduced by using ionic species with slower diffusion
coefficients or by using fluids that are immiscible i.e. two-phase. However, two-phase
parallel flows are only possible in narrow FRR regime and more generally result in
droplet formation [107].
Impedance measurements were performed at FRRs of 25 and 50 using the 4-
electrode configuration. The sample flow rates were set to 2, 4, 8, and 16 μL/min, and
the sheath flow rates were increased accordingly to obtain the corresponding FRR. The
Figure 5-7: Sample and sheath flow rates were increased while keeping the FRRs constant (-- --= FRR of 50, —♦— = FRR of 25). Sheath flow rates are: FRR x Sample flow rate. A 4-electrode configuration was used to measure (a) resistance and (b) capacitance.

64
plot in Figure 5-7 shows that the resistance decreased as flow velocities increased due
to a decrease in diffusion. The values of capacitance were largely unaffected.
5.5 Conclusions A two-dimensional (2D) flow focusing technique was implemented for a modified T-
junction design. Two- and four-electrode configurations for impedance measurements
were characterized for detection sensitivity. Measuring a change in resistance using the
4-electrode configuration was the most sensitive technique to detect the presence of E.
coli at low frequencies in a flow focusing system. The 2-electrode technique showed a
greater percent change in capacitance than the 4-electrode sensor because the cells
were bound to the electrode surface and the 2-electrode configuration is more sensitive
to changes at the electrode interface. The fact that the percent change in impedance
decreased with increasing FRRs indicated that the presence of the bacteria became less
significant with increased focusing, even though they represented a higher proportion of
the cross-sectional area of the conducting stream. This effect was attributed to the
increased effect of the diffusion of ions out of the focused stream as the focused stream
height decreased. One way to reduce diffusion was to increase the actual sheath and
sample flow velocities in addition to increasing the FRR. Diffusion must be properly
controlled in order to prevent a loss in detection sensitivity using flow focusing and
impedance measurements.

65
Chapter 6 Multi-Device, Multi-Electrode Bio-Impedance System
6.1 Introduction Impedance spectroscopy (or bio-impedance) offers a non-destructive, non-invasive,
label-free technique to continuously monitor and quantitatively characterize biological
cells. This technique, applied to adherent cells, is also referred to as electric cell-
substrate impedance sensing (ECIS). Researchers Giaever and Keese pioneered the
design and development of the ECIS technique and system [108]. In this technique, a
small AC signal is applied, and the resulting voltage or current is measured across a pair
of electrodes. The impedance of the system is calculated to obtain frequency-dependent
data of the electrode-cell system. When cells attach and spread onto the electrodes,
their insulating membranes cause an in increase in impedance. Strikingly, changes in
cell morphology, viability, death, and micromotion can be detected with high sensitivity,
even prior to changes observed microscopically [2, 8].
The majority of electrode designs for the ECIS system and similar impedance-based
microelectrode devices contain (1) a single electrode [4, 74], (2) parallel (connected)
electrodes [17, 56], or (3) interdigitated electrodes (IDEs) [109, 110]. The IDEs and
parallel electrodes cover more surface area and measure a greater quantity of cells thus
resulting in an averaging of the changes across the cell culture. On contrast, the single
electrode design typically only covers a very small percentage of the cell culture area
and thus, does not provide encompassing data of the cell culture in its entirety.
Therefore, a major challenge in ECIS is the collection of statistically-significant data from

66
single culture wells. A solution to this problem is via incorporation of independent
electrodes within a cell culture to enhance the spatial resolution and statistical analyses
of impedance measurements.
Few designs have implemented multiple independent electrode measurements
within a cell culture. Wegener et al. [111], for example, designed a device with a row of 4
independent working electrodes (2 mm-diameter) to conduct trans-epithelial and trans-
endothelial electrical resistance (TER) measurements of cell cultures. Their multi-
electrode design allows one to measure local inhomogeneities within the cell culture
[111]. Similarly, Arndt et al. [9], developed a device with 3-independent electrodes (4
mm-diameter) on a microscope slide. In both studies, quantitative analyses and
comparisons of the individual electrodes were not demonstrated. Additionally, the large
sensing (working) electrodes result in a greater averaging effect than if microelectrodes
were used.
Giaever and Keese have developed the ECIS technique into a commercial system
(available through Applied Biophysics) that allows real-time impedance measurements
inside a humidified incubator. A variety of electrode designs are offered, including single
electrode devices, IDEs, and a device with 2 independent working electrodes (250 µm)
within a cell culture chamber. While it is a well-known and widely accepted technique [2,
5, 6, 8, 9, 11, 14, 17, 112], its shortcomings include limited frequency range, limited
number of acquired data points, and minimal spatial resolution. In the commercial ECIS
system, the high end of the frequency range is limited by the presence of the passivation
layer over the unexposed gold traces. This coating results in a parasitic capacitance at
higher frequencies, where current preferentially travels through the least resistive
pathway [53].
67
Our approach to enhance spatial resolution and statistically significant data
acquisition is to increase the number of independent working electrodes to obtain
redundant impedance datasets within the same cell culture chamber. Herein, we
present an evaluation of a cell culture chamber with eight independent sensing
electrodes to improve statistical significance of measured data and obtain position-
dependent data across the cell culture. A switching circuit was designed to control four
separate wells to simultaneously evaluate multiple cell cultures and variables. One
challenge in implementing a multi-device, multi-electrode system is analyzing the large
datasets, especially frequency-dependent data. A Matlab program was designed to
automate data analysis and model the data with corresponding (cell or cell-free)
equivalent circuit models. The system was evaluated by investigating the effects of a
cytotoxic agent, arsenic trioxide (As2O3), on the well-established ovarian carcinoma cell
line.
6.2 Methods and Materials
6.2.1 Cell Culture HEY ovarian carcinoma cells were kindly provided by Dr. Gordon Mills (MD
Anderson Cancer Centre, Houston, Texas). The cell line was cultured in RPMI 1640,
supplemented with 8% FBS and penicillin/streptomycin. The cells were maintained in a
humidified incubator containing 95% air and 5% CO2 at 370C. For all experiments, cells
were detached from flasks with trypsin-EDTA solution and seeded into the electrode
devices at a concentration of 500,000 cells/mL prior to any treatment with drugs. Arsenic
trioxide (As2O3) was obtained from Sigma-Aldrich. Cells were treated with varying doses
of As2O3 (0-50μM).

68
6.2.2 Fabrication of 8-Electrode Arrays Four-inch glass wafers were solvent cleaned (acetone and methanol) and dried with
nitrogen. The first photolithography process, with NR1-3000PY (Futurrex) negative
photoresist, was performed to define patterns in the resist in the shape of the electrode
device. Chromium (150 Ǻ) and gold (350 Ǻ) were deposited onto the wafers using an e-
beam evaporator. Subsequently, a lift-off was performed with acetone to remove the
resist and the metal on it, leaving metal only on the defined areas of the wafer. The
wafers were descummed in oxygen plasma to remove any resist residue. Next, the
wafers were solvent cleaned and dehydrated, in preparation for the second lithography
step. This lithography step is performed to passivate the traces with SU8-5 and define
the working electrodes. The lithography ensured that the 250µm-diameter working
electrodes (sensors), counter electrode, and contact pads are exposed. The wafers
were descummed in oxygen plasma at 50 Watts for 2 minutes to remove any resist
residue and to activate the plasma to enhance biocompatibility [113]. The wafers were
then hard baked then diced into individual devices, 20 mm x 21 mm. Cloning cylinders
(10 mm-diameter) were attached to define the culture well around the electrodes. SU8-5
was also used to attach the cylinders and form a tight seal. The devices, with secured
cylinders, were cleaned with IPA and descummed in oxygen plasma to remove any
debris. Lastly, the devices were autoclaved for five minutes to sterilize the devices in
preparation for cell culture. Figure 6-1(a) shows a photograph of the fabricated device.

69
6.2.3 Switch Circuit A switching circuit (Figure 6-1(b)) was designed to rapidly and continuously measure
four separate electrode devices containing eight independent working electrodes. The
circuit was controlled by a Microchip PIC16F688 microcontroller that controlled five shift
registers (Fairchild Semiconductor, 74VHC164), which in turn actuated 36 SPST
(Omron, G6L-1F) relays. Thirty-two relays were used to control each working electrode
(8x4) and the remaining four relays controlled the counter electrode of each device. The
relays were connected to four separate nine-pin pogo pin headers (Mill-Max), which
served as the interface between the switching circuit and the contact pads of the
electrode devices. An SMA connector/cable was used to transmit the working and
counter electrode signals to and from the Agilent 4294A impedance analyzer. After the
circuit board was populated, it was covered with an acrylic conformal coating
(Techspray, 2108-12S) to protect it from the humidity within the incubator; and finally it
was mounted inside of an aluminum box. A separate PCB board, connecting the power
supply, ground, and trigger, was positioned outside of the incubator and connected to
the switching circuit via a ribbon cable. The outside power board also contained a two-
digit LED display to indicate the active electrode being measured.
Figure 6-1: Photographs of (a) fabricated electrode device with attached cloning cylinder and (b) power board and switching circuit before being enclosed in aluminum box.
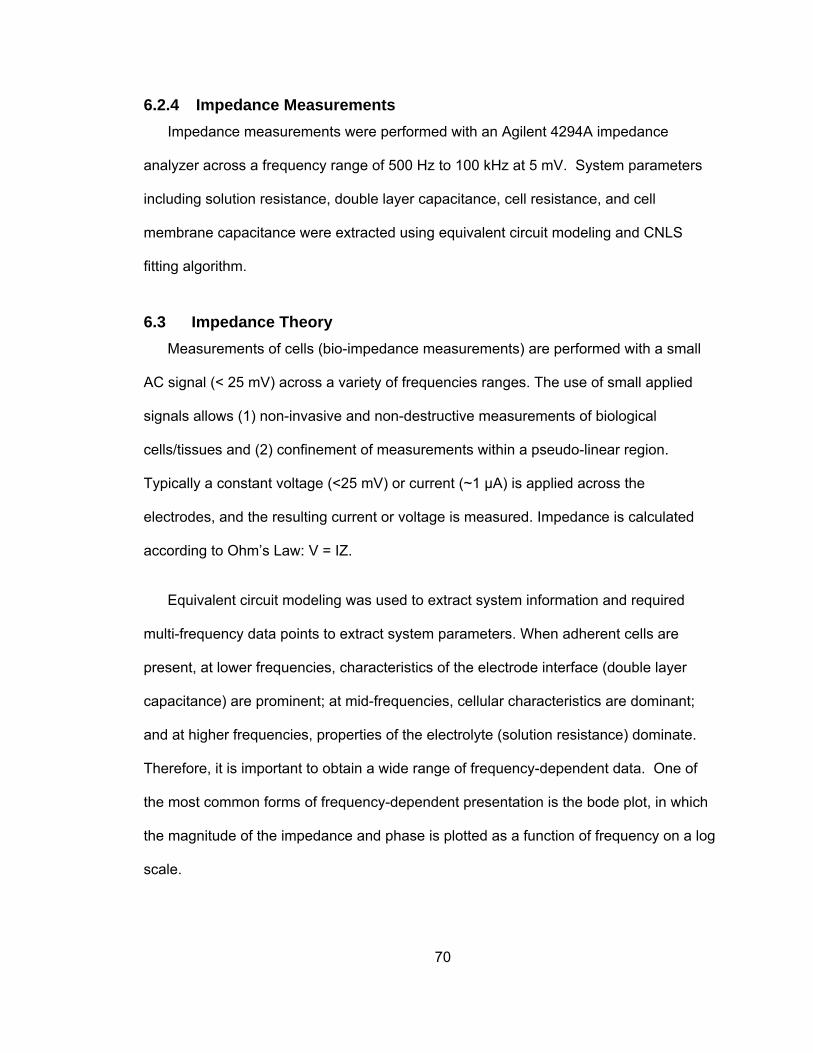
70
6.2.4 Impedance Measurements Impedance measurements were performed with an Agilent 4294A impedance
analyzer across a frequency range of 500 Hz to 100 kHz at 5 mV. System parameters
including solution resistance, double layer capacitance, cell resistance, and cell
membrane capacitance were extracted using equivalent circuit modeling and CNLS
fitting algorithm.
6.3 Impedance Theory Measurements of cells (bio-impedance measurements) are performed with a small
AC signal (< 25 mV) across a variety of frequencies ranges. The use of small applied
signals allows (1) non-invasive and non-destructive measurements of biological
cells/tissues and (2) confinement of measurements within a pseudo-linear region.
Typically a constant voltage (<25 mV) or current (~1 µA) is applied across the
electrodes, and the resulting current or voltage is measured. Impedance is calculated
according to Ohm’s Law: V = IZ.
Equivalent circuit modeling was used to extract system information and required
multi-frequency data points to extract system parameters. When adherent cells are
present, at lower frequencies, characteristics of the electrode interface (double layer
capacitance) are prominent; at mid-frequencies, cellular characteristics are dominant;
and at higher frequencies, properties of the electrolyte (solution resistance) dominate.
Therefore, it is important to obtain a wide range of frequency-dependent data. One of
the most common forms of frequency-dependent presentation is the bode plot, in which
the magnitude of the impedance and phase is plotted as a function of frequency on a log
scale.
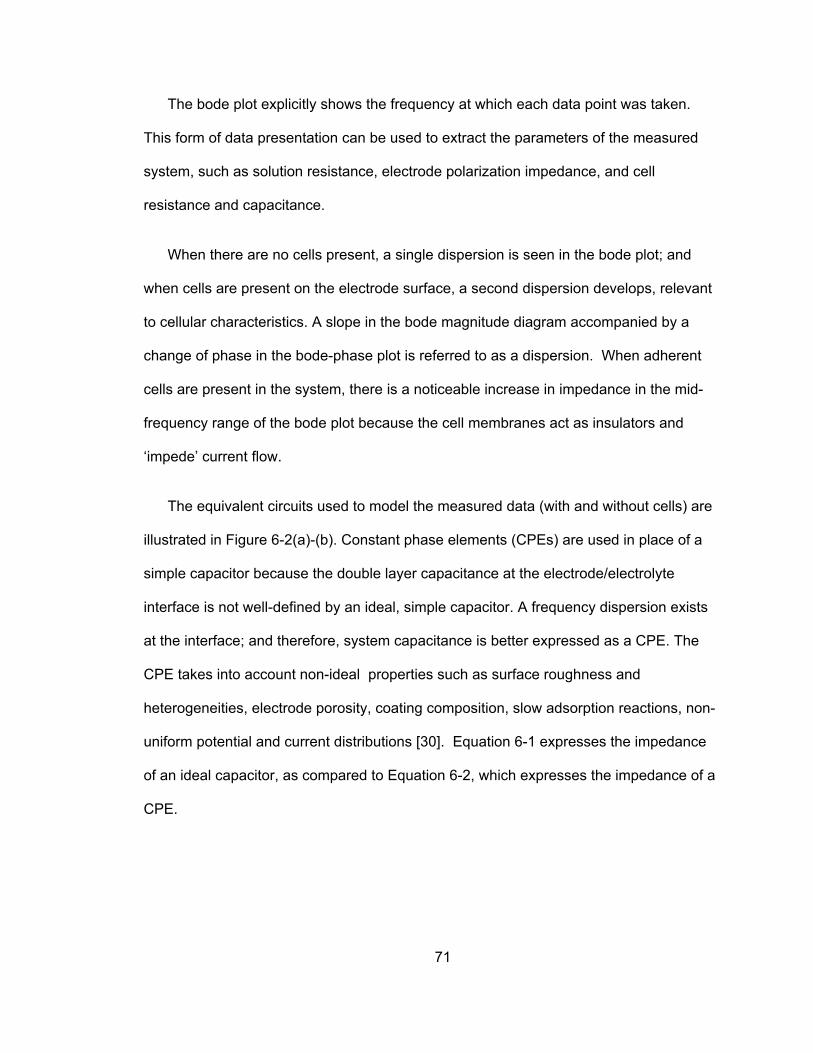
71
The bode plot explicitly shows the frequency at which each data point was taken.
This form of data presentation can be used to extract the parameters of the measured
system, such as solution resistance, electrode polarization impedance, and cell
resistance and capacitance.
When there are no cells present, a single dispersion is seen in the bode plot; and
when cells are present on the electrode surface, a second dispersion develops, relevant
to cellular characteristics. A slope in the bode magnitude diagram accompanied by a
change of phase in the bode-phase plot is referred to as a dispersion. When adherent
cells are present in the system, there is a noticeable increase in impedance in the mid-
frequency range of the bode plot because the cell membranes act as insulators and
‘impede’ current flow.
The equivalent circuits used to model the measured data (with and without cells) are
illustrated in Figure 6-2(a)-(b). Constant phase elements (CPEs) are used in place of a
simple capacitor because the double layer capacitance at the electrode/electrolyte
interface is not well-defined by an ideal, simple capacitor. A frequency dispersion exists
at the interface; and therefore, system capacitance is better expressed as a CPE. The
CPE takes into account non-ideal properties such as surface roughness and
heterogeneities, electrode porosity, coating composition, slow adsorption reactions, non-
uniform potential and current distributions [30]. Equation 6-1 expresses the impedance
of an ideal capacitor, as compared to Equation 6-2, which expresses the impedance of a
CPE.

72
CjZC ω
1= Equation 6-1
( )nCPEjY
Zω1
= Equation 6-2
where ω = 2πf, C is the ideal capacitance, Y is the CPE, and n is a factor between 0 and
1. When n = 1, ZCPE = ZC. The phase angle of ZCPE is equal to –90*n in degrees.
6.4 Results and Discussion
6.4.1 Baseline Impedance Measurements Before cell measurements were performed, baseline measurements were conducted
with potassium chloride (KCl) to determine the variance among electrodes. This is an
important step to confirm that changes in impedance are a function of cell presence, and
not electrode variation. An example of KCl measured in one of the devices is shown in
Figure 6-3. At low frequencies, properties of the electrode-solution interface are seen,
particularly electrode polarization impedance (double-layer capacitance). In the bode
magnitude plot (left-axis) it is indicated by a slope. At higher frequencies, the plateau
signifies the solution resistance. The phase (right-axis) follows the magnitude plot as it
increases from -80 degrees (capacitive) at lower frequencies to less than 15 degrees
(resistive) at higher frequencies. Negligible variation was detected between electrodes.
Figure 6-2: Equivalent circuit used to model (a) cell-free or non-adherent cell data; (b) adherent cell data. Constant phase elements (CPE) are used to account for the non-ideal nature of the system.
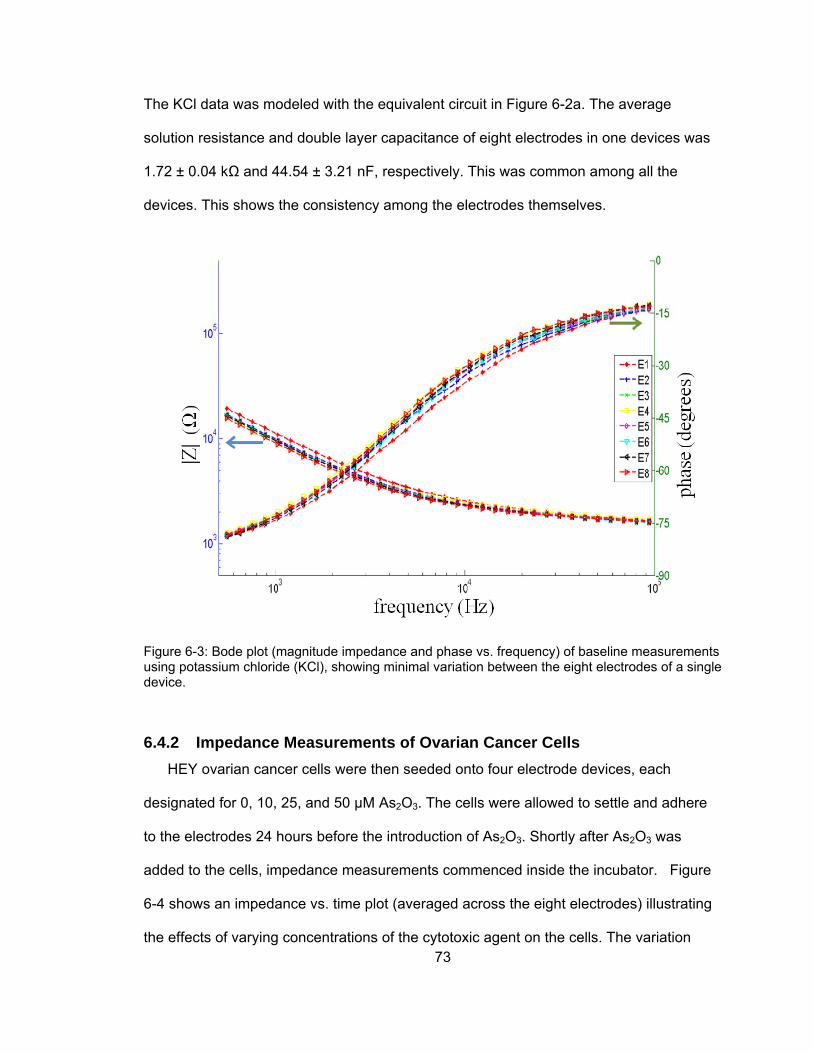
73
The KCl data was modeled with the equivalent circuit in Figure 6-2a. The average
solution resistance and double layer capacitance of eight electrodes in one devices was
1.72 ± 0.04 kΩ and 44.54 ± 3.21 nF, respectively. This was common among all the
devices. This shows the consistency among the electrodes themselves.
6.4.2 Impedance Measurements of Ovarian Cancer Cells HEY ovarian cancer cells were then seeded onto four electrode devices, each
designated for 0, 10, 25, and 50 µM As2O3. The cells were allowed to settle and adhere
to the electrodes 24 hours before the introduction of As2O3. Shortly after As2O3 was
added to the cells, impedance measurements commenced inside the incubator. Figure
6-4 shows an impedance vs. time plot (averaged across the eight electrodes) illustrating
the effects of varying concentrations of the cytotoxic agent on the cells. The variation
Figure 6-3: Bode plot (magnitude impedance and phase vs. frequency) of baseline measurements using potassium chloride (KCl), showing minimal variation between the eight electrodes of a single device.

74
seen in the measured data highlights the importance of performing multiple
measurements within a cell culture. The inset in Figure 6-4 shows an impedance vs.
time plot of the 10 µM As2O3 device, illustrating the individual impedances of the eight
independent electrodes. Two subsets of data are seen in the inset. The impedance of
electrodes #1, 2 and 8 is slightly higher than that of the remaining electrodes (#3, 4, 5, 6,
and 7). According to the layout of the electrode device, electrodes 1, 2, and 8 are
adjacent to each other in the circular array. This demonstrates the enhanced spatial-
resolution of this electrode design by quantitatively illustrating that cells had stronger
adherence and tight junctions within a location-specific area of the cell culture.
In the main plot, the standard deviation (error bars) show the variance among the
independent electrodes for all concentrations of As2O3. As the concentrations increase,
the magnitude of the standard deviations decreases. The average standard deviations of
the impedance over the 24 hour time frame were 2.38, 2.62, 1.03, and 0.35 kΩ for the 0,
10, 25, and 50 µM concentrations respectively. This illustrates the variance of viable cell
cultures. As cells begin to die and detach from the electrode surface, the variance
decreases since there is less variability across a cell-free electrode. This is also
demonstrated by the baseline KCl measurements discussed previously.

75
The data in the main plot confirms that the HEY cells were able to resist 10µM of
As2O3 within the time frame shown; however, increased concentrations of As2O3 affected
the cells and ultimately the cells succumbed and started dying after 3 hours. The
impedance of the cells exposed to 10µM of As2O3 increase above that of the control,
suggesting that the cells formed tighter cell-cell junctions and stronger adherence to the
substratum in an effort to resist the cytotoxic agent. Towards 24 hours, the impedance of
the control (0µM As2O3) cells trended upwards, whereas the impedance of the cells
exposed to 10µM As2O3 began to trend downwards. The impedance of the control cells
steadily increased as the cells adhered and spread onto the electrodes, and
Figure 6-4: Averaged |Z| vs. time at 16.69 kHz of HEY cells introduced to 0, 10, 25, and 50 µM As2O3. Measurements of 8 electrodes have been averaged and the standard deviation (error bars) are shown. (Inset) Shows individual impedances (|Z| vs. time) of the 8 independent electrodes within a single device (10µM As2O3). Location-specific variation is seen in the impedance data.

76
subsequently piled on top of each other. The 10µM As2O3-treated cells began to
succumb to the cytotoxic agent after 22 hours. Further analysis (not shown)
demonstrated that the cells eventually died 40 hours after the introduction of 10µM
As2O3.
Figure 6-5(a)-(d) shows microscopic images of the cells in the electrode devices, 24
hours after the cytotoxic agent was added. The 0 and 10µM As2O3-treated cells
remained confluent on and around the electrode devices; whereas the 25 and 50µM
As2O3-treated cells became detached (rounded cells).
6.4.3 Modeling of Impedance Data Thirty-two frequency-dependent datasets were obtained for each time point, resulting
in thousands of datasets per experiment. The vast amount of data required automated
Figure 6-5: Microscopic images of cells 24 hours after the introduction of (a) 0, (b) 10, (c) 25, (d) 50µM of As2O3. Cells remained confluent in images (a) and (b); whereas the cells became detached (rounded cells) in images (c) and (d).
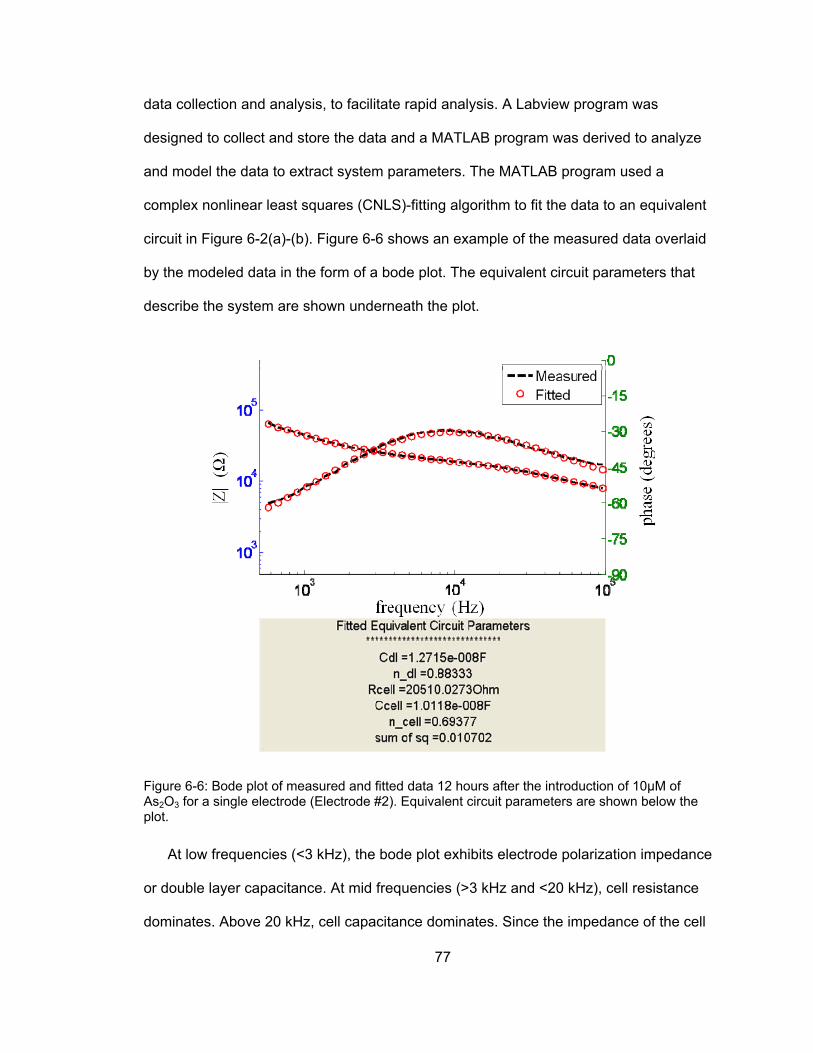
77
data collection and analysis, to facilitate rapid analysis. A Labview program was
designed to collect and store the data and a MATLAB program was derived to analyze
and model the data to extract system parameters. The MATLAB program used a
complex nonlinear least squares (CNLS)-fitting algorithm to fit the data to an equivalent
circuit in Figure 6-2(a)-(b). Figure 6-6 shows an example of the measured data overlaid
by the modeled data in the form of a bode plot. The equivalent circuit parameters that
describe the system are shown underneath the plot.
At low frequencies (<3 kHz), the bode plot exhibits electrode polarization impedance
or double layer capacitance. At mid frequencies (>3 kHz and <20 kHz), cell resistance
dominates. Above 20 kHz, cell capacitance dominates. Since the impedance of the cell
Figure 6-6: Bode plot of measured and fitted data 12 hours after the introduction of 10µM of As2O3 for a single electrode (Electrode #2). Equivalent circuit parameters are shown below the plot.
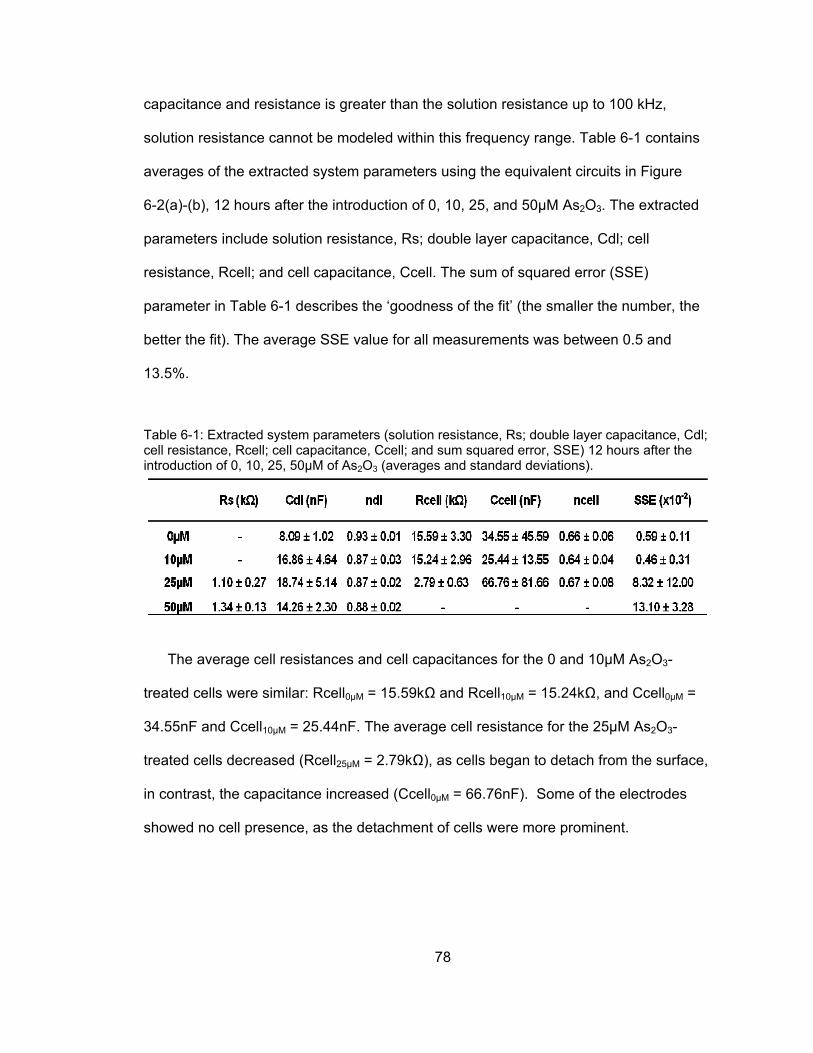
78
capacitance and resistance is greater than the solution resistance up to 100 kHz,
solution resistance cannot be modeled within this frequency range. Table 6-1 contains
averages of the extracted system parameters using the equivalent circuits in Figure
6-2(a)-(b), 12 hours after the introduction of 0, 10, 25, and 50µM As2O3. The extracted
parameters include solution resistance, Rs; double layer capacitance, Cdl; cell
resistance, Rcell; and cell capacitance, Ccell. The sum of squared error (SSE)
parameter in Table 6-1 describes the ‘goodness of the fit’ (the smaller the number, the
better the fit). The average SSE value for all measurements was between 0.5 and
13.5%.
The average cell resistances and cell capacitances for the 0 and 10µM As2O3-
treated cells were similar: Rcell0µM = 15.59kΩ and Rcell10µM = 15.24kΩ, and Ccell0µM =
34.55nF and Ccell10µM = 25.44nF. The average cell resistance for the 25µM As2O3-
treated cells decreased (Rcell25µM = 2.79kΩ), as cells began to detach from the surface,
in contrast, the capacitance increased (Ccell0µM = 66.76nF). Some of the electrodes
showed no cell presence, as the detachment of cells were more prominent.
Table 6-1: Extracted system parameters (solution resistance, Rs; double layer capacitance, Cdl; cell resistance, Rcell; cell capacitance, Ccell; and sum squared error, SSE) 12 hours after the introduction of 0, 10, 25, 50µM of As2O3 (averages and standard deviations).

79
Therefore, some electrodes within this device were modeled with the cell-free
equivalent circuit. At 12 hours, the 50µM As2O3-treated cells showed no presence of
adherent cells on the electrodes, as the majority of the cells detached from the electrode
surface as a result of cell death.
In Figure 6-7(a), the electrodes in the 0 and 10 µM As2O3 wells show some location-
specific variation, with an average cell resistance value close to 15 kΩ. This
demonstrates that within certain areas of the cell culture, the cells had a stronger
adherence to the substratum and each other than in other areas. Similarly, Figure 6-7(b)
shows some variance in cell capacitance, though an outlier exists from electrode 5 in the
0 µM As2O3 well. The lower resistance and significantly higher capacitance of electrode
5 indicates that the cells did not adhere as well, and highlights the importance of making
multiple measurements within a cell culture, to account for such variations. The 10 µM
As2O3 well had similar properties to that of the control because the toxin had a negligible
effect on the HEY cells at 12 hours. A difference, however, is seen in the double-layer
capacitance (Table 6-1), which increased with the addition of As2O3. This increase
occurred in all As2O3-containing cell cultures and could be attributed to the change in ion
concentration with the addition of As2O3 to the culture medium.
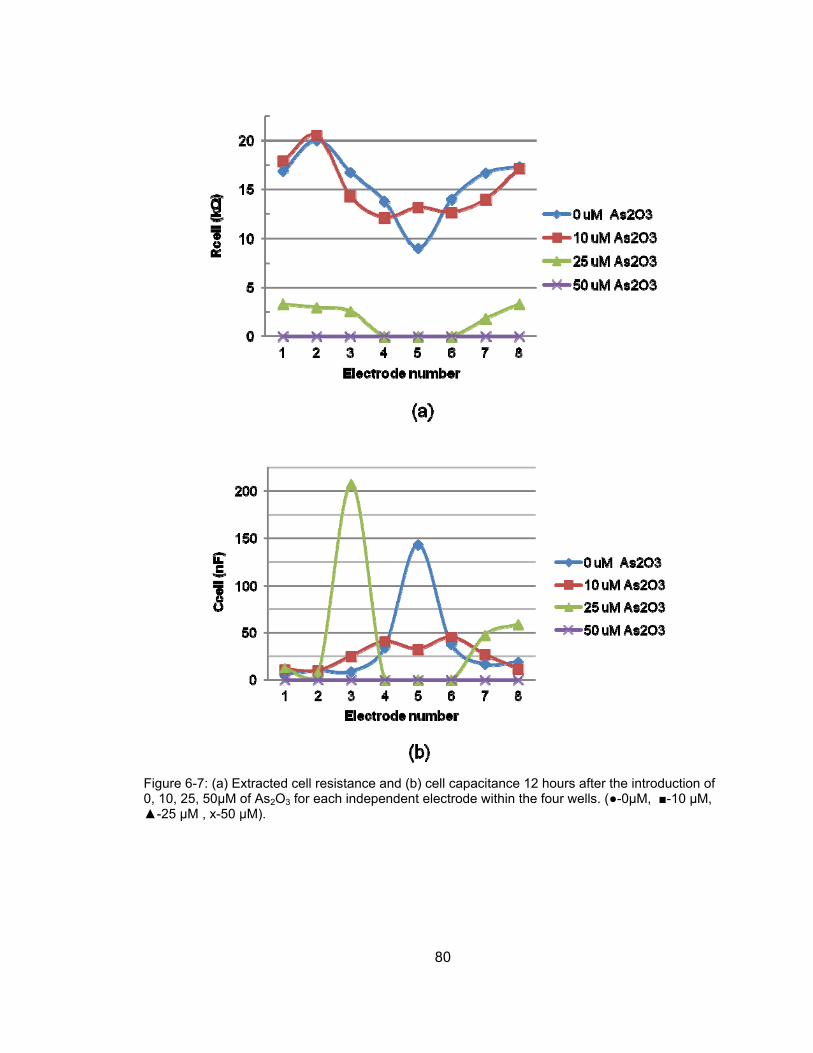
80
Figure 6-7: (a) Extracted cell resistance and (b) cell capacitance 12 hours after the introduction of 0, 10, 25, 50µM of As2O3 for each independent electrode within the four wells. (-0µM, -10 µM, -25 µM , x-50 µM).
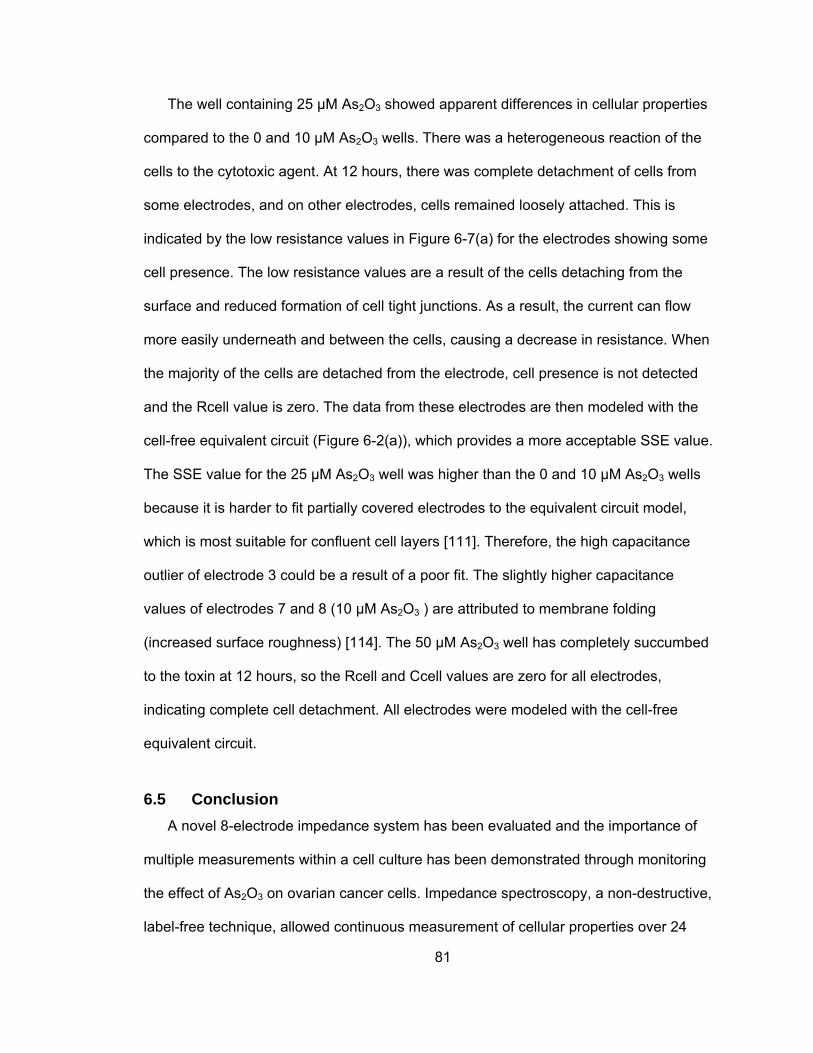
81
The well containing 25 µM As2O3 showed apparent differences in cellular properties
compared to the 0 and 10 µM As2O3 wells. There was a heterogeneous reaction of the
cells to the cytotoxic agent. At 12 hours, there was complete detachment of cells from
some electrodes, and on other electrodes, cells remained loosely attached. This is
indicated by the low resistance values in Figure 6-7(a) for the electrodes showing some
cell presence. The low resistance values are a result of the cells detaching from the
surface and reduced formation of cell tight junctions. As a result, the current can flow
more easily underneath and between the cells, causing a decrease in resistance. When
the majority of the cells are detached from the electrode, cell presence is not detected
and the Rcell value is zero. The data from these electrodes are then modeled with the
cell-free equivalent circuit (Figure 6-2(a)), which provides a more acceptable SSE value.
The SSE value for the 25 µM As2O3 well was higher than the 0 and 10 µM As2O3 wells
because it is harder to fit partially covered electrodes to the equivalent circuit model,
which is most suitable for confluent cell layers [111]. Therefore, the high capacitance
outlier of electrode 3 could be a result of a poor fit. The slightly higher capacitance
values of electrodes 7 and 8 (10 µM As2O3 ) are attributed to membrane folding
(increased surface roughness) [114]. The 50 µM As2O3 well has completely succumbed
to the toxin at 12 hours, so the Rcell and Ccell values are zero for all electrodes,
indicating complete cell detachment. All electrodes were modeled with the cell-free
equivalent circuit.
6.5 Conclusion A novel 8-electrode impedance system has been evaluated and the importance of
multiple measurements within a cell culture has been demonstrated through monitoring
the effect of As2O3 on ovarian cancer cells. Impedance spectroscopy, a non-destructive,
label-free technique, allowed continuous measurement of cellular properties over 24

82
hours, without adversely affecting the cells. The data illustrated that the non-uniform
response of cells within a culture required the need for redundant measurements in
order to obtain statistically-significant data, especially in drug discovery applications.
High-throughput systems are vastly desirably in drug discovery, and these systems
typically output large datasets. This work validated an impedance system that
implemented automated and rapid data collection and analysis through the design and
implementation of a switching circuit, Labview, and Matlab programs. This design can
serve as a foundation for higher-level multiplexed systems with a greater number of
independent electrodes and/or devices to obtain statistically-significant data for
numerous applications.

83
Chapter 7 Electrical Comparison of Healthy and Cancer Ovarian Cells
7.1 Introduction Ovarian cancer is the 5th most common cancer among women, with approximately
22,000 new cases and over 15,000 deaths estimated in 2011 [19]. Treatment typically
involves surgical debulking followed by chemotherapy (i.e. platinum and taxane-based
agents used specifically for ovarian cancer treatment) [115], which often targets normal
cells in addition to the abnormal cells. This leads to side effects such as hair loss,
fatigue, and low blood cell counts. As a result, chemotherapeutic drugs require extensive
characterization and validation before they can be used clinically. This can be a
cumbersome task, as many variables are present when determining the drug’s
effectiveness, including concentration, time, cell line, and microenvironment.
Qualitative measurements (i.e. western blots, optical microscopy, biomarkers) used
to identify and validate the effects of chemotherapeutic drugs are typically performed at
standard intervals (such as 0, 3, 9, 18 hours) [116]. These intervals are chosen based on
other published studies, predefined protocols, or trial-and-error. However, when a new
cell line or drug is introduced, these intervals may not be optimal, i.e. a reaction
occurring one hour after the introduction of a stimulant may be overlooked. Since
qualitative methods are time consuming, labor intensive, and typically endpoint assays, it
is not feasible to determine cell- or drug-specific time points through real-time
monitoring. Additionally, it is unrealistic to perform qualitative measurements
continuously. Impedance spectroscopy, on the other hand, offers a label-free, non-

84
destructive, quantitative measurement technique that can be used to continuously
monitor cells. With real-time impedance measurements, cellular responses can be
captured at numerous time points. Thus, when a reaction is observed, qualitative
measurements can be focused at that specific time point(s). Therefore, it is hypothesized
that impedance monitoring performed prior to qualitative studies can (1) determine the
optimum time points for measurements, (2) reduce the number of qualitative
measurements needed to obtain relevant data, and (3) reduce the amount of time and
expensive reagents needed to complete an experiment.
In impedance spectroscopy measurements, a small AC electrical signal is passed
and measured between a pair of electrodes. The technique uses a small gold electrode
(250 µm in diameter) that can measure approximately 50 to 100 cells, dependent on cell-
type. When cells attach and spread onto the surface of the electrode, the measured
impedance of the system increases because the insulating cell membranes block current
flow. Thus, cell viability, death, and micromotion can be detected with high sensitivity [2,
6, 8, 74]. This technique is commonly referred to as electric cell-substrate impedance
sensing (ECIS). Giaever and Keese pioneered the ECIS technique [108] and developed
it into a commercial system (available through Applied Biophysics) that allows real-time
impedance measurements inside a humidified incubator.
This chapter replicates a recently reported qualitative study [116] to understand the
effects of arsenic trioxide (As2O3) on both T80 (normal) and HEY (cancer) ovarian cells.
There are only a few reports that investigate specifically T80 and HEY cells [117-119],
comparing their response to chemotherapeutic drugs (normal versus cancer cells).
There is one known impedance study using HEY cells [120] in which impedance was
measured to monitor the invasive potential of ovarian cancer cells into a peritoneal

85
mesothelial cell monolayer by quantifying the timing and extent of invasion. In particular,
they emphasize the advantages of the impedance measurement system, including high
sensitivity and the ability to follow real-time changes (as opposed to endpoint assays)
[120]. Herein, we performed continuous impedance measurements on normal and
cancer ovarian cells to determine if biologically significant information could be obtained
at time points other than the standard intervals used previously [116]. In addition, a
quantitative comparison of the impedance signatures of the T80 and HEY cells was
performed to show that the cells could be differentiated based on their electrical
properties.
7.2 Methods and Materials
7.2.1 Cell Culture HEY ovarian carcinoma cells and T80 (large T antigen/hTERT immortalized normal
ovarian surface epithelial cells) were kindly provided by Dr. Gordon Mills (MD Anderson
Cancer Center, Houston, Texas). Both cell lines were cultured in RPMI 1640,
supplemented with 8% FBS and penicillin/streptomycin. The cells were maintained in a
humidified 370C incubator containing 95% air and 5% CO2. For all experiments, cells
were detached from flasks with trypsin-EDTA solution and plated into the ECIS chamber
at a concentration of 300,000 cells/mL prior to any treatment with drugs. Arsenic trioxide
(As2O3) was obtained from Sigma-Aldrich. Cells were treated with varying doses of
As2O3 (0-50 μM).
7.2.2 Impedance Measurements The ECIS ® Zθ system, provided by Applied Biophysics [41], was used to perform all
impedance measurements. The system supplies a small AC current between 64 Hz and
64 kHz across the electrodes and performs continuous measurements of the cell

86
cultures while inside an incubator. 8W1E electrodes arrays (8-well plates with a single
250 µm-diameter working electrode) from Applied Biophysics were used for all
experiments. Figure 7-1 shows an image of the device, provided by Applied Biophysics.
Three independent experimental designs were conducted. In the first experimental
design (Experiment 1), T80 and HEY ovarian cells were seeded into two 8W1E devices.
The cells were allowed to settle and adhere to the electrodes for approximately eight
hours prior to the introduction of As2O3. As2O3 was then added directly to the existing
medium. All treatments were performed in duplicates (replicate wells) as follows: (1) two
wells served as the controls (in the absence of As2O3, 0 µM); (2) two wells contained 10
µM of As2O3; (3) two wells contained 25 µM of As2O3; and (4) two wells contained 50 µM
of As2O3. Impedance measurements commenced immediately after the introduction of
As2O3, and continued for up to 20 hours following treatment. In the second experimental
design (Experiment 2), the setup was similar to Experiment 1 with the exception of
As2O3 being added via a change in cell culture medium. In the third experimental design
(Experiment 3), the cells were allowed to settle and adhere for 24 hours prior to the
addition of As2O3, which was similarly added via a change in medium.
Figure 7-1: Photograph of ECIS 8W1E device (Applied Biophysics)

87
7.3 Results and Discussion Impedance responses of the T80 (normal) and HEY (cancer) cells to the cytotoxic
effects of As2O3, a pro-death agent used in the clinic to treat patients with acute
promyelocytic leukemia (APL), were assessed via use of the ECIS system. Three
different experimental designs (as described in the Materials and Methods section) were
evaluated to investigate the effects of medium change and confluence on cellular
responses to the cytotoxic agent. The results are displayed in graphical format as
changes in impedance across time (Figure 7-2 through Figure 7-4) after the introduction
of As2O3 to the cell cultures.
7.3.1 Experiment 1: No Culture Medium Change Figure 7-2(a) shows the results of Experiment 1 for T80 and HEY cells, respectively.
The curves are averages of the 2 wells, with error bars, displayed as standard
deviations. Due to occasional leakage or electrical disconnects, some data from the
duplicate well was not collected; in this regard, data from single wells is displayed
without error bars. Based on the impedance measurements shown in Figure 7-2(a), the
impedance of the T80 control cells (0 µM) gradually increased from 4 to 8.5 kΩ over the
20 hour time frame. This increase is attributed to the cells adhering and spreading on the
electrode surface. Cell membranes are insulating and thus block current flow as it travels
from one electrode to another. Current is subsequently forced to travel between the
tight-junctions of the cells or between the cell and substratum, typically nanometer-sized
gaps. As cells continue to spread onto the electrode, these gaps become less prominent
and measured impedance continues to increase over time. T80 cells treated with 10 µM
As2O3 appeared to resist the effects of As2O3 for a longer time period (approximately 5
hours) and underwent complete cell death beyond 20 hours.

88
In contrast, As2O3 at a concentration of 25 and 50 µM had the most detrimental
effects on the normal T80 cells with a marked effect on cell viability a little more than one
hour following the addition of the cytotoxic agent.
In contrast to the normal T80 cells, the HEY ovarian carcinoma cells (in Figure
7-2(b)) appeared to be more resilient to the cytotoxic effects of As2O3. Within the first two
hours, the impedance of the As2O3 treated HEY cells sharply increased above that of the
control. On average, the impedance of the As2O3 treated cells nearly doubled that of the
control. We propose that this could be attributed to the formation of tighter cellular
junctions between the cells with increased substrate adherence leading to resistance to
the detrimental cytotoxic effects of As2O3. The HEY cells treated with 25 and 50 µM
As2O3 underwent cell death after 4-5 hours of treatment, whereas the HEY cells were
completely resistant to the effects of 10 µM As2O3. The impedance of the HEY control
cells (0 µM) gradually increased from 3 to 4 kΩ over the 20 hour time frame. The overall
impedance of the HEY cells was less than that of the T80 cells. The cause of this
impedance difference is discussed later on in this section.

89
Figure 7-2: Experiment 1- Impedance vs. time plots of (A) T80 and (B) HEY cells, where As2O3 was added to existing medium 8 hours after seeding cells. All concentrations of the cytotoxic agent had an effect on the T80 cells; more so the 25 and 50 µM than the 10 µM As2O3. On the contrary, the HEY were able to resist the 10 µM As2O3; however, the cells did succumb to the 25 and 50 µM.

90
7.3.2 Experiment 2: Culture Medium Change In Experiment 2, As2O3 was added to the T80 and HEY cells through a change in
culture medium. The impedance trends (Figure 7-3(a-b)) were similar to that of
Experiment 1, with minor differences. One of the differences is noticed between the
control (0 µM) cells. When the medium was not changed on the T80 cells (Figure 7-2(a),
0 µM As2O3), the impedance gradually and consistently increased over time; however,
when the medium was replaced (Figure 7-3(a), 0 µM As2O3), the impedance remained
nearly constant for the initial seven hours, and then it gradually increased thereafter. We
hypothesize that these changes could be due to removal of non-adherent cells in
conjunction with a lengthened time for the cells to adhere across the entire electrode
surface thus resulting in a delayed increase in impedance. The influence of the As2O3 on
the T80 cells is similar in both Experiments 1 and 2. On the contrary, 10 µM As2O3 had a
greater effect on the HEY cells that experienced a medium change. This suggests that
the medium change resulted in less cell presence and thus reduced formation of tight-
junctions and reduced cell-cell communication to fend off the cytotoxic agent.
91
Figure 7-3: Experiment 2- Impedance vs. time plots of (A) T80 and (B) HEY cells from Experiment 2, where As2O3 was added through a medium change 8 hours after seeding cells. Different from Experiment 1, when the medium was changed, non-adherent cells were removed, resulting in a delayed increase in impedance.

92
7.3.3 Experiment 3: Increased Cell Confluence In Experiment 3 in which the cells settled and adhered for 24 hours prior to the
introduction of As2O3 (Figure 7-4(a-b)), the cells formed a completely confluent layer
across the electrodes prior to treatment with the cytotoxic agent. The higher impedance
values of Experiment 3, compared to Experiments 1 and 2, signify that the cells are
confluent and even forming multiple layers. The impedance data indicates that
increased cellular confluence before cytotoxic agent treatment allows the cells to
become more resistant to the As2O3. This in part was due to the cells forming confluent,
multiple layers, stronger cell-cell tight junctions, and potentially more signaling pathways.
This is consistent with studies indicating that 3D cell cultures can resist cytotoxic agents
better than 2D cultures[121], due to the complex mechanical and biochemical
interactions of 3D cell cultures.
The impedance of the T80 cells with 10 µM of As2O3 initially spiked, and then
gradually decreased. However, 20 hours after the addition of As2O3, there were still
some viable cells present, as seen by the micromotion or small fluctuations in the
impedance. The impedance of the T80 cells with 25 µM of As2O3 increased sharply
immediately after its addition; however, in contrast to the 10 µM concentration, the
impedance quickly dropped after six hours. The cells were unable to resist the higher
concentrations of As2O3 and complete cell death occurred around 15 hours. Similarly,
the impedance of the 50 µM As2O3–treated T80 cells sharply increased within the first
hour, though quickly decreased within two hours, and complete cell death followed
shortly thereafter.

93
Figure 7-4: Experiment 3- Impedance vs. time plots of (A) T80 and (B) HEY cells from Experiment 3, where As2O3 was added through a medium change 24 hours after seeding cells. Both cell lines were less sensitive to the lower concentrations of the cytotoxic agent, compared to Experiments 1 and 2. This is attributed to the cells forming confluent multi-layers, resulting in stronger tight-junctions and substratum adherence, and thus an increased resist to the As2O3. The initial impedance spikes within the first 2 hours also validate that the cells are developing a stronger adherence to resist the cytotoxic agent.
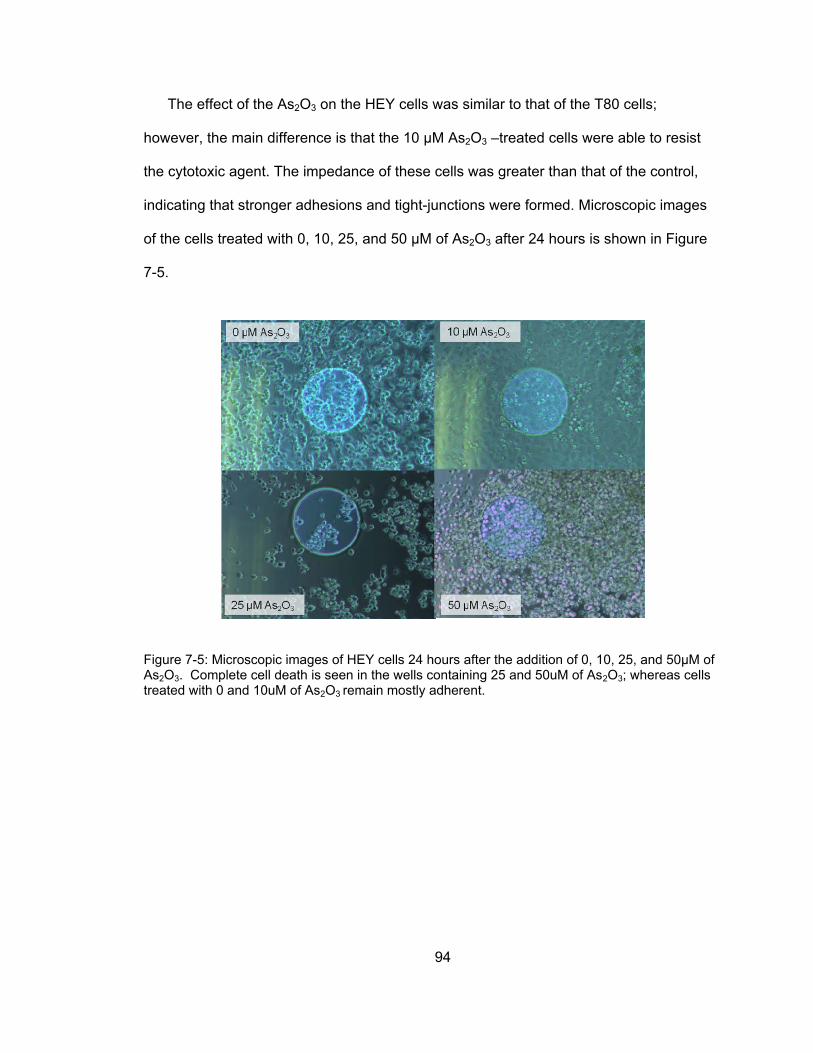
94
The effect of the As2O3 on the HEY cells was similar to that of the T80 cells;
however, the main difference is that the 10 µM As2O3 –treated cells were able to resist
the cytotoxic agent. The impedance of these cells was greater than that of the control,
indicating that stronger adhesions and tight-junctions were formed. Microscopic images
of the cells treated with 0, 10, 25, and 50 µM of As2O3 after 24 hours is shown in Figure
7-5.
Figure 7-5: Microscopic images of HEY cells 24 hours after the addition of 0, 10, 25, and 50µM of As2O3. Complete cell death is seen in the wells containing 25 and 50uM of As2O3; whereas cells treated with 0 and 10uM of As2O3 remain mostly adherent.

95
The time points in which significant events occurred with the ovarian cells are
highlighted in Table 7-1. The times were chosen based on changes observed in the
impedance vs. time plots. For example, the key time points from Experiment 3 (T80
cells) were (a) 1, (b) 5, and (c) 15 hours. At these points, (a) the initial spike occurred,
(b) the cells containing 50 µM As2O3 die off and detach from the electrode, and (c) then
the cells containing 25 µM As2O3 begin to die and the impedance of the 10 µM began to
decrease below that of the control. The time points varied with cell type, confluence (cell-
substratum adherence and cell-cell tight junctions), and drug concentration,
demonstrating the importance of pinpointing unique time frames for different cell types
and drug concentrations. To obtain more insight into the underlying mechanisms of
these observed changes, biological assays can be performed at these personalized
times.
Light microscopic images (Figure 7-6(a-d)) of cells treated with As2O3 within the
initial 2-hour time frame were captured to determine whether observable physical
changes were occurring to the cells’ morphology, which could likely correlate with the
increased impedance measured during this time initial time frame (see Figure 7-2
Table 7-1: Significant time points from Experiments 1, 2, and 3 for the T80 and HEY cells
T80 HEY
Significant time points (hours)
Significant time points (hours)
Exp 1 1, 3, 5 1, 8
Exp 2 1, 4, 10 2, 5, 19
Exp 3 1, 5, 15 1, 6, 16
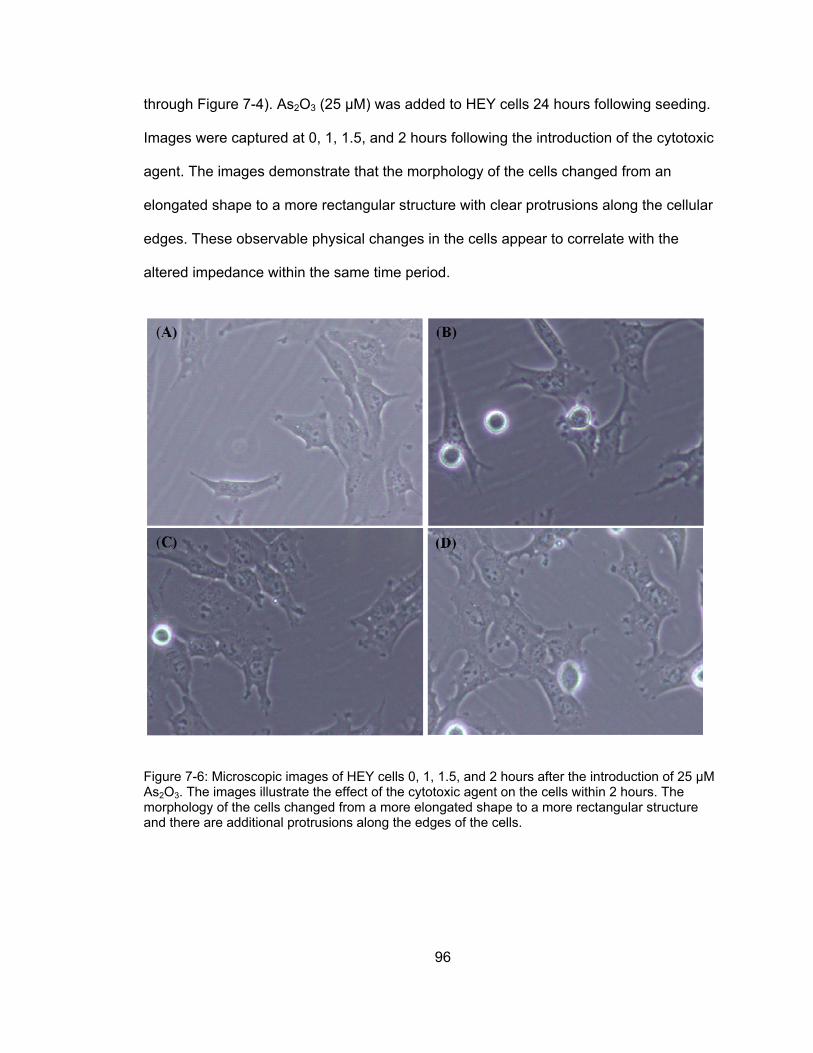
96
through Figure 7-4). As2O3 (25 µM) was added to HEY cells 24 hours following seeding.
Images were captured at 0, 1, 1.5, and 2 hours following the introduction of the cytotoxic
agent. The images demonstrate that the morphology of the cells changed from an
elongated shape to a more rectangular structure with clear protrusions along the cellular
edges. These observable physical changes in the cells appear to correlate with the
altered impedance within the same time period.
Figure 7-6: Microscopic images of HEY cells 0, 1, 1.5, and 2 hours after the introduction of 25 µM As2O3. The images illustrate the effect of the cytotoxic agent on the cells within 2 hours. The morphology of the cells changed from a more elongated shape to a more rectangular structure and there are additional protrusions along the edges of the cells.

97
7.3.4 Comparison of T80 and HEY Cell Impedance Signatures The results of this work also demonstrated that normal and cancer ovarian cells can
be quantitatively differentiated using impedance analysis. Figure 7-7 illustrates a
difference in impedance between T80 and HEY cells from Experiment 1. After 20 hours
of monitoring, the T80 cells had a greater overall impedance, and a smaller capacitance
than the HEY cells, in all three experiments. The extracted impedances and
capacitances of the T80 and HEY cells after 20 hours of monitoring are listed in Table
7-2.
Figure 7-7: Comparison of the impedances of T80 and HEY ovarian cells from Experiment 1, 0 µM As2O3. Measurements commenced 8 hours after seeding cells and the cell culture medium was not changed. The impedance of the cells increased over time as the cells adhered and spread onto the electrodes; however the impedance of the normal T80 cells is greater than that of the HEY cells. This is attributed to a weaker adhesion of the HEY cells to the substratum because they are less contact inhibited.

98
The impedances are notably higher in Experiment 3 because the cells adhered and
spread for 24 hours prior to monitoring as opposed to 8 hours of adherence for
Experiments 1 and 2. A cell membrane capacitance of 1 µF/cm2 is generally accepted in
literature[122]. In Experiment 3, the average cell capacitances of the T80 and HEY cells
were 4 µF/cm2 and 5.6 µF/cm2. These values are higher than the generally accepted
value because they also incorporate properties of the entire cell layer(s), including trans-
cellular junctions and folded cell walls [75]. It is hypothesized that the HEY cells have a
higher capacitance per area because they are more likely to form multiple layers.
The higher impedance of the T80 cells over the HEY cells can be attributed to the
smaller capacitance and a higher resistance, which results from stronger substratum-cell
adhesion and cell-cell interactions. It is expected for cancer cells to have a weaker
adhesion to the substratum because they are less contact inhibited. Zou and Guo [42]
also suggests that due to increased cellular water and salt content, altered membrane
permeability, and changed packing density, malignant tumors typically exhibit a lower
electrical impedance.
Table 7-2: Impedances and capacitances of the T80 and HEY cells after 20 hours of monitoring, for the three experiments
T80 HEY
Impedance (kΩ) at 16
kHz
Capacitance (nF) at 16 kHz
Impedance (kΩ) at 16
kHz
Capacitance (nF) at 16 kHz
Experiment 1 8 1.75 4 3.2
Experiment 2 6.5 2.5 4.5 3.25
Experiment 3 13 2 10 2.75

99
This is consistent with our results presented herein in that the HEY cells have a higher
capacitance, which translates to a lower impedance by the following definition:
7.4 Conclusion This work demonstrates that impedance measurements may be a beneficial tool for
optimizing drug-screening biological assays by pinpointing specific time points for
functional assessments generating important data regarding (1) cell type, (2) confluence
(time), and (3) drug concentrations. As a result, this eliminates excessive experimental
trials needed to prior to the identification of optimal time points for biological
measurements and obtaining relevant information with respect to cell-drug interactions.
The impedance data indicates that 25 and 50 µM As2O3 is detrimental to both the T80
and the HEY cells, leading to extensive cell death within a 6 hour period. In contrast,
both cell lines treated with to 10 µM of As2O3 were able to resist its effects for a longer
time frame. In addition, we noted that the normal T80 cells, as reported [116], were more
sensitive to the As2O3 than the ovarian cancer HEY cells. This was especially apparent
in the cell cultures treated with 10 µM of As2O3. The impedance of the T80 cells fell
below that of the controls (0 µM As2O3) faster than the HEY cells, which in some
experiments did not succumb to the cytotoxic agent at 10 µM. This variance in cell
responses with different variables reveals the need for unique timestamps when
studying cell-drug interactions. Therefore, we propose that measurements of
impendence can be utilized to identify critical time points when investigating cell-drug
interactions.
CjZ
ω1
= Equation 7-1

100
Chapter 8 Conclusions and Future Work
This work has demonstrated the cycle of electrode optimization, design, fabrication,
testing, and validation. An existing electrode design was modified to suppress the
parasitic contribution of the passivation layer to allow measurements at higher
frequencies. The design rule derived in this work was applied to the new design, which
incorporated 8 independent working electrodes to allow multiple measurements within a
cell culture chamber. In order to obtain statistically relevant data, acquisition of multiple
data points in a cell culture is essential since cells may adhere, react, and behave
slightly different in under various conditions and locations. The effect of arsenic trioxide
(As2O3) on ovarian cancer cells was continuously monitored inside of an incubator. A
switching circuit and Labview program was developed to automate the measurements,
and switch between the 8 electrodes on 4 separate devices. System parameters
(solution resistance, double layer capacitance, cell resistance and membrane
capacitance) were extracted using the equivalent circuit modeling technique. A MATLAB
program was derived to perform a complex non-linear least squares (CNLS) algorithm to
fit and visualize the large data sets.
Applied Biophysics’ commercial ECIS system was used to validate the
measurements performed by the 8-electrode system and compare the electrical
properties of normal and cancer ovarian cells and their responses to As2O3. Similar
trends were seen between the commercial and 8-electrode systems. The work
performed on the commercial system demonstrated that the 25 and 50µM
concentrations of As2O3 were detrimental to both the T80 and the HEY cells. In contrast,

101
the cell lines were able to resist 10 µM of As2O3 for a longer period of time. The T80
cells, however, were slightly more sensitive to the As2O3 than the HEY cells. When the
cells settled and adhered for a longer period of time (24 hours) before adding the As2O3,
they became more resilient to the drug.
Lastly, a comparison of the 2- and 4-electrode measurement configuration was
performed to determine if one technique would be more sensitive to impedance changes
than the other in a microfluidic system. It was found that measuring a change in
resistance using the 4-electrode configuration was the most sensitive technique to detect
the presence of E. coli at low frequencies in a flow focusing system. The 2-electrode
technique showed a greater percent change in capacitance than the 4-electrode sensor
because the cells were bound to the electrode surface and the 2-electrode configuration
is more sensitive to changes at the electrode interface. The presence of the bacteria
became less significant with increased focusing. This effect was attributed to the
increased effect of the diffusion of ions out of the focused stream as the focused stream
height decreased. If diffusion is properly controlled in order to prevent a loss in detection
sensitivity using flow focusing and impedance measurements, the 4-electrode
measurement configuration would be the more ideal to monitor changes in impedance.
A large percentage of cell research is focused on drug discovery and development.
As technology advances, research is moving away from two-dimensional cell cultures to
three-dimensional spheroids to reproduce in-vivo like behavior with more accuracy. 2D
cultures are easy to maintain and provide valuable baseline information; however, they
do not reproduce certain properties such as drug resistance and clonal dominance. Most
tissue consists of distinct 3D spatial arrangements of cells in close contact and
communication with each other. In particular, 3D architecture and communication with

102
extracellular matrix are essential to reproduce in-vivo like behavior. Various studies have
shown that 3D spheroidal cell cultures demonstrate significantly more in-vivo like
behavior than 2D cultures [123-125]. Yet, significant challenges still exist in using these
models reliably in the laboratory or clinical setting. Monitoring of 3D spheroids using
impedance spectroscopy has begun to take root within the past decade. Researchers
including [126-128] have used impedance spectroscopy to perform toxicology studies
and study changes in the physiological parameters of spheroids when exposed to
various drugs.
This work has laid a foundation for 3D studies, as spatial resolution, statistically
relevant data, the ability to distinguish between normal and cancer cells, and reduced
measurement parasitic are all essential for electrically characterizing the effects of toxins
and chemotherapeutic drugs on 3D spheroids. Fabrication of the electrode device on
plastic, such as polypropylene, is encouraged for future work since cells, especially
normal cells, are more conditioned to thrive on such substratum. Also, a more advanced
graphical user interface (GUI) is suggested for easier data visualization and analysis.

103
List of References 1. Keese, C.R., et al., Real-Time Impedance Assay to Follow the Invasive Activities
of Metastatic Cells in Culture BioTechniques, 2002. 33(4): p. 842-850.
2. Giaever, I. and C.R. Keese, Micromotion of Mammalian Cells Measured Electrically. Proceedings of the National Academy of Sciences of the USA, 1991. 88(17): p. 7896-7900.
3. Keese, C., et al., Electrical wound-healing assay for cells in vitro. Proceedings of the National Academy of Sciences, 2004. 101(6): p. 1554-1559.
4. Campbell, C.E., et al., Monitoring viral-induced cell death using electric cell-substrate impedance sensing. Biosensors and Bioelectronics, 2007. 23(4): p. 536-542.
5. Xiao, C. and J.H.T. Luong, On-Line Monitoring of Cell Growth and Cytotoxicity Using Electric Cell-Substrate Impedance Sensing (ECIS). Biotechnol. Prog., 2003. 19(3): p. 1000-1005.
6. Lo, C.-M., C.R. Keese, and I. Giaever, Monitoring Motion of Confluent Cells in Tissue Culture. Experimental Cell Research, 1993. 204(1): p. 102-109.
7. Yin, H., et al., Bioelectrical Impedance Assay to Monitor Changes in Aspirin-Treated Human Colon Cancer HT-29 Cell Shape during Apoptosis. Analytical Letters, 2007. 40: p. 85-94.
8. Keese, C.R. and I. Giaever, A biosensor that monitors cell morphology with electrical fields. Engineering in Medicine and Biology Magazine, IEEE, 1994. 13(3): p. 402-408.
9. Arndt, S., et al., Bioelectrical impedance assay to monitor changes in cell shape during apoptosis. Biosensors and Bioelectronics, 2004. 19(6): p. 583-594.
10. Ko, K., et al., Cell-substrate impedance analysis of epithelial cell shape and micromotion upon challenge with bacterial proteins that perturb extracellular matrix and cytoskeleton. Journal of Microbiological Methods, 1998. 34(2): p. 125-132.
11. Chen, Y., et al., Real-time monitoring approach: Assessment of effects of antibodies on the adhesion of NCI-H460 cancer cells to the extracellular matrix. Biosensors and Bioelectronics, 2008. 23(9): p. 1390-1396.

104
12. Yeon, J.H. and J.-K. Park, Cytotoxicity test based on electrochemical impedance measurement of HepG2 cultured in microfabricated cell chip. Analytical Biochemistry, 2005. 341(2): p. 308-315.
13. Wang, L., et al., An automatic and quantitative on-chip cell migration assay using self-assembled monolayers combined with real-time cellular impedance sensing. Lab Chip, 2008. 8(6): p. 837-992.
14. Wegener, J., C.R. Keese, and I. Giaever, Electric Cell-Substrate Impedance Sensing (ECIS) as a Noninvasive Means to Monitor the Kinetics of Cell Spreading to Artificial Surfaces. Experimental Cell Research, 2000. 259(1): p. 158-166.
15. McCoy, M.H. and E. Wang, Use of electric cell-substrate impedance sensing as a tool for quantifying cytopathic effect in influenza A virus infected MDCK cells in real-time. Journal of Virological Methods, 2005. 130(1-2): p. 157-161.
16. DePaola, N., et al., Electrical Impedance of Cultured Endothelium Under Fluid Flow. Annals of Biomedical Engineering, 2001. 29(8): p. 648-656.
17. Atienza, J.M., et al., Dynamic Monitoring of Cell Adhesion and Spreading on Microelectronic Sensor Arrays. Journal of Biomolecular Screening, 2005. 10(8): p. 795-805.
18. Jemal, A., et al., Cancer Statistics, 2010. CA Cancer J Clin, 2010. 60(5): p. 277-300.
19. AmericanCancerSociety, Cancer Facts & Figures 2011, in Atlanta: American Cancer Society. 2011.
20. Vassilopoulos, A., et al., Identification and characterization of cancer initiating cells from BRCA1 related mammary tumors using markers for normal mammary stem cells. Int J Biol Sci, 2008. 4: p. 133-142.
21. Weinberg, R.A., The biology of cancer. 2007, New York: Garland Science, Taylor & Francis Group.
22. Goodman, P.C., The new light: discovery and introduction of the X-ray. American Journal of Roentgenology, 1995. 165(5): p. 1041-1045.
23. Liu, Q., et al., Impedance studies of bio-behavior and chemosensitivity of cancer cells by micro-electrode arrays. Biosensors and Bioelectronics, 2009. 24(5): p. 1305-1310.
24. Atkinson, A.J., et al., Biomarkers and surrogate endpoints: Preferred definitions and conceptual framework*. Clin Pharmacol Ther, 2001. 69(3): p. 89-95.
25. Rifai, N., M.A. Gillette, and S.A. Carr, Protein biomarker discovery and validation: the long and uncertain path to clinical utility. Nat Biotech, 2006. 24(8): p. 971-983.
105
26. Chabinyc, M.L., et al., An Integrated Fluorescence Detection System in Poly(dimethylsiloxane) for Microfluidic Applications. Anal. Chem., 2001. 73: p. 4491-4498.
27. Wang, J., Electrochemical biosensors: Towards point-of-care cancer diagnostics. Biosensors and Bioelectronics, 2006. 21(10): p. 1887-1892.
28. Ding, L., et al., Trends in Cell-Based Electrochemical Biosensors Current Medicinal Chemistry, 2008. 15(30): p. 3160-70.
29. Application Note: Basics of Electrochemical Impedance Spectroscopy. Gamry Instruments 2007 [cited; Available from: http://www.gamry.com/App_Notes/EIS_Primer/EIS_Primer_2007.pdf].
30. Jorcin, J.-B., et al., CPE analysis by local electrochemical impedance spectroscopy. Electrochimica Acta, 2006. 51(8-9): p. 1473-1479.
31. Barsoukov, E. and J.R. Macdonald, Impedance spectroscopy: theory, experiment, and applications. 2nd ed. 2005, Hoboken: John Wiley & Sons. 595.
32. Macdonald, J., Impedance spectroscopy. Annals of Biomedical Engineering, 1992. 20(3): p. 289-305.
33. Macdonald, J.R., Impedance spectroscopy: old problems and new developments. Electrochimica Acta, 1990. 35(10): p. 1483-1492.
34. Macdonald, J.R., J. Schoonman, and A.P. Lehnen, Applicability and power of complex nonlinear least squares for the analysis of impedance and admittance data. Journal of Electroanalytical Chemistry, 1982. 131: p. 77-95.
35. Miklavi, D., N. Pavšelj, and F.X. Hart, Electrical Properties of Tissues, in Wiley Encyclopedia of Biomedical Engineering 2006, John Wiley & Sons, Inc.
36. Schwan, H.P., Electrical Characteristics of Tissues. Biophysik, 1963. 1(3): p. 198-208.
37. Polk, C. and E. Postow, Handbook of biological effects of electromagnetic fields. 2nd ed. 1996, Boca Raton: CRC Press.
38. Tamura, T., et al., Modelling of the dielectric properties of normal and irradiated skin. Physics in Medicine and Biology, 1994. 39(6): p. 927.
39. Schepps, J. and K. Foster, The UHF and Microwave Dielectric Properties of Normal and Tumour Tissues: Variation in Dielectric Properties with Tissue Water Content. Phys. Med. Biol., 1980. 25(6): p. 1149-1159.
40. Luong, J.H.T., et al., Monitoring Motility, Spreading, and Mortality of Adherent Insect Cells Using an Impedance Sensor. 2001. p. 1844-1848.
41. AppliedBioPhysics. Electric Cell-substrate Impedance Sensing ECIS. 2010 [cited 2011 16 April]; Available from: http://biophysics.com/index.php.

106
42. Zou, Y. and Z. Guo, A review of electrical impedance techniques for breast cancer detection. Medical Engineering & Physics, 2003. 25(2): p. 79-90.
43. Han, A., L. Yang, and A.B. Frazier, Quantification of the Heterogeneity in Breast Cancer Cell Lines Using Whole-Cell Impedance Spectroscopy. Clinical Cancer Research, 2007. 13(1): p. 139-143.
44. Beetner, D.G., et al., Differentiation among basal cell carcinoma, benign lesions, and normal skin using electric impedance. Biomedical Engineering, IEEE Transactions on, 2003. 50(8): p. 1020-1025.
45. Cone, C., Transmembrane potentials and characteristics of immune and tumor cells. 1985, Boca Raton, Florida: CRC Press.
46. Cure, J., Cancer an electrical phenomenon. Resonant, 1991. 1(1).
47. Foster, K. and J. Schepps, Dielectric properties of tumor and normal tissues at radio through microwave frequencies. J Microwave Power, 1981. 16: p. 107-119.
48. Luong, J., An Emerging Impedance Sensor Based on Cell-Protein Interactions: Applications in Cell Biology and Analytical Biochemistry. Analytical Letters, 2003. 36(15): p. 3147 - 3164.
49. Luong, J.H.T. and M. Habibi-Rezaei, Insect cell-based impedance biosensors: a novel technique to monitor the toxicity of environmental pollutants. Environmental Chemistry Letters, 2003. 1(1): p. 2-7.
50. Hug, T., Biophysical methods for monitoring cell-substrate interactions in drug discovery. Assay and Drug Development Technologies, 2003. 1(3): p. 479-488.
51. Xi, B., et al., Review: The application of cell-based label-free technology in drug discovery. Biotechnology Journal, 2008. 3: p. 484-495.
52. Marcottea, L. and M. Tabrizian, General Review: Sensing surfaces: Challenges in studying the cell adhesion process and the cell adhesion forces on biomaterials ITBM-RBM, 2008. 29: p. 77-88.
53. Price, D., A. Rahman, and S. Bhansali, Design rule for optimization of microelectrodes used in electric cell-substrate impedance sensing (ECIS). Biosensors and Bioelectronics, 2009. 24(7): p. 2071-2076.
54. Wegener, J., C.R. Keese, and I. Giaever, Electric Cell–Substrate Impedance Sensing (ECIS) as a Noninvasive. Means to Monitor the Kinetics of Cell Spreading to Artificial Surfaces Experimental Cell Research, 2000. 259(1): p. 158-166.
55. Xing, J.Z., et al., Dynamic Monitoring of Cytotoxicity on Microelectronic Sensors. Chemical Research in Toxicology, 2005. 18(2): p. 154-161.
56. Boyd, J.M., et al., A cell-microelectronic sensing technique for profiling cytotoxicity of chemicals. Analytica Chimica Acta, 2008. 615(1): p. 80-87.

107
57. Xing, J.Z., et al., Microelectronic cell sensor assay for detection of cytotoxicity and prediction of acute toxicity. Toxicology in Vitro, 2006. 20(6): p. 995-1004.
58. Irelan, J.T., et al., Rapid and Quantitative Assessment of Cell Quality, Identity, and Functionality for Cell-Based Assays Using Real-Time Cellular Analysis. Journal of Biomolecular Screening, 2011. 16(3): p. 313-322.
59. Aberg, P., et al., Skin cancer identification using multifrequency electrical impedance-a potential screening tool. Biomedical Engineering, IEEE Transactions on, 2004. 51(12): p. 2097-2102.
60. Huang, X., et al. Impedance based biosensor array for monitoring mammalian cell behavior. in Proceedings of IEEE Sensors. 2003.
61. Judy, J.W., Microelectromechanical systems (MEMS): fabrication, design and applications. Smart Materials and Structures, 2001. 10: p. 1115-1134.
62. Rahman, A.R.A., G. Justin, and A. Guiseppi-Elie, Towards an implantable biochip for glucose and lactate monitoring using microdisc electrode arrays (MDEAs). Biomedical Microdevices, 2009. 11(1): p. 75-85.
63. Park, T.H. and M.L. Shuler, Integration of Cell Culture and Microfabrication Technology. Biotechnol. Prog., 2003. 19(2): p. 243-253.
64. Matysik, F.-M., A. Meister, and G. Werner, Electrochemical detection with microelectrodes in capillary flow systems. Analytica Chimica Acta, 1995. 305(1-3): p. 114-120.
65. Bard, A.J. and L.R. Faulkner, Electrochemical methods: Fundamentals and applications. 2001, New York: Wiley and Sons.
66. Fosdick, L.E. and J.L. Anderson, Optimization of microelectrode array geometry in a rectangular flow channel detector. Anal. Chem, 1986. 58(12): p. 2481-2485.
67. Min, J. and Antje J. Baeumner, Characterization and Optimization of Interdigitated Ultramicroelectrode Arrays as Electrochemical Biosensor Transducers. Electroanalysis, 2004. 16(9): p. 724-729.
68. Sandison, M.E., et al., Optimization of the Geometry and Porosity of Microelectrode Arrays for Sensor Design. Anal. Chem., 2002. 74(22): p. 5717-5725.
69. Lempka, S.F., et al. Optimization of Microelectrode Design for Cortical Recording Based on Thermal Noise Considerations. in Engineering in Medicine and Biology Society, 2006. EMBS '06. 28th Annual International Conference of the IEEE. 2006.
70. Wang, L., et al., Analysis of the sensitivity and frequency characteristics of coplanar electrical cell-substrate impedance sensors. Biosensors and Bioelectronics, 2008. 24(1): p. 14-21.

108
71. English, A.E., et al., Instrumental noise estimates stabilize and quantify endothelial cell micro-impedance barrier function parameter estimates. Biomedical Signal Processing and Control, 2009. 4(2): p. 86-93.
72. Curtis, T.M., et al., Improved cell sensitivity and longevity in a rapid impedance-based toxicity sensor. Journal of Applied Toxicology, 2009 (http://dx.doi.org/10.1002/jat.1421).
73. Pejcic, B. and R. De Marco, Impedance spectroscopy: Over 35 years of electrochemical sensor optimization. Electrochimica Acta, 2006. 51(28): p. 6217-6229.
74. Rahman, A.R.A., D.T. Price, and S. Bhansali, Effect of electrode geometry on the impedance evaluation of tissue and cell culture. Sensors and Actuators B, 2007. 127: p. 89-96.
75. Rahman, A., L. Chun-Min, and S. Bhansali, A Detailed Model for High-Frequency Impedance Characterization of Ovarian Cancer Epithelial Cell Layer Using ECIS Electrodes. Biomedical Engineering, IEEE Transactions on, 2009. 56(2): p. 485-492.
76. Brooks Shera, E., et al., Detection of single fluorescent molecules. Chemical Physics Letters, 1990. 174(6): p. 553-557.
77. Lee, G.B., et al., Hydrodynamic focusing for a micromachined flow cytometer. Transactions- ASME Journal of Fluids Engineering, 2001. 123(3): p. 672-679.
78. Nieuwenhuis, J.H., et al., Integrated Coulter counter based on 2-dimensional liquid aperture control. Sensors & Actuators: B. Chemical, 2004. 102(1): p. 44-50.
79. Wolff, A., et al., Integrating advanced functionality in a microfabricated high-throughput fluorescent-activated cell sorter. Lab on a Chip, 2003. 3(1): p. 22-27.
80. Knight, J.B., et al., Hydrodynamic focusing on a silicon chip: mixing nanoliters in microseconds. Physical Review Letters, 1998. 80(17): p. 3863-3866.
81. Wong, S.H., M.C.L. Ward, and C.W. Wharton, Micro T-mixer as a rapid mixing micromixer. Sensors and Actuators B: Chemical, 2004. 100(3): p. 359-379.
82. Golden, J.P., et al., A portable automated multianalyte biosensor. Talanta, 2005. 65(5): p. 1078-1085.
83. Schwan, H.P., Electrode polarization impedance and measurements in biological materials. Annals of the New York Academy of Sciences, 1968. 148(1): p. 191.
84. York, T., Status of electrical tomography in industrial applications. Journal of Electronic Imaging, 2001. 10: p. 608.
85. Schwan, H.P., Electrode polarization impedance and measurements in biological materials. Annals of the New York Academy of Sciences, 1968. 148(Bioelectrodes): p. 191-209.

109
86. Bragós, R., et al. Four versus two-electrode measurement strategies for cell growing and differentiation monitoring using electrical impedance spectroscopy. in Annual International Conference of the IEEE Engineering in Medicine and Biology Society. 2006.
87. Huh, D., et al., Microfluidics for flow cytometric analysis of cells and particles. Physiologial Measurement, 2005. 26(3): p. 73.
88. Nasir, M., et al., Hydrodynamic focusing of conducting fluids for conductivity-based biosensors. Biosensors and Bioelectronics, 2010. 25(6): p. 1363-1369.
89. Bard, A.J. and L.R. Faulkner, Electrochemical methods. 2001: Wiley New York.
90. Hong, J., et al., A dielectric biosensor using the capacitance change with AC frequency integrated on glass substrates. Japanese Journal of Applied Physics, 2004. 43(no. 8 a): p. 5639-5645.
91. Langereis, G.R., An integrated sensor system for monitoring washing processes, in MESA+. 1999, University of Twente: Enschede. p. 228.
92. Ivorra, A., Contributions to the Measurement of Electrical Impedance for Living Tissue Ischemia Injury Monitoring, in Electronic Engineering Department. 2005, Universitat Politècnica de Catalunya: Barcelona. p. 224.
93. Robillard, P.N. and D. Poussart, Spatial resolution of four electrode array. IEEE Transactions on Biomedical Engineering, 1979: p. 465-470.
94. Linderholm, P., et al., Two-dimensional impedance imaging of cell migration and epithelial stratification. Lab on a Chip, 2006. 6(9): p. 1155-1162.
95. Hasted, J.B., D.M. Ritson, and C.H. Collie, Dielectric properties of aqueous ionic solutions. Parts I and II. The Journal of Chemical Physics, 1948. 16: p. 1.
96. Robinson, R.A. and R.H. Stokes, Electrolyte solutions. 2002: Dover Pubns.
97. Olthuis, W., W. Streekstra, and P. Bergveld, Theoretical and experimental determination of cell constants of planar-interdigitated electrolyte conductivity sensors. Sensors and Actuators B: Chemical, 1995. 24(1-3): p. 252-256.
98. Leatzow, D.M., et al., Attachment of plastic fluidic components to glass sensing surfaces. Biosensors and Bioelectronics, 2002. 17(1-2): p. 105-110.
99. Chatrathi, M.P., J. Wang, and G. Collins, Sandwich electrochemical immunoassay for the detection of Staphylococcal enterotoxin B based on immobilized thiolated antibodies. Biosensors and Bioelectronics, 2007. 22: p. 2932-2938.
100. Kamholz, A.E., et al., Quantitative analysis of molecular interaction in a microfluidic channel: the T-sensor. Anal. Chem, 1999. 71(23): p. 5340-5347.

110
101. Yang, R., D.L. Feeback, and W. Wang, Microfabrication and test of a three-dimensional polymer hydro-focusing unit for flow cytometry applications. Sensors & Actuators: A. Physical, 2005. 118(2): p. 259-267.
102. Ismagilov, R.F., et al., Experimental and theoretical scaling laws for transverse diffusive broadening in two-phase laminar flows in microchannels. Applied Physics Letters, 2000. 76: p. 2376.
103. Weigl, B.H. and P. Yager, Microfluidics: microfluidic diffusion-based separation and detection. Science, 1999. 283(5400): p. 346.
104. Hatch, A., et al., A rapid diffusion immunoassay in a T-sensor. Nature Biotechnology, 2001. 19: p. 461-465.
105. Larsen, U.D., G. Blankenstein, and J. Branebjerg. Microchip Coulter particle counter. in Solid State Sensors and Actuators, 1997. TRANSDUCERS'97 Chicago., 1997 International Conference on. 1997.
106. Schwan, H.P. and C.F. Kay, The conductivity of living tissues. Annals of the New York Academy of Sciences, 1957. 65(6): p. 1007.
107. Guillot, P. and A. Colin, Stability of parallel flows in a microchannel after a T junction. Physical Review E, 2005. 72(6): p. 66301.
108. Giaever, I. and C.R. Keese, Monitoring fibroblast behavior in tissue culture with an applied electric field. PNAS, 1984. 81(12): p. 3761-3764.
109. Varshney, M. and Y. Li, Interdigitated array microelectrodes based impedance biosensors for detection of bacterial cells. Biosensors and Bioelectronics, 2009. 24(10): p. 2951-2960.
110. Mamouni, J. and L. Yang, Interdigitated microelectrode-based microchip for electrical impedance spectroscopic study of oral cancer cells. Biomedical Microdevices, 2011: p. 1-14.
111. Wegener, J., M. Sieber, and H.-J. Galla, Impedance analysis of epithelial and endothelial cell monolayers cultured on gold surfaces. Journal of Biochemical and Biophysical Methods, 1996. 32(3): p. 151-170.
112. Arias, L.R., C.A. Perry, and L. Yang, Real-time electrical impedance detection of cellular activities of oral cancer cells. Biosensors and Bioelectronics, 2010. 25(10): p. 2225-2231.
113. Hennemeyer, M., et al., Cell proliferation assays on plasma activated SU-8. Microelectronic Engineering, 2008. 85(5-6): p. 1298-1301.
114. Opp, D., et al., Use of electric cell-substrate impedance sensing to assess in vitro cytotoxicity. Biosensors and Bioelectronics, 2009. 24(8): p. 2625-2629.
115. Fesik, S.W., Promoting apoptosis as a strategy for cancer drug discovery. Nature Reviews Cancer, 2005. 5(11): p. 876-885.

111
116. Smith, D.M., et al., Arsenic trioxide induces a beclin-1-independent autophagic pathway via modulation of SnoN/SkiL expression in ovarian carcinoma cells. Cell Death and Differentiation, 2010. 17(12): p. 1867-1881.
117. Liu, G., et al., Stanniocalcin 1 and Ovarian Tumorigenesis. Journal of the National Cancer Institute, 2010. 102(11): p. 812-827.
118. Nanjundan, M., et al., Amplification of MDS1/EVI1 and EVI1, Located in the 3q26.2 Amplicon, Is Associated with Favorable Patient Prognosis in Ovarian Cancer. Cancer Research, 2007. 67(7): p. 3074-3084.
119. Nanjundan, M., et al., Overexpression of SnoN/SkiL, amplified at the 3q26.2 locus, in ovarian cancers: A role in ovarian pathogenesis. Molecular Oncology, 2008. 2(2): p. 164-181.
120. Ren, J., et al., Lysophosphatidic Acid Is Constitutively Produced by Human Peritoneal Mesothelial Cells and Enhances Adhesion, Migration, and Invasion of Ovarian Cancer Cells. Cancer Research, 2006. 66(6): p. 3006-3014.
121. Sun, T., et al., Culture of skin cells in 3D rather than 2D improves their ability to survive exposure to cytotoxic agents. Journal of Biotechnology, 2006. 122(3): p. 372-381.
122. Grimnes, S. and O.G. Martinsen, Bioimpedance and Bioelectricity Basics. 2000, San Diego: Academic Press.
123. Carlsson, J. and T. Nederman, Tumour spheroid technology in cancer therapy research. Eur J Cancer Clin Oncol., 1989. 25(8): p. 1127-1133.
124. Kunz-Schughart, L.A., et al., The Use of 3-D Cultures for High-Throughput Screening: The Multicellular Spheroid Model J Biomol Screen, 2004. 9: p. 273-285.
125. Pampaloni, F. and E.H.K. Stelzer, Three-Dimensional Cell Cultures in Toxicology. Biotechnology and Genetic Engineering Reviews, 2009. 26(1): p. 117-137.
126. Thielecke, H., A. Mack, and A. Robitzki, Biohybrid microarrays – Impedimetric biosensors with 3D in vitro tissues for toxicological and biomedical screening. Fresenius' Journal of Analytical Chemistry, 2001. 369(1): p. 23-29.
127. Kloß, D., et al., Drug testing on 3D in vitro tissues trapped on a microcavity chip. Lab Chip, 2008. 8: p. 879-884.
128. Hildebrandt, C., et al., Detection of the osteogenic differentiation of mesenchymal stem cells in 2D and 3D cultures by electrochemical impedance spectroscopy. Journal of Biotechnology, 2010. 148(1): p. 83-90.

112
Appendices

113
Appendix A: Copyright Permissions

114
Appendix A (Continued)

115
Appendix A (Continued)

116
Appendix A (Continued)

117
Appendix A (Continued)

118
Appendix A (Continued)
119
Appendix A (Continued)

120
Appendix A (Continued)

121
Appendix A (Continued)

122
Appendix A (Continued)

123
Appendix A (Continued)

124
Appendix A (Continued)

About the Author
Dorielle Tucker Price graduated summa cum laude with her B.S. from Clark Atlanta
University (2005) and earned her M.S. from USF (2007) in Electrical Engineering. She is
a recipient of the NSF Graduate Research Fellowship, McKnight Doctoral Fellowship
(Florida Education Fund), Ford Foundation Predoctoral Diversity Fellowship programs.
She has several peer-reviewed journal and conference publications, including one
obtained from her 2009 internship with the Naval Research Laboratory in Washington,
DC, under the advisement of Dr. Frances Ligler. She has recently (Spring 2012)
completed her doctoral degree in Electrical Engineering, within the Bio-MEMS and
Microsystems group, at the University of South Florida.
Related Documents