OPTIMIZATION OF A DISTRICT ENERGY SYSTEM IN ZARAGOZA (SPAIN) Natalia Moreno Bruned June 2009 Master’s Thesis in Energy Systems Supervisor: Alemayehu Gebremedhin Examiner: Alemayehu Gebremedhin DEPARTMENT OF TECHNOLOGY AND BUILT ENVIRONMENT

Welcome message from author
This document is posted to help you gain knowledge. Please leave a comment to let me know what you think about it! Share it to your friends and learn new things together.
Transcript

OPTIMIZATION OF A DISTRICT
ENERGY SYSTEM IN ZARAGOZA
(SPAIN)
Natalia Moreno Bruned
June 2009
Master’s Thesis in Energy Systems Supervisor: Alemayehu Gebremedhin
Examiner: Alemayehu Gebremedhin
DEPARTMENT OF TECHNOLOGY AND BUILT ENVIRONMENT


Preface
This project has been carried out as the final thesis of the Master’s Programme in Energy Systems at the University of Gävle (Sweden). Firstly, I would like to give my most sincere thanks to my lecturer Miguel Ángel Lozano from the University of Zaragoza (Spain) for the excellent guidance given to me throughout the development of the thesis. This project has been possible thanks to his involvement in the research work. His support and advice was most helpful. I would also like to thank my supervisor at the University of Gävle, Alemayehu Gebremedhin, whose attention, comments and advice have been of great help. Furthermore, I would like to thank all the other people involved in this project for their support and cooperation who have not been mentioned. Finally, I would like to give special thanks to my family, my friends and my boyfriend Ángel; whose moral support and understanding during my study years has been a great help. They encouraged me when I decided to study abroad for one year because they knew that it would be an incredible experience for my personal, professional and human enrichment. June 2009. Thank you, Natalia Moreno Bruned

Abstract The main objective of the present thesis is to study the design and optimization of a district energy system. The system is designed to meet the energy demand of a housing development located in the city of Zaragoza (Spain). The trigeneration system supplies domestic hot water, heating, cooling and electricity to the community. The area is supposed to be composed of a number of residential buildings, a hospital, a hotel and a school. The energy needs are provided by a CHP plant combined with several cooling machines. The selected equipment as well as the way of operation has been decided upon by using an optimization program called MODEST (Model for Optimisation of Dynamic Energy Systems with Time dependent components and boundary conditions). MODEST is a model based on linear programming which is used for optimizing energy systems. The program optimizes the energy system in order to meet the three types of demands within the area: heating, cooling and electricity. The result of the optimization gives the most cost-effective combination of equipment and fuels throughout the year to meet the energy demand. Furthermore, district energy systems provide a good solution to take advantage of the installed power in the CHP plant. Cogeneration systems combined with absorption machines enable the excess heat from electricity production, which is often a problem during the warm season, to be used. This waste heat fuels absorption chillers to generate cooling. However, the cooling capacity needed in some periods is higher than the power required for the production of heat. Thus, it is more suitable to combine absorption and compression cooling possibilities. The problem has been solved by comparing the optimisation results of two different scenarios: first, considering the option of installing a gas turbine CHP combined with a small gas engine CHP and second the assumption of only gas engine CHP technology. Both systems have been compared from energy and economic perspectives. The final conclusion is that the scenario composed only of gas engine CHP is much more efficient as well as being a bit cheaper annually. Moreover, environmental effects are also taken into account when the decision is made. Broadly speaking, the introduction of a district energy system in Spain offers a great opportunity to promote the use of efficient technology in the residential sector by installing CHP systems combined with absorption possibilities. These systems provide a big potential to decrease greenhouse gases emissions; contributing to the fight against climate change. However, an important effort by the authorities will be necessary to support district systems and to change the current attitudes of society. Citizens must be made aware of environmental problems and real needs of using renewable and efficient energy.

Abbreviations AM Absorption Cooling Machine
BOE Boletín Official del Estado (Official State Bulletin)
CHP Combined Heat and Power
CHCP Combined heating, cooling and power generation
CM Compression Cooling Machine
CNE Comisión Nacional de la Energía (Nacional Energy Comisión)
COP Coefficient of Performance
CTE Código Técnico de la Edificación
DC District Cooling
DH District Heating
BB Biomass boiler
GB Gas Boiler
GT Gas Turbine
GE Gas Engine
IDEA Instituto para la Diversificación y Ahorro de la Energía
MODEST Model for Optimization of Dynamic Energy Systems with Time dependent
components and boundary conditions
MPa Megapascal
MW Megawatt
MWh Megawatt Hour
O&M Operating and Maintenance
OMEL Operador del Mercado de Energía
RD Royal Decree
REE Equivalent Electric Efficiency
TOE Ton Oil Equivalent

Table of contents 1. Introduction.............................................................................................................. 1
1.1. Background....................................................................................................... 1 1.2. Objective........................................................................................................... 1 1.3. Limitations ........................................................................................................ 1
2. Literature study ........................................................................................................ 2 2.1. District heating and district cooling.................................................................. 2
2.1.1. District heating ......................................................................................... 2 2.1.2. District cooling.......................................................................................... 4 2.1.3. Environmental effects .............................................................................. 4 2.1.4. Situation of district energy system in Spain ............................................. 5
2.2. Cogeneration and trigeneration....................................................................... 7 2.2.1. Cogeneration ............................................................................................ 7 2.2.2. Trigeneration .......................................................................................... 10 2.2.3. Efficiency parameters of cogeneration Systems .................................... 11 2.2.4. Environmental and economic advantages ............................................. 12 2.2.5. Development of cogeneration in Spain.................................................. 12
2.3. Combined Heat and Power technology.......................................................... 18 2.4. Cooling techniques: Compression and absorption systems .......................... 20
2.4.1. Compression cooling .............................................................................. 20 2.4.2. Absorption cooling ................................................................................. 21
2.5. Biomass in Spain ............................................................................................. 24 2.6. Current heating and cooling systems in Spain ............................................... 26 2.7. Electricity market in Spain: Special Regime.................................................... 29
3. Method ................................................................................................................... 31 3.1. Gathering of facts ........................................................................................... 31 3.2. Gathering of data............................................................................................ 31 3.3. MODEST software........................................................................................... 32 3.4. Scenario modelled.......................................................................................... 33 3.5. Sensitivity analysis .......................................................................................... 33 3.6. Limitations ...................................................................................................... 34
4. System description ................................................................................................. 35 4.1. Location of the urbanization .......................................................................... 35 4.2. Description of the urbanization...................................................................... 36 4.3. System model ................................................................................................. 37 4.4. Input data ....................................................................................................... 38
4.4.1. Demand characteristics .......................................................................... 38 4.4.2. Equipment prices and characteristics .................................................... 42 4.4.3. Fuel prices............................................................................................... 42
5. Results of the optimization .................................................................................... 44 5.1. Scenario modelled.......................................................................................... 44
5.1.1. Components of the system .................................................................... 44 5.1.2. Energy consumption............................................................................... 45 5.1.3. Production of heating, cooling and electricity ....................................... 46 5.1.4. Duration graphs...................................................................................... 49 5.1.5. CO2 emissions ......................................................................................... 50

5.1.6. System cost............................................................................................. 50 5.1.7. Alternative operation ............................................................................. 50 5.1.8. Calculation of the REE............................................................................. 51 5.1.9. Energy analysis ....................................................................................... 51 5.1.10. Economic analysis................................................................................... 52 5.1.11. Sensibility analysis .................................................................................. 53
5.2. Alternative scenario........................................................................................ 54 5.2.1. Components of the system .................................................................... 55 5.2.2. Energy consumption............................................................................... 56 5.2.3. Production of heating, cooling and electricity ....................................... 58 5.2.4. Duration graphs...................................................................................... 60 5.2.5. CO2 emissions ......................................................................................... 61 5.2.6. System cost............................................................................................. 61 5.2.7. Alternative operation ............................................................................. 62 5.2.8. Calculation of the REE............................................................................. 62 5.2.9. Energy analysis ....................................................................................... 62 5.2.10. Economic analysis................................................................................... 63
6. Discussion and conclusion...................................................................................... 65 References ...................................................................................................................... 68 Appendixes ..................................................................................................................... 72
Appendix A.................................................................................................................. 72 Appendix B.................................................................................................................. 75 Appendix C.................................................................................................................. 76

1. Introduction
1. Introduction This chapter gives an introduction to the issue of the thesis. The background describes why the
issue is interesting to investigate; followed by the main purpose of the analysis. Further on in
this section a brief explanation of the main limitations found during the work is given.
1.1. Background In Spain, the current situation is that heating and cooling demand is met by individual systems. In the great majority of the cases, boilers and small air conditioning equipment are installed in each dwelling or building. This results in high fuel and electricity consumption. The idea of the thesis is to study the possibility of installing district energy systems that supply energy to a residential area. This type of system has been widely used around the world but its introduction has been slow in Spain, where only a few of these systems have been installed. The intention of district energy systems is that the energy is produced centrally and then distributed to all the users in the area through a shared infrastructure. In this way, it is possible to use efficient technology such as cogeneration systems, thereby decreasing fuel consumption and environmental effects. On the other hand, the climatic change due to the increase of greenhouse gases in the atmosphere is an important preoccupation for Spanish authorities. They support renewable energy and efficient technology concepts by means of economic incentives.
1.2. Objective The main objective of the thesis is to promote the introduction of district energy systems in Spain as a way of replacing current individual systems. The present work analyses the possibility of installing a central system that produces heating, cooling and electricity to meet the energy demand of a residential area composed of diverse types of building with different final functions. The thesis is based on the design and optimization of a district energy system located in Zaragoza (Spain). The energy system is optimised by using an optimization program called MODEST that helps to decide the type of components and fuels used as well as the most profitable method of operating. Furthermore, it is desirable that the system is efficient and environmental friendly.
1.3. Limitations The first limitation of the work was to find reliable input data about the several types of energy demand of the considered buildings. It was a complicated task involving a great deal of time because it is not usual to register the hourly energy consumption of a place. The types of buildings included in the urbanization have been defined taking into consideration the available input data. Furthermore, it proved extremely difficult to collect all the input data about the technology and fuels used in these types of systems as well as to adapt them for use in MODEST software. Finally, it was necessary to build a simulation model, to overcome various problems, which were ultimately resolved by this means.
More limitations and assumptions made during modelling are described in detail in the section 3.6. Limitations.

2. Literature study
2
2. Literature study The study of available literature is an important aspect in order to acquire a deep knowledge
about the topic to be developed during this thesis. A detailed study must be done in order to be
able to analyse the situation and to make conclusions. This section presents the literature that
has been studied to make the evaluation. First, a description of DH and DC systems is given
followed by an explanation about cogeneration and trigeneration. Next, the CHP technologies
and the different cooling techniques are analysed.
2.1. District heating and district cooling District heating and cooling systems are thought to be one of the most outstanding ways to maximise the efficiency of processes that are used to produce heating and cooling. They allow an electricity generation process to be optimised by using CHP plants that save energy. Furthermore, different types of fuels can be used to produce it, increasing fuel flexibility and providing opportunities for introduction of renewable energy sources as well as industrial waste heat.
2.1.1. District heating
District heating represents a type of energy which is thought to be cleaner. It is produced in an efficient and cost-effective way. Heat generation is centralized and DH is delivered to residential homes and commercial buildings in a certain area. DH systems can provide both space heating and hot water. [IEA DHC, 2009] District heating uses water that is centrally heated and distributed through a pipe-system to individual users in areas of high concentration of activities and housing. In large cities several thousands of users can be connected to the system. In DH systems, heat is supplied to all customers in the city through a supply pipe in the ground and distributed to all substations of the houses which are connected in parallel between the supply pipe and the return pipe. DH delivers heat in services pipes to the house heating system and to the tap hot-water system by means of district-heating substations. The water then returns to the plant to be heated again. Any district heating network is composed of three main sectors: production, distribution and market (customers). [IEA DHC, 2009] District heating presents a number of advantages which have contributed to its quick development all over the world. It offers flexibility for heat production and enables combined heat and power production. Technically, larger system results in better efficiency and lower specific costs. What is more, the plant can use many types of fuels; it is possible to use local energy sources, such as biogas or wood fuel. It can also absorb low grade heat sources such as garbage burning or industrial waste heat, which are released to the environment in countries that do not use DH system. Thus, it is an environmentally friendly way to heat houses, buildings and schools. [Danfoss, 2009]
DH network is made up of with steel pipes with a compound integrated plastic jacket (jacket pipes). Pipes have to be installed in order not to move too much in the ground when they are heated up. In smaller systems, pipes make of flexible copper or plastic can be used, which are more simple and cheaper to install. However, plastic pipes have a limited pressure of 6 Bar and temperature of 90°C.

2. Literature study
3
The temperature of supply of DH depends on the expected load, which is a function of the outdoor temperature. Figure 1 shows typical DH-temperatures in supply and return pipes.
Figure 1: District heating temperatures. Source: Zinko, H., 2008
Some typical design values in northern countries can be pressure of 1,6 MPa (16 Bar), temperature of approximately 120 ºC (130 – 140 ºC) and flow velocity from 1 m/s in smaller pipes to 2 m/s in larger pipes. The pressure of the water in the pipes drops due to the friction in the pipes. Therefore, the pressure difference is measured at a distant point away from the plant. If the pressure difference is too small, the pump is ordered to deliver a higher pressure. Control valves in the substations control the flow to each load and temperature sensors at the customer demand side control the amount of flow which is necessary in order to heat the water to the desired temperature. The temperature of radiators which is the temperature of the DH supply pipe is controlled according to the outdoor temperature. At the heating plant, there is only one pump which pumps all the water needed by the whole city. [Zinko, H., 2008] Heat losses of a district heating system are presented in Figure 2. The most significant losses are due to distribution of DH.
• Production losses 8 - 12 %
• Distribution heat losses 10 - 20 %
• Customer losses 5 - 10 %
Figure 2: heat balance in district heating system. Source: Zinko, H., 2008
A successful district heating system requires both a cheap local energy source and a heating market. For example, the most used energy sources in Nordic countries are: waste heat from power generation in Denmark and Finland, geothermal energy in Iceland, waste heat from incineration in Norway and a mixture of several energy sources in Sweden. [Nordvärme, 1996]
District heating systems have been built all over the world. In Europe, DH has been introduced into many countries. Some of them are mentioned as follows. In Sweden, DH has reached a significant position with a high penetration in the heat market. The total DH production is

2. Literature study
4
estimated to 50 TWh per year. It is produced by CHP plants using a mixture of heat sources in order to reduce fuel oil dependence; main fuels are coal, wood chips, peat, heat from waste incineration and waste heat recovered from industrial processes. In Austria, the largest district heating system is in Vienna producing 5163 GWh per year in 2005, using 22 % heat from waste incineration and 72 % from waste heat from municipal power plants and large industrial plants. In Denmark, DH has been installed in the main cities; it produces more than 60% of space heating and water heating by generating 82.4% of it in CHP plants. In Finland, district heating represents 50% of the total heating market, produced mainly by cogeneration plants. In Germany, the largest DH network is located in Berlin. The total connected heat load is around 52.729 MW and 83% comes from CHP plants using mainly natural gas and coal. In Iceland, DH has the highest penetration covering 95% of the demand and it is produced from geothermal energy. Other countries that use district heating are Italy, Norway, Russia, Serbia
and the United Kingdom. Moreover, district heating is also used in the United States, Canada and Japan. [Wiki DH, 2009]
2.1.2. District cooling
Nowadays, cooling demand requires much more energy than heating. Hence, district cooling has been developed quickly. DC networks operate in the same way as district heating networks. Water is chilled centrally and then distributes to multiple buildings through an underground pipe network. This cold water is used in cooling processes of industry or to create thermal comfort in residential housing, shops or offices. The cooling is provided from a cooling plant where it is centrally produced in an efficient way. In this way, it is possible to eliminate the need for individual traditional air conditioning systems in buildings. [Danfoss, 2009] Chilled water supplied by DC systems may be produced by different techniques. The most common ways are compression cooling and absorption cooling. Usually, a mix of techniques is used to get the optimal solution. In Europe, several sources are used to produce cold water, such as cold sea or lake water, but also DH and industrial waste heat that fuel absorption machines [Danfoss, 2009]. A competitive way is to use heat produced by CHP plants with high combined efficiency. So, thermal energy turns into cold water by means of absorption cooling chillers. It is also useful to take advantage of heat production during hot seasons. [Nccc, 2009]
Basically, a DC system consists of three main components: the central plant including power generation, cooling equipment and thermal storage; the distribution network and the consumer system which is composed of air handling units or fan coils and chilled water piping in the buildings. [Nccc, 2009]
Furthermore, district cooling offers a good opportunity to reduce electricity consumption; decreasing it by more than 65% compared to traditional air conditioning systems. As well as being a technology with minimum environmental impact that uses energy efficiently and with low air emissions. [Danfoss, 2009]
2.1.3. Environmental effects
District heating and cooling system are thought to have a big potential to reduce greenhouse gas emissions. This importance has been accepted in many member countries where they are introducing these types of systems as well as other technologies to reduce environmental impact. It provides an attractive solution for meeting environmental targets established by the Kyoto protocol.

2. Literature study
5
District systems offer an excellent opportunity for reducing environmental pollution and saving energy. These systems let one use flexible technology such as combined heat and power which works with any fuel including renewable energy resources or industrial waste energy. [IEA DHC, 2009]
2.1.4. Situation of district energy system in Spain
Because of Spain characteristics, the first district heating networks are starting to be developed and they are mainly fuelled by biomass. They can be utilized to supply heat during the cold period and to refrigerate in summer. At present, there are only a few small district heating systems in Spain because DH systems are not commonly used as a heat production solution. Some of them are going to be explained in this section. In the last part, the development of a new project based on heating and cooling production is mentioned.
• Cuéllar Project (Segovia)
Cuéllar is a 10.000 inhabitant town sited 120 km north of Madrid, with numerous wood industries in the area. The district heating system is based on a 5.95 MWth plant with two wood waste boilers. It supplies hot water for heating and sanitary water by using the waste from those mills. The system supplies district heating to more than 1000 inhabitants (15 detached houses, 5 blocks of flats and some municipal buildings: a sports’ centre, a library and a public school for 500 pupils). The DH plant is fuelled by waste recovered from forest cleaning as well as other types of biomass because the boilers are prepared to use bark, saw wood or plywood as fuel indistinctly. In this case, the use of wood waste coming from nearby industries (furniture, boards and other wood mills) facilitates a cheap energy source to feed both boilers: a 5,25 MW unit for winter heating and a 0,7 MW unit for sanitary water in summer. The DH is distributed to the users through pre-isolated piping, with a heat counter in each one for municipal invoicing. The plant is maintained by the city council with the collaboration of Valladolid University, whose technical department gets and analyses the results, advising IDAE and EREN about eventual corrections and improvements in the system. The main aim of the IDAE was to study the feasibility and real exploitation conditions for this type of plant, to produce heating in cold areas of Spain, where DH systems are not commonly used to produce heating. The project implementation took 9 months, and started to operate in March 1999. [Heymo, 2009]
Figure 3: DH system in Cuéllar. Source: Heymo, 2009

2. Literature study
6
• Sant Pere de Torelló Project (Barcelona) The first district heating system was built in 1993 in Sant Pere de Torrelló (Barcelona). It is a biomass plant that consumes between 6.000 and 7.000 tons per year of biomass. The system supplies district heating to 540 of the 800 homes in the municipality.
Figure 4: DH system in Sant Pere de Torelló. Source: Solé, 2009
In the future, this system might be substituted by a new cogeneration plant because the old one is inefficient both from the point of view of energy and economy. The CHP plant will produce district heating and electricity to meet the demand of the area, which is estimated to be 4.5 MWe. The total power generated will be 5.4 MWe. [Biomasa, 2009] [Solé, 2009]
• Molins de Rei Project (Barcelona) This district heating system was built in Molins de Rei (Barcelona). It is based on a mobile grate boiler of 2 MW and a biomass boiler of 1.7 MW which is fuelled by 3.000 tons of wood waste per year. It reduces the production of 3.000 tons of CO2 annually. The system produces heat to supply hot water and heating to 700 dwellings. [Biomasa, 2009] [Solé, 2009]
Figure 5: DH system in Molins de Rei. Source: Solé, 2009

2. Literature study
7
• Tub verd Project - Mataró (Barcelona)
This system started working in 2003 and it supplies heat to several schools, the Mataró hospital, the municipal swimming pool and a municipal sports’ centre which uses absorption chillers during summer. In the near future, the system will meet the demand of several dwellings. The total thermal power produced was 4.9 MWth in 2006. The system consists of a Natural Gas engines CHP with an installed power of 6 MWe and furthermore, it recovers the waste heat from waste mud drying. It is believed that the system will supply 12.000 MWh of heat per year and it will prevent the production of 500 tons of CO2. The cost of the system is estimated to be 3.630M€. [Biomasa, 2009] [Solé, 2009]
Figure 6: DH system in Mataró. Source: Solé, 2009
• Geolit Project (Jaén)
This project will be the first project developed in Spain that will produce hot and cold water. The project is being developed in a Science and Technology Park in Mengibar (Jaén) and it will cost 2,3 M€. It is a project that promotes the use of renewable energy sources and applies energy efficient measures. The system is going to supply district heating and district cooling to the buildings of the Park with an estimated total surface of 33.000 m2. The energy will be supplied by two biomass boilers with a power of 3 MW each. The boilers will be fuelled by more than 800 tons of biomass per year. The fuel used is olive chips, wood waste and other types of biomass. The cooling will be produced by an absorption cooling plant [Biomasa, 2009].
2.2. Cogeneration and trigeneration
2.2.1. Cogeneration
Cogeneration (also known as Combined Heat and Power or CHP) is the process in which electricity and heat is produced simultaneously, both used thereafter in different applications. The fundamental principle of cogeneration is to maximise efficiency of systems by obtaining as much final energy as possible from a fuelled plant. CHP can substantially increase the efficiency of energy utilization, resulting in lower operating costs for the user. Systems should be designed according to the heat demand of the application. This can be an individual building, an industrial plant or a district heating and cooling system for a city. [Cogen, 2009]

2. Literature study
8
By producing heat and electricity at the same time, the efficiency of a cogeneration plant can reach up to 90%. Therefore, CHP offers a big potential of energy saving which represents between 15 and 40% compared to conventional systems. Traditionally, electricity and heat was generated from separate conventional power stations and boilers. CHP uses the heat that would be wasted in a conventional power plant to produce electricity. Consequently, less fuel is consumed to produce the same amount of useful energy [Unep, 2009]. Figure 7 and Figure 8 illustrate the differences of power generation in a cogeneration system compared to a conventional system.
Figure 7: Typical cogeneration scheme Source: Unep, 2009
Figure 8: Typical conventional power generation scheme. Source: Unep, 2009
The benefits that cogeneration offer society by optimising the energy supply are important. Cogeneration is the most efficient way of power generation reducing environmental emissions, in particular CO2 which is the main greenhouse gas. So, it becomes a helpful solution to achieve the Kyoto Protocol targets. Moreover, cost savings are significant, providing additional competitiveness for industries and domestic users. It offers also an opportunity to decentralise electricity generation, providing that plant is designed to meet the needs of local consumers with high efficiency, reducing transmission losses and increasing flexibility and security of supply. In addition, cogeneration reduces the import dependency of fuels and promotes liberalisation in energy markets. [Educogen, 2001]
End users with significant thermal and power needs can generate both thermal and electrical energy in a single CHP system. Heat is generally recovered in the way of steam or hot water. However, in some cases it can be used directly for applications such as heating or drying processes. Apart from this, the waste heat can be utilized to drive equipment that is thermally activated, such as absorption chillers for cooling. [Cogen, 2009b] Important characteristics for CHP technology are:
• Annual operating hours: typically more than 6 000 • High thermal and power output resulting in high overall efficiency • Low maintenance costs • Low emissions • High reliability

2. Literature study
9
Traditionally, CHP systems have been applied to larger industries with high steam and power demands such as chemicals, paper or refining but also for institutional applications such as universities and hospitals. Currently, a large potential can be found for smaller CHP systems in light industrial or commercial and residential applications. Some important requirements to consider before deciding to install a cogeneration system are: great amount of heat consumption, fuel supply reliability and high utilization factor (>5 000 hours/year). [Unep, 2009]
Figure 9: CHP plant in Winnington. Source: http://www.flickr.com
A cogeneration system can be classified according to three points [Lozano, M.A., 2008]:
1. Process sequence in heat and electricity production:
- Bottoming cycle: heat is produced first
- Topping cycle: electricity is produced first
2. Power generation capacity:
- Micro CHP: <50 kWe
- Mini CHP: 5-500 kWe
- Small scale: 500KWe-5 MWe
- Medium scale: 5-50 MWe
- Large scale: >50 MWe
3. Depending on the type of motor machine.
- Steam turbine
- Gas turbine
- Reciprocating engine
- Combined cycle
- Micro turbines
- Fuel cells
- Stirling engines

2. Literature study
10
2.2.2. Trigeneration
Trigeneration is a particular case of cogeneration in which waste heat from processes is utilised to generate cooling by means of absorption chillers. It is the simultaneous production of three types of energy: cooling, heating and electricity, by using only one fuel input. Trigeneration is also known as CHCP that stands for combined heating, cooling and power generation. A typical trigeneration plant can be described as a cogeneration plant that has added absorption chillers. The system converts waste heat from the CHP plant into chilled water. Four forms of energy can be obtained from this process: hot water, steam, chilled water and electricity. [Trigen, 2009b]
Figure 10: Typical trigeneration system. Source: GEenergy, 2008
Trigeneration systems offer some advantages over conventional systems. The main factors that support its development are global efficiency increase, reliability of energy supply and decrease of annual costs. Generally, the global system efficiency of a trigeneration power plant reaches values from 86% to 93% compared to 33% of a typical central power plant. Besides, it is also more efficient than CHP plant. [Trigen, 2009]
Figure 11: Energy flows in a trigeneration system. Source: Trigen, 2009

2. Literature study
11
Cooling technology enables CHP plants to be used during warmer season, increasing equipment utilization and reducing amortization period. Moreover, trigeneration is promoted by The European Union because it is thought that it can help to reduce climatic change. It is the most environmental friendly method of generating power and energy, especially when the fuel source is Biodiesel or Biomethane. [Trigen, 2009]
Trigeneration systems are usually installed in hospitals, universities or groups of residential and offices buildings. In this case, it is also referred to as a "district energy system" or "integrated energy system". This possibility for supplying both heating and cooling for buildings is really interesting, because these systems offer greater operational flexibility. This is particularly relevant in countries where buildings need to be air-conditioned and industries require process cooling. [Trigen, 2009] There are different possibilities for refrigeration [GEenergy, 2008]:
• Absorption chillers: - Operation with hot water - Operation with steam - Direct heat through combustion
• Compression-type refrigeration machines: - Direct drive power - Electrical drive power
2.2.3. Efficiency parameters of cogeneration Systems
It is necessary to define several parameters in order to value investment opportunity, select the most adequate system and optimize its operation. Then, the cogeneration system is supposed to be a black box in order to simplify the system. It consumes F units of fuel (lower heating value - LHV) and produces W units of power and Q units of heat simultaneously. This system is compared to a conventional system producing the same amount of heat and power separately. [Lozano, M.A., 2008] Figure 12 shows the energy flows in a cogeneration system and in a conventional system to be compared.
Figure 12: Comparison between a cogeneration system and a conventional system.
Source: Lozano, M.A., 2008
The fundamental parameters that determine the energy performance of the system are:

2. Literature study
12
Electric efficiency RWF = W/F Thermal efficiency RQF = Q/F Global efficiency ηe = (W + Q)/F Power Heat Ratio RWQ = W/Q Being F the primary energy fuelled, W the electricity generated and Q the heat produced that meet the energy demand (no waste heat included). Moreover, other parameters which are useful to compare different cogeneration systems to conventional systems are defined below. Primary energy saving ∆F = F* - F =F W+ FQ –F = W/ηW + Q/ηQ – F Fuel energy saving ratio FESR = I∆F = ∆F/F* = 1 – F/ [W/ηW + Q/ηQ] Equivalent electric performance REE = ηee = W/(F - FQ) = W/(F – Q/ηQ) FESR and REE are used to find out if cogeneration systems are more efficient than conventional system producing heat and power. The last parameter REE must higher than the minimum equivalent electric performance REEmin to be able to receive an extra income when electricity is sold. It is established by Special Regime in “Royal Decree 661/2007”. [Lozano, M.A., 2008]
2.2.4. Environmental and economic advantages
Cogeneration systems are highly efficient systems and offer a real opportunity to save primary energy and reduce fossil fuel usage; resulting in a reduction of greenhouse gases emissions and energy costs. CHP plants also improve security of energy supply and decrease risks associated with rapidly rising electricity prices. Besides, transmission and distribution losses can be reduced when many smaller CHP plants are constructed near consumption areas. [EnerG, 2009] Cogeneration reduces environmental impacts and helps to achieve Kyoto Protocol targets, decreasing CO2, NOx and SO2 emissions. In Spain, it shows a saving of primary energy of 850.000 toes per year, which means 3% of the total natural gas imports. It also prevents the production of from 7Mton of CO2 per year. In conclusion, without using cogeneration Spain will break the Kyoto Protocol targets by 5% more than at present. [Acogen, 2009]
2.2.5. Development of cogeneration in Spain
In Spain, cogeneration systems had the greatest and widest use at the end of the XIX century and the beginning of the XX century. Some years later, the development of the electrical sector meant that big power facilities and distribution networks were built. Therefore, cogeneration systems were moved to medium-sized industries. Nevertheless, this situation started to change between 1973 and 1979. Oil dependency problems forced the authorities to promote efficient energy use. Some research projects were done and the Government gave help to support investment, financing and electricity sales. This development was also due to the availability of natural gas in Spain. It was a clean and easily used fuel; hence, supply systems were reconverted to use the new fuel. On the other hand, deregulation of energy markets provided electricity purchase and sale. The two last factors that promote a CHP system were increasing environmental concerns and cogeneration technology development. [Lozano, M.A., 2008]

2. Literature study
13
In Spain, cogeneration is located mainly in industrial areas. The distribution of cogeneration capacity in Spain in 2006 is shown in Table 1.
Table 1: Cogeneration capacity in Spain’s industrial areas. Source: Viladrich-Grau, M., Vila, J., 2007.
AREA CAPACITY (MW) NUMBER OF
PLANTS
Catalonia 1194 138
Andalusia 701 49
Galicia 595 84
Valencia 579 141
Castilla-Leon 509 55
Cogeneration plants are principally built in industries with intensive energy use. The presence of cogeneration in the tertiary sector only represents 7.4% due to the low residential heating hours required during the year compared to other European countries; although it is thought that the cogeneration combined with refrigeration (trigeneration) is going to be well-developed in this sector because a number of social changes in Spain have increased the cooling demand in the tertiary-residential sector. Accordingly and as a response to these needs cogeneration will expand. [Viladrich-Grau, M., Vila, J., 2007]
The distribution of cogeneration systems in Spain divided by sectors is gathered in Table 2.
Table 2: Distribution of cogeneration by industry sectors. Source: Viladrich-Grau, M., Vila, J., 2007.
SECTOR INSTALLED POWER
(MW) NUMBER OF
SYSTEMS PERCENTAGE (MW by industry sector)
Agro-alimentary industry 1057 138 18.2
Chemical industry 944 54 16.3
Paper mill industry 876 75 15.1
Oil refinery 577 11 9.9
Non metal ore industry 536 157 9.2
Other industries 581 83 10.0
Textile industry 412 61 7.1
Buildings and services 432 98 7.4
Other 388 63 6.7
TOTAL 5803 740 100
According to the primary energy used, in 2006, natural gas represented 72% of cogeneration plants and 64% of the available capacity. Secondly, liquid fuels corresponded to 25% of available capacity and the main fuels are oil derivatives such as diesel, gasoline, fuel oil or refinery gas. The rest of fuels had limited significance; they fuelled 3% of plants and represented 11% of available capacity. [Viladrich-Grau, M., Vila, J., 2007]
In 2007, the most commonly used fuel in power CHP system was natural gas which represents over 80%, followed by fuel oil or gas oil with 10%. The distribution of fuels used in CHP system is shown in Figure 13.

2. Literature study
14
Fuels used in CHP systems
81%
10%
4%4% 1%
Natural gas
Fuel oil / Gas oil
Other fuels
Refinery gas
High oven gas
Figure 13: Distribution of the fuels used in CHP systems. Source: Cogen, 2009
When cogeneration plants are studied from the point of view of installed capacity, it is seen that more than 50% of plants have a capacity of between 1 and 5 MW. Hence, Spanish cogeneration profile is made up of many small and low-capacity CHP plants. This fact may explain why cogeneration is not currently considered a real option for the production of electricity on a large scale. The main objective of these small plants is often to reduce energy costs for the companies, instead of producing electricity.
The technologies most frequently employed for cogeneration are, combined cycle, condensed steam turbines, internal combustion engines and gas turbines with counter-pressure heat recovery. [Acogen, 2009] The cogeneration installed power has been increasing rapidly and it was 6075 MW from 874 CHP plants in 2007. [CNE, 2009] The evolution of the installed power and electricity sold in the market can be seen in the Figure 14.
Figure 14: Evolution of the cogeneration installed power in Spain. Source: Cogen, 2009

2. Literature study
15
In Figure 15, the increase in the number of CHP plants installed in Spain can be seen.
Figure 15: Evolution of the number of CHP plants in Spain. Source: Cogen, 2009
At present, the production of electricity from cogeneration systems represents over 11% of the total electricity generated. This evolution is shown in Figure 16.
Figure 16: Percentage of the electricity production from CHP systems. Source: Cogen, 2009
At present, the characteristics of the cogeneration in Spain are listed as follows:
• More than 6.000 MW of installed power
• Approximately 900 CHP plants distributed around Spain
• It creates more than 4.500 direct employment positions and more than 10.000 indirect employment positions
• It has a turnover of more than 3.800 M€ per year

2. Literature study
16
• The total electricity fed into the public grid is 19.700 GWh per year
• The total electricity generated is estimated to be over 29.700 GWh per year
• It covers almost 10% of the electricity demand of Spain
• Primary energy saving of 850.000 toe per year, which means 3% of the total natural gas imports.
• Water saving of 40 million of m3 per year.
• It prevents the production of some 7 million of tons of CO2 per year.
In general, the electricity is produced by different types of fuels. Table 3 gathers the total electricity generated from the diverse fuels and the annual variation. [Energía, 2008]
Table 3: Total electricity production in Spain. Source: Energía, 2008
TOTAL ELECTRICITY PRODUCTION (GWh)
2006 2007 VARIATION (%)
HYDRO 25 330 26 447 4.4
FOSSIL FUELS 150 737 158 239 5.0
NUCLEAR 60 126 54 982 -8.6
Ordinary Regime 236 193 239 668 1.5 %
RENEWABLE AND
WASTE 33 069 37 845 14.4
COGENERATION 34 418 35 043 1.8
Special Regime 67 487 72 888 8
TOTAL 291 045 300 146 3.1
The distribution of fuels used to produce electricity is represented in Figure 17. 87% of the electricity is generated in Ordinary Regime by hydro, fossil fuels and nuclear; production in Special Regime only represents 12% and this electricity comes from renewable sources, waste or cogeneration. In Spain, electricity is mostly produced from fossil fuels which correspond to 60% of the total. [Energía, 2008]
Electricity production
37%
4%8%1%11%
16%
18%
5%
Combined cycle
Wind
Other:CHP,biomass,
minihydro,w aste…
International exchange
Hydro
Nuclear
Coal
Fuel/Gas
Figure 17: Distribution of the fuels used to produce electricity in December 2007.
Source: Data from Energía, 2008

2. Literature study
17
The evolution of the electricity which is sold in Special Regime can be observed in Table 4. Generally, it has been increasing annually, which means that people have started to become concerned about environmental issues.
Table 4: Evolution of the electricity sold in Special Regime. Source: Energía, 2008

2. Literature study
18
2.3. Combined Heat and Power technology This section describes the current status of some natural gas-fired distributed energy resource technologies. The power technologies analysed can be used in CHP plants. Despite being capable of utilizing a variety of fuels in a range of applications, these technologies are evaluated according to electric power and combined heat and power (CHP) applications using natural gas [Nrel, 2003]. The technologies characterized can meet the needs of a wide range in the residential, commercial and industrial sectors. Comparative performance and costs of each technology option must be taken into consideration in order to decide the best alternative. Table 5 compares the characteristics of each technology.
Table 5: Comparison of CHP technologies. Source: Nrel, 2003
• Reciprocating Engines Reciprocating internal combustion engines are a widespread and developed technology for power generation. They can be used for all types of power generation. Spark ignition engines for power generation use natural gas as the preferred fuel but they can run on propane or gasoline. However, compression ignition engines operate on diesel fuel or heavy oil, moreover they can run in a dual-fuel configuration burning primarily natural gas with a small part of diesel fuel. The advantages of using this technology are several: low investment cost, easy start-up, reliability when properly maintained and good load-following characteristics. On the

2. Literature study
19
other hand, some drawbacks can have relatively high noise levels, rather high air emissions, and regular maintenance required. Gas-fired reciprocating engines are well suited for CHP in commercial and light industrial applications of less than 5 MW. Smaller engine systems may be used to produce hot water and larger engine systems are designed to produce steam at low pressure. [Nrel, 2003]
• Gas Turbines Gas turbines are an established technology in sizes from several hundred kilowatts up to about 50 MW. They produce high-quality heat which is used to generate steam. This steam usually runs a generator to produce electricity, it is known as combined-cycle configuration. Gas turbines mainly burn natural gas, but also they can be fuelled by a variety of oil fuels or have a dual-fuel configuration. An important advantage of gas turbines CHP systems is the high-quality of waste heat available in the exhaust gas, apart from which maintenance costs are one of the lowest. That is why gas turbines are a great option for industrial or commercial CHP applications larger than 5 MW. This CHP technology is also useful in many industrial processes where the high-temperature exhaust gas is appropriate for generating steam at high pressure. By running a gas turbine in simple cycle, the hot exhaust gas may be employed directly in a process of the industry or used to generate steam and hot water by adding a heat recovery steam generator. [Nrel, 2003]
• Steam Turbines Steam turbines are one of the most versatile and oldest main technologies used to drive generators and mechanical machinery. What’s more, steam which runs the turbine is extracted to be utilized directly in a process or to be converted to other types of thermal energy such as hot water or chilled water that may be used for district heating and cooling. The capacity of steam turbines can reach several hundred MW for large utility power plants. Steam turbines are run by high pressure steam which must be produced in a boiler or heat recovery steam generator. Boilers can be fuelled by different varieties of fuels, including natural gas, fossil fuels such as coal and oil or renewable fuels like wood or municipal waste. Steam turbines CHP systems are mainly used in industrial processes where solid or waste fuels are available to be burnt in boilers. [Nrel, 2003] Figure 18 illustrates the range in which the mentioned technologies operate as well as power heat ratio achieved.
Figure 18: Selection of the cogeneration system. Source: Modified from Lozano, M.A., 2008

2. Literature study
20
In Spain, the most installed technologies in cogeneration systems are gas turbines and internal combustion engines. Gas turbines produce electricity during 80% of the year, while engines have an average functional time of 48% and they represent 42% of the total capacity. Once the system is in operation, the cogeneration production costs for gas turbines are lower than for engines. Nevertheless, internal combustion engines have less start-stop difficulties than gas turbines. Hence, they are more flexible, being turned on and off to meet the demand requirements much faster and with less cost than turbines [Viladrich-Grau, M., Vila, J., 2007].
2.4. Cooling techniques: Compression and absorption systems
2.4.1. Compression cooling
Electrical compressor chillers are the most widespread type of technology used to create cooling. It is used to produce air conditioning and refrigeration in buildings, industries and automobiles. The main components of the simple compression system, illustrated in Figure 19, are a compressor, a condenser, an expansion valve and an evaporator.
Figure 19 : Simple compression cycle . Source: Modified from Ruiz, 2007.
The compressor is used to increase the pressure and the temperature of the refrigerant vapour from the evaporator to the condenser. The cooling capacity of the machine is regulated by changing the output temperature of the compressor. The refrigerant vapour at high pressure is cooled in the condenser by means of air or water, and it becomes a liquid. Then, it goes through an expansion valve to reduce the pressure in the evaporator. In the evaporator the cooling effect takes place. The refrigerant liquid evaporates by taking heat away from the space. The evaporator receives two different names according to its operation; when the air of the space that needs to be chilled is cooled directly by the evaporator it is called air coil. But if the evaporator cools a liquid that is heat exchanged with the space air it is called a chiller. [Fernández, P., 2008a] To produce the cooling effect it is necessary for the temperature of the refrigerant in the evaporator to be lower than the cooled space and in the condenser to be higher than the environmental temperature. In larger systems, water which extracts heat from the condenser is usually cooled in a cooling tower. However, in smaller systems it is possible to use air to remove heat from the refrigerant.

2. Literature study
21
The energy analysis of the cycle is explained by using enthalpy (kJ/kg). The heat removed from the space in the evaporator known as cooling capacity is QL = h6-h5 The work made by the compressor is WC = h2-h1 The heat extraction in the condenser is QH = h3-h4
Thus, it possible to define the coefficient of performance as 12
56
h-h
h-h COP =
However, the real cycle has some losses due to mechanical inefficiencies of the compressor or energy losses in heat transmission and pressure drops that decrease the efficiency of the system. Besides, it is important to select the type of compressor according to the type of refrigerant chosen. There are different types of compressor. For example, centrifugal compressor work better when pressures are low and specific volumes are high; on the other hand, reciprocating compressors work better at higher pressures and smaller specific volumes. Other types of compressor are screw, scroll and vane compressors. [Wulfinghoff, 1999] A simple description of the energy flows in a compression machine (Centrifugal type water chillers) is shown in Figure 20.
Figure 20 : Energy flows in a typical compression machine.
2.4.2. Absorption cooling
The main characteristic of an absorption cooling system is that it uses heat energy as fuel in order to produce cooling. For this reason, it is common to use these systems in plants that have an excess power capacity during the summer season, so it is possible to take advantage of the installed power of the systems used to produce heat.
The components of an absorption machine are integrated closely within a single compact package. The most used pairs of refrigerant-absorber are the system ammonia-water and system water-salt lithium bromide.
There are some differences between chiller models according to the heat source and the number of stages. Initially, absorption chillers were fuelled by steam or hot water at high temperature but currently direct-fired absorption chillers are the most used because they have an integrated boiler reaching higher efficiency levels. Furthermore, single-stage chillers have been replaced by two-stage machines or even multiple-effect ones that provide significantly higher efficiency.
0.17 1
1.17
Electricity
Cooling water
Cold water

2. Literature study
22
In the indirect-fired absorption chillers the power input is steam, hot water or hot gases produced in a boiler or turbine/engine generator. These chillers are usually installed for integration into a CHP system for buildings. During the summer season, the rejected heat produced from the electricity generation is used to cool the buildings by means of absorption chillers. In this way, the feasibility of using otherwise wasted energy increases operating efficiency. [Fernández, P., 2008b]
The main components of an absorption cooling system are the condenser, the throttling valve, the evaporator and the "thermal" compressor that is composed of a generator, an absorber, a pump and a valve or heat exchanger. Figure21 illustrates a basic absorber system. Its operation is explained in the next paragraph.
Figure 21: Single-effect absorption system. Source: Fernández 2008b.
A system using ammonia as refrigerant and water as absorbent is considered in order to explain how the system works.
In the absorption cycle, the ammonia passes through the condenser, the throttling valve and the evaporator, in the same order than in a compression system. The difference is that the compressor is substituted by a thermal compressor composed of an absorber, a pump, a generator and a valve. In the absorber, the vapour of refrigerant is absorbed by means of an exothermic reaction in a poor solution of refrigerant (absorber) that comes from the generator through the valve. The resultant rich solution of ammonia is cooled by the cooling water in order to convert it into a liquid. This water comes from a cooling tower. Then, this liquid is compressed into a pump that increases its pressure up to the generator pressure. In the generator, the rich solution of refrigerant is heated. Therefore, the ammonia turns into steam

2. Literature study
23
and passes through the condenser where it becomes a liquid, and the poor solution goes back to the absorber through the valve. The refrigerant liquid at high pressure passes through a throttling valve that decreases its pressure reaching the evaporator. Then, in the evaporator the cooling effect takes place, the liquid takes heat away from the space that needs to be cooled and it evaporates reaching the absorber where the cycle starts again. The cooling effect is usually distributed by chilled water. The temperatures of water in the condenser and cooled water have a significant effect on the global efficiency. [Marín,J.M., 2007]
The efficiency of the system can be increased by adding a heat exchanger to recover heat from the hot poor solution that leaves the generator and to supply heat to the rich solution that comes from the absorber to the generator. Moreover, double-effect absorption cooling introduces a second generator and condenser that increase the flow of refrigerant, and hence the cooling effect. [Marín,J.M., 2007]
Absorption chillers have a relatively low coefficient of performance compared to compression machines; in this case COP is defined as chiller load divided by heat input. However, using absorption machines enables the operating costs to be reduced because they can be fuelled by low-grade waste heat. On the contrary, compression machines must be driven by a motor or engine. Single-effect machines usually have a COP of 0.7 and it can be increased about 40% by using double-effect machines. In short, absorption cooling is cost-effective when a source of heat produced by low-cost fuels is available or it is possible to utilize waste heat from industries. [AbsChillers, 2009] Trigeneration systems offer some advantages over conventional cooling technology: - Chillers operate with heat, utilizing excess energy. - Produced electricity can be sold in the market or used to cover electricity demand of the plant. - Absorption chillers do not have moving parts. Therefore, operating and maintenance costs are low because there is no wear. - Operation is noiseless. - No use of ozone-damaging substances when water is used as refrigerant. Absorption cooling technology offers an economic and environmental alternative to conventional refrigeration systems. Integrating high efficient CHP equipment with absorption chillers enables to maximize total fuel use and eliminate HCFC/CFC refrigerants, reducing environmental emissions. [GEenergy, 2008] A simple description of the energy flows in indirect-fired absorption water chillers is illustrated in Figure 22.
Figure 22: Energy flows in a typical absorption machine.
1.6 1
2.6
Hot water
Cooling water
Cold water
Electricity
0.01

2. Literature study
24
2.5. Biomass in Spain Biomass is a renewable energy source composed of organic material that comes from trees, grasses, agricultural crops or other biological material; some types of biomass are illustrated in Figure 23. It can be used in the same way as solid, liquid or gaseous fuel to produce electricity, heat or chemicals, instead of using fossil fuels. The main biomass energy resource is wood but there are also other sources such as food crops, residues from agriculture and forest, organic components of municipal and industrial wastes and even gases from landfills. [BioNrel, 2008]
The benefits that biomass can provide are mentioned as follows:
• Great potential to reduce greenhouse gas emissions (SOx, CO, HC, NOx or particles). It is considered CO2 neutral.
• Reduction of external oil dependence by promoting biofuel use in transportation.
• Biomass energy promotes agricultural and forest-product industries.
• Development of a new activity in rural areas, supporting its development.
• Waste management and limitation of fires. • Creation of thousands of jobs.
Figure 23: Types of biomass. Source: http://www.eia.doe.gov/kids/energyfacts/sources/renewable/biomass.html
In Europe, 54% of the primary energy from renewable resources comes from biomass. However, it only represents 4% of the total primary energy; the amount of biomass fuel generated was 55.439 ktoe in 2004. The greater part was used for the generation of heat in detaches houses, neighbourhood communities and central heating systems. In general, 83% is used for thermal uses and 17% for electricity production. [Biomass, 2007] The production of primary energy from biomass in the European Union is shown in Figure 24.
Figure 24: Primary energy production from biomass in EU. Source: Biomass, 2007

2. Literature study
25
In Spain, the optimistic objective of the Renewable Energy Plan 2005-2010 is that biomass resources reach over 19.000 ktoe in 2010, from which more than 13.000 ktoe come from residues and almost 6.000 ktoe from agricultural crops. It means a growth from 2004 of 5.040,3 ktoe (4.457,8 ktoe of electrical production and 582,5 ktoe of thermal production), that means an increase of 1.695 MW in the installed power. At present, biomass represents 45% of the total production from renewable resources, although it only corresponds to 2.9% of the total primary energy consumption. [Biomass, 2007] Thermal applications for producing heat and hot water are the most developed; on the contrary, electricity production is less expanded. Biomass boilers are applied to individual dwellings, industries, buildings of flats or even district heating systems; and its operation is similar to conventional oil or natural gas boilers. These systems need to be installed in a wide and dry room to store biomass fuel; therefore it is more usual to install them in new buildings where a biomass boiler is a good solution from the point of view of both economy and environment. [Biomass, 2007] In general, investment cost of biomass installations is higher than conventional systems; it is due to the limited development of these systems and the special characteristics required to burn biomass efficiently. However, operating and maintenance costs may be competitive in some cases. Biomass fuel cost varies depending on the amount demanded, the transportation distance and the needed treatments to improve its quality. Furthermore, it is necessary to consider fuel availability, seasonality and price changes which are related to crop behaviour. Figure 25 shows a comparison of the prices of different types of fuels. [Biomass, 2007]
Figure 25: Biomass fuel prices (Data of May 2006). Source: Gil, J., 2009
In Spain, the most representative biomass installations are mentioned next:
• Installation for treatment and production of solid biofuels.
• Detached houses heating systems.
• Central heating systems in residential buildings.
• Heating systems in public buildings and hotels.
• District heating systems fuelled by biomass.
• Industrial heat production from biomass.
• Electrical power plants from biomass.

2. Literature study
26
2.6. Current heating and cooling systems in Spain
HEATING SYSTEMS The great majority of Spanish homes use heating supplied by independent elements. Main equipments are heaters, radiators, electric convectors, heat pumps or boilers. A quarter of homes install an individual installation which is independent from the system used in the rest of the dwellings. Only 10% of homes use a centralised installation to supply heating to a group of homes of the same building or neighbourhood community. The most usual elements of a centralised heating are:
- Heat generator: boilers which heat water up to a temperature of 90ºC. - Control system: it adapts system response to meet heating demand and reach
desirable temperature according to comfort conditions. - Distribution system: group of pipes, pumps and radiators needed to distribute the heat
to all the users.
Centralised heating with individual measurements and regulation in each dwelling is much more efficient than individual systems from the point of view economy and energy. These systems have important advantages. The performance of big boilers is higher, therefore energy consumption decreases and lower fuel tariffs are applied. Besides, the investment cost of a collective installation is also lower than the sum of the individual installation costs. In spite of this, centralised systems are being replaced by individual systems in a lot of Spanish dwellings. For example, if we consider a building of ten flats, a central heating system of 100kW will be needed. However, if each flat has its own individual hating system with a power of 25kW, the total power installed in the building will be 250kW.
• Independent heating system
This type of system is designed to produce hot water and heat the rooms of a dwelling. All the apartments of a building have their own heating system installed at home. The system is composed of a boiler, distribution elements (pipes, radiators, …) and control system.
• Central heating system
Sometimes a unique boiler to supply heating to all the dwellings of a housing building, is installed. The heat is distributed by pipes and pumps through the building according to the needs. The advantages of this system are:
- Energy saving increases because when installed power raise, the boiler performance is higher.
- Security improves, because boiler maintenance and operation is the responsibility of the building manager.
- Greenhouse gas emissions reduce due to the fact that only one chimney is used. - Higher efficiency related to maintenance costs.
Central heating systems are usually fuelled by heating oil, natural gas, electricity, biomass or even solar power. However, oil-fired heating systems are not common because of high fuel cost and problems related to storage and delivery [Heat-air, 2009].
The main problems are the arguments between the various dwelling owners to decide the system working hours and the difficulty to regulate the individual flat temperature separately. [GasNatural, 2008]

2. Literature study
27
Boilers Domestic boilers have a power between 4 kW and 400 kW and use liquid and gaseous fuels as heating oil (gas-oil C) or natural gas. There are three types of boilers according to the way in which combustion is produced: - Atmospheric: air from the room where the boiler is installed is taken to produce the combustion. - Watertight: the performance is higher due to the fact that air admission and gases evacuation take place in a closed chamber, without any contact with local air. - Automatic modulation of the flame: this system minimizes starts and stops of the boiler; it is possible to save energy adapting heat supply to the demand by means of the control of the thermal power. As well as the standard boiler, there are other types of boilers with higher efficiency, such as low temperature boilers and condensation boilers. These boilers can save between 15 and 20% of the total fuel consumption compared to a conventional boiler. [GasNatural, 2008]
HOT WATER Hot water demand is the second highest in residential buildings after heating demand. It represents 20% of the total energy consumption. In housing areas, hot water is usually produced by electric or gas boilers. There are two main systems: instantaneous systems and accumulation systems. [GasNatural, 2008]
• Instantaneous systems
In this type of systems, the water is heated at the moment it is demanded. Electrical heaters or gas heaters are used to produce hot water, but it is also possible to use mixed boilers for heating and hot water. The main disadvantage of instantaneous systems is that a considerable amount of water and energy is wasted until hot water reaches the desirable temperature. Besides, each time that hot water is demanded the boiler needs to be turned on, increasing energy consumption and equipment deterioration. These systems do not work correctly when hot water needs to be supplied to several points simultaneously. In spite of that, instantaneous systems keep being the most usual in individual hot water supply.
• Accumulation systems
These systems are divided in two types: - Equipment for heating water (boiler or water heat pump) plus a thermo accumulator. - Thermo accumulator with electrical resistor.
Electrical heat pump is much more efficient in producing hot water than electrical heaters which are not considered as the adequate equipment from the point of view of energy and costs. When hot water is produced centrally for all the users in the building, the most utilized system is the boiler plus accumulator system. In this system, once the water is heated it is stored in an insulated accumulator tank in order to be used later. This type of system is more efficient than individuals systems. Some advantages are:
- Continuous starts and ends of the boiler are avoided, so the boiler works in a constant and efficient way.
- The power required to supply hot water to a group of users is lower than the sum of the power of each individual boiler.
- If hot water is produced centrally, it is possible to get more economical fuel tariffs.

2. Literature study
28
Moreover, thermal solar energy is usually used to produce hot water. By installing 2m2 of solar panels is possible to supply up to 60% of hot water needed by a home annually. Apart from this, a conventional system is necessary to support hot water production. In Spain, the new CTE promotes hot water production from solar energy. Currently, solar panels are considered a complement to traditional technologies because solar energy is an intermittent source.
SOLAR ENERGY Solar energy can be used to provide hot water and heating in places where solar radiation is significant. In Spain, solar systems are usually installed in new homes. Furthermore, the government has recently introduced a law that orders all new buildings to have solar panels and central heating. A solar power system can supply all the types of energy needed by a dwelling, although it must be combined with an electric or gas heating system because solar energy is an intermittent source. The main disadvantage of this technology is the high installation cost, which changes depending on the region and the amount of required energy. [Heat-air, 2009]
COOLING SYSTEMS In some regions, temperatures can reach over 40°C during summer period and it is necessary to install air-conditioning systems. Standard air conditioning units are the most used and they are installed in each dwelling. The average power installed in dwellings varies from 5 to 7 kW which is sufficient to refrigerate a normal size room. The main component of a cooling system is a compressor. Moreover, heat pumps are starting to be installed, and they have higher efficiency and allow a reversible operation, producing both cooling and heating. It is advisable for the difference between indoor and outdoor temperature to be more or less 10ºC in order to get higher efficiency. Then, it is possible to divide between small individual systems, illustrated in Figure 26, applied in dwellings, locals and offices, and central systems, illustrated in Figure 27, used to produce cooling in buildings, residential areas, hospitals, offices, hotels, sports’ centres, cultural areas or industrial buildings. Individual systems can be direct expansion systems, compact systems, split or multi-split systems or heat pumps. On the contrary, central systems can be constituted by air-air systems, air-water systems or water-water systems, fan-coil, VAV systems, absorption chillers, etc. [Teyser, 2008]
Figure 26: Individual Air conditioning systems. Source: Teyser, 2008
Figure27: Central cooling systems. Source: Teyser, 2008

2. Literature study
29
2.7. Electricity market in Spain: Special Regime Renewable energy has grown significantly in Spain over the last years. So, a law to regulate the economic regime applicable to the generation of electricity from renewable energy sources was necessary; this law is called special regime. The Spanish special regime has been changing during the last fifteen years. The current special regime was established by Royal Decree 661/2007 (RD 661/2007). Generally, it represents a significant enhancement that supports the regulation of legal and economic questions related to the production of electricity from renewable sources. It established the basic legal framework for generation, transmission, distribution and sale of electricity. In addition, it encourages achieving the national targets for 2010 set out in EU Directive 2001/77/CE on the promotion of renewable electricity. The law establishes the right of the producer to sell all, or part, of the net electricity production through “direct lines”. According to RD 661/2007 producer can choose between selling the energy to the distributor who pays back for a specified flat tariff “Regulated tariff” for all the scheduling periods and selling it directly on the market. In the last case, the producer receives the negotiated price plus a premium. The special regime regulates electricity produced from different types of renewable sources as well as cogeneration and the reduction, treatment and incineration of waste. It is applied to systems with installed capacity of equal or less than 50 MW. The RD 661/2007 establishes the tariffs, premiums and supplements to be paid to energy producers subject to the special regime. The tariff is a fixed amount for all scheduling periods; it is set up according to the category, group or sub-group of the generator, the fuel used, the installed capacity and the installation age. The premium is only applied when the producer decides to sell the electricity on the market. In this case, the premium is added to the market price. The amount of the premium depends on the same factors as the tariff. Moreover, two types of supplements can be added: an efficiency supplement and a supplement for reactive power. The efficiency supplement is paid to those systems which meet electric efficiency standards; it means to exceed the required minimum efficiency standard REEmin that it is defined for each type of fuel. The supplement for reactive power is paid to ensure that the installations maintain appropriate values on power factor. [BOE, 2007]
• Selling the electricity to a distributor:
• Selling the electricity on the market:
The efficiency supplement is calculated according the formula:
Efficiency supplement = 1.1*(1/REEmin-1/REEi)*Cmp
where Cmp is the unitary cost of raw material of natural gas; Cmp had a value of 2.283425c€/KWh in 2008 and REEi is calculated as REEi = E/[Q-(V/RefH)]
E is the electricity produced, V is the heat produced that meets a demand, Q is the fuel consumption (LHV) and RefH is a reference value of the efficiency when heat is produced separately RefH=0.9. The required minimum efficiency standard REEmin is tabulated for each type of fuel in Table 6.
Electricity price = regulated tariff + efficiency supplement + reactive supplement
Electricity price = market price + premium + efficiency supplement + reactive supplement

2. Literature study
30
Table 6: Minimum REE according to the type of fuel. Source: BOE, 2007
Type of fuel REEmin (%)
Liquid fuels used in facilities with boilers Liquid fuels in engines Solid fuels Natural gas and LP Gas used in gas engines
Natural gas and LP Gas used in gas turbines
Other technologies and/or fuels Biomass (groups b.6 and b.8) Biomass and/or biogas (group b.7)
49 56 49 55
59
59 30 50
In the system that is going to be optimized, the REE is going to be calculated to check if the system obeys the RD 661/2007. The electricity price for sale introduced in MODEST model is considered to be the regulated tariff. Then, in an economic analysis the Efficiency Complement is included to observe the differences.

3. Method
31
3. Method It is important to define a working method in order to ensure a good result. In this section, the
steps of the working process are explained sequentially.
3.1. Gathering of facts An analysis of the system is necessary before studying anything related to the topic in order to get both broad and detailed information. It is necessary to do research to find out how these systems work and what type of technology and fuels are used, which may depend on the country where it is located. The information has been found in science articles, printed books and internet websites. However, the principal source of information has been internet because it is easily available and data are usually updated. The design of a trigeneration system is a complex problem. It is difficult to make an economic optimisation of it because a lot of factors are involved in it. The design process is based on the analysis of different reasonable techno economic alternatives where it is necessary to make decisions. The demands of residential and service sectors are characterized by temporal variations, making the design process even more difficult. The energy demand of buildings has the following characteristics:
- Consumption of several types of energy (electricity, heat, cold,…) to meet the different services (heating, cooling, hot water, lighting, electrical appliances, computes,…).
- The demand of some services (heating and cooling) is concentrated in some months of the year.
- The temporal variation of the demand is significant due to environmental factors and occupancy.
The design process can be structured in the subsequent way. Firstly, a study of the adequate type of technologies may be carried out. Next, the required power of the equipments must be determined. Once the system configuration is decided, it necessary to establish the operating procedure for each installation for every period of the year.
3.2. Gathering of data The analysis of a system involves a number of factors and requires a great amount of input data which make it possible to evaluate and make decisions. First of all, it is necessary to have useful information about the demands which the system will have placed upon it. The demands can be obtained from different sources; however it is a hard task to find them because it is not usual to register the energy consumption of buildings. Therefore, different sources of information have been used in order to characterize the various demands of the building considered. In the section Input data the information as to
where each demand has been obtained, will be mentioned. Next, information about the technology available must be collected. The input data necessary for each system are the investment cost, the operating and maintenance cost, the maximum power output available, the total efficiency or COP and the power heat ratio, given by α-value, when both types of energy are produced.

3. Method
32
When the data about the technical aspects have been gathered, it is necessary to research about electricity and fuel prices applied in that country. Information about how they are established or taxes applied is also significant. In Spain, prices related to electricity and natural gas are established and updated each three months in the B.O.E. All the input data needed to solve the problem are described in detail in the section 4.4. Input
data.
3.3. MODEST software The study has been performed by using MODEST, which is a model based on linear programming for optimizing energy systems. MODEST stands for Model for Optimisation of Dynamic Energy Systems with Time dependent components and boundary conditions. It was developed at Linkoping Institute of Technology (Sweden). The software can be applied to any energy system that can be described by linear relations. It has been used to analyze and optimize electricity and district heating systems in a lot of Swedish municipalities. A model of the energy system is built as a network of components represented by nodes and energy flows. The network stars from the primary energy supply and ends in the final energy supplied to the users. The model describes the whole systems, including CHP plants, conversion systems, fuels supply and energy demand and sales. MODEST software makes an optimization of the energy system by using linear programming to minimize the total system cost. The optimization is performed by a linear programming method called Simplex algorithm. Standard optimisation software can be used to solve the linear programming problem; in this case Cplex has been used [Henning, D., 2006]. The time division is flexible and can be adapted to real variations. It can be based on different factors: electricity prices, hourly, seasonal or monthly fluctuations of demands and capacities. The model allows you to define the time division which reflects better the real system and its operation. MODEST offers arbitrary division possibilities concerning space (city or province), sector (heating or industrial processes), time (day, season, year) and quality (heat, electricity) [Henning, D., 1997] It is necessary to introduce a number of characteristics of each component. The program tries to satisfy the energy demand by optimizing the selected equipments and their way of operation. MODEST makes it possible to compare different alternatives deciding which investments to make and their dimensioning, it advise you about the best combination of tools and energy flows to meet the energy demand in each period of time. The size of a possible new plant is not predetermined but is decided at the optimisation. The aim of MODEST is to minimize the investment costs of new components and the total operation costs during the analyzed period; it finds the operation profile of existing and potential installations that meets the energy demand at the lowest possible cost. The system cost consists of the present values of annual and investment costs during the analyzed period [Henning, D., 2006]. The input data required by MODEST model consists of time division, analysed period, energy demand and properties of fuels and energy supply components, such as fuels costs including O&M (€/MWh), investment cost (€/MW), equipment lifetime, output limit or efficiency. The shown results are total system cost in the number of years chosen by the user, optimal investments and their operation, maximum installed power of the new equipments, energy flows for each time step and emissions of different contaminants. These information is shown in Figure 28. The interface helps import the results of the optimization to Microsoft Excel TM and the plant operation can be shown in duration graphs [Henning, D., 2006].

3. Method
33
Figure 28: Input and output data for a MODEST run. Source: Henning, D., 2006
3.4. Scenario modelled When starting work with MODEST software, it difficult to know what the software enables one to solve. After doing various simulations, one should check that the program can optimise the system in order to meet all the demands: heating, cooling and electricity. Firstly, a simple model with a few timesteps (monthly demands) is simulated without imposing limitations as to the maximum output and it works correctly. Then, output limitations are introduced and it is necessary to install several machines of each type to meet the demands. Next, more timesteps are defined in order to get an accurate solution. Finally, 288 timesteps are defined, each month has 12 timesteps and each one represents two hours of a typical day. Within each time step the properties of the system are assumed to be constant. The scenario modelled consists of all types of technology available for these systems setting limitations on the maximum power output. Fuels used have been decided according to the current use of fuels in Spain to obtain the design of a feasible system. A detailed explanation of the scenario modelled can be found in the section 4.3. System model.
3.5. Sensitivity analysis Sensitivity analysis enables one to evaluate the behaviour of the optimized system when some
input data change. It allows you to check if the system is consistent. The changes considered
are related to electricity and natural gas prices.

3. Method
34
3.6. Limitations It has been necessary to make some assumptions along the analysis in order to solve the
problem. The found limitations can decrease the precision of the final solution.
INPUT DATA
• The energy demand of the several types of buildings refers to different years. Thus, it has
been assumed that all data used correspond to the same period, considering that the
energy demand has minimal variations from year to year.
• The energy demand of the school has been estimated according to several assumptions.
• The electricity demand of the residential buildings has been obtained by measuring
carefully points in two graphs, reducing the precision of the data.
• Costs and characteristics of the considered technologies come from different sources. In
some cases, it has been possible to check the information by using several sources, but not
in all the cases.
• A number of the costs refer to past years and they have been updated by making
assumptions.
• The investment cost, operating costs and techno-economical life of the CHP plant has been
estimated based on the fuel used and the capacity of the plant.
• The electricity required by the absorption machines has not been considered in the model
since it is very little compared to the heat needed in the generator.
• Electricity and fuels prices have been considered constant during the whole year. A mean
value that includes price variations has been assumed.
• Operation and maintenance cost (€/MWh) of cooling machines is unknown. Thus, it has not
been introduced in MODEST model. An estimation of the annul costs related to O&M has
been considered in the economic analysis in order to take theses costs into account.
• The number of time steps has been limited to 144. However, the data of the energy
demand of the residential area are represented by a total of 288 values (24 hourly demand
values of every month, corresponding to a day type per month). Finally, the demand data
were expressed in 144 time steps where each one indicates the demand of two hours per
month.
• Some parameters such as efficiency can decrease when the machine does not work with
total load. This effect has not been taken into consideration in the model.

4. System description
35
4. System description
In this part, the system and its environment is described. Initially, the location is explained and
the composition of the housing area. Later, the system model considered is carefully analysed
and all the data input are shown.
4.1. Location of the urbanization The urbanization whose demand is met by the system will be placed in Zaragoza (Spain). Zaragoza is the capital of the autonomous region of Aragon. The city had a population of 666.129 inhabitants in 2008 but it is expected to increase every year; so it is the fifth biggest city of Spain and it develops an important economic activity. Zaragoza is placed in a privileged geographical situation because it is approximately 300 km from Madrid, Barcelona, Valencia, Bilbao and Toulouse (France), becoming an important junction of communications.
Figure 29: Zaragoza location in Spain. Source: Google maps
Zaragoza is placed half way along the Ebro river valley being 233 meters above sea level. It has a Mediterranean-continental climate. Winters are normally cool with some frosts and fogs that produce thermal inversion in December and January. Summers are generally warm but the temperature frequently exceeds 30°C and even reaches 40°C on some days. Rains are concentrated during the spring. It rarely snows in Zaragoza, on average it only happens one day per year because it is located in a low altitude valley. The mean velocity of the air is 19 km/h; the typical wind in this region is called “Cierzo” and it is frequent during the winter. Figure 30: Monthly temperature and rainfall in Zaragoza. Source: http://es.wikipedia.org/wiki/Zaragoza

4. System description
36
4.2. Description of the urbanization The urbanization considered is constituted by different types of buildings. It is necessary to note that the housing development assumed is not a real project. Then, the urbanization is defined from other real buildings placed in Zaragoza which have been carefully studied according to the demand. The urbanization consists of 5000 residences distributed in different buildings, a hospital of 500 beds, a hotel and a school.
• Residential buildings
The heating and cooling demand has been obtained from a project developed by the University of Zaragoza where the demand of real residences placed in Zaragoza is studied [Monzón, R., 2004]. The electricity demand has been estimated from some figures of a research of the electricity demand in Spain [INDEL, 1998]; Figure 31 shows the mentioned graphs. The hot water demand (Agua Caliente) is subtracted from the total electricity consumption to get the hourly electricity demand of each home.
Figure 31: Electricity demands during the winter and summer periods respectively .Source: INDEL, 1998
• Hospital
The hospital considered to be included in the urbanization is the Miguel Servet Hospital placed in Zaragoza and it has a capacity of 500 beds. The demands of heating, cooling and electricity have been obtained from a project developed by the University of Zaragoza [Sánchez, S., 2003]. The hospital requires different types of final energy in order to cover the demand for the diverse activities that develop in it. It needs energy for medical activities as operating rooms, sterilization or elevators, for other service activities as kitchen or laundry and to meet the energy consumption related to the building and the climate (heating and cooling).
• Hotel
The supposed hotel is a real hotel located in Gerona, a region in the northeast of Spain whose climate is assumed to be similar to Zaragoza. All the demands have been obtained from real measurements and they can be found in the report [Pulido, T., 2005]. The hotel has a total surface of 16.382 m2 in eight floors and it consists of 386 bedrooms.
• School
The school considered is situated in a building of three floors and a total surface of 1200 m2. The school consists of 20 classrooms with approximately a total of 600 pupils and some rooms for the teachers. The heating and cooling demands have been estimated by using a simple program which allows you to calculate the demand every month. The hourly demands have been approximated making some assumptions by analysing the demand of the residential buildings. The electricity demand has been calculated according to the consumption of lighting and electrical appliances that are assumed to be in a normal school. The detailed calculations can be found in Appendix B.

4. System description
37
4.3. System model The model of the energy supplier system has been defined according to real equipment that has currently been installed in Spain. It will be possible to consider other types of facilities and fuels that are totally implanted in other European countries but that system will not have feasible application in Spain because of the difference in mentality related to environmental issues. Currently, The Spanish government is making an effort to promote renewable resources but economical incentives are not enough in some cases. Therefore, companies normally implant technologies using renewable resources only when the system is profitable. A great effort will be necessary to ensure that people are more worried about environmental issues than about economical aspects. The system model to be optimised is shown in Figure 32. It is going to be explained in detail.
Figure 32: System model simulated by MODEST.
The system must be designed to meet three types of demands: heating, cooling and electricity. The heat necessary to meet the heating demand of the housing area is supplied by a district heating network (DH). This network collects the heat produced in the plants and distributes it to the users. The heat can be produced in different types of facilities. The possibility of installing a gas turbine CHP and/or a gas engine CHP fuelled by natural gas is going to be analysed because it is the most common fuel used in these technologies in Spain. The CHP produces both heat and electricity. Further, the option of including several classes of boilers to

4. System description
38
produce extra heat if it is needed is considered. Three types of boilers are contemplated: a natural gas boiler, an oil boiler fuelled by heating oil and a biomass boiler fuelled by wood chip which is the cheapest biomass fuel. The final alternative is to use electricity as fuel to generate heat by means of a heat pump or an electrical heat boiler. The cooling needs will be provided by the district cooling network (DC) that collects the chilled water generated by electrical compression machines and/or absorption water chillers. The absorption machines are indirect-fired chillers fuelled by district heating. The compression machines need electricity to produce the cooling effect. The model enables the possibility of meeting the electricity demand by supplying the electricity generated in the CHP plant or buying it from the electricity market. The electricity produced internally in CHP plant may have different final purposes: it can be supplied to the urbanization, it may be provided to the electrical machines (heat pump, electrical heat boiler and compression machines) or it can be sold in the market when it is not necessary. So, electrical systems can be fuelled internally by the electricity produced but it also possible to buy electricity from the market. Finally, it is considered the option of producing waste heat that will be released to the environment after cooling it. It is done to see how the system works in this case. In Spain, it is usual for companies to design the system producing more heat than necessary when it is profitable. That is because they obtain extra income selling electricity to the market. There is a law that regulates this type of operation to avoid abuses.
4.4. Input data In this section all input data needed to optimize the system by using MODEST are included.
Extensive data about the demand and other costs or equipment characteristics can be found in
the Appendices.
4.4.1. Demand characteristics
• Heating demand
The total heating demand in MW of the urbanization for each hour of the month is found in the Appendix A. The total heating demand is 39.1 GWh per year and Figure 33 shows the demand in MWh for each month.
HEATING DEMAND
0
1000
2000
3000
4000
5000
6000
7000
8000
9000
10000
1 2 3 4 5 6 7 8 9 10 11 12
Month
MW
h
School
Hotel
Hospital
Residential buildings
Figure 33: Total heating demand in MWh of the urbanization.

4. System description
39
0
0,1
0,2
0,3
0,4
0,5
0,6
0,7
1 2 3 4 5 6 7 8 9 10 11 12 13 14 15 16 17 18 19 20 21 22 23 24
Hour
MW
0
0,01
0,02
0,03
0,04
0,05
0,06
1 3 5 7 9 11 13 15 17 19 21 23
Hour
MW
The hourly heating demand for each type of building changes according to its function. Figure 34 shows the heating demand for a day during the winter (December).
Residential buildings Hotel
0
2
4
6
8
10
12
14
16
18
20
1 2 3 4 5 6 7 8 9 10 11 12 13 14 15 16 17 18 19 20 21 22 23 24
Hour
MW
Hospital School
0
0,5
1
1,5
2
2,5
3
1 2 3 4 5 6 7 8 9 10 11 12 13 14 15 16 17 18 19 20 21 22 23 24
Hour
MW
Figure 34: Hourly heating demand of the buildings.
The heating demand changes along the day. In residential building heating starts at 7 a.m. and stops approximately at 22 a.m. In the school, the highest demand is registered during class hours, from 9 a.m. to 17 p.m. Two heating peaks are required in the hotel in the morning and in the afternoon. The hotel has a more constant heating demand along the day due to the type of activities developed in it.
• Cooling demand
The total cooling demand in MW of the urbanization for each hour of the month is found in the Appendix A. The total cooling demand is 11.6 GWh per year and Figure 35 shows the demand in MWh for each month.

4. System description
40
0
0,05
0,1
0,15
0,2
0,25
0,3
0,35
0,4
0,45
1 3 5 7 9 11 13 15 17 19 21 23
Hour
MW
0
0,01
0,02
0,03
0,04
0,05
0,06
1 3 5 7 9 11 13 15 17 19 21 23
MW
COOLING DEMAND
0
500
1000
1500
2000
2500
3000
3500
4000
4500
5000
1 2 3 4 5 6 7 8 9 10 11 12
Month
MW
h
School
Hotel
Hospital
Residential buildings
Figure 35: Total cooling demand in MWh of the urbanization.
The hourly cooling demand for each type of building changes according to its function. Figure 36 shows the cooling demand for a day during the summer.
Residential buildings Hotel
0
5
10
15
20
25
1 2 3 4 5 6 7 8 9 10 11 12 13 14 15 16 17 18 19 20 21 22 23 24
Hour
MW
Hospital School
0
0,2
0,4
0,6
0,8
1
1,2
1,4
1,6
1,8
2
1 2 3 4 5 6 7 8 9 10 11 12 13 14 15 16 17 18 19 20 21 22 23 24
Hour
MW
Figure 36: Hourly cooling demand of the buildings.
The cooling demand changes along the day. In residential building cooling is required especially during the sunniest hours in the afternoon as well as in the school, from 15 to 17. In the hospital and in the hotel cooling is required during the whole day with highest needs during the daylight hours.

4. System description
41
0,000
0,050
0,100
0,150
0,200
0,250
0,300
0,350
0,400
1 3 5 7 9 11 13 15 17 19 21 23
Hour
MW
Winter Summer
0
0,002
0,004
0,006
0,008
0,01
0,012
0,014
0,016
1 3 5 7 9 11 13 15 17 19 21 23
Hour
MW
Winter&Summer
• Electricity demand
The total electricity demand in MW of the urbanization for each hour of the month is found in the Appendix A. The total electricity demand is 15.7 GWh per year and Figure 37 shows the demand in MWh for each month.
ELECTRICITY DEMAND
0
200
400
600
800
1000
1200
1400
1600
1 2 3 4 5 6 7 8 9 10 11 12
Month
MW
h
School
Hotel
Hospital
Residential buildings
Figure 37: Total electricity demand in MWh of the urbanization.
From the figure, it can be seen that the electricity consumption is more or les constant during the year. The hourly electricity demand for each type of building changes according to its function. Figure 38 shows the electricity demand for a day for every day.
Residential buildings Hotel
0,00
0,50
1,00
1,50
2,00
2,50
1 3 5 7 9 11 13 15 17 19 21 23
Hour
MW
Winter Summer
Hospital School
0
0,1
0,2
0,3
0,4
0,5
0,6
1 2 3 4 5 6 7 8 9 10 11 12 13 14 15 16 17 18 19 20 21 22 23 24
Hour
MW
Winter&Summer
Figure 38: Hourly electricity demand of the buildings.

4. System description
42
In residential buildings, electricity demand is higher during the winter due to the lighting and the electrical appliances needed. On the contrary, electricity demand is duplicated during the summer in the hotel; it is because of the high boarder occupancy in this period. In the hospital, the electricity demand is quite high during the whole year attending to continuing activity. However, in the school the electricity demand is assumed to be constant during the class hours and it reduces when pupils leave the school.
4.4.2. Equipment prices and characteristics
The input data necessary for each system are the investment cost, the operating and maintenance costs, the maximum output, the total efficiency and the power heat ratio when both types of energy are produced. All the costs have been updated to 2008, considering an interest rate of 2.5% each year. In Appendix C, sources and more details about the input data can be found. The prices and the characteristics of the systems that are introduced in MODEST model are gathered in Table 7.
Table 7: Characteristics of the technology.
Technology Max. Capacity
(MW) Investment
Cost (€) O&M Costs (€/MWh)
Efficiency or COP
Power/Heat Ratio
CO2 (kg/MWh)
Gas Turbine CHP
25 800 000 5 0.76 0.73 204
Gas Engine CHP 7 800 000 7 0.81 1.02 204
Heating oil boiler
4 60 000 1.5 0.92 - 287
Natural gas boiler
4 60 000 1.5 0.92 - 204
Biomass boiler 6 220 000 10 0.85 - 0
Heat pump 15 300 000 4 3 - 0
Electrical heat boiler
12 40 000 1.5 0.98 - 0
Absorption machine
6 320 000 * 0.7 - 0
Compression machine
9 200 000 ** 5.3 - 0
* O&M is considered in the economic analysis. It represents 4% of the total annual cost. [Lozano M.A.] ** O&M is considered in the economic analysis. It represents 8% of the total annual cost. [Lozano M.A.]
4.4.3. Fuel prices
• Electricity
Electricity prices in the production market can be looked up in the website of REE (Red Eléctrica Española), [REE, 2009]. OMEL (Operador del Mercado de Energía) publishes hourly data of each day, month and year in the website, [OMEL, 2009]. Electricity sale prices for cogeneration plants are updated every three month and they are published in BOE, [BOE, 2008].
• Natural Gas
Gas market is liberalized in Spain. The unitary cost of raw material of natural gas is available in BOE every three months, [BOE, 2008].

4. System description
43
The prices of the different fuels and electricity have been obtained from BOE or other reliable sources. The references are shown as follows. All of them include the VAT or other taxes. They are gathered in Table 8:
Table 8: Fuels prices
Electricity (purchase)
Electricity (sale)
Heating oil (Gasoleo C)
Natural gas Biomass
(Wood chips)
Price (€/MWh) 96 -79 70 25 12
Souce [BOE,2008]
[Coyun, 2008]
[BOE,2008] Regulated tariff
10<P<25MW
[Energía, 2008] [Coyun, 2008]
[Energía, 2008] [Coyun, 2008]
[Gil, J., 2009] [Biomass, 2007]
In MODEST, fuel prices have to include also operating and maintenance costs of the systems. Table 9 shows the fuel prices that are introduced in MODEST model.
Table 9: Fuels prices including O&M costs.
Natural gas GT
CHP Natural gas GE
CHP Natural gas
boiler Heating oil
boiler Biomass
Price (€/MWh) 30 32 26.5 71.5 22

5. Results of the optimization
44
5. Results of the optimization The proposed MODEST model is optimised in order to find the most cost-effective system. In
this part many characteristics of the system are detailed: the chosen components and the
installed power of each one, as well as an analysis of the consumption and production of
energy. Finally, some economic and energy parameters are calculated.
5.1. Scenario modelled
5.1.1. Components of the system
The model simulated and optimised with MODEST is a complex model including different types of technologies that are explained in the section 4.3. System model. As a result, the components selected by MODEST are detailed next. The heat and the electricity are produced by one turbine CHP with a maximum power capacity of 14.2 MW and one engine CHP with an installed power of 1.7 MW. Both CHP are fuelled by natural gas. No more systems are needed to meet the heating demand. MODEST software informs that separated heat production is not as cost-effective as CHP systems when comparing investment and fuel costs. Furthermore, some cooling systems are required to meet the cooling demand of the housing area. The selected machines are three compression machines (CM) and one absorption machine (AM) of different maximum output. It is necessary to install some chillers of each type because the maximum cooling capacities of commercial chillers are limited. This limitation is 6MW for absorption machines and 9 MW for compression machines. Moreover, a cooling power of approximately 30 MW will be installed in cooling towers.
CM 1 CM 2 CM 3 AM
Max. Power (MW) 4.8 9 9 2
The optimization of the system showing the selected equipments can be seen Figure 39.
Figure 39: Optimization of the model obtained by MODEST.

5. Results of the optimization
45
5.1.2. Energy consumption
This system is only fuelled by natural gas, the rest of the fuels are not competitive. All the electricity needed to meet the demand of the buildings and the compression machines is internally produced in the CHP plant. MODEST software considers that producing electricity is more profitable than buying it in the market.
GT CHP GE CHP
GWh NG / year 78.1 35.2
In the next graph, it can be seen that the Gas engine CHP works with the maximum power during the whole year. However, the Gas turbine CHP has an irregular operation, changing its production according to the heat needs. This way of operation is not advisable from a technical point of view because efficiency of Gas turbine reduces considerably when it works with a partial load. In the present system, the GT CHP is used as a heat generator and the GE CHP is more cost-effective in generating electricity. It is due to the fact that GE CHP has higher power-heat ratio (α-value). The distribution of the natural gas consumption during the year is shown in Figure 40.
Natural Gas consumption
0
2
4
6
8
10
12
14
16
18
20
Jan Feb Mars April May June July Aug Sep Oct Nov Dec
GW
h/m
on
th
GT CHP
GE CHP
Figure 40: Natural Gas consumption.
Apart from this, the cooling machines require other types of fuel. All the electricity and the heat needed are produced internally in the CHP plant. So, it is not necessary to buy extra electricity in the market. The electricity required each month by the compression machines can be seen in Figure 41.
Electricity consumption CM
0
50
100
150
200
250
300
350
400
450
500
Jan
FebM
ars
Apr
il
May
June
July
Aug
Sep O
ctNov
Dec
MW
h/m
on
th
CM 1
CM 2
CM 3
Figure 41: Electricity consumption of the compression machines.

5. Results of the optimization
46
CM 1 CM 2 CM 3
GWh/year 0.66 1.14 0.34
The absorption machine needs to be fuelled by heat and it consumes 4.35 GWh per year.
Heat consumption AM
0
200
400
600
800
1000
1200
1400
1600
Jan
FebM
ars
Apr
il
May
June
July
Aug
Sep O
ctNov
Dec
MW
h/m
on
th
Serie2
Figure 42: Heat consumption of the absorption machine.
5.1.3. Production of heating, cooling and electricity
• Heat production and distribution Heat produced by the Gas turbine CHP and the Engine CHP is delivered to meet the heating demand during the cold season and to attend cooling machines needs in summer. The production and distribution of district heating monthly is shown in Figure 43 and 44 respectively.
Heat production
0
1000
2000
3000
4000
5000
6000
7000
8000
9000
10000
Jan
Feb Mar
AprM
ayJu
nJu
lAug
Sep Oct
Nov
Dec
MW
h/m
on
th
GT to DH
GE to DH
Figure 43: Heat production by the CHP plant.

5. Results of the optimization
47
Heat distribution
0
1000
2000
3000
4000
5000
6000
7000
8000
9000
10000
Jan
Mar
May Ju
lSep
Nov
MW
h/m
on
th Heat waste
Absorption machine
Heating demand
Figure 44: Heat distribution of the DH.
The major part of the DH production is delivered to the buildings to meet heating and hot-water demands. A small part goes to the absorption chillers and a little amount is rejected. MODEST decides that it is more profitable for the Gas engine CHP to be operated at its maximum capacity throughout the year producing electricity that will be sold when it is not needed. The drawback to this way of operating is that an extra heat will be produced and released to the environment after being cooled properly.
• Electricity production and distribution
Next, the electricity production in the CHP plant every month and the subsequent distribution to meet the various demands are illustrated in Figure 45 and 46. The Gas engine CHP works with the maximum output during the whole year to produce extra electricity that will be sold in the market.
Electricity production
0
1000
2000
3000
4000
5000
6000
7000
8000
Jan Feb Mar Apr May Jun Jul Aug Sep Oct Nov Dec
MW
h/m
on
th
GT
GE
Figure 45: Electricity production of the CHP plant.

5. Results of the optimization
48
Electricity distribution
0
1000
2000
3000
4000
5000
6000
7000
8000
Jan
Feb
Mar
Apr
May
Jun
Jul
Aug
Sep
Oct
Nov
Dec
MW
h/m
on
th
Comp. Machines
Elec.market
Elec. demand
Figure 46: Distribution of the electricity produced.
The electricity demand of the housing area is more or less constant during the year and it can be almost totally attended by Gas engine CHP. The electricity needed by compression machines is small because they have a high efficiency (COP). It means that for each MW of electricity they produce 5.3 MW of cooling power. As a result, a large amount of electricity produced in the CHP will be sold in the market. It is superior during the cold season when it is necessary to meet the high heating demand of the buildings.
• Cooling production
The cooling capacity is divided into several cooling machines because the maximum cooling capacity of commercial chillers is limited. The absorption machine has an installed power of 2MW and it is working all year attending the smaller demand during winter. CM3 is only used to cover the cooling demand during summer peak hours. The rest of the compression machines work during some months adjusting the cooling produced according to the demand. It can be shown in Figure 47.
Cooling demand
0
1000
2000
3000
4000
5000
6000
MW
h/m
on
th CM 3
CM 2
CM 1
AM
CM 3 0 0 0 0 0 0 1080 727 0 0 0 0
CM 2 0 0 0 0 0 599 20772324 981 20,2 11,5 11,5
CM 1 12,4 12,6 11,2 9,6 2,22 10791513 579 290 0 0 0
AM 0,6 1,26 3,3 2,88 22,6 537 959 920 581 14,5 3,48 1,26
Jan Feb Mar Apr May Jun Jul Aug Sep Oct Nov Dec
Figure 47: Cooling demand attended by several cooling machines.

5. Results of the optimization
49
5.1.4. Duration graphs
The duration graphs obtained from the MODEST results are shown as follows. In Figure 48, the duration graph of the heating demand is shown. Operation hours and heating power supplied by Gas engine CHP and Gas turbine CHP are illustrated in the duration graph. The area represented over the heating demand curve is the heat that fuels the absorption machine during the warm season; it can be seen in the right part of the duration graph.
Figure 48: Duration graph of the heating demand.
The duration graph of the cooling demand is shown in Figure 49. Operation hours and cooling power supplied by the diverse cooling machines are shown in the duration graph.
Figure 49: Duration graph of the cooling demand.
The duration graph of the electricity demand is shown in Figure 50. Operation hours and electricity generated by CHP technologies are shown in the duration graph. The area represented over the heating demand curve of the urbanization, denoted by a blue line, is the electricity consumed by the compression machines and the electricity which is sold in the market.

5. Results of the optimization
50
Figure 50: Duration graph of the electricity demand.
5.1.5. CO2 emissions
The total amount of CO2 emissions generated by the system is calculated by the MODEST software. It reaches a value of 23 100 ton CO2 per year.
5.1.6. System cost
In the project, the economical life of all the components is assumed to be 15 years, and the period studied is one year. The economic analysis comprises a period of ten years, while a new plant has an expected life of 15 or 20 years. To consider the capital cost of the plant for a period of ten years, the remaining value is recalculated to present value at a discount rate of 6%. This present value is then deducted from the investment cost. The fuels costs including O&M are given in fixed values of money and are supposed to be the same for each year during the period of analysis. These costs are recalculated each year to the present value at a discount rate of 6%. The total of annual running costs and investment costs recalculated to the present value are named the total system cost which is the total cost for meeting the energy demand for a ten-year-period. The optimization is carried out for a ten-year-period and the cost for one year is calculated by dividing the total system cost by a cost factor of 7.36. The total system cost for a ten-year-period calculated by MODEST is 18.28 M€.
5.1.7. Alternative operation
It is also possible to optimise the system considering that the heat produced meets the energy demand. It means that the system produces only the heat required by heating and cooling demand, no waste heat being produced. In this case the system cost increases a little, it costs 18.37 M€ for ten years. This system is 12.355€ more expensive each year but it is more environmental friendly because it produces only the heat needed. The CO2 emissions are lower, 22 900 ton CO2 per year. The difference in the cost is owing to the fact that the first system produces more electricity that is sold in the market, making extra money from it.

5. Results of the optimization
51
The equipments selected are the same as in the previous case. There are only some variations in the installed power capacity of them. The software chooses a turbine CHP with a maximum power capacity of 14.54 MW and one engine CHP with an installed power of 1.1 MW. The selected compression machines have a maximum output of 4.64 MW, 9 MW and 9 MW respectively and the absorption machine has 2.257 MW.
5.1.8. Calculation of the REE
It is necessary to check that the system obeys the RD 661/2007 about electricity production from renewable sources. The system is constituted of a turbine and a engine fuelled by natural gas, therefore the equivalent electric efficiency REE must be higher than 0.59 which is the required minimum efficiency standard REEmin. The explanation of this concept can be found in the section of the literature 2.7. Special Regime.
RefH
V-Q
E REE =
All the parameters of the formula are calculated from the optimised system:
E 39442.2 MWh/year
Q 113298.4 MWh/year
V 44904.64 MWh/year
REE 0.662
Finally, the REE is 0.662 > 0.59. Therefore, the system is well designed and it obeys the law. Moreover, the efficiency supplement can make the system even more cost-effective. The efficiency supplement is calculated according to the formula:
EfficiencySupplement=1.1*(1/REEmin-1/REEi)*Cmp
It means an increase of 4.63 €/MWh in the price of electricity for sale which is not very significant. Thus, the final price will be 83.63 €/MWh instead of 79€/MWh.
5.1.9. Energy analysis
It is possible to calculate some parameters related to cogeneration systems. It has been explained in the section 2.2. Cogeneration and trigeneration. The parameters of cogeneration only consider the electricity and heat produced by CHP systems as well as fuel consumed by them. The fundamental parameters that determine the energy performance of the system are:
W 39442.2 MWh/year
F 113298.4 MWh/year
Q 44904.64 MWh/year
Electric efficiency RWF = W/F = 0.348 Thermal efficiency RQF = Q/F = 0.396 Global efficiency ηe = (W + Q)/F = 0.744 Power Heat Ratio RWQ = W/Q = 0.878

5. Results of the optimization
52
Moreover, other parameters which are useful to compare different cogeneration systems to conventional systems are defined below. (ηW=0.30 , ηQ=0.90) Primary energy saving ∆F = W/ηW + Q/ηQ – F = 68069.644 MWh/year Fuel energy saving ratio FESR = 1 – F/ [W/ηW + Q/ηQ] = 0.375 Equivalent electric performance REE = ηee = W/(F - FQ) = W/(F – Q/ηQ) = 0.662
5.1.10. Economic analysis
MODEST software is used to optimise the model and it shows the total system cost for a period of ten years. However, a simple economic analysis is going to be done by using the obtained results to realize the different costs. This system cost is going to be used to compare the different systems because it is necessary to add O&M costs of cooling machines and to consider the Efficiency Supplement.
• Investment costs
Technology Installed power
(MW) Investment cost
(€/MW) Total investment cost
(€)
Gas turbine CHP 14.2 800 000 11 360 000
Gas engine CHP 1.7 822 447 1 398 160
Comp .machine 1 4.8 200 000 960 000
Comp. machine 2 9 200 000 1 800 000
Comp. machine 3 9 200 000 1 800 000
Absor. machine 2 320 000 640 000
17 958 160
Equipment life = 15 years
• Fuel costs including O&M costs
Fuel Consumption (GWh/year)
Fuel price (€/MWh) Fuel cost (€/year)
Natural gas for Gas turbine CHP
78.1 30 2 343 000
Natural gas for Gas engine CHP
35.2 32 1 126 400
3 469 400
NOTE: O&M costs of cooling machines represent a percentage of annual system cost and they are taken into account at the end of the calculation. They have not been considered in MODEST solution. O&M costs of absorption machines represents 4% of the total annual cost and O&M cost of compression machines represents 8% of the total annual cost. [Lozano M.A.]
• Electricity sale
Production for sale (GWh/year)
Sale price (€/MWh) Total income (€)
21.63 - 79 1 708 770
When the Efficiency Supplement is considered the sale price is -83.63 €/MWh and the total income is 1 808 917 €

5. Results of the optimization
53
• Annual system cost
This amortization cost is calculated without considering the discount rate of 0.6 that is applied in the MODEST solution. This solution is only an approximation.
Ca = 17 958 160/15 + 3 469 400 - 1 708 770 = 2 957 840 €/year = 2.96 M€/year Considering the Efficiency Supplement the Ca is 2.86 M€/year
Finally, O&M costs of cooling machines are considered. They are calculated by using the following expression:
Annual system cost = Ca + 0.04·Annual system cost + 0.08· Annual system cost Then, Annual system cost = Ca / (1-0.04-0.08) = Ca/0.88 Without considering the Efficiency Supplement the annual system cost is 3.36 M€/year
Considering the Efficiency Supplement the annual system cost is 3.25 M€/year
5.1.11. Sensibility analysis
It is interesting to analyse how the prices of the biomass boiler and the biomass fuel should change to make it competitive compared to the Gas turbine CHP. In this case, both investment cost and biomass price should reduce a lot in order for it to be chosen by MODEST. If these prices are analysed, it means that the cost of the biomass boiler should be similar to the gas one and the biomass price should be lower than its O&M costs (10€/MWh); thus biomass fuel should be free or an economic help should support this type of system in order to make it competitive. The prices required to make biomass technology competitive compared to Gas turbine CHP are gathered in Table 10.
Table 10: Analysis about biomass technology.
Investment cost (€)
Biomass price (€/MWh)
200 000 4
150 000 5.5
100 000 6.5
60 000 7.5
The influence of electricity and natural gas prices on the system cost is going to be analysed by doing a sensibility analysis. It is going to be assumed that electricity needed by the compression machines is bought in the market in order to see the influence of electricity price. The results are shown in Figure 51.
Ca = Investment cost/Equipment life + (Maintenance cost + Fuel cost) - Electricity sales

5. Results of the optimization
54
Figure 51: Sensitivity analysis involving electricity price, natural gas price and system cost.
By analysing the MODEST solution, it can be seen that the choice is consistent because a high increase of fuel prices is necessary to be able to appreciate differences in the equipment selection. Even when the electricity price increases 100%, compression machines keep being competitive, that is because it is an efficient technology with a COP of 5.3. On the other hand, when the natural gas price increases more alterations are observed. If the NG price rises more than 30%, waste heat production disappears and only compression machines are installed. Furthermore, the biomass boiler starts being competitive when NG price increases more than 40%, and the system becomes more environmentally-friendly, reducing CO2 emissions by half. On the other hand, it would be interesting to analyse the possibility of including industrial waste heat as a primary energy source, which is usual in other European countries. Nevertheless, this kind of energy source is not utilised in Spain because there are not district heating networks. Thus, it would be advisable to take advantages of waste heat instead of releasing it.
5.2. Alternative scenario An additional scenario is going to be considered because in the optimum solution a Gas Turbine CHP with a high maximum power is installed. However, it works during the major part of the year with a low load which results in inefficient operation and waste capacity. The system is possible but it does not make much sense from a technical point of view. Therefore, in the new scenario, the Gas Turbine CHP is not included in order to see what the new system chosen is and how it works. After making some simulations, it has been decided that heat waste production should not be considered in this case because of the amount of heat waste delivered and the great increase in CO2 emissions. These differences are compared in the section 5.2.6. Alternative operation.
17
19
21
23
25
27
29
95 104,5 114 123,5 133 142,5
Price of electricity (€/MWh)
Syste
m C
ost
(M€) 25 €/MWh
27,5 €/MWh
30,5 €/MWh
32,5 €/MWh
35 €/MWh
37,5 €/MWh
Price of Natural gas

5. Results of the optimization
55
5.2.1. Components of the system
The new model simulated and optimised with MODEST includes different types of technologies. The components selected by MODEST are detailed next. The heat and the electricity are produced by two Gas Engine CHPs with a maximum power capacity of 4.3 MW and 7 MW respectively. Both CHP are fuelled by natural gas. Besides, other only heat production systems are needed to meet the heating demand; a Biomass boiler of 6 MW and a Natural Gas boiler of 4 MW are installed. If the maximum power installed in Gas boilers is not limited, MODEST decides to install 16 MW by using this technology. However, the heat generated by using Gas boilers has been limited because the aim of the system is that it uses sustainable technology.
GE 1 GE 2 BB GB
Max. Power (MW) 4.3 7 6 4
Furthermore, some cooling systems are required to meet the cooling demand of the housing area. The selected machines are two compression machines (CM) and two absorption machines (AM) of different maximum output.
CM 1 CM 2 AM 1 AM 2
Max. Power (MW) 9 9 1 6
The optimization of the system showing the selected equipments can be seen in Figure 52.
Figure 55: Optimization of the model obtained by MODEST.

5. Results of the optimization
56
5.2.2. Energy consumption
The system is fuelled by natural gas and wood chips. The major part of the electricity required to meet the demand of the buildings and the compression machines is internally produced in the CHP plant, however a small part of it is bought in the market. The consumption of Natural gas is the following:
GE 1 CHP GE 2 CHP GB
GWh NG / year 61.5 54.6 4.3
The distribution of the natural gas consumption during the year is shown in Figure 53, it can be seen that the Gas engine CHPs varies its operation according to the heat needs.
Natural gas consumption
0
1000
2000
3000
4000
5000
6000
7000
8000
9000
Jan Feb Mars April May June July Aug Sep Oct Nov Dec
MW
h/m
on
th
GE 1
GE 2
GB
Figure 53: Natural gas consumption.
The Biomass boiler only works for a period of four months per year; as is shown in Figure 54. It supports heat production during cold months to meet the heating demand. The total amount of biomass consumption is 6.78 GWh per year.
Biomass consumption
0
500
1000
1500
2000
2500
3000
3500
Jan Feb Mars April May June July Aug Sep Oct Nov Dec
MW
h/m
on
th
Biomass
Figure 54: Biomass consumption.

5. Results of the optimization
57
Apart from this, the cooling machines require other types of fuel. All the electricity and the heat needed are produced internally in the CHP plant. So, it is not necessary to buy extra electricity in the market.
The electricity required each month by the compression machines can be seen in Figure 55.
Electricity consumption CM
0
50
100
150
200
250
300
Jan Feb Mars April May June July Aug Sep Oct Nov Dec
MW
h/m
on
th
CM 1
CM 2
Figure 55: Electricity consumption of the compression machines.
CM 1 CM 2
GWh/year 0.48 0.59
The absorption machine needs to be fuelled by heat. The heat required each month by the absorption machines is shown in Figure 56.
Heat consumption AM
0
500
1000
1500
2000
2500
3000
3500
4000
Jan Feb Mars April May June July Aug Sep Oct Nov Dec
MW
h/m
on
th
AM 1
AM 2
Figure 56: Heat consumption of the absorption machines.
AM 1 AM 2
GWh/year 2.25 10.16
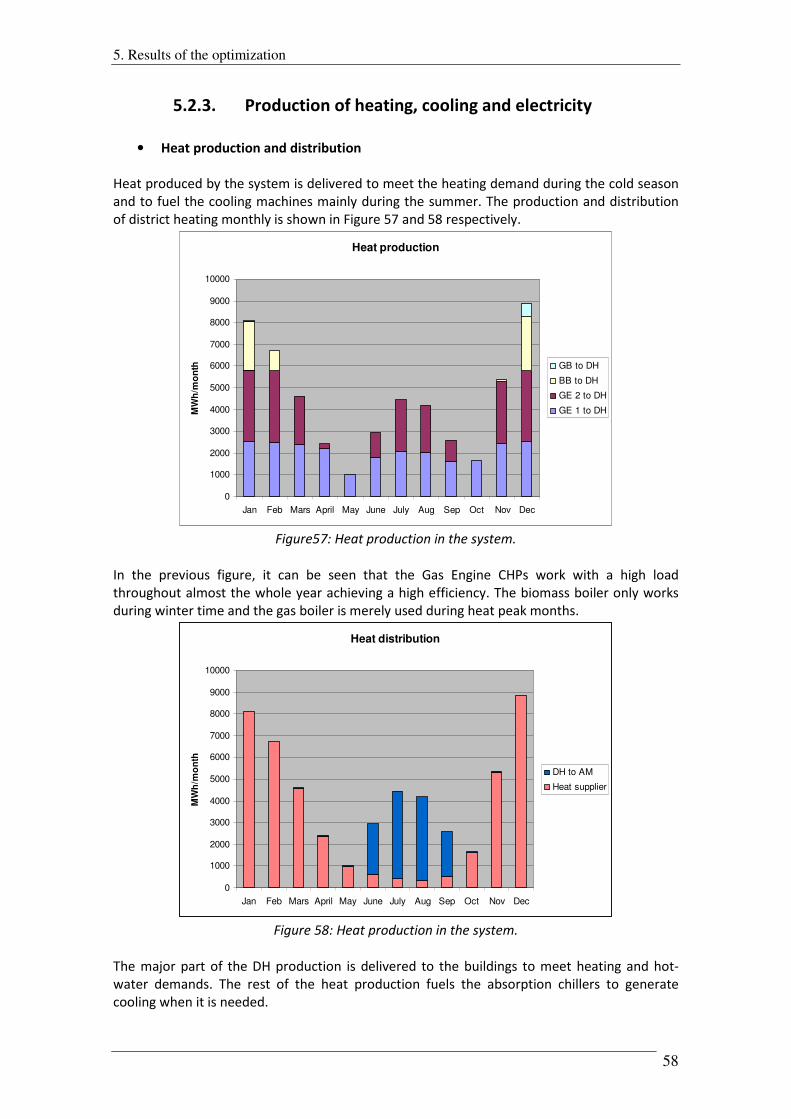
5. Results of the optimization
58
5.2.3. Production of heating, cooling and electricity
• Heat production and distribution
Heat produced by the system is delivered to meet the heating demand during the cold season and to fuel the cooling machines mainly during the summer. The production and distribution of district heating monthly is shown in Figure 57 and 58 respectively.
Heat production
0
1000
2000
3000
4000
5000
6000
7000
8000
9000
10000
Jan Feb Mars April May June July Aug Sep Oct Nov Dec
MW
h/m
on
th GB to DH
BB to DH
GE 2 to DH
GE 1 to DH
Figure57: Heat production in the system.
In the previous figure, it can be seen that the Gas Engine CHPs work with a high load throughout almost the whole year achieving a high efficiency. The biomass boiler only works during winter time and the gas boiler is merely used during heat peak months.
Heat distribution
0
1000
2000
3000
4000
5000
6000
7000
8000
9000
10000
Jan Feb Mars April May June July Aug Sep Oct Nov Dec
MW
h/m
on
th
DH to AM
Heat supplier
Figure 58: Heat production in the system.
The major part of the DH production is delivered to the buildings to meet heating and hot-water demands. The rest of the heat production fuels the absorption chillers to generate cooling when it is needed.

5. Results of the optimization
59
• Electricity production and distribution
Figure 59 shows the electricity production in the CHP plant every month. The electricity produced is regulated according to the heat needs because is not possible to release waste heat.
Electricity production
0
1000
2000
3000
4000
5000
6000
7000
Jan Feb Mars April May June July Aug Sep Oct Nov Dec
MW
h/m
on
th
GE 2
GE 1
Figure 59: Production of electricity in the CHP plant.
Electricity distribution
0
1000
2000
3000
4000
5000
6000
7000
Jan Feb Mar Apr May Jun Jul Aug Sep Oct Nov Dec
MW
h/m
on
th Elect. market
CM
Elect. demand
Elect. demand
Figure 60: Distribution of electricity.
From Figure 60 some conclusions can be obtained. The electricity demand of the housing area is more or less constant during the whole year and it can be almost totally met by the CHP plant. However, a small amount of electricity is bought in the market to meet the heating demand of the buildings; this happens during the first hours and the last hours of the day. That is because the heat demand is low during these hours and the CHP does not produce enough electricity. The electricity needed by the compression machines is produced totally in the CHP. Finally, a large amount of electricity will be sold in the market when it is not necessary, producing a profit from this sale.

5. Results of the optimization
60
• Cooling production
The cooling capacity is divided into several cooling machines because the maximum cooling capacity of commercial chillers is limited. The absorption machines work during most of the year meeting the smaller demands during winter. On the contrary, compression machines are mainly used to meet the cooling demand during summer. The results are illustrated in Figure 61.
Cooling demand
0
1000
2000
3000
4000
5000
6000
MW
h/m
on
th CM 2
CM 1
AM 2
AM 1
CM 2 0 0 0 0 0 0 139 130 419 0 3 10
CM 1 10 11 0 0 0 582 141 544 0 0 0 0
AM 2 3 3 0 0 0 116 221 239 130 28 3 0
AM 1 0 1 14 12 25 474 600 308 126 7 9 3
Jan Feb Mar Apr May Jun Jul Aug Sep Oct Nov Dec
Figure 61: Cooling demand attended by several cooling machines.
5.2.4. Duration graphs
The duration graphs obtained from the MODEST results are shown as follows. In Figure 62, the duration graph of the heating demand is shown. Operation hours and heating power supplied by Gas engine CHP, Gas turbine CHP, Biomass boiler and Gas boiler are illustrated in the duration graph. The area represented over the heating demand curve, denoted by a blue line, is the heat that fuels the absorption machines during the warm season; it can be seen in the right part of the duration graph.
Figure 62: Duration graph of the heating demand.

5. Results of the optimization
61
The duration graph of the cooling demand is shown in Figure 63. Operation hours and cooling power supplied by the diverse cooling machines are shown in the duration graph.
Figure 63: Duration graph of the cooling demand.
The duration graph of the electricity demand is shown in Figure 64. Operation hours and electricity generated by CHP technologies are shown in the duration graph. The area represented over the heating demand curve of the urbanization, denoted by a blue line, is the electricity consumed by the compression machines and the electricity which is sold in the market. Furthermore, the electricity purchase is shown in the inferior part of the graph, represented in orange colour.
Figure 64: Duration graph of the electricity demand.
5.2.5. CO2 emissions
The total amount of CO2 emissions is calculated by the software MODEST. It reaches a value of 23 800 ton CO2 per year.
5.2.6. System cost
The total system cost for ten year calculated by MODEST software is 23.97 M€. According to MODEST solution this system is a bit more expensive but its operation is more adequate referring to technical performance of the systems.

5. Results of the optimization
62
5.2.7. Alternative operation
It also possible to optimise the system considering that more heat than necessary is produced in order to have a more profitable system; so waste heat is produced and released to the environment after being cooled. In this case the system cost reduces a little, it costs 23.51M€ for ten years. This system is 70.000 € cheaper each year. However, a great amount of extra CO2 emissions are released to the environment; the total amount of CO2 is 48 700 ton per year. Thus, emissions are doubled and the system is aggressive to the environment. The total waste heat produced is 49 GWh per year which is significant compared to 3.5 GWh of waste heat produced by the first system explained in section 5.1. The equipment selected is the same as in the previous case. The difference in the system operation is that the Gas engine CHP works at maximum power during the whole year producing much more electricity that is sold in the market, thereby creating greater profit. In conclusion, this operation has not been considered advantageous due to the high emissions generated and the first operation way has been selected and analysed in detail.
5.2.8. Calculation of the REE
It is necessary to check that the system obeys the RD 661/2007 about electricity production from renewable sources. The system is constituted of engines fuelled by natural gas, therefore the equivalent electric efficiency REE must be higher than 0.55 which is the required minimum efficiency standard REEmin.
RefH
V-Q
E REE =
All the parameters of the formula are calculated from the optimised system:
E 47497.4 MWh/year
Q 116127.8 MWh/year
V 46566.1 MWh/year
REE 0.737
Finally, the REE is 0.737 > 0.55. Therefore, the system is well designed and it obeys the law. Moreover, the efficiency supplement can make the system even more cost-effective. The efficiency supplement is calculated according to the formula :
EfficiencySupplement=1.1*(1/REEmin-1/REEi)*Cmp It means an increase of 11.62 €/MWh in the price of electricity for sale. Thus, the final price will be 90.62 €/MWh instead of 79€/MWh.
5.2.9. Energy analysis
It is possible to calculate some parameters related to cogeneration systems. The parameters of cogeneration only consider the electricity and heat produced by CHP systems as well as fuel consumed by them. The fundamental parameters that determine the energy performance of the system are:

5. Results of the optimization
63
W 47497.4 MWh/year
F 116127.8 MWh/year
Q 46566.1 MWh/year
Electric efficiency RWF = W/F = 0.409
Thermal efficiency RQF = Q/F = = 0.401 Global efficiency ηe = (W + Q)/F = 0.81 Power Heat Ratio RWQ = W/Q = = 1.02 Moreover, other parameters which are useful to compare different cogeneration systems to conventional systems are defined below. (ηW=0.30 , ηQ=0.90) Primary energy saving ∆F = W/ηW + Q/ηQ – F = 93937.02 MWh/year Fuel energy saving ratio FESR = 1 – F/ [W/ηW + Q/ηQ] = 0.447 Equivalent electric performance REE = ηee = W/(F - FQ) = W/(F – Q/ηQ) = 0.737
5.2.10. Economic analysis
MODEST software is used to optimise the model and it shows the total system cost for a period of ten years. However, a simple economic analysis is going to be done by using the obtained results to realize the different costs. This system cost is going to be used to compare the different systems because it is necessary to add O&M costs of cooling machines and to consider the Efficiency Supplement.
• Investment costs
Technology Installed power
(MW) Investment cost
(€/MW) Total investment cost
(€)
Gas engine 1CHP 4.3 774 580 3 330 694
Gas engine 2 CHP 7 774 580 5 422 060
Biomass boiler 6 220 000 1 320 000
Gas boiler 4 60 000 240 000
Comp .machine 1 9 200 000 1 800 000
Comp. machine 2 9 200 000 1 800 000
Absor. Machine 1 1 320 000 320 000
Absor. Machine 2 6 320 000 1 920 000
16 152 754
Equipment life = 15 years
• Fuel costs including O&M costs
Fuel Consumption (GWh/year)
Fuel price (€/MWh) Fuel cost (€/year)
Natural gas for Gas turbine CHP
61.5 32 1 968 000
Natural gas for Gas engine CHP
54.6 32 1 747 200
Biomass 6.78 22 149 160
Natural gas for boiler 0.69 26.5 18 285
Electricity 1.3 95 123 500
4 006 145

5. Results of the optimization
64
NOTE: O&M costs of cooling machines are taken into account at the end of the calculation. They have not been considered in MODEST solution.
• Electricity sale
Production for sale (GWh/year)
Sale price (€/MWh) Total income (€)
32.05 - 79 2 531 950
When the Efficiency Supplement is considered the sale price is -90.62 €/MWh and the total income is 2 904 371€.
• Annual system cost
This amortization cost is calculated without considering the discount rate of 0.6 that is applied in MODEST solution. This solution is only an approximation. Ca = Investment cost/Equipment life + (Maintenance cost + Fuel cost) - Electricity sales
Ca = 16 152 754/15 + 4 006 145 - 2 531 950 = 2 551045 €/year = 2.551 M€/year Considering the Efficiency Supplement the Ca is 2.178 M€. In this case, the Efficiency Supplement raises the electricity sale price making the system much more cost-effective. The saving is 373 000 € per year. That is because the REE is higher; it happens when the system utilizes a large part of the heat produced (little heat is released to the environment). Thus, the Special Regime established a compromise between selling more electricity at lower price and releasing waste heat or selling less electricity but at higher price because the system is more environmental friendly. Therefore, companies study all the possible alternatives before deciding the operation of the cogeneration system, in order to make it profitable. Finally, O&M costs of cooling machines are considered. They are calculated by using the following expression: Annual system cost = Ca / (1-0.04-0.08) = Ca/0.88 Without considering the Efficiency Supplement the annual system cost is 2.898 M€/year
Considering the Efficiency Supplement the annual system cost is 2.475 M€/year

6. Discussion and conclusion
65
6. Discussion and conclusion The results of the optimizations and the conclusions deduced from them are discussed in this
section.
The best way to compare different cogeneration systems is contrasting the efficiency parameters explained in section 2.2.3. as well as economic and environmental factors. Firstly, the performance of both systems is going to be discussed. Table 11 is a summary of the cogeneration parameters calculated previously.
Table 11: Cogeneration parameters of the systems.
RWF RQF ηe RWQ ∆F FESR REE
System 1 0.348 0.396 0.744 0.878 68069 MWh 0.375 0.662
System 2 0.409 0.401 0.81 1.02 93937 MWh 0.447 0.737
System 1 is the first scenario modelled including a Gas turbine CHP and a Gas engine CHP and system 2 is the alternative system with two Gas engine CHP. The parameters of cogeneration only consider the electricity and the heat produced by CHP systems as well as the fuel consumed by them. So, in the second system, boilers are not taken into consideration when calculating these parameters. System 2 is more efficient than system 1, the global efficiency given by ηe is higher. Moreover, RWF and RQF are higher, which indicates that more electricity and more heat are produced per unit of fuel consumed; saving natural gas which is an important factor that must be taken into account because it helps to reduce environmental impacts. When comparing these cogeneration systems to conventional systems, the second system is also much more profitable; it is indicated by ∆F and FESR parameters. Finally, a higher REE results in an interesting Efficiency Supplement which means an increase of the electricity sale price. Thus, it helps to recover the investment as soon as possible, making the system cost-effective. Figure 65 compares both systems attending to natural gas consumption and the generation of heat and electricity including the gas boiler of system 2.
Comparison
113,3
39,448,4
116,1
49,8 46,6
0,0
20,0
40,0
60,0
80,0
100,0
120,0
140,0
NG consumption Electricity Heat
GW
h/y
ear
System 1
System 2
Figure 65: Comparison of the system.

6. Discussion and conclusion
66
System 2 consumes 2.6% more natural gas than system 1. However, it generates 26% more electricity and the heat produced only decreases 3.8%. Therefore, system 2 is more favourable. When comparing cooling production, it can be seen that system 2 generates much more cooling from absorption machines than system 1, the percentage increase is 180%. Hence, system 2 also promotes the introduction of absorption chillers in trigeneration systems; reducing electricity supplied to compression machines that can be sold in the market. This difference is illustrated in Figure 66.
Cooling
3,1
8,7
11,3
5,7
0,0
2,0
4,0
6,0
8,0
10,0
12,0
14,0
16,0
System 1 System 2
GW
h/y
ear
CM
AM
Figure 66: Comparison of cooling production.
Absorption possibilities are a good option since heat is used as fuel instead of electricity. The integration of absorption chillers with CHP plants is beneficial because absorption machines utilize waste heat from the CHP plant, which is a by-product from electricity generation. This is profitable especially during warm periods when excess heat is a problem for power companies. Furthermore, considering economical aspects, the second system is annually cheaper than the first one. If the CO2 emissions are compared, the difference is not significant; system 2 generates only 3% more CO2 emissions. In conclusion, the final decision is to install the second system because it is more cost-effective considering the efficiency parameters and the operation of the systems. In addition, it includes a biomass boiler; promoting the introduction of these sustainable boilers to replace gas natural boilers which are deeply rooted in Spain. The feasibility of installing a trigeneration system has been analysed throughout this thesis. The main objective of the present work is to replace conventional systems with more efficient technology that can be used to meet the energy demand of a residential area. In spite of the fact that trigeneration system are recognized internationally for having a big potential for saving primary energy thereby contributing to the fight against Climate change, this type of system needs to be supported by authorities in order to make it cost-effective.

67

68
References AbsChillers, 2009. Absorption Chillers. http://www.absorptionchillers.com/ (2009-04-23) Acogen, 2009. Asociación Española de Cogeneración. http://www.acogen.org/ (2009-05-06) Biomass, 2002. Calefacción en grandes edificios con biomasa. Aspectos técnicos básicos. IDAE. September, 2002. http://www.bioheat.info/pdf/brochure_es_calef.pdf (2009-04-20) Biomass, 2007. Energía de la biomasa. IDAE. January, 2007. http://www.idae.es/index.php/mod.documentos/mem.descarga?file=/documentos_10374_Energia_de_la_biomasa_07_b954457c.pdf (2009-04-20) Biomasa, 2009. II Encuentro Especializado. Madrid, 26 de enero de 2009, Auditorio Unidad Editorial. DH Systems in Spain. www.conferenciasyformacion.com/conferencias/descargar_pdf/74 (2009-04-20) BioNrel, 2008. Learning about renewable energy, biomass energy basics. National Renewable Energy Laboratory (NREL). http://www.nrel.gov/learning/re_biomass.html (2009-04-20) BOE, 2008. ORDEN ITC/1857/2008, de 26 de junio, por la que se revisan las tarifas eléctricas a partir del 1 de julio de 2008. http://www.boe.es/boe/dias/2008/06/28/pdfs/A28738-28750.pdf (2009-04-14) BOE, 2007. REAL DECRETO 661/2007, de 25 de mayo, por el que se regula la actividad de producción de energía eléctrica en régimen especial. http://www.boe.es/boe/dias/2007/05/26/pdfs/A22846-22886.pdf (2009-04-14) CNE, 2009. Comisión Nacional de Energía. http://www.cne.es (2009-04-16) Cogen, 2009. Cogen España, Asociación española para la promoción de la Cogeneración. Cogeneración en España. http://www.cogenspain.org (2009-05-06) Cogeneu, 2009. Cogen europe. What is cogeneration. http://www.cogeneurope.eu/2009/02/what-is-cogeneration/ (2009-04-02) CostWorks, 2008. RSMeans Cost Work. Online estimating tools for commercial, facilities, civil and residential construction projects. It provides online access to the most used and quoted construction cost data-in tandem with comprehensive estimating and customization functions. http://www.meanscostworks.com/ (2009-15-03) Coyun, 2008. Boletín Trimestral de Coyuntura Energética, Número 55, 3er. Trimestre 2008. http://www.mityc.es/energia/balances/Balances/CoyunturaTrimestral/2008/COY3T2008.pdf (2009-03-15)

69
Cuellar, 2007. Proyecto Modelo Biomasa Cuéllar, July 2007. http://www.ercyl.com/pdf/doc_biomasa/proyecto_modelo_biomasa_cuellar_julio_2007.pdfhttp://www.idae.es/index.php/mod.documentos/mem.descarga?file=/8711.pdf (2009-05-06)
Danfoss, 2009. Danfoss Heating – for professionals http://heating.danfoss.com/Content/8FEC84F5-D983-4B96-8B36-29822586FFA3_MNU17436946_SIT54.html (2009-04-24) Educogen, 2001. The European Association for the Promotion of Cogeneration. A guide to cogeneration, March 2001. EDUCOGEN, CONTRACT N° XVII/4.1031/P/99-159 http://www.cogenspain.org/site/Portals/0/Cogeneraci%C3%B3n/EDUCOGEN_Cogen_Guide.pdf (2009-04-15) EnerBuilging, 2007. EnerBuilding.eu. EnerBuilding Project. Eficiencia energética en viviendas. December 2007. http://www.cecu.es/campanas/medio%20ambiente/Guia%20Viviendas.pdf (2009-04-20) EnerG, 2009. Ener-G, Efficient Energy Solutions. Conegeretion Benefits. http://www.energ.co.uk/cogeneration_benefits (2009-04-16) Energía, 2008. Energía 2008. Foro Nuclear. http://www.foronuclear.org/pdf/energia_2008.pdf (2009-03-15) Fernández, P., 2008a. Ciclos de refrigeración por compresión, chapter 14 http://libros.redsauce.net/Termodinamica/PDFs/Capitulo14.pdf (2009-04-23) Fernández, P., 2008b. Ciclos de máquinas frigoríficas no convencionales, chapter 15. http://libros.redsauce.net/Termodinamica/PDFs/Capitulo15.pdf (2009-04-23) GasNatural, 2008. Gas Natural report. Eficiencia Energética. http://www.gasnatural.com/esp/eficiencia/eficiencia_energetica_cast.pdf (2009-03-15) GEenergy, 2008. GE energy - Trigeneration, GE Jenbacher GmbH & Co OHG. One engine, three powerful results. http://www.ge-energy.com/prod_serv/products/recip_engines/en/downloads/as_trigen_feb08.pdf
(2009-04-20) Gil, J., 2009. Energía de la biomasa. Uso de calderas de biomasa en invernaderos. Javier Gil. BestResult and CENER (Centro Nacional de Energías Renovables). http://www.bestresult-iee.com/Lists/public_deliverables/Attachments/41/Biomass.pdf (2009-04-20) HE, 2009. Documento Básico. HE Ahorro de Energía. Código Técnico de la Edificación. http://www.codigotecnico.org/fileadmin/Ficheros_CTE/Documentos/CTEabr09/DB%20HE%20abril%202009.pdf (2009-04-03) Heat-air, 2009. Heating & air-conditioning in Spain. Costs and alternatives. http://www.justlanded.com/english/Spain/Articles/Property/Heating-air-conditioning-in-Spain (2009-04-24) Henning, D., 1997. MODEST—An energy-system optimisation model applicable to local utilities and countries. Dag Henning. Energy Vol. 22, No. 12, pp 1135–1150. (2009-02-14)

70
Henning, D., 2006. Modelling and optimisation of electricity, steam and district heating production for a local Swedish utility. Dag Henning , Shahnaz Amiri, Kristina Holmgren. Science Direct, European Journal of Operational Research 175 (2006) 1224–1247. (2009-02-14) Heymo, 2009. Heymo Ingeniería, S.A. Wood waste district heating system (Cuéllar, Spain). http://www.heymo.com/en/ER/Fichas/Biomass%20district%20heating%20-%20Cu%C3%A9llar.pdf
(2009-05-06) IDEA, 2009. International District Energy Association. http://www.districtenergy.org/ (2009-03-20) IEA DHC, 2009. International Energy Agency District Heating and Cooling http://www.iea-dhc.org/ (2009-03-20)
INDEL, 1998. Atlas de la demanda eléctrica española. Proyecto INDEL. Red Eléctrica Española. S.A. 1998. (2009-03-06)
Leonardo, 2007. Leonardo Energy. Industrial Heat Pumps. Bhodan Soroka, Laborelec. February, 2007. http://www.leonardo-energy.org/webfm_send/180 (2009-03-15) Lozano, M.A., 2008. Slides of Tecnología energética. Cogeneración. Miguel Ángel Lozano. 4th of Engineering at the Univestity of Zaragoza, Spain, 2008. Marín,J.M., 2007. Ciclos de refrigeración por absorción. Chapter 10. Apuntes de la asignatura: Ingeniería Térmica. José María Marín, José María Cózar. 4th of Engineering at the University of Zaragoza, Spain, 2007.
Monzón, R., 2004. Final Project CPS, University of Zaragoza. Análisis de sistemas de trigeneración con acumulación térmica para calefacción y refrigeración de distrito. Author: Roberto Monzón Guallar. Director: Miguel Ángel Lozano Serrano. August, 2004.
Nccc, 2009. National Climate Change Committee. District cooling. http://www.nccc.gov.sg/building/dcs.shtm (2009-03-20)
Nordvärme, 1996. Environmental Benefits from District Heating in the Nordic Capitals. http://www.energy.rochester.edu/nordvarm/env/ (2009-04-20)
Nrel, 2003. Gas-Fired Distributed Energy Resource Technology Characterizations. A joint project of the Gas Research Institute (GRI) and the National Renewable Energy Laboratory (NREL) prepared for the Office of Energy Efficiency and Renewable Energy. November, 2003. NREL/TP-620-34783 http://www.nrel.gov/docs/fy04osti/34783.pdf (2009-03-07) OMEL, 2009. Compañía Operadora del Mercado Español de Electricidad. http://www.omel.es (2009-15-20)
Pulido, T., 2005. Trigeneración y Eficiencia Energética en Establecimientos Hoteleros. Author: Teo Pulidoi Sureda (University of Girona). Supervisor: Dr. Jalel Labidi. Tarragona, September, 2005.

71
REE, 2009. Red Eléctrica de España. http://www.ree.es (2009-03-15) Rochester, 2004. District Energy Library (University of Rochester). http://www.energy.rochester.edu/ (2009-03-20) Ruiz, R., 2007. Slits of Refrigeración y acondicionamiento de aire course, 5th of Engineering in ETSEIB/UPC, Spain, 2007. Solé, 2009. L. Solé, S.A. Biomass boilers and DH systems in Spain. www.ecourbano.es/imag/PERE_descripcio%20técnica.pdf (2009-05-06)
Sánchez, S., 2003. Final Project CPS, University of Zaragoza. Titulo: Diseño óptimo de sistemas de trigeneración con motores alternativos de combustión interna para el sector residencial comercial. Author: Silvia Sánchez Mazón. Director: Miguel Ángel Lozano Serrano. November, 2003.
Teyser, 2008. Teyser Climatización, S.L. http://www.teyserclimatizacion.com/website/global/g_climatizacion.html (2009-04-24)
Thermi, 2009. Thermital, Grupo Riello. http://www.thermital.es/ (2009-03-15) Trigen, 2009. Trigeneration Technologies. http://www.trigeneration.com/ (2009-04-23) Trigen, 2009b. EcoGeneration Solutions, LLC. Company. Trigeneration Technologies. http://www.cogeneration.net/Trigeneration.htm (2009-04-23) Unep, 2009. UNEP United Nations Environmental Program. Division of Technology, Industry and Economy. Energy Technology Fact Sheet, Cogeneration . http://www.uneptie.org/energy/information/publications/factsheets/pdf/cogeneration.pdf (2009-04-02) Viladrich-Grau, M., Vila, J., 2007. Cogeneration and On.Site Power Production. July 2007. http://www.cospp.com/articles/print_screen.cfm?ARTICLE_ID=303176 (2009-05-06)
Wiki DH, 2009. Wikipedia District Heating http://en.wikipedia.org/wiki/District_heating (2009-04-23)
Wulfinghoff, D.R., 1999. Compression cooling. Reference Note 32. 1999. http://www.energybooks.com/pdf/D1132.pdf (2009-04-25)
Zinko, H., 2008. Slits Energy System course. Master in Energy Systems. Gävle, Sweden.

72
Appendixes
Appendix A
The total heating demand in MW of the urbanization for each hour of the month is found in the table below. Hours Jan Feb March April May June July August Sept Octob Nov Dec
1 2,12 1,90 1,53 1,20 0,80 0,48 0,31 0,23 0,46 0,92 1,61 2,02
2 1,39 1,19 0,91 0,68 0,37 0,13 0,09 0,09 0,15 0,46 1,00 1,33
3 1,39 1,22 0,91 0,68 0,36 0,13 0,09 0,09 0,15 0,49 1,01 1,34
4 1,40 1,22 0,91 0,68 0,36 0,13 0,08 0,08 0,15 0,45 1,01 1,34
5 1,95 2,00 1,39 1,03 0,43 0,17 0,12 0,12 0,19 0,54 1,48 1,99
6 2,01 2,01 1,43 1,07 0,52 0,21 0,18 0,18 0,25 0,63 1,53 2,03
7 16,83 14,52 10,08 4,61 1,02 0,59 0,44 0,36 0,60 2,87 11,40 21,04
8 17,35 14,47 10,14 4,80 1,34 0,82 0,63 0,52 0,76 3,16 11,41 20,77
9 17,32 14,49 10,32 5,17 1,81 1,15 0,85 0,67 1,14 3,56 11,53 20,47
10 17,43 14,62 10,62 5,65 2,34 1,55 1,08 0,80 1,47 4,02 11,76 20,28
11 16,31 13,62 9,83 5,12 1,96 1,25 0,86 0,64 1,20 3,56 10,94 19,05
12 15,40 12,80 9,14 4,62 1,58 0,95 0,65 0,50 0,93 3,12 10,23 18,07
13 14,37 11,90 8,43 4,16 1,27 0,71 0,48 0,38 0,70 2,73 9,49 16,92
14 14,93 12,71 9,07 4,75 1,69 1,08 0,72 0,53 1,04 3,13 10,06 17,45
15 13,98 11,88 8,43 4,37 1,57 0,96 0,70 0,55 0,97 2,94 9,38 16,36
16 13,03 11,05 7,86 4,09 1,43 0,87 0,59 0,45 0,85 2,70 8,75 15,21
17 16,95 11,12 6,37 2,93 1,26 0,74 0,49 0,37 0,72 1,86 8,59 15,29
18 16,64 12,40 6,70 3,03 1,37 0,84 0,56 0,42 0,80 2,09 9,47 15,33
19 15,35 12,90 7,68 3,62 1,62 1,05 0,70 0,51 0,99 2,38 10,11 15,65
20 15,68 12,51 8,00 3,92 1,88 1,26 0,85 0,61 1,19 2,69 10,34 15,84
21 12,46 10,00 5,89 3,24 1,65 1,07 0,76 0,57 1,05 2,04 7,10 12,23
22 14,04 11,80 7,60 3,67 1,39 0,86 0,50 0,39 0,79 2,09 8,91 13,87
23 2,95 2,78 2,17 1,69 1,07 0,65 0,43 0,31 0,62 1,22 2,59 2,87
24 2,36 2,16 1,70 1,33 0,88 0,51 0,35 0,27 0,51 1,01 1,79 2,27
The following table shows the heating demand divided in timesteps.
Hours Jan Feb March April May June July August Sept Octob Nov Dec
1&2 2,12 1,90 1,53 1,20 0,80 0,48 0,31 0,23 0,46 0,92 1,61 2,02
3&4 1,40 1,22 0,91 0,68 0,36 0,13 0,09 0,09 0,15 0,49 1,01 1,34
5&6 2,01 2,01 1,43 1,07 0,52 0,21 0,18 0,18 0,25 0,63 1,53 2,03
7&8 17,35 14,52 10,14 4,80 1,34 0,82 0,63 0,52 0,76 3,16 11,41 21,04
9&10 17,43 14,62 10,62 5,65 2,34 1,55 1,08 0,80 1,47 4,02 11,76 20,47
11&12 16,31 13,62 9,83 5,12 1,96 1,25 0,86 0,64 1,20 3,56 10,94 19,05
13&14 14,93 12,71 9,07 4,75 1,69 1,08 0,72 0,53 1,04 3,13 10,06 17,45
15&16 13,98 11,88 8,43 4,37 1,57 0,96 0,70 0,55 0,97 2,94 9,38 16,36
17&18 16,95 12,40 6,70 3,03 1,37 0,84 0,56 0,42 0,80 2,09 9,47 15,33
19&20 15,68 12,90 8,00 3,92 1,88 1,26 0,85 0,61 1,19 2,69 10,34 15,84
21&22 14,04 11,80 7,60 3,67 1,65 1,07 0,76 0,57 1,05 2,09 8,91 13,87
23&24 2,95 2,78 2,17 1,69 1,07 0,65 0,43 0,31 0,62 1,22 2,59 2,87

73
The total cooling demand in MW of the urbanization for each hour of the month is found in the table below.
Hours Jan Feb March April May June July August Sept Octob Nov Dec
1 0,009 0,010 0,010 0,009 0,016 0,180 0,549 0,524 0,103 0,024 0,011 0,009
2 0,009 0,010 0,010 0,009 0,016 0,175 0,531 0,508 0,100 0,023 0,011 0,009
3 0,010 0,011 0,011 0,010 0,015 0,173 0,528 0,504 0,099 0,023 0,012 0,010
4 0,010 0,010 0,011 0,009 0,015 0,171 0,525 0,501 0,097 0,022 0,011 0,009
5 0,015 0,016 0,016 0,014 0,031 0,209 0,583 0,565 0,127 0,032 0,017 0,014
6 0,020 0,021 0,022 0,019 0,037 0,255 0,655 0,645 0,165 0,044 0,023 0,020
7 0,022 0,024 0,025 0,022 0,042 0,301 0,790 0,774 0,191 0,050 0,026 0,022
8 0,022 0,024 0,025 0,022 0,047 0,347 0,924 0,903 0,219 0,057 0,026 0,022
9 0,019 0,020 0,021 0,018 0,035 0,385 1,126 1,083 0,228 0,055 0,021 0,018
10 0,019 0,020 0,021 0,018 0,037 0,414 1,313 1,247 0,230 0,051 0,021 0,018
11 0,019 0,020 0,021 0,018 0,037 0,449 1,473 1,392 0,241 0,051 0,021 0,018
12 0,021 0,023 0,024 0,021 0,040 3,205 9,304 7,271 2,643 0,054 0,024 0,021
13 0,019 0,020 0,021 0,018 0,033 3,985 11,644 9,035 3,305 0,046 0,022 0,018
14 0,014 0,014 0,015 0,013 0,032 4,681 13,719 10,612 3,891 0,042 0,016 0,013
15 0,016 0,017 0,018 0,015 0,039 6,795 19,626 15,033 5,753 0,052 0,018 0,016
16 0,020 0,022 0,023 0,019 0,042 12,441 24,898 22,139 11,345 0,061 0,023 0,020
17 0,024 0,026 0,027 0,023 0,043 11,352 21,909 19,017 9,734 0,064 0,028 0,023
18 0,026 0,027 0,028 0,024 0,049 3,130 12,597 8,458 2,308 0,068 0,029 0,025
19 0,024 0,026 0,027 0,023 0,047 2,360 10,723 6,942 1,448 0,064 0,028 0,024
20 0,019 0,020 0,021 0,018 0,033 1,496 8,610 5,616 0,978 0,058 0,022 0,019
21 0,016 0,017 0,017 0,015 0,030 1,260 8,640 5,400 0,853 0,049 0,018 0,015
22 0,014 0,015 0,016 0,014 0,028 1,300 6,807 4,274 0,733 0,044 0,016 0,014
23 0,011 0,012 0,012 0,010 0,021 0,229 0,652 0,630 0,138 0,034 0,012 0,011
24 0,010 0,010 0,011 0,009 0,018 0,203 0,593 0,571 0,120 0,029 0,011 0,009
The following table shows the cooling demand divided in timesteps.
Horas Jan Feb Mars April May June July August Sep Oct Nov Dec
1&2 0,009 0,010 0,010 0,009 0,016 0,180 0,549 0,524 0,103 0,024 0,011 0,009
3&4 0,010 0,011 0,011 0,010 0,015 0,173 0,528 0,504 0,099 0,023 0,012 0,010
5&6 0,020 0,021 0,022 0,019 0,037 0,255 0,655 0,645 0,165 0,044 0,023 0,020
7&8 0,022 0,024 0,025 0,022 0,047 0,347 0,924 0,903 0,219 0,057 0,026 0,022
9&10 0,019 0,020 0,021 0,018 0,037 0,414 1,313 1,247 0,230 0,055 0,021 0,018
11&12 0,021 0,023 0,024 0,021 0,040 3,205 9,304 7,271 2,643 0,054 0,024 0,021
13&14 0,019 0,020 0,021 0,018 0,033 4,681 13,719 10,612 3,891 0,046 0,022 0,018
15&16 0,020 0,022 0,023 0,019 0,042 12,441 24,898 22,139 11,345 0,061 0,023 0,020
17&18 0,026 0,027 0,028 0,024 0,049 11,352 21,909 19,017 9,734 0,068 0,029 0,025
19&20 0,024 0,026 0,027 0,023 0,047 2,360 10,723 6,942 1,448 0,064 0,028 0,024
21&22 0,016 0,017 0,017 0,015 0,030 1,300 8,640 5,400 0,853 0,049 0,018 0,015
23&24 0,011 0,012 0,012 0,010 0,021 0,229 0,652 0,630 0,138 0,034 0,012 0,011

74
The total electricity demand in MW of the urbanization for each hour of the month is found in the table below.
Hours Jan Feb March April May June July August Sept Octob Nov Dec
1 1,92 1,93 1,92 1,93 1,93 1,56 1,58 1,58 1,96 1,94 1,93 1,93
2 1,40 1,42 1,41 1,42 1,41 1,28 1,31 1,30 1,45 1,43 1,42 1,42
3 1,07 1,08 1,07 1,08 1,07 1,13 1,15 1,15 1,10 1,08 1,08 1,09
4 0,93 0,95 0,94 0,95 0,94 1,05 1,08 1,07 0,97 0,95 0,95 0,95
5 0,93 0,94 0,93 0,95 0,96 1,07 1,11 1,10 0,98 0,95 0,95 0,95
6 0,96 0,99 0,97 1,00 0,99 1,10 1,15 1,14 1,03 0,99 1,00 1,00
7 1,05 1,08 1,06 1,09 1,08 1,15 1,21 1,20 1,13 1,08 1,09 1,09
8 1,19 1,22 1,21 1,23 1,25 1,24 1,31 1,29 1,30 1,25 1,23 1,24
9 1,40 1,43 1,42 1,44 1,44 1,43 1,48 1,46 1,53 1,48 1,44 1,44
10 1,72 1,75 1,73 1,76 1,76 1,65 1,69 1,67 1,83 1,78 1,76 1,76
11 1,88 1,91 1,89 1,92 1,93 1,80 1,85 1,84 2,00 1,95 1,92 1,92
12 1,96 1,99 1,98 2,00 2,00 1,89 1,94 1,92 2,07 2,02 2,00 2,00
13 2,05 2,07 2,06 2,08 2,07 1,89 1,93 1,91 2,13 2,09 2,08 2,08
14 2,14 2,16 2,15 2,17 2,19 1,93 1,96 1,95 2,24 2,20 2,17 2,17
15 2,18 2,20 2,19 2,21 2,23 1,98 2,02 2,01 2,30 2,25 2,20 2,21
16 2,12 2,14 2,13 2,15 2,16 1,93 1,99 1,96 2,25 2,20 2,15 2,15
17 2,06 2,09 2,08 2,11 2,09 1,82 1,88 1,86 2,19 2,13 2,11 2,11
18 2,02 2,06 2,04 2,07 2,07 1,76 1,84 1,81 2,16 2,10 2,07 2,07
19 2,18 2,21 2,19 2,22 2,22 1,76 1,83 1,81 2,31 2,25 2,22 2,22
20 2,41 2,44 2,43 2,45 2,44 1,82 1,89 1,87 2,55 2,49 2,45 2,45
21 2,64 2,66 2,65 2,67 2,67 1,90 1,95 1,94 2,76 2,71 2,67 2,67
22 2,78 2,80 2,79 2,80 2,81 2,05 2,10 2,09 2,88 2,84 2,80 2,80
23 2,70 2,72 2,71 2,72 2,72 2,07 2,11 2,10 2,75 2,75 2,72 2,72
24 2,50 2,52 2,51 2,52 2,52 1,85 1,89 1,88 2,57 2,54 2,52 2,52
The following table shows the electricity demand divided in timesteps.
Horas Jan Feb Mars April May June July August Sep Oct Nov Dec
1&2 1,66 1,67 1,67 1,68 1,67 1,42 1,45 1,44 1,71 1,68 1,68 1,68
3&4 0,93 0,95 0,94 0,95 0,95 1,06 1,09 1,08 0,97 0,95 0,95 0,95
5&6 0,94 0,97 0,95 0,97 0,98 1,08 1,13 1,12 1,00 0,97 0,97 0,98
7&8 1,12 1,15 1,13 1,16 1,17 1,20 1,26 1,24 1,21 1,17 1,16 1,16
9&10 1,56 1,59 1,57 1,60 1,60 1,54 1,59 1,57 1,68 1,63 1,60 1,60
11&12 1,92 1,95 1,93 1,96 1,97 1,85 1,90 1,88 2,04 1,99 1,96 1,96
13&14 2,09 2,11 2,10 2,12 2,13 1,91 1,95 1,93 2,18 2,14 2,12 2,13
15&16 2,15 2,17 2,16 2,18 2,20 1,95 2,01 1,99 2,28 2,22 2,18 2,18
17&18 2,04 2,08 2,06 2,09 2,08 1,79 1,86 1,84 2,18 2,12 2,09 2,09
19&20 2,30 2,32 2,31 2,33 2,33 1,79 1,86 1,84 2,43 2,37 2,33 2,34
21&22 2,71 2,73 2,72 2,74 2,74 1,97 2,03 2,01 2,82 2,78 2,74 2,74
23&24 2,60 2,62 2,61 2,62 2,62 1,96 2,00 1,99 2,66 2,65 2,62 2,62

75
Appendix B HEATING AND COOLING DEMANDS
The demands of the school have been calculated by making some assumptions. The school building is supposed to have a total surface of 1 350 m2 divided in three floors (3x30x15). The total volume of the building is 10 125 m3 and it has a capacity of 20 classroom for approximately 600 pupils and several rooms for the teachers. The school has 24 windows of 2m2 and 12 windows of 1,5 m2. The monthly heating and cooling demand has been calculated by using a simple software based on heat losses through the building envelope developed by Miguel Ángel Hernández Cruz in November 2008 (Centro Integrado de FP Superior de Energías Renovables, Gobierno de Navarra).
Jan Feb Mar April May Jun Jul Aug Sep Oct Nov Dec TOTAL
Heating (kWh/month)
11.08 7.143 4.467 1.563 0 0 0 0 0 0 5.607 11.77 41.63
Cooling (kWh/month)
0 0 0 0 0 5.700 10.88 10.06 4.324 0 0 0 30.97
Total (kWh/month)
11.08 7.143 4.467 1.563 0 5.700 10.88 10.06 4.324 0 5.607 11.77 72.60
Total (kWh/day)
369,3 238,1 148,9 52,1 0,0 190,0 362,7 335,5 144,1 0,0 186,9 392,5
Figure: Heating and cooling demand of the school.
The hourly demands for a type day of each month have been estimated by analysing the distribution of the demands in the residential buildings. It has been assumed that the systems are turned off at 6 p.m. when classes finish, and cooling is not needed during July and August because it is the holiday period at school. Generally, the timetable of classes is from 9 a.m. to 5 p.m (8hours/day). HOT WATER DEMAND
The hot water demand has been calculated by using the CTE procedure explained in the Basic Document HE Ahorro de Energía [HE, 2009]. In school 3 litres/day·pupil are required. 600 pupils x 3 litres/day·pupil = 1800 litres/day 1800 litres/day · 8hours/day = 14 400 litres/day =0.00625 kg/s P=mwater· Cp·∆T with ∆T = 60 – 15 =45ºC ; Cp = 4.18 kJ/kgºC P = 0.00625 kg/s · 4.18 kJ/kgºC · 45ºC = 11.756 kW This value has been considered constant during the hours of classes. ELECTRICITY DEMAND
The demand of electricity has been calculated attending to the lighting and the electrical appliances that usually are utilised in a school. Lighting 4200W 60 computers (150W) 9000W 3 TVs (100W) 300W 3 Audios (80W) 240W 1 laser printer (400W) 400W During the hours of classes the total electricity required is 15 kW and it is only 3.5 kW in the evening corresponding to the lighting of more or less 5 classes and the corridors and the power of 10 computers.

76
Appendix C
• Gas Turbine Systems
Commercial turbines are available from 500 kW to 250 MW, but they operate better when the power is more than 5 MW. The nominal capacities that may be installed in the system are the following: Nominal Capacity
(kW) Investment Cost
(€/MW) O&M Cost (€/MWh)
Total CHP Efficiency
Power/Heat Ratio
5000 891 201 5.13485266 0.744 0.68
10000 807 651 4.786727 0.76 0.73
25000 696 251 4.264539 0.78 0.95 *All the values have been calculated according to the lower heating value (LHV) of the fuel
An average value can be assumed in order to introduce it in the MODEST model. Investment Cost = 800 000 €/MW O&M Cost = 5 €/MWh Total CHP Efficiency = 0.76 Power/Heat Ratio = 0.73 CO2 emissions = 204 kg CO2/MWh Source: [Nrel, 2003]. Table 1. Gas Turbine Systems – Typical Performance Parameters (2003), page 72/226.
• Gas Engine Systems
Commercial engines are available from 10 kW to 7MW. The nominal capacities for system are the following: Nominal Capacity
(kW) Investment Cost
(€/MW) O&M Costs (€/MWh)
Total CHP Efficiency
Power/Heat Ratio
1000 822 447 7.83282609 0.792 0.92
3000 813 744 7.8322826 0.76 1.04
5000 774 580 6.962512 0.81 1.02 *All the values have been calculated according to the lower heating value (LHV) of the fuel
An average value can be assumed in order to introduce it in the MODEST model. Investment Cost = 800 000 €/MW O&M Cost = 7 €/MWh Total CHP Efficiency = 0.81 Power/Heat Ratio = 1.02 CO2 emissions = 204 kg CO2/MWh Source: [Nrel, 2003]. Table 2, Reciprocating Engine Systems – Typical Performance Parameters (2003),page 35/226.
• Heating oil boiler
Max. Nominal Capacity = 4 MW Thermal efficiency = 0.92 Investment Cost = 60 000 €/MW O&M Cost = 1.5 €/MWh CO2 emissions = 287 kg CO2/MWh Source: [CostWorks, 2008], [Thermi, 2009].
• Natural gas boiler
Nominal Capacity = 4 MW Thermal efficiency = 0.92

77
Investment Cost = 60 000 €/MW O&M Cost = 1.5 €/MWh CO2 emissions = 204 kg CO2/MWh Source: [CostWorks, 2008], [Thermi, 2009].
• Biomass boiler
Nominal Capacity = max. 6 MW Thermal efficiency = 0.85 Investment Cost = 220 000 €/MW O&M Costs = 10 €/MWh CO2 emissions = 0 kg CO2/MWh Source: [Cuellar, 2007], [Biomass, 2007], [Biomass, 2002].
• Heat Pump
Max. Nominal Capacity = 15 MW COP = 3 Investment Cost = 300 000 €/MW O&M Costs = 4 €/MWh Source: [Leonardo, 2007], [CostWorks, 2008].
• Electrical heat boiler
Max. Nominal Capacity = 12 MW Efficiency = 0.98 Investment Cost = 40 000 €/MW O&M Cost = 1.5 €/MWh Source: [CostWorks, 2008].
• Cooling Towers
Max. Nominal Capacity = 1000 ton = 3.5 MW Investment Cost = 42 500 €/MW Some cooling towers will be installed in order to chill the cooling water. Source: [CostWorks, 2008].
• Indirect-fired absorption water chillers
Max. Nominal Capacity = 1660 ton = 6MW COP = 0.7 Investment Cost (not incl. tower) = 210 000 €/MW Total Investment Cost = 210 000 + 2.6*42 500 ≈ 320 000 €/MW Source: [CostWorks, 2008].
• Compression machine – Centrifugal type water chillers
Max. Nominal Capacity =2500 ton = 9MW COP = 5.3 Investment Cost (not incl. tower) = 150 000 €/MW Total Investment Cost = 150 000 + 1.17*42 500 ≈ 200 000 €/MW Source: [CostWorks, 2008].

78
Related Documents