1 OPTIMIZATION METHODOLOGY FOR HIGH COD 1 NUTRIENT-LIMITED WASTEWATERS TREATMENT USING 2 BAS PROCESS 3 4 Marta Revilla a , Berta Galán b , Javier R. Viguri b * 5 a SNIACE, Carretera de Ganzo S/N 39300 Torrelavega Cantabria, Spain. 6 b Green Engineering & Resources Research Group (GER). Department of Chemical and 7 Process & Resources Engineering. ETSIIT. University of Cantabria. Avenida los Castros 8 s/n. 39005, Santander, Cantabria, Spain. 9 10 *Corresponding author: Tlf: 30-942-201589; Fax: 30-942-206706,[email protected] 11 Javier R. Viguri: ORDIC Code:0000-0002-6658-0429 12 Berta Galan: ORCID Code: 0000-0003-2145-3669 13 14 Keywords: biofilm activated sludge, methodology, optimization, operational costs, 15 effluent quality, decision making. 16 17 ABSTRACT 18 Optimization of biofilm activated sludge (BAS) process via mathematical modelling is 19 an entangle activity since economic, environmental objective and technical decision must 20 be considered. This paper presents a methodology to optimize the operational conditions 21 of BAS process in four steps by combining dynamic simulation techniques with non- 22 linear optimization methods and with operative decision making criteria. Two set of 23 variables are separately prioritized in the methodology: essential variables related to 24 physical operation to enforce established process performance, and refinement variables 25 related to biological processes that can generate risks of bulking, pin-point floc and rising 26 sludge. The proposed optimization strategy is applied for the treatment of high COD 27 wastewater under nutrient limitation using an integrated mathematical model for COD 28 removal that include predation, hydrolysis and a simplified approach to the limiting solids 29 brought to you by CORE View metadata, citation and similar papers at core.ac.uk provided by UCrea

Welcome message from author
This document is posted to help you gain knowledge. Please leave a comment to let me know what you think about it! Share it to your friends and learn new things together.
Transcript

1
OPTIMIZATION METHODOLOGY FOR HIGH COD 1
NUTRIENT-LIMITED WASTEWATERS TREATMENT USING 2
BAS PROCESS 3
4 Marta Revillaa, Berta Galánb, Javier R. Vigurib* 5
aSNIACE, Carretera de Ganzo S/N 39300 Torrelavega Cantabria, Spain. 6
bGreen Engineering & Resources Research Group (GER). Department of Chemical and 7 Process & Resources Engineering. ETSIIT. University of Cantabria. Avenida los Castros 8 s/n. 39005, Santander, Cantabria, Spain. 9
10
*Corresponding author: Tlf: 30-942-201589; Fax: 30-942-206706,[email protected] 11
Javier R. Viguri: ORDIC Code:0000-0002-6658-0429 12 Berta Galan: ORCID Code: 0000-0003-2145-3669 13 14 Keywords: biofilm activated sludge, methodology, optimization, operational costs, 15
effluent quality, decision making. 16
17 ABSTRACT 18
Optimization of biofilm activated sludge (BAS) process via mathematical modelling is 19
an entangle activity since economic, environmental objective and technical decision must 20
be considered. This paper presents a methodology to optimize the operational conditions 21
of BAS process in four steps by combining dynamic simulation techniques with non-22
linear optimization methods and with operative decision making criteria. Two set of 23
variables are separately prioritized in the methodology: essential variables related to 24
physical operation to enforce established process performance, and refinement variables 25
related to biological processes that can generate risks of bulking, pin-point floc and rising 26
sludge. The proposed optimization strategy is applied for the treatment of high COD 27
wastewater under nutrient limitation using an integrated mathematical model for COD 28
removal that include predation, hydrolysis and a simplified approach to the limiting solids 29
brought to you by COREView metadata, citation and similar papers at core.ac.uk
provided by UCrea
2
flux theory in the secondary clarifier in order to facilitate the convergence of the 30
optimization solver. The methodology is implemented in a full scale wastewater treatment 31
plant for a cellulose and viscose fibre mill obtaining: i) improvement of the effluent 32
quality index (Kg pollution/m3) up to 62% and, ii) decrease the operating cost index 33
(€/m3) of the process up to 30% respect the regular working operational conditions of the 34
plant. The proposed procedure can be also applied to other biological treatments treating 35
high COD nutrient-limited industrial wastewater such as from textile and winery 36
production among others. 37
1. Introduction 38
Emission limits for industrial effluent are constantly being tightened up. Activated sludge 39
(AS) process is a common system for biological treatment of industry effluents; however, 40
more sustainable solutions require other technologies such as biofilm activated sludge 41
process (BAS). BAS is composed of moving bed biofilm reactor (MBBR) and activated 42
sludge reactor (AS) that are used as bacterial and predator stage respectively (Sointio et 43
al. 2006, Revilla et al. 2016a). The overall result in BAS processes increases COD 44
removal performance respect to other conventional treatment and, at the same time, lay 45
out lower sludge production. An additional and determining benefit is the improvement 46
sludge settleability in the final stage of secondary settling (Rankin et al. 2007) that allows 47
that the activated sludge reactor to be operated at increased biomass concentration while 48
simultaneously total suspended solids (TSS) concentration in the effluent can be reduced 49
(van Haandel and van der Lubbe 2015). Moreover, this biologic double stage process can 50
avoid the risk of bulking when it is operated under nutrients limitation (Rankin et al. 51
2007). Predation is the powerful mechanism of the BAS process that allows achieving 52
their main characteristic as the low sludge yield. 53
3
Modelling of biofilm stages and activated sludge provided a better understanding of the 54
intrinsic connections between soluble and particulate compounds, biomass properties and 55
process performance in terms of COD, BOD and TSS (Fan et al. 2017). Commercial 56
simulation platforms, including GPS-X and BioWin can be used to describe the one 57
dimensional (1-D) multi-species biofilm structure and biological behaviour of the 58
treatment process (Li et al. 2016); however, none of these platforms include the 59
description of the predator microorganism which plays a predominant role in a BAS 60
process under certain conditions such as nutrient limited conditions (Revilla et al. 2016a). 61
The authors published recently the mathematical model of BAS process including 62
hydrolysis and predation and uses wastewaters coming from viscose and cellulose 63
production industrial process to validate the model. In Revilla et al. 2016a the whole BAS 64
process was simulated and the evaluation of the role and contribution of predator 65
microorganisms towards COD removal, nutrient requirements and sludge production is 66
displayed. 67
More strict regulations are being imposed regularly in terms of COD, BOD and TSS 68
removal that enforce wastewater treatment technologies to progress (Guerrero et al. 2011; 69
Kamali and Khodaparast 2015). Optimization of an existing facility in terms of cost, 70
operational improvements and removal efficiency is the most effective method of 71
achieving the stricter compliance and the most effective method to overtake common 72
trade-off between treatment results and operational costs. However, expectation of having 73
to satisfy simultaneously a variety of objectives (environmental, economic and technical) 74
increases the complexity of the problem and becomes a very difficult task that should be 75
solved blending experience engineers and specific mathematical tools (Descoins et al. 76
2012; Hakanen et al. 2013). In this context, practical experience of the operator in the 77
prioritization of conflicting objectives or in the application of rules of thumb, needs to be 78
4
considered in the mathematical model since certain units at wastewater treatment plant 79
(WWTP) may be exceptionally difficult or risky to operate. 80
Multiple objective optimization (MOO) has been widely applied in operation and design 81
of municipal WWTP for different applications using interactive approaches between 82
several optimization and decision making tools (Dai et al. 2016; Garrido-Baserba et al. 83
2016; Hakanen at al. 2011; Rivas et al. 2008; Sweetapple et al. 2014). However, a 84
systematic methodology of multiple objective optimization of a full-scale BAS process 85
has not been addressed, to the best of our knowledge. 86
Generally, urban wastewater has high presence of nutrients that facilities the biological 87
process; however, some type of wastewater such as viscose and cellulose industry 88
wastewater are poor in nutrients that must be added externally with the consequent 89
increase in the operating costs of biological treatments (Rankin et al. 2007). 90
In this paper, an optimization methodology for BAS processes treating highly COD 91
wastewater under limited nutrient is presented. Simultaneous optimization of effluent 92
quality and operating cost under prioritized technical specifications is the main goal of 93
this procedure. Applicability of the proposed methodology for biological treatment 94
processes using biofilm is illustrated using two industrial-scale case studies from viscose 95
and cellulose wastewaters. 96
97
98
99
100

5
2. Identification of the problem 101
2.1. Problem statement 102
The problem of optimizing the operational conditions of the BAS plant can be stated as 103
follows: given is a BAS plant with known design parameters and given is an influent 104
stream with known flow rate that contain certain pollutants with known concentrations; 105
the goal of this problem is to identify the operational conditions of the plant at minimal 106
operational cost and minimal pollutant discharge in the effluent stream taking into 107
account technical specifications. 108
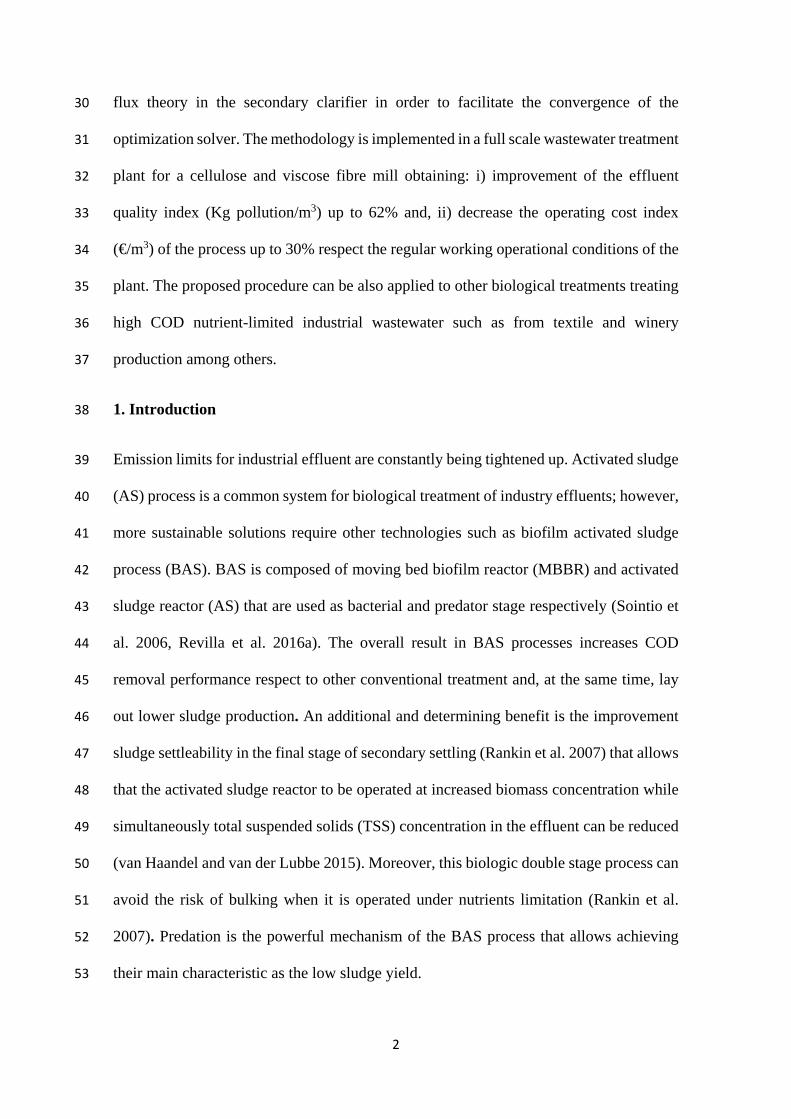
To solve this problem a conceptual optimization methodology approach, based on four 109
sequential stages showed in Figure 1, is proposed in this work. As explained previously, 110
BAS process included two biological sequential steps: MBBR reactor and AS reactor. In 111
MBBR reactor nutrient dosing is the unique variable that can be manipulated. 112
Furthermore, the mathematical model of the MBBR reactor presented previously by the 113
authors (Revilla et al. 2016b) is a multi-substrate biofilm and bulk liquid model and the 114
mathematical model of the AS is continuous stirred-tank reactor. These two biological 115
sequential steps described (MBBR and AS) are the base of the four sequential stages of 116
the optimization methodology. 117
Starting from the regular operation conditions of an industrial plant, the first stage of the 118
optimization methodology is the “Synthesis of Alternatives”; nutrient different dosage is 119
the essential variable of the process (performance and cost) being used to generate 120
different process alternatives. All the alternatives are simulated for MBBR reactor in the 121
second stage “Simulation” using a previous MBBR mathematical method; besides, the 122
results of “Simulation” allows obtaining the initial point of the variables of the AS 123
process. The third step is the “Activated Sludge Multicriteria Optimization” that allows 124
to obtain optimal solutions of the process variables under economic and environmental 125

6
evaluation criteria. This procedure (“Simulation of MBBR” and later “Activated Sludge 126
Multicriteria Optimization”) requires much less computation computational effort than 127
using an optimization software under dynamic and spatial conditions. 128
The last stage is the “Decision Making Process” where a set of refinement operation 129
bound let to obtain the optimal conditions under additional evaluation criterion. The 130
proposed methodology is iterative until the optimal solution is reached. 131
132
133
134
135
136
137
138
139
140
141
Figure 1.- Conceptual optimization methodology approach. 142
143
2.2. BAS mathematical model 144
A complete description for the mathematical models of four units involved in the BAS 145
process (MBBR, AS, secondary clarifiers and splitter) including the biological reactions, 146
stoichiometric and kinetic coefficients appears in previous papers presented by the 147
authors (Revilla et al. 2016a, b). In the present paper a significant modification has been 148
done in the mathematical model of secondary clarifier in order to evaluate the clarification 149
and thickening functions; a "simplified approach" proposed by von Sperling (2007) to the 150
Alternatives at different nutrient
dosage to Optimize
Initial points of
the variables in MMBR
Optimal solutions under
economic & environment
criteria
Solutions under economic & environment
and operational criteria
BAS Process Optimization Methodology
Optimal
Non Optimal
7
limiting solids flux theory has been included in the model. Limiting solids flux concept 151
is widely used in the bibliography trough the "non-differentiable minimum function" 152
(Amanatidou et al. 2015a, b) which requires iterative methods to solve it numerically and 153
can raise convergence issues when uses optimization algorithms (Hreiz et al. 2015a). The 154
use of the simplified approach facilitates the convergence of the optimization algorithms. 155
The simplified approach proposed by von Sperling (2007) takes into account four 156
variables i) hydraulic loading rate (HLR) which corresponds to the quotient between the 157
influent flow rate (Qi) and the surface area of the secondary settler (A) (equation 1), ii) 158
solids loading rate (SLR) which corresponds to the quotient between applied solids load 159
and the surface area of the secondary settler (equation 2), iii) sludge settling velocity (v) 160
(equation 3) and, iv) limiting solids flux (GL) (equation 4): 161
HLR (m3/m2 hour)= Qi/A (1) 162
SLR (Kg TSS/m2 hour)= (Qi + QR) × TSSAS/A (2) 163
v (m3/m2 hour)= (vo) × e−K ×TSSAS (3) 164
GL (Kg TSS/m2 hour)= m (QR/A)n (4) 165
where QR is the sludge recycle flow rate; TSSAS are the total suspended solid 166
concentrations in AS reactor; vo, K, m and n are specific correlation parameters. 167
In this work, “fair settleability”, with sludge volume index (SVI) between 100-200 mL/g, 168
vo (8.6 m/hour), K (0.50 m3/Kg), m (0.72) and n (8.41) is considered. 169
Finally, two new conditions are included in the previous BAS mathematical model 170
developed by the authors in order to ensure the clarification and thickening function. 171
• Clarification function: hydraulic loading rate (HLR)<sludge settling velocity (v) 172
• Thickening function: solid loading rates (SLR)<limiting solid flux (GL) 173
8
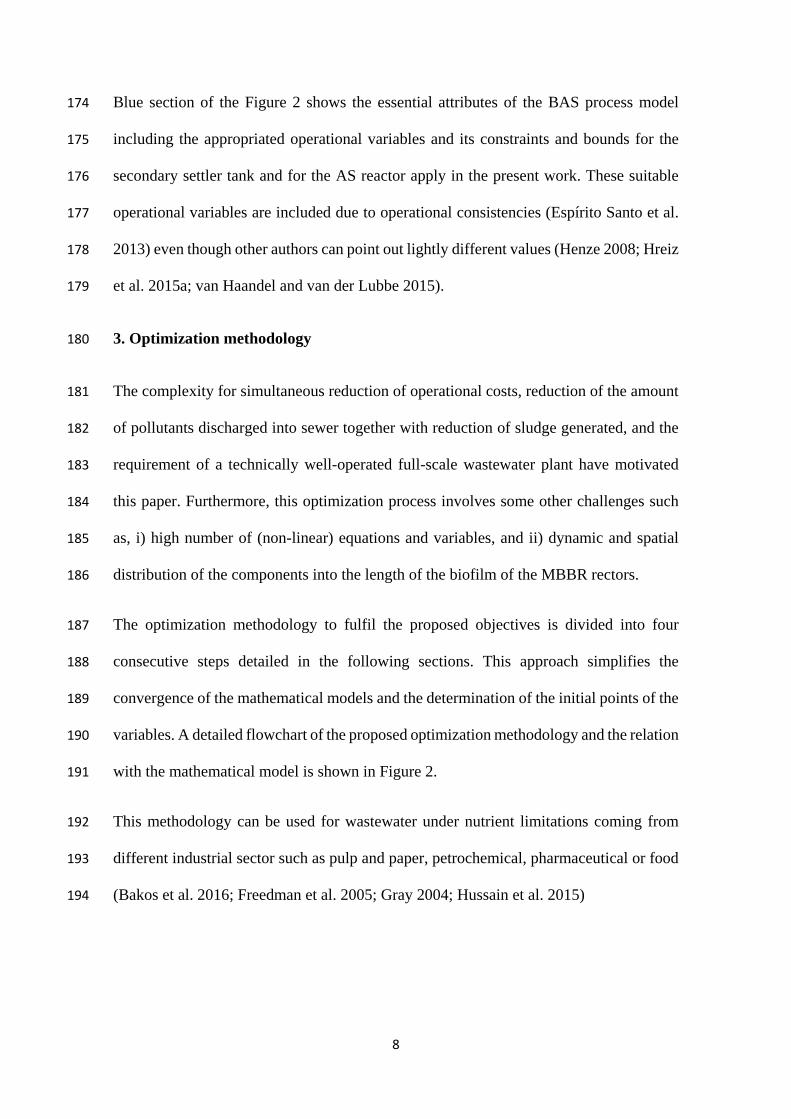
Blue section of the Figure 2 shows the essential attributes of the BAS process model 174
including the appropriated operational variables and its constraints and bounds for the 175
secondary settler tank and for the AS reactor apply in the present work. These suitable 176
operational variables are included due to operational consistencies (Espírito Santo et al. 177
2013) even though other authors can point out lightly different values (Henze 2008; Hreiz 178
et al. 2015a; van Haandel and van der Lubbe 2015). 179
3. Optimization methodology 180
The complexity for simultaneous reduction of operational costs, reduction of the amount 181
of pollutants discharged into sewer together with reduction of sludge generated, and the 182
requirement of a technically well-operated full-scale wastewater plant have motivated 183
this paper. Furthermore, this optimization process involves some other challenges such 184
as, i) high number of (non-linear) equations and variables, and ii) dynamic and spatial 185
distribution of the components into the length of the biofilm of the MBBR rectors. 186
The optimization methodology to fulfil the proposed objectives is divided into four 187
consecutive steps detailed in the following sections. This approach simplifies the 188
convergence of the mathematical models and the determination of the initial points of the 189
variables. A detailed flowchart of the proposed optimization methodology and the relation 190
with the mathematical model is shown in Figure 2. 191
This methodology can be used for wastewater under nutrient limitations coming from 192
different industrial sector such as pulp and paper, petrochemical, pharmaceutical or food 193
(Bakos et al. 2016; Freedman et al. 2005; Gray 2004; Hussain et al. 2015) 194
9
195
Figure 2. Flowchart of the optimization methodology. 196
3.1. Generation of alternatives 197
Nutrients must be dosed into the influent to ensure the proper growth of the 198
microorganisms because the BAS process under-study treats high COD wastewater under 199

10
limited nutrient condition. The optimization methodology starts generating alternatives 200
by selecting one independent variable as additional constraint (Hreiz et al. 2015b). The 201
selected variable in this work is the nutrient dosage in the influent; this variable affects 202
the behaviour of MBBR reactors and the overall performance and cost of the BAS 203
process. Different intervals of the nutrient dosage are considered to generate several 204
alternatives depending on the precision degree required for the optimization process. 205
3.2. Simulation of the MBBR reactors (biofilm) until steady-state. 206
The mathematical model of the MBBR reactor previously developed by the authors 207
(Revilla et al. 2016b) allows the determination of the concentration of the components in 208
the reactor with time and the spatial distribution along the length of the biofilm. The AS 209
model used by the authors for the AS step is simpler than MBBR model since it is 210
modeled as a continuous stirred-tank (Revilla et al, 2016a). 211
The optimization methodology separates the BAS process into two stages: simulation of 212
the MBBR reactor and optimization of the rest of BAS process. The simulation stage 213
fulfils two aspects: i) solve a complex multi-species and multi-substrate biofilm and bulk 214
liquid MBBR model and ii) facilitates the determination of the initial points of the 215
variables for optimization process. 216
In the previous as well as in the present work, general chemical engineering process 217
software (Aspen Custom Modeler) is used to simulate the behaviour of MBBR reactors 218
since this software facilitates the creation of rigorous dynamic and spatial model. In this 219
second stage of the optimization, this MBBR model is used to simulate the behaviour of 220
the components for each alternative in the biofilm and in the reactor until steady-state. 221
Once the steady-state is reached, the MBBR results of each alternative are sent to third 222
stage of the methodology: optimization of the conditions of the BAS process. 223
11
3.3. Multicriteria optimization 224
Once MBBR behaviour is simulated until steady-state, the rest of the process is optimized 225
for each alternative using three different index as objective functions: total cost index, 226
effluent quality index or/and operating cost index as objective functions. The optimization 227
of the BAS process is done by the software General Algebraic Modeling System (GAMS) 228
using CONOPT as NLP algorithm (El Shorbagy et al. 2013). 229
3.3.1. Objective functions 230
Three indexes are used as objective functions to be minimized in the present work: 231
effluent quality index (EQI) that measure the presence of pollutant in the effluent, and 232
operating cost index (OCI), that evaluates operation expenses in the plant. An additional 233
index, the total cost index (TCI) linking effluent quality and operating cost indexes, is 234
considered as objective function by weighting method (Flores-Alsina et al. 2008). 235
Effluent quality index (EQI) 236
The effluent quality index (EQI) (Copp 2002; Foscoliano et al. 2016) quantifies into a 237
single term, the effluent pollution load into a receiving water body (kg pollution/day) 238
(Vanrolleghem and Gillot 2002). The discharged of different pollutants into the effluent 239
is considered as a weighted sum of six evaluation criteria: total Kjeldahl nitrogen (TKN), 240
COD, BOD, TSS, nitrate (NO) and total phosphorous (P). Equation 5 shows the weighted 241
sum of each evaluation criteria where Qe is the effluent flow rate. 242
EQI �Kg pollutionday
� = �20 × TKN � gm3� + 1 × COD � g
m3� + 2 × BOD � gm3� + 2 ×243
TSS � gm3� + 20 × NO � g
m3� + 100 × P ( gm3)� × Qe (m
3
day) × 10−3 (5) 244
245
12
Operating cost index (OCI) 246
The operating cost index (OCI) that is used as the economic objective function, is an 247
approximate measure of the plant's operational cost, involves the main operating costs, 248
such as power consumption by aerators, sludge production, pumping energy and nutrient 249
cost. The operating cost index (OCI) (equation 6) is calculated as the weighted sum of 250
aeration energy associated to the oxygen consumption for the carbonaceous demand 251
(CD), aeration energy associated to the oxygen consumption for the nitrogenous demand 252
(ND), mixing energy (ME), pumping energy (PE), sludge production (SP) and nutrient 253
cost (NC), using the weighting factors as Chen et al. 2015 and Zhou et al. 2015. 254
OCI (€/year) = 25 × (CD + ND + ME + PE) + 75 × SP + NC (6) 255
Total cost index (TCI) 256
Total cost index (TCI) is defined in equation 7 as the sum of the effluent quality index 257
and operating cost index optimized (Vanrolleghem and Gillot 2002; Kim et al. 2015). 258
TCI (€/year)=50 × EQI (Kg pollution/day) + OCI (€/year) (7) 259
Along the paper the values of EQI, OCI and TCI were calculated per m3 of wastewater 260
treated (Guerrero et al. 2011) in order to maintain the confidentiality of the industrial 261
effluent characterization. 262
3.4. Decision making process 263
The proposed optimization strategy produces one optimal solution for each alternative 264
and for each selected objective function. The variables included in the step 1 are related 265
to operational conditions that are essential to obtain a minimum AS performance process. 266
The last part of the methodology considers refinement conditions by including some 267

13
variables related to the biological processes to avoid risks of inefficiencies in the 268
downstream liquid-solid separation processes; these variables can be used as decision 269
making process. Even though most of the optimization models do not include priority 270
levels such as essential operational variables and refinement operation variables, the 271
incorporation of this type of prioritization allows extending the use of the methodology 272
under circumstances where refinement variables or bounds can be skipped. The AS and 273
clarifying units of the BAS process can run even without fulfilling the bounds of some of 274
these refinement conditions but, generally, fulfilling them improve the behaviour of the 275
BAS process. 276
The last unit of the BAS process is the separation of sludge from wastewater in the 277
secondary settler since most of the sludge is returned to AS tank while a minor part is 278
taken out to be wasted. The separation of the sludge depends on the microorganism 279
growing in large aggregate called flocs; however, the microorganisms do not always grow 280
in the adequate form leading to sludge separation problems. 281
Avoiding the risk of separation solid-liquid problems in the secondary settler and loss of 282
COD removal efficiency in the overall BAS process were selected as refinement o 283
decision making requirements (Comas et al. 2008; Flores-Alsina et al. 2009). In the 284
present work, these aspects have been tackled by considering some variables in the unit 285
models and by adapting the upper or lower limits of these variables to the wastewater and 286
process under study, as pointed out in the fourth step of Figure 2. 287
If after the decision making process none optimal conditions have been obtained it is 288
necessary to come back to step 1 (generation of alternatives) to extend the number of 289
alternatives or to come back to step 4 to extend the bounds of the decision-making 290
variables. 291

14
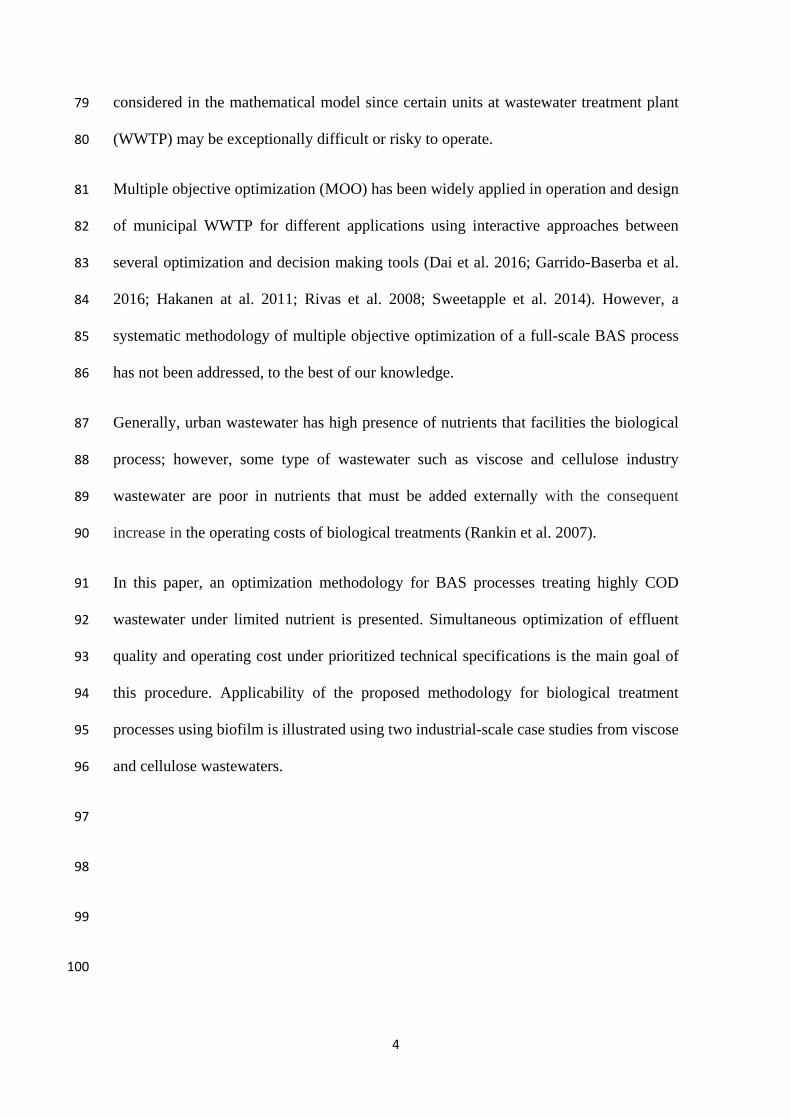
4. Industrial installation 292
Veolia have installed more than 90 BAS plants worldwide to treat wastewater from pulp 293
industry. In this work, the full-scale BAS process for biological COD removal consist of: 294
an equalization tank (1,600 m3), two MBBR reactors in-series (5,331 m3), an AS reactor 295
(47,000 m3), two parallel secondary settler tanks (volume 4,143 m3 and 1,017 m2 unit 296
surface area) and one splitter to recirculate part of the sludge and to disposal the remaining 297
part (Figure 3). The equalization tank is also used to dose nitrogen as urea (40% w/w) and 298
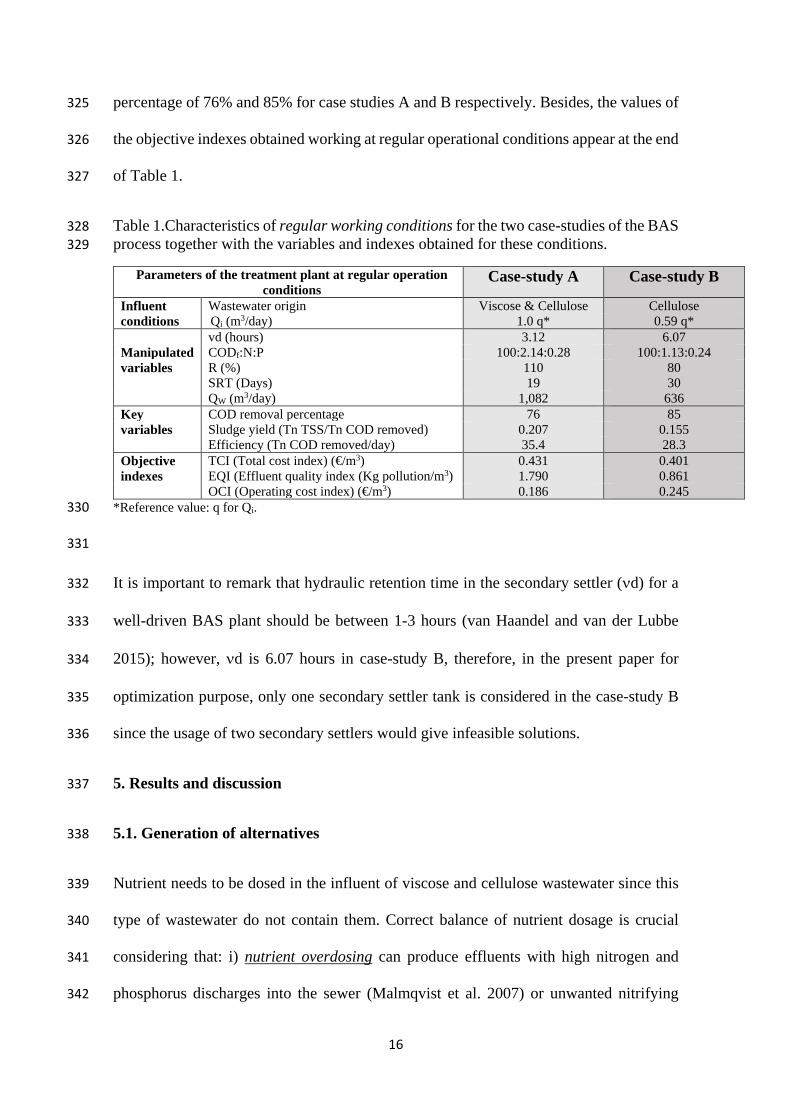
phosphorous as phosphoric acid (72%). The MBBR reactors were filled with carriers type 299
BiofilmChip P of Veolia´s AnoxKaldnes™ to 10% of volume. The aeration system in 300
MBBR reactors uses a blower of a unit air flow 31,600 Nm3/h for each MBBR reactor 301
and perforated tubes in the bottom of reactor to produce medium bubbles (3 mm of 302
diameter) with a high mixing capacity and medium oxygen transfer efficiency (16 %). 303
The aeration system of AS reactor uses one blowers of a unit air flow 31,600 Nm3/h and 304
diffusers of membrane to produce fine bubbles (1 mm of diameter) with a high mixing 305
capacity and high oxygen transfer efficiency (45.5 %). Due to the high oxygen transfer 306
efficiency in the AS reactor, the airflow supplied by the blower associated to the oxygen 307
consumption for the carbonaceous (CD) and nitrogenous demand (ND) is lower than in 308
the MBBR reactors resulting in a lower energy consumption (von Sperling 2007). 309

15
310
Figure 3. Flow sheet of the full-scale BAS process with detail of the manipulated variables 311
and criteria used to evaluate the objective functions. 312
313
The full-scale real BAS plant works under two different conditions (case-study A and B) 314
due to different industrial production requirements of the pulp integrated plant. The case-315
study A treats wastewater from viscose and cellulose industry and the case-study B treats 316
wastewater from cellulose industry. The regular operational conditions of the studied 317
industrial BAS process (Table 1) are based on the industrial heuristic knowledge. 318
The low values of nutrient dosage used in this work in comparison with the “thumb rule” 319
(100 COD:5 N:1 P) are explained by the large amounts of nutrients that are regenerated 320
in the AS reactor (Comeau et al. 2003) since the biomass is consumed by predator 321
microorganisms. 322
Table 1 additionally lists a summary of the main outlet stream characteristics obtained 323
working at these regular operational conditions that reach a high COD removal 324
16
percentage of 76% and 85% for case studies A and B respectively. Besides, the values of 325
the objective indexes obtained working at regular operational conditions appear at the end 326
of Table 1. 327
Table 1.Characteristics of regular working conditions for the two case-studies of the BAS 328 process together with the variables and indexes obtained for these conditions. 329
Parameters of the treatment plant at regular operation conditions
Case-study A Case-study B
Influent Wastewater origin Viscose & Cellulose Cellulose conditions Qi (m3/day) 1.0 q* 0.59 q* vd (hours) 3.12 6.07 Manipulated CODf:N:P 100:2.14:0.28 100:1.13:0.24 variables R (%) 110 80 SRT (Days) 19 30 QW (m3/day) 1,082 636 Key COD removal percentage 76 85 variables Sludge yield (Tn TSS/Tn COD removed) 0.207 0.155 Efficiency (Tn COD removed/day) 35.4 28.3 Objective TCI (Total cost index) (€/m3) 0.431 0.401 indexes EQI (Effluent quality index (Kg pollution/m3) 1.790 0.861 OCI (Operating cost index) (€/m3) 0.186 0.245
*Reference value: q for Qi. 330
331
It is important to remark that hydraulic retention time in the secondary settler (νd) for a 332
well-driven BAS plant should be between 1-3 hours (van Haandel and van der Lubbe 333
2015); however, νd is 6.07 hours in case-study B, therefore, in the present paper for 334
optimization purpose, only one secondary settler tank is considered in the case-study B 335
since the usage of two secondary settlers would give infeasible solutions. 336
5. Results and discussion 337
5.1. Generation of alternatives 338
Nutrient needs to be dosed in the influent of viscose and cellulose wastewater since this 339
type of wastewater do not contain them. Correct balance of nutrient dosage is crucial 340
considering that: i) nutrient overdosing can produce effluents with high nitrogen and 341
phosphorus discharges into the sewer (Malmqvist et al. 2007) or unwanted nitrifying 342
17
bacteria, which consume oxygen and generates additional liquid-solid separation problem 343
due to denitrification in secondary settler tanks (Henze 2008), ii) severe deficiency of 344
nutrient results in a loss of COD removal efficiency and bulking (van Haandel and van 345
der Lubbe 2015; Welander et al. 2002) and, iii) nutrient dosage also influences the sludge 346
production and reduction on dosage can result in growth limitation in the MBBR reactors 347
and a consequent reduction of the waste sludge production (Welander et al. 2002). 348
Nutrient dosage is incorporated in the mathematical model in order to generate a wide 349
number of alternatives. The dosage used in the regular operation condition is considered 350
the starting point for the generation of alternatives (100:2.14:0.28 for case study A and 351
100:1.13:0.24 for case-study B); and the alternatives are generated by decreasing nitrogen 352
and phosphorous dosage by 5% until the efficiency of the process (Tn de COD removed 353
by day) decreases more than 2.0% in relation to the regular operation conditions. In this 354
way, in case-study A, 17 different alternatives of nutrient dosage are generated until 355
nutrient dosage value of 100:0.34:0.06 and in case study B, 15 different alternatives are 356
generated until nutrient dosage value of 100:0.34:0.07. Alternatives generated are enough 357
for this study but higher number of alternatives can be easily considered if necessary when 358
the characteristics of the processes are particularly sensitive. 359
5.2. Simulation of the MBBR reactors until steady-state 360
The MBBR reactors of the treatment plant under-study are simulated using Aspen Custom 361
Modeler software to describe the dynamic and longitudinal behaviour of the reactors. The 362
generated alternatives with different nutrient dosage are simulated during 30 days until 363
steady-state is reached. Once steady-state is attained, the simulated results obtained at the 364
outlet stream of the second MBBR reactor are sent to optimization software to obtain the 365
optimal conditions of the remaining BAS process under-study. 366

18
5.3. Multicriteria optimization 367
The BAS process is optimized for each alternative minimizing total cost index, which 368
include operation cost and wastewater quality criteria. As one optimal solution is obtained 369
for each alternative, 15 and 17 optimal solutions are obtained for case-study A and B 370
respectively. In general, it is observed that the decrease of nutrient dosage has a big impact 371
on objective index. The TCI lowest score alternative occurs for the lowest nutrient 372
dosage: 100:0.34:0.06 and 100:0.34:0.07 for case-study A and B respectively (TCI=0.208 373
€/m3, TCI=0.244 €/m3). 374
Table 2 shows the optimal values of selected variables for the lowest score alternative 375
using TCI as objective function; the key characteristic of BAS process is the low sludge 376
yield (Tn TSS/ Tn CODf removed) without compromising treatment efficiency, and 377
therefore the sludge yield and efficiency appears as key variables. First of all, it is 378
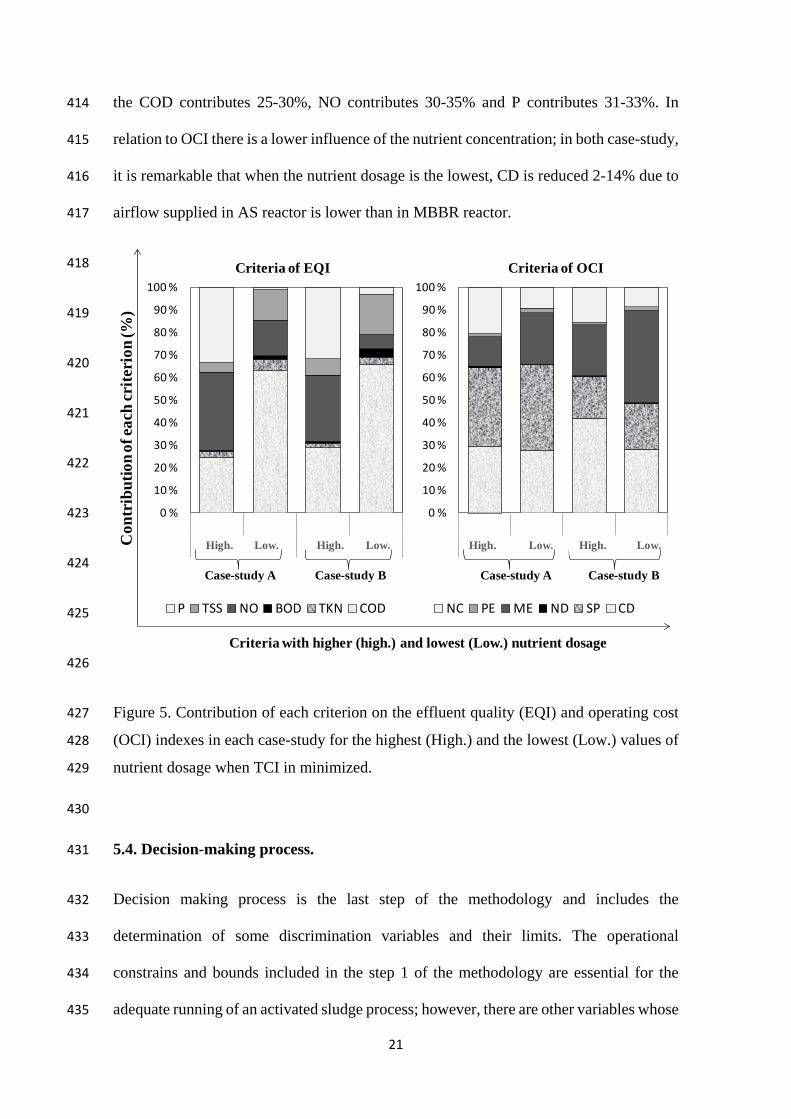
observed that the comparison between the key variables in Table 1 (regular operational 379
conditions) and Table 2 (optimal values using TCI as objective function) shows that the 380
optimal conditions decrease the sludge yield to the half respect to the regular operational 381
conditions (from 0.207 to 0.108 Tn TSS/Tn COD removed) and a little decrease of the 382
efficiency is also observed (from 35.4 to 34.5 Tn COD removed /day) for case-study A. 383
For case study B, similar decreases are observed for the best alternative: sludge yield from 384
0.155 to 0.082 and efficiency decrease from 28.3 to 27.9Tn COD removed /day. 385
386
387
388
389

19
Table 2. Optimal values of the operation conditions for the best alternative minimizing 390 total cost index (TCI) before and after the decision making process. 391
Variables and Index
Optimal solutions
Optimal values before decision making process
Optimal values after decision making process
Case study A
Case study B
Case study A
Case study B
Manipulated Variables CODf:N:P 100:0.34:0.06 100:0.34:0.07 100:0.54:0.07 100:0.45:0.10 QW (m3/day) 461 313 1.218 655 R (%) 109 82 109 82 Objective Indexes TCI (€/m3) 0.208 0.244 0.223 0.270 EQI (Kg pollution/m3) 0.684 0.541 0.680 0.593 OCI (€/m3) 0.114 0.170 0.130 0.189 Key variables Sludge yield (Tn TSS/Tn COD removed)
0.108 0.082 0.155 0.108
Efficiency (Tn COD removed/day)
34.5 27.9 35.4 28.3
Technical decision making variables SRT (days) 39 51 17 28 NO (g/m3) 5.4 1.8 7 3.8 TN (g/m3) 5.9 1.9 6.5 4 P (g/m3) 0.1 0.2 0.3 0.6
Value: Values that not fulfil the refine operation bounds. 392
Figure 4 shows in a box plot fashion the summary of effluent quality and operating cost 393
indexes for all studied alternatives when total cost index is minimized. The lowest values 394
of EQI and OCI correspond with the lowest nutrient dosage. Figure 4 also compares the 395
optimal results with the results of the regular operational conditions. It is observed that 396
for nearly all of the alternatives the operating cost and the effluent quality index values 397
are lower than the regular operational conditions in both case studies. 398

20
399
Figure 4. Box plots for the distribution of EQI and OCI indexes in case-study A (17 400
alternatives) and case-study B (15 alternatives) when TCI is minimized, and the 401
comparison with the results at the regular working conditions. 402
403
Figure 5 show the contribution of each particular criterion on the effluent quality (EQI) 404
and operating cost (OCI) indexes for the lowest and the highest values of nutrient dosage 405
when TCI in minimized. In general, the lower the nutrient dosage in the influent, the 406
lower QW is purged and higher SRT is obtained and consequently: i) less nitrogen and 407
phosphorous are discharged in the effluent and less nitrogen is available in the AS reactor 408
resulting in a decrease of nitrification rate and, therefore, less nitrogen is oxidized to 409
nitrate (NO) by autotrophic microorganisms and, ii) more TSS is discharged in effluent 410
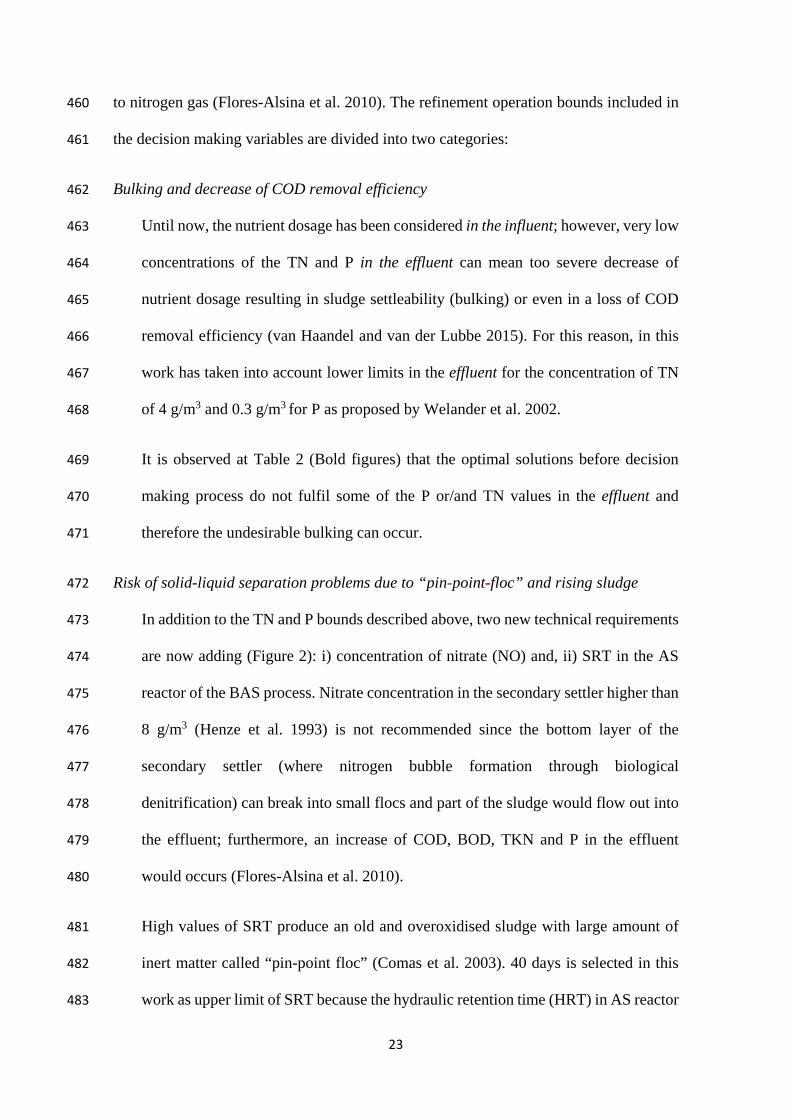
resulting in increase of COD and BOD. For these reasons, when the nutrient dosage is the 411
lowest, COD contributes up to 63% and 66 % of the pollution discharge in case-study A 412
and B respectively and NO contributes 7-16%. When the nutrient dosage is the highest, 413
0.10
0.12
0.14
0.16
0.18
0.20
0.22
0.24
0.26
0.28
Case-study A Case-study B
Kg
Pollu
tion/
m3
€/m
3
Case-studies
EQI (Kg pollution/m3) OCI (€/m3)
0.40
0.60
0.80
1.00
1.20
1.40
1.60
1.80
2.00
Case-study A Case-study B
Regular working conditions Regular working conditions
21
the COD contributes 25-30%, NO contributes 30-35% and P contributes 31-33%. In 414
relation to OCI there is a lower influence of the nutrient concentration; in both case-study, 415
it is remarkable that when the nutrient dosage is the lowest, CD is reduced 2-14% due to 416
airflow supplied in AS reactor is lower than in MBBR reactor. 417
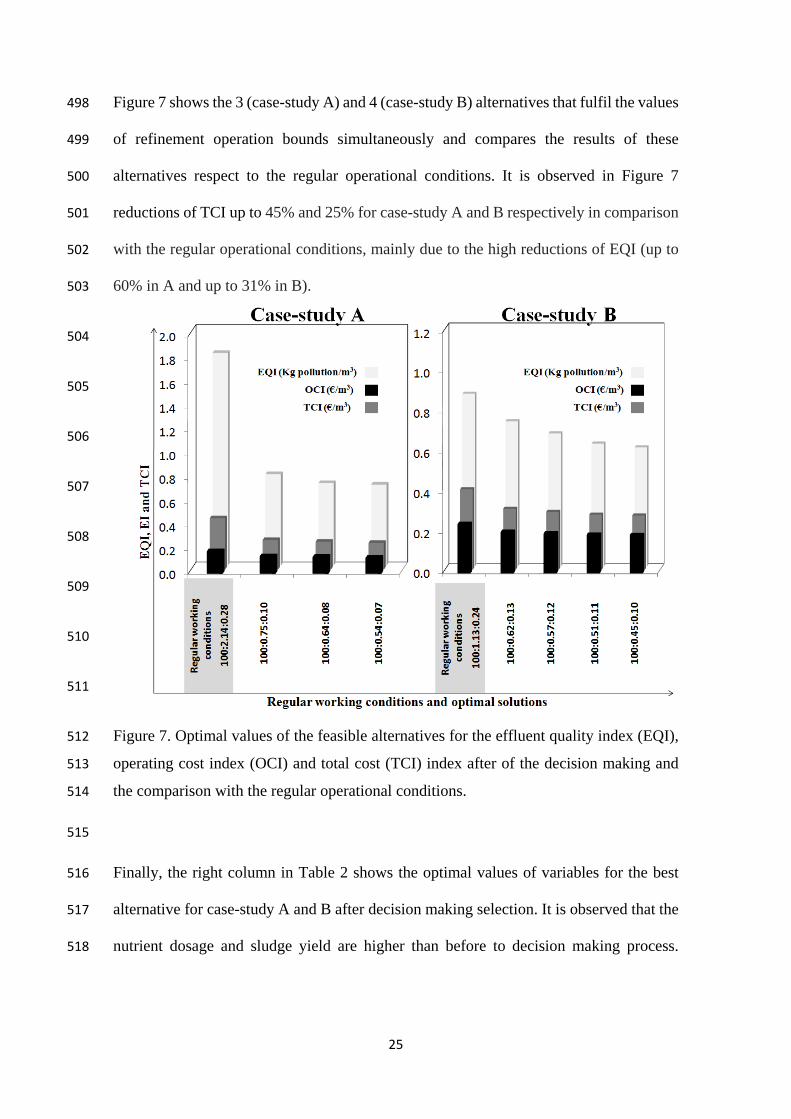
418
419
420
421
422
423
424
425
426
Figure 5. Contribution of each criterion on the effluent quality (EQI) and operating cost 427
(OCI) indexes in each case-study for the highest (High.) and the lowest (Low.) values of 428
nutrient dosage when TCI in minimized. 429
430
5.4. Decision-making process. 431
Decision making process is the last step of the methodology and includes the 432
determination of some discrimination variables and their limits. The operational 433
constrains and bounds included in the step 1 of the methodology are essential for the 434
adequate running of an activated sludge process; however, there are other variables whose 435
0 %
10 %
20 %
30 %
40 %
50 %
60 %
70 %
80 %
90 %
100 %
max. min. max. min.
Case A Case A Case B Case B
Criteria of OCI
NC PE ME ND SP CD
0 %
10 %
20 %
30 %
40 %
50 %
60 %
70 %
80 %
90 %
100 %
max. min. max. min.
Case A Case A Case B Case B
Criteria of EQI
P TSS NO BOD TKN COD
Con
trib
utio
nof
each
crite
rion
(%)
Criteria with higher (high.) and lowest (Low.) nutrient dosage
High. Low.
Case-study A
High. Low.
Case-study B
High. Low.
Case-study B
High. Low.
Case-study A

22
limits are recommendable but that nonetheless under diverse circumstances do not need 436
to be considered. At present there are more than 600 municipal or industrial Veolia 437
MBBR treatment plants in operation or under construction in more than 50 countries (van 438
Haandel and van der Lubbe 2015); some of these installations are used as pre-treatment 439
of activated sludge since MBBR is an upgrade to existing AS systems with little 440
disturbance but high efficiency. The diverse circumstances that can take places in each 441
installation support the idea of classifying the variables into essential and refinement. 442
The consideration of the refinement conditions in the decision making process of the 443
optimization methodology will help, a) to facilitate the trade-off among effluent quality 444
index, operating cost index and technical arrangement (Hakanen et al. 2013) and, b) to 445
obtain BAS process adapted to different operation circumstances, for example: low pH 446
wastewater, oversize installations, wastewater with different origin, low 447
Food/Microorganisms (F/M) ratio for AS process and excess of greases and oils among 448
others. 449
In the activated sludge process, the operational problems with biological origin are among 450
the most serious and most difficult matter to solve in wastewater treatment plants. Even 451
though the optimal conditions shown in Table 2 fulfil the appropriated operational 452
conditions for BAS process of Figure 2, in the refinement conditions three biological 453
aspects are pointed related with the growth of microorganism: i) “bulking” since too low 454
nutrient dosage can bring excessive growth of filamentous bacteria (van Haandel and van 455
der Lubbe 2015; Welander et al. 2002) that leads to solid-liquid separation problems 456
(Flores-Alsina et al. 2009), ii) “pin-point floc” due to the formation of the old and 457
overoxidised sludge produce by endogenous metabolism (Comas et al. 2003) and iii) 458
rising sludge due to denitrification in the secondary settler where nitrates are converted 459
23
to nitrogen gas (Flores-Alsina et al. 2010). The refinement operation bounds included in 460
the decision making variables are divided into two categories: 461
Bulking and decrease of COD removal efficiency 462
Until now, the nutrient dosage has been considered in the influent; however, very low 463
concentrations of the TN and P in the effluent can mean too severe decrease of 464
nutrient dosage resulting in sludge settleability (bulking) or even in a loss of COD 465
removal efficiency (van Haandel and van der Lubbe 2015). For this reason, in this 466
work has taken into account lower limits in the effluent for the concentration of TN 467
of 4 g/m3 and 0.3 g/m3 for P as proposed by Welander et al. 2002. 468
It is observed at Table 2 (Bold figures) that the optimal solutions before decision 469
making process do not fulfil some of the P or/and TN values in the effluent and 470
therefore the undesirable bulking can occur. 471
Risk of solid-liquid separation problems due to “pin-point-floc” and rising sludge 472
In addition to the TN and P bounds described above, two new technical requirements 473
are now adding (Figure 2): i) concentration of nitrate (NO) and, ii) SRT in the AS 474
reactor of the BAS process. Nitrate concentration in the secondary settler higher than 475
8 g/m3 (Henze et al. 1993) is not recommended since the bottom layer of the 476
secondary settler (where nitrogen bubble formation through biological 477
denitrification) can break into small flocs and part of the sludge would flow out into 478
the effluent; furthermore, an increase of COD, BOD, TKN and P in the effluent 479
would occurs (Flores-Alsina et al. 2010). 480
High values of SRT produce an old and overoxidised sludge with large amount of 481
inert matter called “pin-point floc” (Comas et al. 2003). 40 days is selected in this 482
work as upper limit of SRT because the hydraulic retention time (HRT) in AS reactor 483

24
is greater than 30 hours and it is considered an extended aeration tank which optimal 484
SRT value lower or equal to 40 days (Tchobanoglous et al. 2003). 485
Above described operational bounds of the effluent are included in step 4 of the 486
optimization methodology shown in Figure 2. Figure 6 shows the pareto graph between 487
the sludge yield and TCI index values for all alternatives before (red symbols) and after 488
the decision making process (green symbols) as well as the regular operational conditions 489
(black and brown symbols). It is observed that in both case-studies the minimum values 490
of TCI and sludge yield agree but only few alternatives (green symbols) fulfil the 491
refinement bounds. 492
493
Figure 6. Pareto graph between sludge yield and TCI index values before decision making 494
process in Case Study A ( ) and B ( ) and after the decision making process in Case 495
Study A ( ) and B ( ). The regular operational conditions are represented in Case Study 496
A ( ) and Case Study B ( ). 497
25
Figure 7 shows the 3 (case-study A) and 4 (case-study B) alternatives that fulfil the values 498
of refinement operation bounds simultaneously and compares the results of these 499
alternatives respect to the regular operational conditions. It is observed in Figure 7 500
reductions of TCI up to 45% and 25% for case-study A and B respectively in comparison 501
with the regular operational conditions, mainly due to the high reductions of EQI (up to 502
60% in A and up to 31% in B). 503
504
505
506
507
508
509
510
511
Figure 7. Optimal values of the feasible alternatives for the effluent quality index (EQI), 512
operating cost index (OCI) and total cost (TCI) index after of the decision making and 513
the comparison with the regular operational conditions. 514
515
Finally, the right column in Table 2 shows the optimal values of variables for the best 516
alternative for case-study A and B after decision making selection. It is observed that the 517
nutrient dosage and sludge yield are higher than before to decision making process. 518
26
Besides, the sludge yields in Table 2 are inside the range of others studies as such as 519
Malmqvist et al. 2007 and Rankin et al. 2007. 520
The application of the proposed methodology allows a reduction of the operating cost of 521
treatment (€/m3) up to 30% whereas the efficiency (Tn COD removed per day) do not 522
decrease respect to the regular operational conditions used in the full-scale wastewater 523
plant. Furthermore, the quality of the wastewater is also much better since the EQI (Kg 524
pollution/m3) is reduced up to 62%. 525
In Figure 8, the different contributions of each evaluation criterion for the best alternative 526
are shown. The major contribution to effluent quality index (EQI) is the COD (21 % in 527
case-study A and 17 % in case-study B), since the contribution of NO and P are reduced 528
in comparison to regular operational conditions due to low nutrient dosage. Respect to 529
the major contribution to operation cost index (OCI) after decision making is the energy 530
consumption for carbonaceous demand (CD) (21% in case-study A and 28 % in case-531
study B) due to the BAS process in this work was designed to the high removal of COD 532
in aerobic conditions (Revilla et al. 2016a); moreover, a large decrease in the nutrient cost 533
(NC) is observed compared to regular operational conditions. 534

27
535
Figure 8. Contribution of evaluation criteria on the total cost index (TCI) of the optimal 536
solution compared to the regular operational conditions. 537
5. Conclusions 538
This paper presents a methodology that allows obtaining the optimal operational 539
conditions for an industrial BAS plant treating highly COD wastewater under limited 540
nutrient conditions. The methodology formulates BAS process as a mathematical 541
optimization problem combining economic and environmental criteria as objective 542
function and overtakes some challenges such as high number of (non-linear) equations 543
and variables and the dynamic and spatial distribution behaviour of components into the 544
biofilm. The optimization methodology is divided into four consecutive steps: i) 545
generation of alternatives, ii) simulation of the MBBR reactors (biofilm) until steady-546
state, iii) multicriteria optimization and iv) decision making process. The optimization 547
methodology establishes priority levels of several technical specifications (essential and 548
refinement variables) related with the activated sludge tank and secondary clarifiers. 549
0 %
10 %
20 %
30 %
40 %
50 %
60 %
CD ND ME PE SP NC COD TKNDBO NO TSS P0 %
10 %
20 %
30 %
40 %
50 %
60 %
CD ND ME PE SP NC COD TKNDBO NO TSS P
Optimal solution
Regular working conditions
Optimal solution
Case-study A Case-study B
Evaluation criteria
Con
trib
utio
nof
each
crite
rion
onT
CI (
%)
Regular working conditions

28
The application of this methodology at two industrial-scale case studies from viscose and 550
cellulose wastewaters allows a reduction of quantity of pollutants per m3 wastewater 551
treated up to 60% and a reduction of the operating costs (€/m3) up to 30% in comparison 552
with the regular operational conditions used in the industrial BAS wastewater plant. 553
Acknowledgements 554
The authors would like to thank SNIACE Company for their help and support during the 555
wastewater sampling and characterization at industrial plant. 556
557
6. References 558
Amanatidou, E., Samiotis, G., Trikoilidou, E., Pekridis, G., & Taousanidis, N. (2015a). 559
Evaluating sedimentation problems in activated sludge treatment plants operating at 560
complete sludge retention time. Water Research, 69, 20–29. 561
doi:10.1016/j.watres.2014.10.061 562
Amanatidou E., Samiotis G., Bellos D., & Pekridis G. (2015b). Net biomass production 563
under complete solids retention in high organic load activated sludge process. 564
Bioresource Technology,182, 492–502. 565
Bakos, V., Kiss, B.,& Jobbágy, A. (2016). Problems and causes of marginal nutrient 566
availability in winery wastewater treatment. Acta Alimentaria, 45(4), 532–541. 567
Chen, W., Lu, X., & Yao, C. (2015). Optimal strategies evaluated by multi-objective 568
optimization method for improving the performance of a novel cycle operating 569
activated sludge process. Chemical Engineering Journal, 260, 492–502. 570
doi:10.1016/j.cej.2014.08.087 571
29
Comas, J., Rodríguez-Roda, I., Gernaey, K. V., Rosen, C., Jeppsson, U., & Poch, M. 572
(2008). Risk assessment modelling of microbiology-related solids separation 573
problems in activated sludge systems. Environmental Modelling and Software, 574
23(10–11), 1250–1261. doi:10.1016/j.envsoft.2008.02.013 575
Comas, J., Rodríguez-Roda, I., Sànchez-Marrè, M., Cortés, U., Freixó, A., Arráez, J., & 576
Poch, M. (2003). A knowledge-based approach to the deflocculation problem: 577
Integrating on-line, off-line, and heuristic information. Water Research, 37(10), 578
2377–2387. doi:10.1016/S0043-1354(03)00018-6 579
Comeau, Y., Peteesen, B., Stuart, P., Perkier, M., Graff, S., & Asselin, C. (2003). 580
Activated sludge yield reduction by the low sludge production (LSP) process results 581
are promising. Pulp and Paper Canada, 104(8), 40–42. 582
Copp, J.B., (2002). The COST simulation benchmark. Description and simulator manual, 583
Office for Official Publications of the European Communities, Luxembourg. 584
Dai, H., Chen, W., & Lu, X. (2016). The application of multi-objective optimization 585
method for activated sludge process: A review. Water Science and Technology, 586
73(2), 223–235. doi:10.2166/wst.2015.489 587
Descoins, N., Deleris, S., Lestienne, R., Trouvé, E., & Maréchal, F. (2012). Energy 588
efficiency in waste water treatments plants: Optimization of activated sludge process 589
coupled with anaerobic digestion. Energy, 41(1), 153–164. 590
doi:10.1016/j.energy.2011.03.078 591
El Shorbagy, W., Nabil, N., & Droste, R. L. (2013). Optimization of A20 BNR Processes 592
Using ASM and EAWAG Models: Model Performance, Water Environment 593
Research. 85 (12) 2271-2284 doi:10.2175/106143013X13596524517102 594

30
Espírito Santo, I. A. C. P., Costa, L., & Fernandes, E. M. G. P. (2013). On optimizing a 595
WWTP design using multi-objective approaches. Engineering Letters, 21(4), 193–596
202. 597
Fan, C., Kao, C. F., & Liu, Y. H. (2017). Quantitative characterization of organic 598
diffusion using an analytical diffusion-reaction model and its application to 599
assessing BOD removal when treating municipal wastewater in a plug flow reactor. 600
Water Research, 121, 329–337. doi:10.1016/j.watres.2017.05.050 601
Flores-Alsina, X., Comas, J., Rodriguez-Roda, I., Gernaey, K. V., & Rosen, C. (2009). 602
Including the effects of filamentous bulking sludge during the simulation of 603
wastewater treatment plants using a risk assessment model. Water Research, 43(18), 604
4527–4538. doi:10.1016/j.watres.2009.07.033 605
Flores-Alsina, X., Gallego, A., Feijoo, G., & Rodriguez-Roda, I. (2010). Multiple-606
objective evaluation of wastewater treatment plant control alternatives. Journal of 607
Environmental Management, 91(5), 1193–1201. 608
doi:10.1016/j.jenvman.2010.01.009 609
Flores-Alsina, X., Rodríguez-Roda, I., Sin, G., & Gernaey, K. V. (2008). Multi-criteria 610
evaluation of wastewater treatment plant control strategies under uncertainty. Water 611
Research, 42(17), 4485–4497. doi:10.1016/j.watres.2008.05.029 612
Foscoliano, C., Del Vigo, S., Mulas, M., Tronci, S., (2016). Predictive control of an 613
activated sludge process for long term operation. Chemical Engineering Journal, 614
304, 1031-1044. 615
Freedman, D. L., Payauys, A. M., & Karanfil, T. (2005). The effect of nutrient deficiency 616
on removal of organic solvents from textile manufacturing wastewater during 617
31
activated sludge treatment. Environmental Technology, 26(2), 179–188. 618
doi:10.1080/09593332608618570 619
Garrido-Baserba, M., Reif, R., Molinos-Senante, M., Larrea, L., Castillo, A., Verdaguer, 620
M., & Poch, M. (2016). Application of a multi-criteria decision model to select of 621
design choices for WWTPs. Clean Technologies and Environmental Policy, 18(4), 622
1097–1109. doi:10.1007/s10098-016-1099-x 623
Gray, N.F. (2004). Biology of wastewater treatment. 2ndedition. World Scientific. Dublin. 624
Guerrero, J., Guisasola, A., Vilanova, R., & Baeza, J. A. (2011). Improving the 625
performance of a WWTP control system by model-based setpoint optimisation. 626
Environmental Modelling and Software, 26(4), 492–497. 627
doi:10.1016/j.envsoft.2010.10.012 628
Hakanen, J., Miettinen, K.,& Sahlstedt, K. (2011). Wastewater treatment: New 629
perspectives provided by interactive multiobjective. Decission Supoort System, 630
51(328), 337. 631
Hakanen, J., Sahlstedt, K., & Miettinen, K. (2013). Wastewater treatment plant design 632
and operation under multiple conflicting objective functions. Environmental 633
Modelling & Software, 46, 240–249. doi:10.1016/j.envsoft.2013.03.016 634
Henze, M. (2008). Modeling of Aerobic Wastewater Treatment Processes. In 635
Biotechnology (Vol. 11–12, pp. 417–427). Wiley. 636
doi:10.1002/9783527620999.ch20l 637
Henze, M., Dupont, R., Grau, P., & de la Sota, A. (1993). Rising sludge in secondary 638
settlers due to denitrification. Water Research, 27(2), 231–236. doi:10.1016/0043-639
1354(93)90080-2 640
32
Hreiz, R., Latifi, M. A., & Roche, N. (2015a). Optimal design and operation of activated 641
sludge processes: State-of-the-art. Chemical Engineering Journal, 281, 900–920. 642
doi:10.1016/j.cej.2015.06.125 643
Hreiz, R., Roche, N., Benyahia, B., & Latifi, M. A. (2015b). Chemical Engineering 644
Research and Design Multi-objective optimal control of small-size wastewater 645
treatment plants. Chemical Engineering Research and Design, 102, 345–353. 646
doi:10.1016/j.cherd.2015.06.039 647
Hussain, A., Kumar, P., &Mehrotra, I. (2015). Nitrogen and phosphorus requirement in 648
anaerobic process: A review. Environmental Engineering and Management Journal, 649
14(4), 769–780. 650
Kamali, M., & Khodaparast, Z. (2015). Review on recent developments on pulp and paper 651
mill wastewater treatment. Ecotoxicology and Environmental Safety, 114, 326–342. 652
doi:10.1016/j.ecoenv.2014.05.005 653
Kim, M., Kim, M-J., Pyo, S-H., Lee, S-C., Ghorbannezhad, P., Foo, D.C.Y., Yoo, C-K., 654
(2015). Greenhouse emission pinch analysis (GEPA) for evaluation of emission 655
reduction strategies, Clean Technology and Environmental Policy 18(5), 1381-1389. 656
Li, B., Qiu, Y., Zhang, C., Chen, L., & Shi, H. (2016). Understanding biofilm diffusion 657
profiles and microbial activities to optimize integrated fixed-film activated sludge 658
process. Chemical Engineering Journal, 302, 269–277. 659
doi:10.1016/j.cej.2016.05.048 660
Malmqvist, Å., Welander, T., &Olsson, L. E. (2007). Long term experience with the 661
nutrient limited BAS process for treatment of forest industry wastewaters. Water 662
Science and Technology, 55(6), 89–97. 663

33
Rankin, A., Aert, M. V. A. N., & Welander, T. (2007). Low sludge yield biofilm activated 664
sludge ( BAS ) upgrade – Quesnel River Pulp. Tappi Journal, 6(5), 17–22. 665
Revilla, M., Galán, B., & Viguri, J. R. (2016a). Analysis and modelling of predation on 666
biofilm activated sludge process: Influence on microbial distribution, sludge 667
production and nutrient dosage. Bioresource Technology, 220, 572–583. 668
doi:10.1016/j.biortech.2016.08.107 669
Revilla, M., Galán, B., & Viguri, J. R. (2016b). An integrated mathematical model for 670
chemical oxygen demand (COD) removal in moving bed biofilm reactors (MBBR) 671
including predation and hydrolysis. Water Research, 98, 84–97. 672
doi:10.1016/j.watres.2016.04.003 673
Rivas, A., Irizar, I., & Ayesa, E. (2008). Model-based optimisation of Wastewater 674
Treatment Plants design. Environmental Modelling and Software, 23(4), 435–450. 675
doi:10.1016/j.envsoft.2007.06.009 676
Sointio, J., Rankin, A., &van Aert, M. (2006). Biofilm Activated Sludge process at 677
Quesnel River Pulp installation. Environmental Science & Engineering Magazine. 678
22-24. 679
Sweetapple, C., Fu, G., & Butler, D. (2014). Multi-Objective Optimisation of Wastewater 680
Treatment Plant Control to Reduce Greenhouse Gas Emissions. Water 681
Research,55(0), 52–62. doi:10.1016/j.watres.2014.02.018 682
Tchobanoglous, G., Burton, F.L., &Stensel, H.D. (2003). Wastewater Engineering: 683
Treatment and Reuse. McGrawHill Education. 684
van Haandel, A.,& van der Lubbe, J. (2015). Handbook of biological wastewater 685
treatment. (I. Publications, Ed.). 686
34
Vanrolleghem, P.A., &Gillot, S. (2002). Robustness and economic measures as control 687
benchmark performance criteria. Water Science and Technology, 45(4–5), 117–126. 688
von Sperling, M. (2007). Activated sludge and aerobic biofilm reactors. IWA publishing. 689
doi:10.2166/9781780402123. 690
Welander T. Olsson LE, & Fasth C. (2002). Nutrient-limited biofilm pretreatment: an 691
efficient way to upgrade activated sludge plants. Tappi Journal, 1(4), 20-26. 692
Zhou, Z., Shen, X., Jiang, L. M., Wu, Z., Wang, Z., Ren, W., & Hu, D. (2015). Modeling 693
of multimode anaerobic/anoxic/aerobic wastewater treatment process at low 694
temperature for process optimization. Chemical Engineering Journal, 281, 644–650. 695
doi:10.1016/j.cej.2015.07.017 696
697
Related Documents