Applied and Computational Mechanics 8 (2014) 47–62 Optimization methodology for beam gauges of the bus body for weight reduction R. Jain a,∗ , P. Tandon a , M. Vasantha Kumar b a Mechanical Engineering Discipline, PDPMIndian Institute of Information Technology, Design and Manufacturing Jabalpur Jabalpur-482005, Madhya Pradesh, India b Altair Engineering, Bengaluru, India Received 13 November 2013; received in revised form 26 June 2014 Abstract During service, a bus is subjected to various loads that cause stresses, vibrations and noise in the different compo- nents of its structure. It requires appropriate strength, stiffness and fatigue properties of the components to be able to stand these loads. Besides, quality and optimum weight of the vehicle, for efficient energy consumption, safety and provision of the comfort to the user are highly desired. The present work proposes a methodology to minimize the bus weight by modifying its beam gauges to optimum thickness. The bus performance is evaluated by multiple iterations on the basis of parameters like frequency, distortion, stress and stiffness. The algorithm performs gauge optimization of the bus by analyzing and satisfying its structural strength through linear static analysis on a laden bus. It also performs structural stiffness analysis and vibration analysis for safety of the bus structure. This work unfolds an integrated methodology to the bus manufacturers to optimize the structural weight for improving the fuel efficiency, static and dynamic safety, and robust design. The work is implemented by creating a finite element model of the bus and optimizing in HyperWorks environment. The results are verified for a full length 11 m, 65 seats bus. The methodology helps in weight reduction along with improvement in performance parameters. c 2014 University of West Bohemia. All rights reserved. Keywords: bus body, gauge optimization, weight reduction, linear static analysis, stiffness, vibration analysis 1. Introduction Due to recent advancements in technologies and need for a sustainable environment, the latest trend in automobile industry is towards development of light weight vehicles for reduced gas emissions and better fuel economy. It is either done by optimizing the existing auto body struc- ture using advanced computational techniques or foraying into design improvements. Innova- tions in existing designs are profitable in comparison to new product designs due to existence of established manufacturing and production units, and acceptability by the market. Thus, the aim of this work is to reduce the weight of the bus structure by optimizing the beam thick- nesses, achieving in process, environmental and manufacturing benefits, without compromising the structural performance. Computer Aided Engineering (CAE) analysis, if done prior to fabrication of the product, is a time and cost saving tool in product design cycle. For engineering products, it is executed at earlier phases of design, after conceiving the concept designs in CAD environment. The CAE analysis done in this research is based on Finite Element Analysis (FEA), assisted by well-advanced HyperWorks software tools such as HyperMesh for pre-processing, Optistruct ∗ Corresponding author. Tel.: +91 78 79 171 555, e-mail: [email protected]. 47

Welcome message from author
This document is posted to help you gain knowledge. Please leave a comment to let me know what you think about it! Share it to your friends and learn new things together.
Transcript
Applied and Computational Mechanics 8 (2014) 47–62
Optimization methodology for beam gaugesof the bus body for weight reduction
R. Jaina,∗, P. Tandona, M. Vasantha Kumarb
aMechanical Engineering Discipline, PDPM Indian Institute of Information Technology, Design and Manufacturing JabalpurJabalpur-482005, Madhya Pradesh, IndiabAltair Engineering, Bengaluru, India
Received 13 November 2013; received in revised form 26 June 2014
Abstract
During service, a bus is subjected to various loads that cause stresses, vibrations and noise in the different compo-nents of its structure. It requires appropriate strength, stiffness and fatigue properties of the components to be ableto stand these loads. Besides, quality and optimum weight of the vehicle, for efficient energy consumption, safetyand provision of the comfort to the user are highly desired. The present work proposes a methodology to minimizethe bus weight by modifying its beam gauges to optimum thickness. The bus performance is evaluated by multipleiterations on the basis of parameters like frequency, distortion, stress and stiffness. The algorithm performs gaugeoptimization of the bus by analyzing and satisfying its structural strength through linear static analysis on a ladenbus. It also performs structural stiffness analysis and vibration analysis for safety of the bus structure. This workunfolds an integrated methodology to the bus manufacturers to optimize the structural weight for improving thefuel efficiency, static and dynamic safety, and robust design. The work is implemented by creating a finite elementmodel of the bus and optimizing in HyperWorks environment. The results are verified for a full length 11 m, 65seats bus. The methodology helps in weight reduction along with improvement in performance parameters.c© 2014 University of West Bohemia. All rights reserved.
Keywords: bus body, gauge optimization, weight reduction, linear static analysis, stiffness, vibration analysis
1. Introduction
Due to recent advancements in technologies and need for a sustainable environment, the latesttrend in automobile industry is towards development of light weight vehicles for reduced gasemissions and better fuel economy. It is either done by optimizing the existing auto body struc-ture using advanced computational techniques or foraying into design improvements. Innova-tions in existing designs are profitable in comparison to new product designs due to existenceof established manufacturing and production units, and acceptability by the market. Thus, theaim of this work is to reduce the weight of the bus structure by optimizing the beam thick-nesses, achieving in process, environmental and manufacturing benefits, without compromisingthe structural performance.
Computer Aided Engineering (CAE) analysis, if done prior to fabrication of the product, isa time and cost saving tool in product design cycle. For engineering products, it is executedat earlier phases of design, after conceiving the concept designs in CAD environment. TheCAE analysis done in this research is based on Finite Element Analysis (FEA), assisted bywell-advanced HyperWorks software tools such as HyperMesh for pre-processing, Optistruct
∗Corresponding author. Tel.: +91 78 79 171 555, e-mail: [email protected].
47

R. Jain et al. / Applied and Computational Mechanics 8 (2014) 47–62
for structural analysis and optimization, and HyperView for post-processing and result visual-ization.
Optimization techniques applied for structural design is a major research area to reduce theweight of vehicles and form refinement. The performance of the bus is estimated by linear staticanalysis [5, 9], evaluating the strength and deformation of the bus structure when subjected toservice loads while the bus is on road. Many times, the structure of the bus body is designedthat is sufficiently strong yet unsatisfactory due to insufficient stiffness. Designing for accept-able stiffness [3, 11, 19] is, therefore, often more critical than designing for sufficient strength.Dynamic analysis [2, 9, 16] of the structure is a concern for the safety of the structure and itis performed to evaluate the natural frequency and mode shapes of the structure. These anal-ysis setups facilitate an iterative optimization [12, 14, 16], proving the performance criteria forthe converged design solution of the bus to be reasonable under bending, torsion, buckling anddynamic loads. The design solution satisfies all the manufacturing and weight constraints andenhances performance in terms of mass, stiffness, frequency and deformation.
The primary objective of this work is to reduce the weight of passenger bus without com-promising the performance of the vehicle; and if possible enhancing the structural performanceof the bus body through employing FEA, structural analysis and optimization techniques tooptimize beams of the bus.
2. Methodology
To optimize the bus body, an analytical study of the requirement is done and based on that, thefollowing methodology is proposed, Fig. 1.
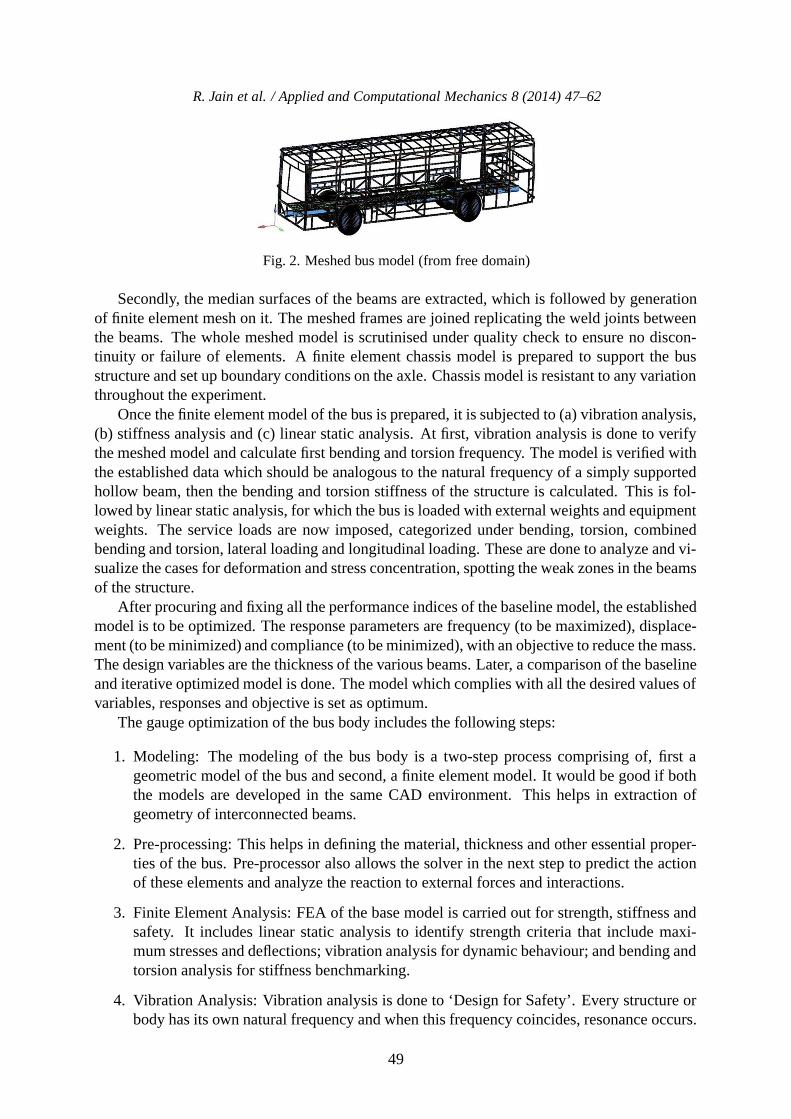
From the meshed model shown in Fig. 2, the geometrical model has to be extracted. Thus,the first step is to import the geometrical model of the bus from the free domain to the desiredCAD environment or model it from scratch, which is a tedious task. The geometry of the busbody is divided into six frames, i.e., top, bottom, two sides, rear and front, for the ease ofhandling.
Fig. 1. Proposed algorithm
48
R. Jain et al. / Applied and Computational Mechanics 8 (2014) 47–62
Fig. 2. Meshed bus model (from free domain)
Secondly, the median surfaces of the beams are extracted, which is followed by generationof finite element mesh on it. The meshed frames are joined replicating the weld joints betweenthe beams. The whole meshed model is scrutinised under quality check to ensure no discon-tinuity or failure of elements. A finite element chassis model is prepared to support the busstructure and set up boundary conditions on the axle. Chassis model is resistant to any variationthroughout the experiment.
Once the finite element model of the bus is prepared, it is subjected to (a) vibration analysis,(b) stiffness analysis and (c) linear static analysis. At first, vibration analysis is done to verifythe meshed model and calculate first bending and torsion frequency. The model is verified withthe established data which should be analogous to the natural frequency of a simply supportedhollow beam, then the bending and torsion stiffness of the structure is calculated. This is fol-lowed by linear static analysis, for which the bus is loaded with external weights and equipmentweights. The service loads are now imposed, categorized under bending, torsion, combinedbending and torsion, lateral loading and longitudinal loading. These are done to analyze and vi-sualize the cases for deformation and stress concentration, spotting the weak zones in the beamsof the structure.
After procuring and fixing all the performance indices of the baseline model, the establishedmodel is to be optimized. The response parameters are frequency (to be maximized), displace-ment (to be minimized) and compliance (to be minimized), with an objective to reduce the mass.The design variables are the thickness of the various beams. Later, a comparison of the baselineand iterative optimized model is done. The model which complies with all the desired values ofvariables, responses and objective is set as optimum.
The gauge optimization of the bus body includes the following steps:
1. Modeling: The modeling of the bus body is a two-step process comprising of, first ageometric model of the bus and second, a finite element model. It would be good if boththe models are developed in the same CAD environment. This helps in extraction ofgeometry of interconnected beams.
2. Pre-processing: This helps in defining the material, thickness and other essential proper-ties of the bus. Pre-processor also allows the solver in the next step to predict the actionof these elements and analyze the reaction to external forces and interactions.
3. Finite Element Analysis: FEA of the base model is carried out for strength, stiffness andsafety. It includes linear static analysis to identify strength criteria that include maxi-mum stresses and deflections; vibration analysis for dynamic behaviour; and bending andtorsion analysis for stiffness benchmarking.
4. Vibration Analysis: Vibration analysis is done to ‘Design for Safety’. Every structure orbody has its own natural frequency and when this frequency coincides, resonance occurs.
49
R. Jain et al. / Applied and Computational Mechanics 8 (2014) 47–62
To prevent resonance, the natural frequency of the bus has to be high so that its frequencydoes not coincide with natural frequency of human, humps, engine vibration and otherparts.
5. Stiffness analysis: The bending stiffness and torsion stiffness accounts for the overallstrength of the bus structure. To evaluate the baseline stiffness of the bus, the structure isassumed to be a beam and its deformation on application of forces depends on its stiffness.
6. Optimization: In this work, structural optimization in the form of topology, shape andsize are carried out. All three have a purpose in the design phase and the choice orcombination depends on desirables. The purpose of parameter optimization is to find theminimum thickness of the inter-related beams to minimize the weight.
The basic idea of gauge and size optimization is to modify gauge properties so that theresidual structure evolves towards an optimum solution. Gauge optimization [12] is a particularform of size optimization where design variables ti are in the form of 2D shell elements only.
The element property p is derived as a function of design variable and constants, i.e., p =f(DVj, Cj), where DVj is design variable and Cj is constant. The responses to be evaluatedfor optimum sizing of beam gauges [2, 6] would be done by iterative optimization to increasefrequency on modal and decrease displacement on linear static analysis setups.
3. Implementation
In this work, the implementation of the proposed methodology is carried out with HyperWorkssuite taking help from [10, 11, 15]. The HyperMesh interface facilitates both geometric mod-elling as well as the pre-processing of the model. FEA and gauge optimization of the busstructure is done with Radioss as solver. After solving and retrieving the results, visualizationof the results of the analysis is supported by HyperView.
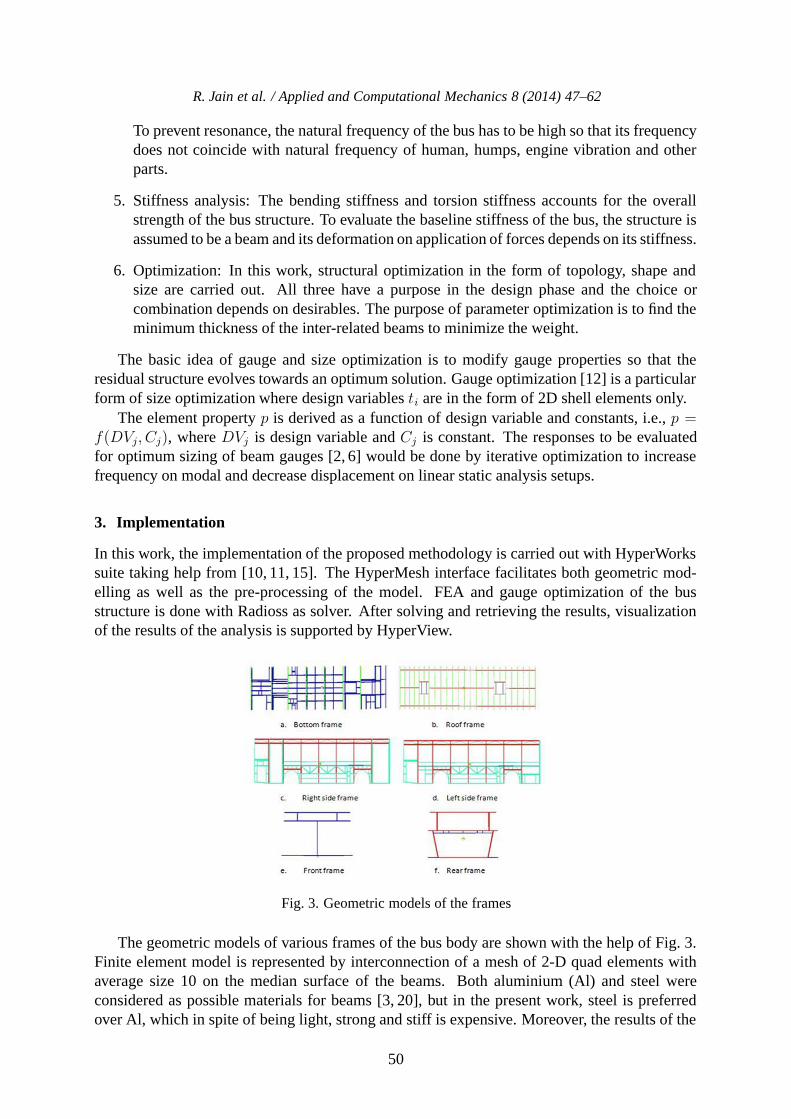
Fig. 3. Geometric models of the frames
The geometric models of various frames of the bus body are shown with the help of Fig. 3.Finite element model is represented by interconnection of a mesh of 2-D quad elements withaverage size 10 on the median surface of the beams. Both aluminium (Al) and steel wereconsidered as possible materials for beams [3, 20], but in the present work, steel is preferredover Al, which in spite of being light, strong and stiff is expensive. Moreover, the results of the
50
R. Jain et al. / Applied and Computational Mechanics 8 (2014) 47–62
Table 1. Material properties
Element type 2D shell Beam
Material Steel (IS:4923) High strength steelYoung’s modulus 2.1 · 105 MPa 2.1 · 1010 MPaPoisson’s ratio ν 0.300 0.300Modulus of rigidity G 8.1 · 104 MPa 8.1 · 109 MPaDensity 7.9 · 10−9 N ·mm−3 7.9 · 10−9 N ·mm−3
bus body made of steel can be validated through the published data. The material properties aredefined in Table 1.
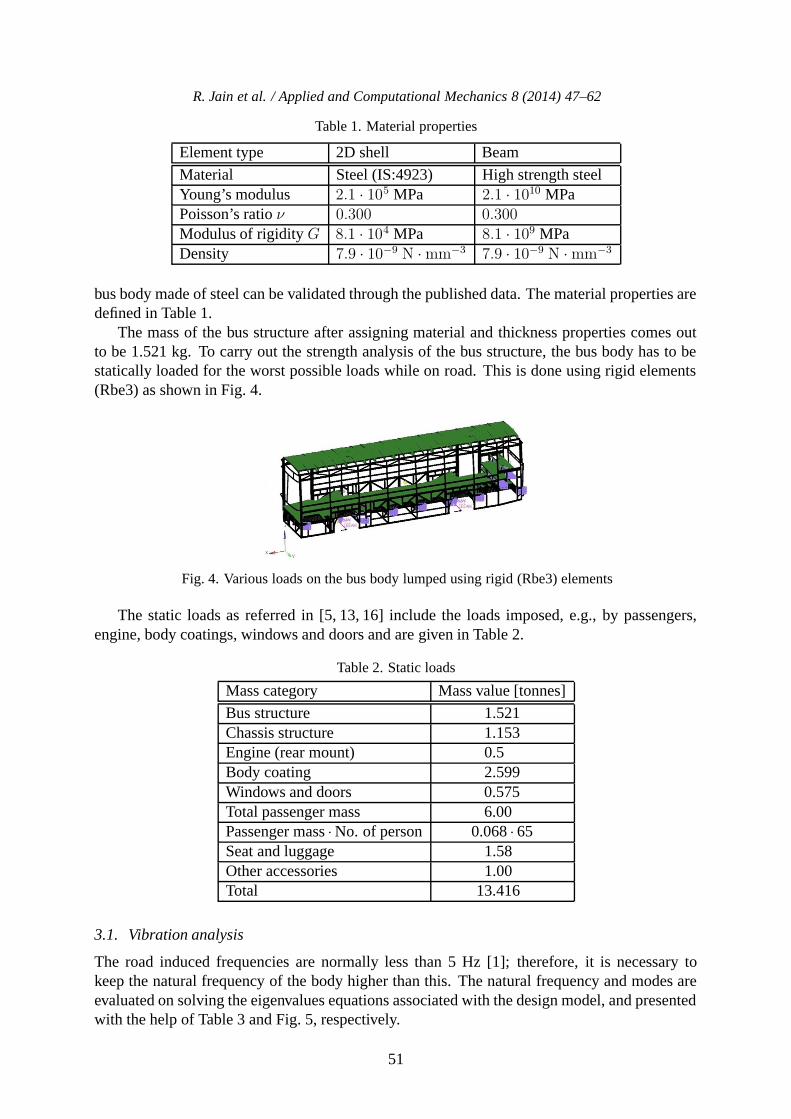
The mass of the bus structure after assigning material and thickness properties comes outto be 1.521 kg. To carry out the strength analysis of the bus structure, the bus body has to bestatically loaded for the worst possible loads while on road. This is done using rigid elements(Rbe3) as shown in Fig. 4.
Fig. 4. Various loads on the bus body lumped using rigid (Rbe3) elements
The static loads as referred in [5, 13, 16] include the loads imposed, e.g., by passengers,engine, body coatings, windows and doors and are given in Table 2.
Table 2. Static loads
Mass category Mass value [tonnes]
Bus structure 1.521Chassis structure 1.153Engine (rear mount) 0.5Body coating 2.599Windows and doors 0.575Total passenger mass 6.00Passenger mass ·No. of person 0.068 · 65Seat and luggage 1.58Other accessories 1.00Total 13.416
3.1. Vibration analysis
The road induced frequencies are normally less than 5 Hz [1]; therefore, it is necessary tokeep the natural frequency of the body higher than this. The natural frequency and modes areevaluated on solving the eigenvalues equations associated with the design model, and presentedwith the help of Table 3 and Fig. 5, respectively.
51

R. Jain et al. / Applied and Computational Mechanics 8 (2014) 47–62
Table 3. First ten modes of free modal analysis
Modes Frequency [Hz] Mode shape1 4.26 · 10−3 Rigid body mode2 7.79 · 10−4 Rigid body mode3 3.26 · 10−4 Rigid body mode4 1.22 · 10−3 Rigid body mode5 1.25 · 10−3 Rigid body mode6 1.40 · 10−3 Rigid body mode7 5.95 1st torsion mode8 8.79 1st bending mode9 10.36 2nd bending mode
10 11.74 Combined torsion and bending
Fig. 5. First torsion and first bending mode
For free body modal analysis, the first six modes are rigid body modes. On visualisation ofmode shapes, the seventh mode shows tendency of torsion, whereas the eighth mode comes outto be the first bending mode. Since the first torsion frequency is already greater than five, theobjective is to enhance it further.
3.2. Stiffness analysis
The bus setup as shown in Fig. 6, where 1, 2, 3 represent the x, y, z directional constraints,respectively, is assumed to be a simply supported beam. It deforms upon application of certainforce depending on the bending stiffness of the structure. Deformation is visualized along thelength and for the bottom beam is presented in the form of a graph in Fig. 7.
Fig. 6. FEA setup to calculate bending stiffness
52

R. Jain et al. / Applied and Computational Mechanics 8 (2014) 47–62
Fig. 7. Graph between the distance along the frame length and vertical displacement for the bottom beam
Torsion stiffness is a parameter to check the twist/deflection of the bus structure upon theapplication of torque. It should be high enough to resist the bus from twisting under varioustorsion loadings subjected to the vehicle. The torsional stiffness (TS) is defined with the helpof the following equation:
TS =F t
arctan(z1+z2
t
) , (1)
where F is the force, t is the track width and z1, z2 are the displacements of the two spindles ofthe front axle. Fig. 8 shows the FEA setup to calculate the torsion stiffness, while Fig. 9 showsthe displacements on the two spindles.
Fig. 8. FEA setup to calculate torsion stiffness
Fig. 9. Deflections z1 and z2
3.3. Linear static analysis
The loads imposed on the chassis and the body structure of a bus as the vehicle traverses unevenground or when the driver performs various manoeuvres, lead to stresses and deformations.They have to be substantiated. The boundary conditions of loads are defined at the spindlelocations of front and rear axles as mentioned in [7, 8, 11].
53
R. Jain et al. / Applied and Computational Mechanics 8 (2014) 47–62
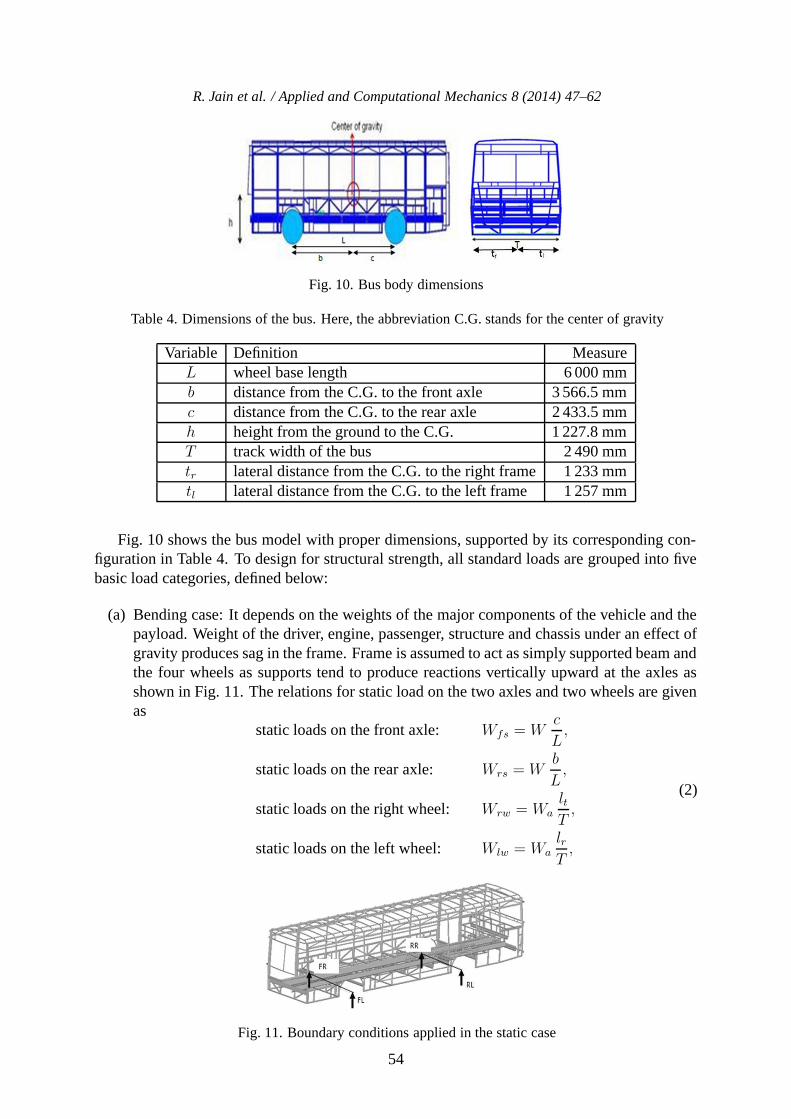
Fig. 10. Bus body dimensions
Table 4. Dimensions of the bus. Here, the abbreviation C.G. stands for the center of gravity
Variable Definition MeasureL wheel base length 6 000 mmb distance from the C.G. to the front axle 3 566.5 mmc distance from the C.G. to the rear axle 2 433.5 mmh height from the ground to the C.G. 1 227.8 mmT track width of the bus 2 490 mmtr lateral distance from the C.G. to the right frame 1 233 mmtl lateral distance from the C.G. to the left frame 1 257 mm
Fig. 10 shows the bus model with proper dimensions, supported by its corresponding con-figuration in Table 4. To design for structural strength, all standard loads are grouped into fivebasic load categories, defined below:
(a) Bending case: It depends on the weights of the major components of the vehicle and thepayload. Weight of the driver, engine, passenger, structure and chassis under an effect ofgravity produces sag in the frame. Frame is assumed to act as simply supported beam andthe four wheels as supports tend to produce reactions vertically upward at the axles asshown in Fig. 11. The relations for static load on the two axles and two wheels are givenas
static loads on the front axle: Wfs = Wc
L,
static loads on the rear axle: Wrs = Wb
L,
static loads on the right wheel: Wrw = WaltT,
static loads on the left wheel: Wlw = WalrT,
(2)
Fig. 11. Boundary conditions applied in the static case
54
R. Jain et al. / Applied and Computational Mechanics 8 (2014) 47–62
where W is the weight of the loaded bus and Wa is the weight on axles. The percentageof weights on rear and front axles are 59.44 % and 40.56 %, respectively.
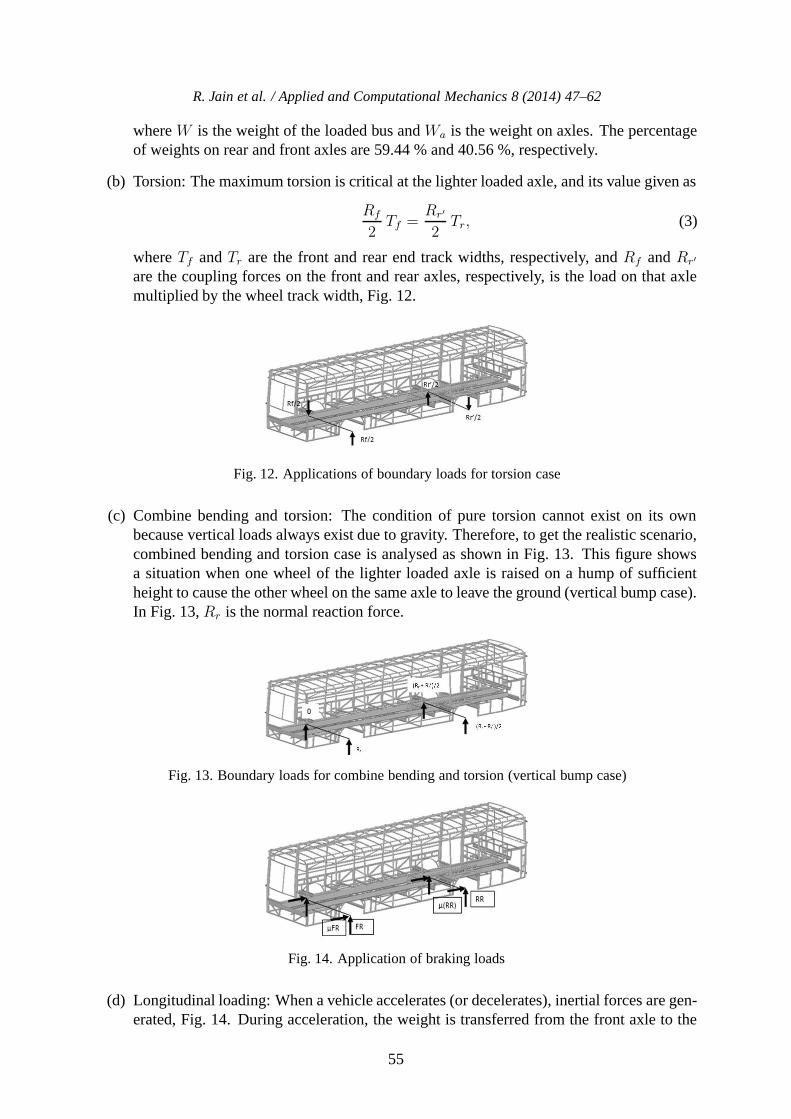
(b) Torsion: The maximum torsion is critical at the lighter loaded axle, and its value given as
Rf
2Tf =
Rr′
2Tr, (3)
where Tf and Tr are the front and rear end track widths, respectively, and Rf and Rr′
are the coupling forces on the front and rear axles, respectively, is the load on that axlemultiplied by the wheel track width, Fig. 12.
Fig. 12. Applications of boundary loads for torsion case
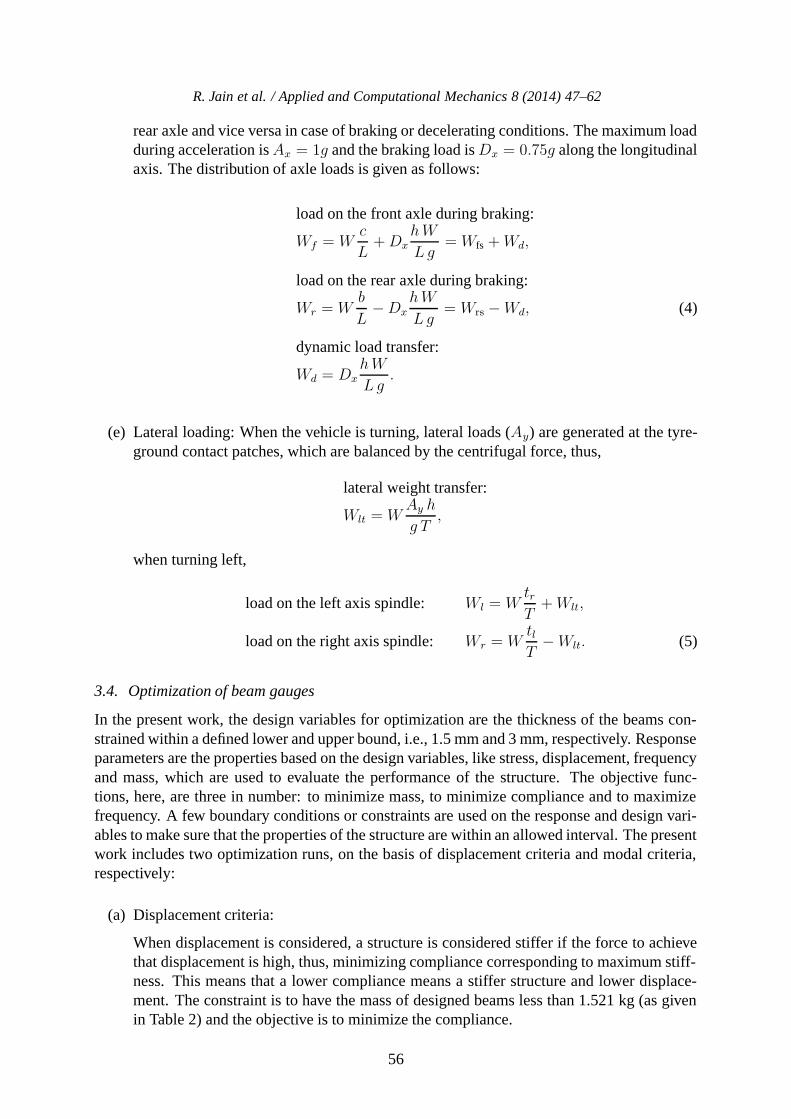
(c) Combine bending and torsion: The condition of pure torsion cannot exist on its ownbecause vertical loads always exist due to gravity. Therefore, to get the realistic scenario,combined bending and torsion case is analysed as shown in Fig. 13. This figure showsa situation when one wheel of the lighter loaded axle is raised on a hump of sufficientheight to cause the other wheel on the same axle to leave the ground (vertical bump case).In Fig. 13, Rr is the normal reaction force.
Fig. 13. Boundary loads for combine bending and torsion (vertical bump case)
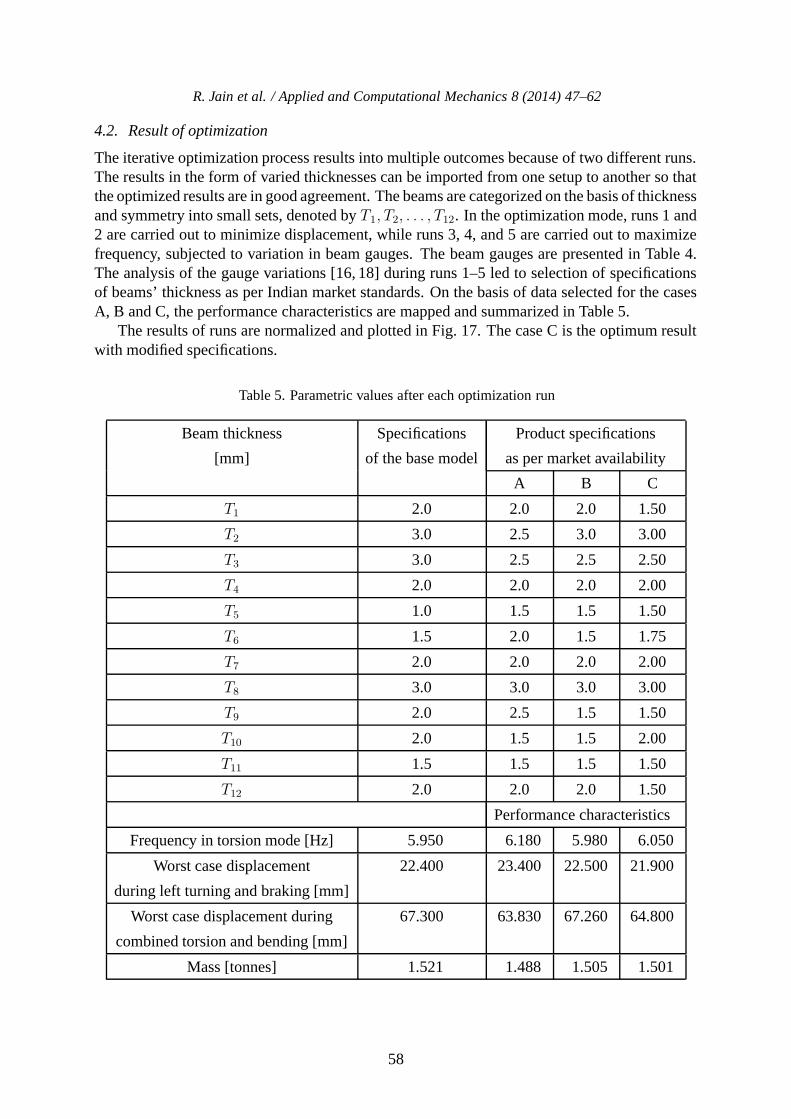
Fig. 14. Application of braking loads
(d) Longitudinal loading: When a vehicle accelerates (or decelerates), inertial forces are gen-erated, Fig. 14. During acceleration, the weight is transferred from the front axle to the
55
R. Jain et al. / Applied and Computational Mechanics 8 (2014) 47–62
rear axle and vice versa in case of braking or decelerating conditions. The maximum loadduring acceleration is Ax = 1g and the braking load is Dx = 0.75g along the longitudinalaxis. The distribution of axle loads is given as follows:
load on the front axle during braking:
Wf = Wc
L+Dx
hW
Lg= Wfs +Wd,
load on the rear axle during braking:
Wr = Wb
L−Dx
hW
Lg= Wrs −Wd,
dynamic load transfer:
Wd = DxhW
Lg.
(4)
(e) Lateral loading: When the vehicle is turning, lateral loads (Ay) are generated at the tyre-ground contact patches, which are balanced by the centrifugal force, thus,
lateral weight transfer:
Wlt = WAy h
g T,
when turning left,
load on the left axis spindle: Wl = WtrT
+Wlt,
load on the right axis spindle: Wr = WtlT
−Wlt. (5)
3.4. Optimization of beam gauges
In the present work, the design variables for optimization are the thickness of the beams con-strained within a defined lower and upper bound, i.e., 1.5 mm and 3 mm, respectively. Responseparameters are the properties based on the design variables, like stress, displacement, frequencyand mass, which are used to evaluate the performance of the structure. The objective func-tions, here, are three in number: to minimize mass, to minimize compliance and to maximizefrequency. A few boundary conditions or constraints are used on the response and design vari-ables to make sure that the properties of the structure are within an allowed interval. The presentwork includes two optimization runs, on the basis of displacement criteria and modal criteria,respectively:
(a) Displacement criteria:
When displacement is considered, a structure is considered stiffer if the force to achievethat displacement is high, thus, minimizing compliance corresponding to maximum stiff-ness. This means that a lower compliance means a stiffer structure and lower displace-ment. The constraint is to have the mass of designed beams less than 1.521 kg (as givenin Table 2) and the objective is to minimize the compliance.
56

R. Jain et al. / Applied and Computational Mechanics 8 (2014) 47–62
(b) Modal criteria:
This is a measure of the dynamic behaviour of the model, in which higher frequenciesmean better ride for the passengers (to avoid resonance). Since the first two bending andtorsion mode frequencies, see Table 3, contribute most to the structure stiffness, they areto be maximized with an objective to minimize the weight. The design variable propertiesare imported from the results of the previous (displacement) run.
In this case, the constraint is the mass taken from the previous run, i.e., mass less than1.521 kg. The objectives are to maximize the 7th and 8th frequencies of the free modal analysis.Two iterative runs are consecutively executed and studied to achieve an optimum result.
4. Experimental results
4.1. Result of linear static analysis
During the linear static analysis, the highest stresses observed are those of 279 MPa and283 MPa for combined bending and combined longitudinal and lateral loadings, respectively.The locations of these highest stresses are shown in Fig. 15.
Fig. 15. Beam subjected to high stresses
When evaluating the performance of the base model, emphasis is placed on the magnitudeand location of stresses and deformations occurring on the body. As circled in Fig. 16, thelargest stresses are localized near the wheels and the floor adjacent to the doors.
a) b)
Fig. 16. a) Stresses for left cornering with braking; b) stresses in the torsion case
57
R. Jain et al. / Applied and Computational Mechanics 8 (2014) 47–62
4.2. Result of optimization
The iterative optimization process results into multiple outcomes because of two different runs.The results in the form of varied thicknesses can be imported from one setup to another so thatthe optimized results are in good agreement. The beams are categorized on the basis of thicknessand symmetry into small sets, denoted by T1, T2, . . . , T12. In the optimization mode, runs 1 and2 are carried out to minimize displacement, while runs 3, 4, and 5 are carried out to maximizefrequency, subjected to variation in beam gauges. The beam gauges are presented in Table 4.The analysis of the gauge variations [16, 18] during runs 1–5 led to selection of specificationsof beams’ thickness as per Indian market standards. On the basis of data selected for the casesA, B and C, the performance characteristics are mapped and summarized in Table 5.
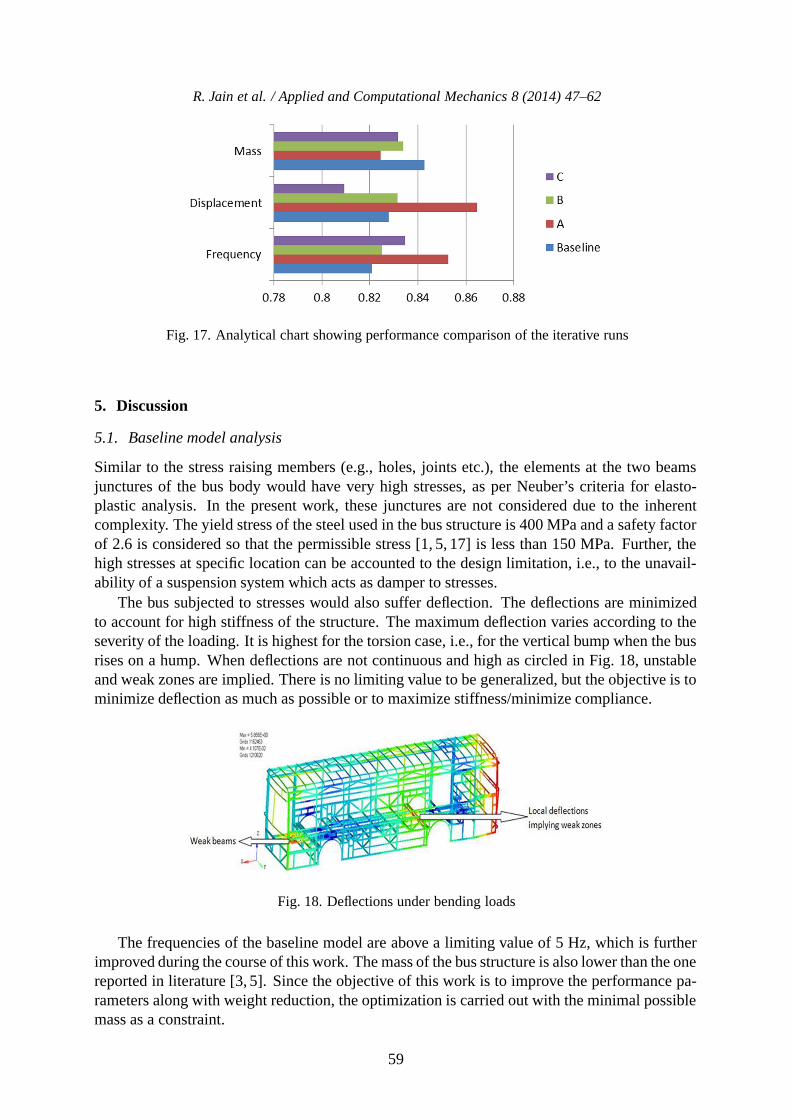
The results of runs are normalized and plotted in Fig. 17. The case C is the optimum resultwith modified specifications.
Table 5. Parametric values after each optimization run
Beam thickness Specifications Product specifications
[mm] of the base model as per market availability
A B C
T1 2.0 2.0 2.0 1.50
T2 3.0 2.5 3.0 3.00
T3 3.0 2.5 2.5 2.50
T4 2.0 2.0 2.0 2.00
T5 1.0 1.5 1.5 1.50
T6 1.5 2.0 1.5 1.75
T7 2.0 2.0 2.0 2.00
T8 3.0 3.0 3.0 3.00
T9 2.0 2.5 1.5 1.50
T10 2.0 1.5 1.5 2.00
T11 1.5 1.5 1.5 1.50
T12 2.0 2.0 2.0 1.50
Performance characteristics
Frequency in torsion mode [Hz] 5.950 6.180 5.980 6.050
Worst case displacement
during left turning and braking [mm]
22.400 23.400 22.500 21.900
Worst case displacement during
combined torsion and bending [mm]
67.300 63.830 67.260 64.800
Mass [tonnes] 1.521 1.488 1.505 1.501
58
R. Jain et al. / Applied and Computational Mechanics 8 (2014) 47–62
Fig. 17. Analytical chart showing performance comparison of the iterative runs
5. Discussion
5.1. Baseline model analysis
Similar to the stress raising members (e.g., holes, joints etc.), the elements at the two beamsjunctures of the bus body would have very high stresses, as per Neuber’s criteria for elasto-plastic analysis. In the present work, these junctures are not considered due to the inherentcomplexity. The yield stress of the steel used in the bus structure is 400 MPa and a safety factorof 2.6 is considered so that the permissible stress [1, 5, 17] is less than 150 MPa. Further, thehigh stresses at specific location can be accounted to the design limitation, i.e., to the unavail-ability of a suspension system which acts as damper to stresses.
The bus subjected to stresses would also suffer deflection. The deflections are minimizedto account for high stiffness of the structure. The maximum deflection varies according to theseverity of the loading. It is highest for the torsion case, i.e., for the vertical bump when the busrises on a hump. When deflections are not continuous and high as circled in Fig. 18, unstableand weak zones are implied. There is no limiting value to be generalized, but the objective is tominimize deflection as much as possible or to maximize stiffness/minimize compliance.
Fig. 18. Deflections under bending loads
The frequencies of the baseline model are above a limiting value of 5 Hz, which is furtherimproved during the course of this work. The mass of the bus structure is also lower than the onereported in literature [3, 5]. Since the objective of this work is to improve the performance pa-rameters along with weight reduction, the optimization is carried out with the minimal possiblemass as a constraint.
59

R. Jain et al. / Applied and Computational Mechanics 8 (2014) 47–62
The stiffness is an important criterion to evaluate the performance of the bus structure. Inliterature, the stiffness values are reported in the range of 5–15 kN/mm for a bus structure [9].The stiffness values of baseline model are satisfactory as they lie within this range. The worstcase displacement values as given in Table 5 are comparable to the results reported in litera-ture [4, 16] and, hence, justified.
5.2. Optimized model analysis
To validate the new model, a tabulated comparison of the baseline and optimized model ismade in Table 6. This table does not include the comparison of maximum stresses inducedon beams due to indefinite load cases. The range of maximum stresses for the worst cases,which are turning with braking and combined torsion with bending, has reduced from a rangeof 250–280 MPa to the range of 200–220 MPa. Besides, for other load cases, the stresses onthe beams of the optimized model are within the permissible range of 150 MPa [5]. Stresseson some of the weak beams still exceed the permissible limit and, hence, are identified forremodeling or artificial stiffeners have to be attached at identified locations.
Table 6. Comparison between baseline and optimized model
Parameters Baseline model Optimized model Difference
Structure mass [tonnes] 1.521 1.500 −1.33 %
Torsion frequency [Hz] 5.950 6.050 +1.66 %
Bending frequency [Hz] 8.780 8.900 +1.43 %
Torsion stiffness [kNm/deg] 17.920 18.230 +1.7 %
Bending stiffness [kN/mm] 13.110 12.940 −1.20 %
Displacement [mm](left turn and braking case)
22.400 21.900 −2.20 %
Displacement [mm](vertical bump case)
67.000 64.880 −3.56 %
6. Conclusion
The gauge optimization on the bus structure is an iterative process and the mass of the finaloptimized model is by 1.33 % less than the baseline. The first torsion frequency has increasedby 1.66 % to 6.05 Hz and the first bending frequency by 1.43 % to 8.906 Hz. The torsionstiffness is now by 1.7 % higher than that of the baseline model, whereas the bending frequencyis almost the same for the two models. The deformations have moderately come down by 2.2 %for the combined turning with braking case, while it shows a decline of 3.56 % for the torsioncase. Thus, one can conclude that by following the proposed algorithm, the bus body may beoptimized along with minor decrease in weight by optimizing beam gauges. This has led tosignificant improvement of performance characteristics. The work is verified by conductingdetailed analysis on a full length 11 m, 65 seats bus and helps in reducing structural mass by20 kg along with enhanced stiffness, vibration and stress performances.
60
R. Jain et al. / Applied and Computational Mechanics 8 (2014) 47–62
Acknowledgements
The proposed work is done during the Project Based Internship (PBI) of the undergraduatestudents at PDPM IIITDM Jabalpur. We acknowledge the support provided by the Institute andAltair Engineering Pvt. Ltd. to facilitate the conduct of this work.
References
[1] Belure, S. B., Kadam, S. S., Wadkar, S. B., Criticality analysis of passenger bus body structuraldesign using finite element method, Proceedings of COMPUTIME, National Conference on Com-putational Methods in Mechanical Engineering, Hyderabad, India, 2005.
[2] Biradar, J. M., Vijay, B. V., Jat, K., Automotive chassis sizing optimisation for modal and distor-tion criteria, SASTech 7 (2) (2008) 1–7.
[3] Boada, B. L., Gauchia, A., Boada, M. J. L., Diaz, V., A genetic-based optimization of a busstructure as a design methodology, Proceedings of the 12th IFToMM World Congress, Besancon,2007.
[4] Chinnaraj, K., Prasad, M. S., Rao, C. L., Experimental analysis and quasi-static numerical ideal-ization of dynamic stresses on a heavy truck chassis assembly, Applied Mechanics and Materials13–14 (2008) 271–280.
[5] Croccolo, D., Agostinis, M. D., Vincenzi, N., Structural analysis of an articulated urban bus chas-sis via FEM: A methodology applied to a case study, Strojniski vestnik – Journal of MechanicalEngineering 57 (11) (2011) 799–809.
[6] Fornace, L. V., Weight reduction techniques applied to formula SAE vehicle design: An investi-gation in topology optimization, Master thesis, University of California, San Diego, 2006.
[7] Happian-Smith, J., An introduction to modern vehicle design, 2nd edition, Elsevier, 2001,pp. 125–155.
[8] Heibing, B., Ersoy, M., Chassis handbook: Fundamentals, driving dynamics, components, mecha-tronics, perspectives, Vieweg+Teubner Verlag, 2010.
[9] Helsen, J., Cremers, L., Mas, P., Sas, P., Global static and dynamic car body stiffness based ona single experimental modal analysis test, Proceedings of the International Conference on Noiseand Vibrations Engieneering — ISMA, Leuven, Belgium, 2010, pp. 2 505–2 522.
[10] Kumar, S., Optimization of BIW, chassis and casting at Mahindra and Mahindra, Proceedings ofthe Altair CAE Users Conference, Bangalore, India, 2005.
[11] Lafreniere, M., Design of a formula SAE race car chassis: Composite analysis utilizing AltairEngineering OptiStruct software, Bachelor thesis, University of Toronto, 2007.
[12] Lin, Y. C., Nian, H. C., Structural design optimization of the body section using the finite elementmethod, SAE Technical paper 2006-01-0954, 2006.
[13] Manokruang, S., Butdee, S., Methodology of bus-body structural redesign for lightweight produc-tivity improvement, AIJSTPME 2 (2) (2009) 79–87.
[14] Proos, K. A., Steven, G. P., Querin, O. M., Xie, Y. M., Multicriterion evolutionary structuraloptimization using the weighting and the global criterion methods, AIAA Journal 39 (10) (2001)2 006–2 012.
[15] Reed, C., Application of Optistruct optimization to body in white design, Altair Engineering Ltd.,2002.
[16] Ruız, O., Ramırez, E. I., Jacobo, V. H., Schouwenaars, R., Ortiz, A., Efficient optimisation ofthe structure of a passenger bus by iterative finite element models with increasing degrees ofcomplexity, Proceedings of the 3rd International Conference on Engineering Optimization, Riode Janeiro, Brazil, 2012.
61

R. Jain et al. / Applied and Computational Mechanics 8 (2014) 47–62
[17] Shinabuth, D., Benyajati, C., Phuchamnong, A., Pimsam, M., Okuma, M., A numerical and exper-imental measurement in a dynamic strain response of an electric bus body structure, Proceedingsof the 2nd TSME International Conference on Mechanical Engineering, Krabi, Thailand, 2011.
[18] Singh, R. V., Structural performance analysis of a formula SAE car, Jurnal Mekanikal 31 (2010),46–61.
[19] Xingwang, Z., Zhen, T., A study on shape optimization of bus structure based on stiffness sen-sitivity analysis, Proceedings of the 10th International Conference on Computer-aided IndustrialDesign & Conceptual Design, Wenzhou, China, 2009, pp. 1 225–1 229.
[20] Zehnder, J., Pritzlaff, R., Lundberg, S., Gilmont, B., Aluminium in commercial vehicle, Europeanaluminium association AISBL, Brussels, 2011.
62
Related Documents