INTERNATIONAL INSTITUTE FOR WATER AND ENVIRONMENTAL ENGINEERING THESIS For the grade of: DOCTOR IN SCIENCE AND TECHNOLOGY FOR WATER, ENERGY AND ENVIRONMENT Speciality: Water Presented by Diafarou Ali MOUMOUNI 7 th March, 2016 Ref. : 2iE/2016-06 Title OPTIMIZATION OF TWO-STAGE HIGH-RATE ANAEROBIC REACTORS COUPLED WITH BAFFLED POND AND WET-DRY SAND FILTERS FOR DOMESTIC WASTEWATER TREATMENT IN A WARM-DRY CLIMATE (OUAGADOUGOU, BURKINA FASO) JURY Prof. Nosa O. EGIEBOR, University of Mississippi (USA) President Prof. Frank KANSIIME, Makerere University, (Uganda) Rapporteur Prof. Marcos von SPERLING, Federal University of Minas Gerais (Brazil) Rapporteur Prof. Théophile GNAGNE, University Nangui Abrogoua (Cote d’Ivoire) Examiner Prof. Amadou Hama MAIGA, 2iE (Burkina Faso) Director of Thesis Laboratory for Water, Decontamination, Ecosystem and Health (LEDES)

Welcome message from author
This document is posted to help you gain knowledge. Please leave a comment to let me know what you think about it! Share it to your friends and learn new things together.
Transcript

INTERNATIONAL INSTITUTE FOR WATER AND ENVIRONMENTAL ENGINEERING
THESIS
For the grade of:
DOCTOR IN SCIENCE AND TECHNOLOGY FOR WATER, ENERGY AND ENVIRONMENT
Speciality: Water
Presented by
Diafarou Ali MOUMOUNI
7th March, 2016
Ref. : 2iE/2016-06
Title
OPTIMIZATION OF TWO-STAGE HIGH-RATE ANAEROBIC REACTORS COUPLED WITH BAFFLED POND AND WET-DRY SAND FILTERS FOR DOMESTIC WASTEWATER TREATMENT IN A WARM-DRY CLIMATE (OUAGADOUGOU, BURKINA FASO)
JURY
Prof. Nosa O. EGIEBOR, University of Mississippi (USA) President
Prof. Frank KANSIIME, Makerere University, (Uganda) Rapporteur
Prof. Marcos von SPERLING, Federal University of Minas Gerais (Brazil) Rapporteur
Prof. Théophile GNAGNE, University Nangui Abrogoua (Cote d’Ivoire) Examiner
Prof. Amadou Hama MAIGA, 2iE (Burkina Faso) Director of Thesis
Laboratory for Water, Decontamination, Ecosystem and Health (LEDES)

OPTIMIZATION OF TWO-STAGE HIGH-RATE ANAEROBIC REACTORS COUPLED WITH BAFFLED POND AND WET-DRY SAND FILTERS FOR DOMESTIC WASTEWATER TREATMENT IN A WARM-DRY CLIMATE (OUAGADOUGOU, BURKINA FASO)
Thesis Submitted in fulfilment of the requirements
of the Academic Board of the International Institute of Water and Environmental Engineering 2iE, in Ouagadougou, Burkina Faso
and
This work was done with the academic support of the Centre for Research and Training in Sanitation at the Federal University of Minas Gerais (UFMG) in Belo Horizonte, Brazil
for the degree of Doctor of Philosophy
Defended in public
on 7th march 2016 at 14.30 a.m. Ouagadougou, Burkina Faso
by
Diafarou Ali MOUMOUNI
Supervisor: Professor Amadou Hama MAIGA - 2iE (Burkina Faso)
Mentors:
Professor Marcos von SPERLING - UFMG (Brazil) Dr. Harinaivo A. ANDRIANISA - 2iE (Burkina Faso)
Dr. Yacouba KONATE - 2iE (Burkina Faso) Dr. Awa NDIAYE - 2iE (Burkina Faso)

i
This research was conducted under the framework of Sanitation for the Urban Poor project: ‘’Stimulating Local Innovation on Sanitation for the Urban Poor in Sub-Saharan Africa and South-East Asia’’ under the auspices of the project Director Prof. Damir Brdjanovic of UNESCO-IHE Institute for Water Education, Delft, the Netherlands.

ii
Dedication
This thesis is dedicated to my late father Moumouni Ali May God bless and rest your soul in peace

Abstract
iii
Abstract Over recent decades, there is renewed interest in optimizing and innovating wastewater treatment technologies (WTTs) in sub-Saharan Africa, to reduce the impact of domestic and industrial sewage on the environment. However, poor city-dwellers need low-cost, reliable WTTs that allow for the safe reuse of the effluent in water scare context. This research focuses on the design, implementation, evaluation and optimization of two options for domestic wastewater treatment in the warm, dry sub-Saharan Africa climate of Ouagadougou, Burkina Faso. The first option consisted of two-stage high-rate Anaerobic Reactors followed by a Baffled Pond (AR-BP) with recycled plastic media as a medium for attached growth. The three vertical plastic baffles (with plastic bottle caps affixed to them to increase their surface area) formed four compartments in the baffled pond (BP). The second option included the same two-stage high-rate Anaerobic Reactors but followed them with wet-dry Sand Filters (AR-SF). The research was conducted on the pilot scale, by applying a design flow of 1 m
3/day, which was later increased to 1.5 m
3/ day. A peristaltic pump was used to provide an
intermittent flow three times a day (at 8:00 am, 1:00 pm and 5:00 pm) from the buffer tank to the system.
After two years of operation, COD, BOD5 and TSS mean removal efficiencies were achieved by significant difference in both systems : 79%, 81% and 72% for AR-BP; 84%, 88% and 88% for AR-SF respectively. It was also found out that high pathogen removal efficiencies were achieved in both treatment options with 6 and 5 log units for AR-BP and AR-SF respectively. In addition, the AR-SF option presented a high rate of nitrification, while the BP was more efficient in removing ammonia nitrogen (84%) and E. coli (6 log units). Furthermore, no E.coli were ever detected in the BP effluent, nor did clogging occur in the SF, during the entire study. E-coli were, however, found in the effluent of a control pond (CP) that had no baffles. In fact, it was found that E. coli concentrations were lower in the upper layers of all four compartments of the BP, with an undetectable level in the last compartment down to a depth of 0.60 m. A tracer test with salt results showed actual mean hydraulic retention times of 4.1 and 3.2 days for BP and CP respectively. Also, it was found that the volume of the pond was more efficiently used for wastewater treatment in the BP, since more half of the volume of the CP was estimated to be inactive. The tracer experiment also showed that there was better mixing in the BP, thus treatment would be more predictable. Consequently, incorporating three verticals baffles in a pond, under Sahelian climate, not only improved the hydrodynamics and the performance of the pond, but also reduced costs and the amount of land that is required.
Another important aspect revealed by this research was the dense and rich biodiversity on both the attached media and in the water column of the BP. The biofilm was thick and green on the upper parts of both sides of all three at the top of the two sides of the baffles (on both the plastic sheets that form the baffles and the plastic bottles caps affixed to it). The biomass attached on the media constituted 35.5 times of that in the water column. Three major groups of diverse zooplankton were found in the water column at 15-90 cm depth, which included Cladocera, Copepoda and rotifers. The latter group was dominant with 13 identified species, which are attracted to a wide spectrum of food items. In addition, the Principal Components Analysis (PCA) carried out to examine the interactions between biotic and abiotic components of BP further revealed the symbiotic algal-bacterial activity and abiotic parameters, such as pH, dissolved oxygen and temperature interdependences in the course of organic matter degradation in the top layer of the BP. Furthermore, the very strong negative correlation between zooplankton and phytoplankton associated with abiotic parameters corroborates their predatory relationship. As a result, the predatory symbiosis distributions of phytoplankton and zooplankton have shown that the baffles had an effect on water quality which in turn has affected the ecology of the BP. Moreover, this dense and abundant presence of the zooplankton community could play an important role in the control of bacterial and algal populations in BP.
Lastly, the two-stage high-rate anaerobic reactors (R1 and R2) produced ample amounts of valuable biogas under the warm Sahelian climate, with 9.7 L/m
2 per day of biogas and with methane content of 54%. More
importantly, very low sludge yields were recorded in R1, R2, and BP (0.0006, 0.0002 and 0.0014 m3/capita/year
respectively), thus reducing the cost of its extraction and management.
Both treatment options can be recommended as an alternative low-cost wastewater treatment technologies, separately or in tandem, for African cities, with the final effluent being used for restricted irrigation in peri-urban agriculture. To contribute even more to the alleviation of hunger in poor neighborhoods, further investigations may look at the use of this effluent in aquaculture, before its use in irrigation.
Keywords: anaerobic reactor; baffled pond; biofilm; biogas; domestic wastewater; low-cost technology; wastewater treatment; sustainable sanitation for urban poor; water recycling; wet-dry sand filter

List of Publications
iv
List of Publications Dissertation submitted for the degree
I. Title
Optimization of two-stage High-rate Anaerobic Reactors coupled with Baffled Pond and Wet-dry Sand Filters for domestic wastewater treatment in a warm-dry climate (Ouagadougou, Burkina Faso)
II. Published Papers:
D.A. Moumouni, H.A. Andrianisa, Y. Konaté, A. Ndiaye and A.H. Maïga (2015): Inactivation of Escherichia coli in a baffled pond with attached growth: treating anaerobic effluent under the Sahelian climate, Environmental Technology, DOI: 10.1080/09593330.2015.1098732
III. Submitted Papers and Manuscripts:
- D.A. Moumouni, H.A. Andrianisa, Y. Konaté, A. Ndiaye and A.H. Maïga (…): Alternative low-
cost wastewater treatments for sub-Saharan Africa urban poor, Environmental Engineering
Science (submitted manuscript ID EES-2015-0435)
- D.A. Moumouni, H.A. Andrianisa, Y. Konaté, A. Ndiaye and A.H. Maïga (…): Effects of baffles on biofilm characteristics and zooplankton composition in a Baffled Pond in the Sahel Region of Africa, (manuscript)
- D.A. Moumouni, H.A. Andrianisa, Y. Konaté, A. Ndiaye and A.H. Maïga (…): Hydraulic regimes
of baffled and unbaffled, treating anaerobic effluent under the Sahelian climate, (manuscript)
IV. Conference Papers:
- D.A. Moumouni, H.A. Andrianisa, Y. Konaté and A.H. Maïga (2013): Performance estimation of two-stage high rate anaerobic reactors coupled with baffled pond and wet-dry sand filters for domestic wastewater treatment in a warm climate: the case of Ouagadougou. 7th2iE International Scientific Days, 1-4 April 2013, Ouagadougou, Burkina Faso.
- D.A. Moumouni, H.A. Andrianisa, Y. Konaté and A.H. Maïga (2013): Performance estimation of Two Stage High-Rate Anaerobic Reactors coupled with Baffled Pond and Wet-Dry Sand Filters for Domestic Wastewater treatment In a Warm climate. 3rdIWA DevelopmentCongress and Exhibition, 14-17 October 2013, Nairobi, Kenya.

Acknowledgements
v
Acknowledgements
First and foremost, I thank the Almighty God for the gift of life, protection and guidance;
and I attribute the completion of this work to his will. All praises belong to the Almighty God
who provided the strength and motivation to further my education. He is indeed the most
merciful and most gracious.
The author is extremely grateful to Bill & Melinda Gates Foundation for providing financial
assistance under the framework of Sanitation for the Urban Poor project: ‘’Stimulating Local
Innovation on Sanitation for the Urban Poor in Sub-Saharan Africa and South-East Asia’’,
coordinated by Prof. Damir Brdjanovic . I would also wish to extend my sincere thanks to all
the project team members for their constructive criticisms and guidance.
I owe a considerable debt of gratitude to M. Amadou Hama MAIGA; at the same time
Managing Director of 2iE and Director of thesis, and also to Professor Marcos von Sperling,
at the Federal University of Minas Gerais, Brazil, for accepting me as a PhD student and for
their insightful support and guidance during this process in both 2iE and UFMG.
I would like to give special thanks to the steering committee members of this Thesis in 2iE,
especially Dr. Harinaivo Anderson Andrianisa, Dr Yacouba Konaté, Dr. Awa Diaye Koita for
your contributions made to this work. I express my heartfelt gratitude for all for the
constructive ideas, comments and guidance throughout the research period. May God bless
you all!
I’m particularly indebted to M. Christopher Canaday, Conservation Biologist and EcoSan
Promoterin Ecuador for his relevant remarks in reviewing the whole Ph.D. thesis manuscript
and also for giving very useful advices and suggestions in improving both the English and the
scientific content. A number of individuals deserve to be singled out for their precious time
to critically proofreading this Thesis: Dr. Niyi Adeogun, Dr. Hamidatu Saaka Darimani, Dr.
Ynoussa Maiga. Special thanks go to Dr. Niyi Adeogun who kept in touch with me, after our
M.Sc study at UNESCO-IHE, notified and supported me when the PhD opportunity became
available.
I also want to give a special thank you to the Jury members who have done us the honour to
review this work. My heartfelt gratitude to ProfessorFrank Kansiime of Makerere University,
Institute of Environmental and Natural Resources, Uganda for accepting to be a reporter of
this work. I heartily thank Professor Marcos von Sperling for accepting to be a reporter of
this study. I extend my heartfelt thanks to Professor Théophile Gnagne from the University
of Abobo-Adjamé, Cote d’Ivoire for accepting to critically review this work. I extend our
sincere appreciation to Professor Nosa Egeibor for accepting to be the president of the jury.
Special thanks to my beloved family, my mother, brothers and sisters who gave me the
courage and strength to move on. Great and heartfelt appreciation to my lovely wife Ouma
and her family, my little children, Amjad and Shaima, and my niece Nafissatou; I deeply
appreciate your patience. Thanks for tolerating my long hours in the lab and my absence
from home for many months. I am most grateful for your unconditional love, support,

Acknowledgements
vi
patience, understanding and prayers. Thank you for your love and endurance. I love you so
much.
I extend my heartfelt appreciation to all our Club members of Niger Young Expat in Burkina
Faso for their continuous assistance, especially by entirely organizing the naming ceremony
of my daughter Shaima, during my absence from home. I owe a considerable debt of
gratitude to my friends back in Niger whose moral support helped settle me down. I extend
my heartfelt thanks to my dear friends of Burkina Faso: Hamado Ouedraogo, Alima Sana,
Blaise Lankonde, Salimata Diakite and Hermann Zoungrana, Fanete, Mari for the friendly
environment.
I would also like to acknowledge the contributions of the entire staff and participants of 2iE
for the friendly environment under which we studied and researched.
To all PhD students of 2iE, especially, Beteo Zongo, Abdouramane D. Gado, Vivien C. Doto,
Sangare Drissa, Maxime G. Ahoule, Nka Nnomo Bernadette,Noellie Kpoda, David B.
Tsuanyo, Dimitri D. Soro, Aida Zare, Tadjouwa Kouawa, Adugna Amare Tirunah, Cheick O.
Zoure and Christine L. Razanamahandry thank you all for the friendship and support during
this Thesis. Special thanks go to Geneviève Yameogo, coordination officer of the doctoral
School of 2iE.
I express my deepest gratitude to the MSc students of 2iE that contributed to the data
collectionin both laboratory and experimental site: Ali Djimé Ahmed, Adoum Kalgue, Ouchar
Cherif Mahadi, Kassim Doungous, Soumaïla Traore, Mamadou Dahira Diagne, Ismael
Harouna, Amidou Alaza, Gérard Ezoula Agoro, Christelle Nakumukiza, Mamadou Bhoye Bah,
Georgio Lucas and Pierre Kabore the pilot plant operator.
I am very grateful to research engineers, technicians and support staff in laboratory that
contributed to the data collection: Hassane Gado, Hama Amadou, Jean-Jacques Nfon Dibié,
Seyram Sossou, Boukary Sawadogo, Noel Tindoure, Hema Somai, Bernard Zongo, and
Moustapha Ouedraogo.
Certainly I would be remiss if I fail to acknowledge friends at the Laboratory on Sanitary
Engineering at the Federal University of Minas Gerais, Belo Horizonte, Brazil, especially Elias
Sete Manjate, Daniel Filipe Cristelo Dias, Thiago Bressani, Cynthia Franco. Thank you all for
your support.
I wish to express my acknowledgement to all those who contributed immensely in
numerous ways to make research a success.
Finally, I acknowledge all those who helped me but whose names have not appeared on this
page. May God bless you all!

Résumé substantiel en Français
vii
Résumé substantiel en Français
Optimisation de deux Réacteurs Anaérobies à haut rendement, suivis de deux options de post-traitement des eaux usées domestiques sous un climat sahélien chaud et sec: Bassin Lamellé et Filtre à Sable (Ouagadougou, Burkina Faso)
Introduction Au cours des dernières décennies, les techniques de traitement des eaux usées par les
procédés du système extensif, et particulièrement le lagunage à microphytes, ont connu
une véritable évolution dans les pays tropicaux où le climat est favorable. Ces technologies
de traitement des eaux usées à faible coût sont non seulement fiables, efficaces, durables
mais aussi adaptées, aux populations à faible revenu vivant dans les zones urbaines et péri-
urbaines de l’Afrique Subsaharienne. Les déficits hydriques sont récurrents dans ces zones
où la rareté des ressources en eau a des répercussions importantes sur l’économie,
l’alimentation et la santé des populations. Pour pallier ce manque, les eaux usées sont
utilisées et réutilisées en agriculture avec ou sans traitement préalable entrainant ainsi des
problèmes de santé publique. Pour réduire les risques dus à la réutilisation de ces eaux,
plusieurs techniques innovantes de traitement des rejets domestiques et urbains ont été
développées. La méconnaissance des conditions d’usage et de maintenance de ces systèmes
remet en cause leur viabilité. Il est donc nécessaire de proposer des systèmes de traitement
qui tiennent compte au mieux les réalités de la zone d’étude. Ces systèmes à moindre coût
de conception et de maintenance, ne doivent pas avoir une forte emprise sur le sol. C’est
dans cette optique que cette étude a été menée sur la conception, la mise en œuvre,
l'évaluation et l'optimisation de deux options de traitement des eaux usées domestiques
sous le climat sahélien de Ouagadougou au Burkina Faso. Le choix de ces deux options est
basé sur les concepts de technologies extensives à faible coût, tant au niveau de la collecte
qu’à celui de l’épuration des eaux usées.
La première option comporte deux Réacteurs Anaérobies à haut rendement connectés en
série, puis suivis par un Bassin Lamellé avec des bouchons en plastique fixés aux chicanes
(RA-BL). Le principe de cette option est basé sur le fonctionnement à trois étages de bassins
de lagunage à microphytes. Le premier bassin qui est le bassin anaérobie a été modifié pour
former deux réacteurs anaérobies, où le biogaz est collecté. Le second bassin, dit bassin
facultatif a été omis afin de minimiser la zone d’emprise du système de traitement. Enfin,
pour optimiser l’efficacité hydraulique et augmenter la biomasse épuratrice, trois chicanes
munies des bouchons de bouteilles en plastique usagées ont été introduites verticalement à
contrecourant dans le troisième bassin dit bassin de maturation, formant ainsi quatre
cloisons. Cette configuration a été prévue pour améliorer l'efficacité d'élimination des
matières organiques, des nutriments (azote et phosphore), des agents pathogènes et
permettre une valorisation de la production d’énergie (biogaz).
La seconde option est composée de deux Réacteurs Anaérobies à haut rendement couplés à
deux filtres à sable (RA-FS) à fonctionnement alterné. Cette alternance d’alimentation du
filtre vise à éviter le colmatage. Cette filière de traitement est similaire à la fosse septique

Résumé substantiel en Français
viii
conventionnelle mais en diffère en raison de la collecte du biogaz et de la qualité potentielle
de ses effluents. Par conséquent, cette technologie pourrait être une meilleure variante de
la fosse septique standard.
Objectifs de l’étude
L’objectif général de cette thèse est d'optimiser l’efficacité épuratoire du système de
traitement des eaux usées domestiques sous le climat sahélien chaud et sec de
Ouagadougou par deux Réacteurs Anaérobies à haut rendement suivis de deux options de
post-traitement : Bassin Lamellé et Filtre à Sable. Ainsi, cette étude contribuera à atténuer
l’impact des rejets des ouvrages d’assainissement autonome sur la qualité des ressources en
eau et celle de l’environnement, tout en remediant aux problèmes de santé publique.
Objectifs spécifiques
De façon plus spécifique, il s’agit :
de concevoir, mettre en œuvre et évaluer la performance épuratoire des technologies
alternatives novatrices et durables à une échelle pilote, en terme d’élimination des
matières organiques, des nutriments et des agents pathogènes pour les communautés à
revenues limitées du Sahel;
d’évaluer la performance hydraulique du bassin lamellé comparée au bassin sans
lamelle;
de comprendre l’absence d'Escherichia coli dans l’effluent du bassin lamellé ;
d’évaluer la biodiversité algale et zooplanctonique développée sur les bouchons de
bouteilles en plastique fixés aux lamelles et dans la colonne d'eau du bassin lamellé ;
d’estimer le potentiel de production du biogaz, sa composition et le taux d'accumulation
des boues dans les deux réacteurs anaérobies à haut rendement.
Portée de l’étude
Le document de thèse est structuré en 7 parties :
La première partie est une introduction générale sur l'importance du traitement des eaux
usées et leurs réutilisations pour une gestion durable de l'environnement dans le contexte
Africain. Elle présente un aperçu des principales options de traitement des eaux usées, avec
un accent particulier sur les options à faible coût, leurs limites et les différentes
combinaisons de procédés anaérobie et aérobie. En outre, elle décline les objectifs et
justifie le choix du thème.
La deuxième partie détaille les différents aspects pris en compte dans la conception et la
mise en œuvre du projet pilote. Cette partie présente également les résultats de
l'évaluation de la performance épuratoire de deux options de traitement, en faisant varier
les temps de séjour hydraulique des deux réacteurs anaérobies à haut rendement. Les
résultats sont analysés et comparés à ceux obtenus dans la littérature.

Résumé substantiel en Français
ix
La troisième partie compare les résultats de la caractérisation hydraulique du bassin lamellé
à ceux du bassin sans lamelle (témoin) à travers un test de traçage au chlorure de sodium.
En outre, elle se concentre sur les caractéristiques et les modèles hydrauliques qui
pourraient être appliqués dans la prédiction de la performance des bassins en termes
d'élimination de la matière organique et des agents pathogènes.
La quatrième partie met en évidence les mécanismes d’élimination des Escherichia coli au
niveau du bassin lamellé. En outre, les taux d’inactivation d'E. coli dans les deux bassins ont
été déterminés sur la base du modèle hydraulique obtenue à partir de l'essai de traçage
(partie 3). L'importance des lamelles est également décrite dans cette partie.
La cinquième partie se concentre principalement sur les caractéristiques du biofilm qui s’est
formé dans le bassin lamellé, en termes de répartition de la biomasse algale, la diversité
microbienne, et la composition des espèces de zooplancton et leur distribution dans la
colonne d'eau et sur les médias des lamelles. En outre, un outil statistique d’analyse en
composantes principales, a été utilisé pour mettre en exergue les corrélations entre les
phytoplanctons, les zooplanctons, les bactéries et les matières en suspension.
La sixième partie présente et discute de la possibilité de la production de biogaz, sa qualité,
et le taux d'accumulation des boues dans les deux réacteurs anaérobies à haut rendement.
Enfin, la septième partie de cette thèse se termine par quelques conclusions générales, ainsi que des perspectives pour l'avenir de l'assainissement décentralisé en Afrique.
Méthodologie
Conception et mise en œuvre des deux filières de traitement
Les principes de base qui ont guidé à la conception des deux étages de réacteurs anaérobies
à haut rendement suivis de deux options de post-traitement (Bassin Lamellé et Filtre à
Sable) sont ainsi résumés:
une combinaison optimale des procédés de traitement à faible coût ; anaérobie et
aérobie, à partir de laquelle des effluents de haute qualité peuvent être obtenus
permettant également la récupération de l’eau, des nutriments et la valorisation
énergétique ;
les unités de traitement choisies devraient être adaptées au contexte local tout en
considérant des matériaux de construction disponibles localement;
le système anaérobie a été conçu sur la base des concepts de bassin anaérobie, réacteur
anaérobie à flux ascendant (UASB : upflow anaerobic sludge blanket) et de fosses
septiques, puis l'option optimale a été adoptée;
la station pilote a été conçue pour servir la communauté urbaine à faible revenu avec
environ 50 équivalents habitants et chaque individu pourrait générer 40 litres d’eau
usée par jour (Maiga et al. 2014) ;

Résumé substantiel en Français
x
initialement, un débit journalier de 1 m3 a été considéré, puis il a été augmenté
progressivement à 1,5 m3 afin de déterminer l'état optimal de fonctionnement de la
station pilote ;
une température moyenne pour le mois le plus froid de 25 0C a été adoptée;
une concentration dans l’influent brut en coliformes fécaux de 106 UFC / 100 mL et la
demande biochimique en oxygène (DBO) de 250 mg / L ont été supposées (Maiga et al.
2006);
trois lamelles verticales avec 70 % de la longueur de la profondeur du bassin ont été
adoptées ;
une vitesse d’infiltration de 0,02 m par heure pour une superficie maximale de lit de
sable de 1 m2 a été adoptée pour la conception du filtre à sable ;
La combinaison de ces critères a abouti à la mise au point de deux filières de technologies à
faible coût destinées aux communautés aux revenus limités dans un climat Sahélien. Cette
technologie est dénommée : Deux-étages de réacteurs anaérobies à haut rendement suivis
d’une part, par un Bassin Lamellé avec des bouchons en plastique fixés aux chicanes et
d’autre part, par deux lits de filtration à sable à fonctionnement alterné. Les filières de
traitement ainsi conçues ont été installées au sein du campus de l’Institut International
d’Ingénierie de l’Eau et de l’Environnement (2iE) à Ouagadougou au Burkina Faso.
Suivi de la performance épuratoire des deux filières de traitement
La recherche est menée à l'échelle pilote. La station pilote a été exploitée sous deux
conditions dénommées période 1 (P1) et période 2 (P2). Au cours de P1, du 8 mai 2013 au 6
mai 2014, un débit journalier de 1 m3 était pompé de façon intermittente en trois moments
(à 8 h: 00, 13 h : 00 et 17 h : 00). Les temps de rétention hydraulique théorique (TRH) du
premier réacteur anaérobie (R1), du second réacteur anaérobie (R2) et du bassin lamellé
(BL) pendant P1 étaient respectivement de 1,5 ; 1,5 et 7 jours, tandis que le temps
d'infiltration du filtre à sable (FS) était d'environ 5 minutes. Il convient de noter qu'au cours
de P1, le bassin témoin (BT) n'a pas encore été construit. Durant P2, du 13 mai 2014 au 12
mai 2015, le débit journalier de l'influent des eaux usées a été porté à 1,5 m3 par jour en 3
fois (à 8h : 00, 13 h : 00 et 17 h : 00). Par conséquent, les TRH de R1 et R2 ont été réduits à 1
jour chacun, alors que celui de BL a été maintenu à 7 jours. D'autre part, le BT a été mis en
service, tandis que la surface filtrante du filtre à sable a été réduite de moitié. L'objectif
principal visé par l’augmentation de débit de l'influent était de réduire la surface du lit du
filtre à sable mais aussi d'estimer les conditions optimales de fonctionnement de la station
pilote.
Les prélèvements ont été effectués de façon ponctuelle entre 8 h et 9 h. Des mesures
d'indicateurs de qualité des eaux ont été effectuées pendant deux ans sur des échantillons
prélevés suivant une fréquence hebdomadaire. Les échantillons ont été prélevés au point de
l’entrée de l’influent noté EB (eaux brutes), à la sortie de R1, R2, BL, FS et BT afin d’évaluer
la performance épuratoire à chaque étape de traitement, de même que l’ensemble des
deux options. Les échantillons destinés aux analyses physico-chimiques ont été collectés

Résumé substantiel en Français
xi
dans des flacons de 500 ml en polyéthylène et les échantillons réservés pour les analyses
bactériologiques ont été prélevés dans des flacons en verre borosilicaté de 500 ml
préalablement stérilisés à 150 °C pendant une heure. Les échantillons prélevés ont été
immédiatement rangés dans une glacière et conservés à une température de 4 °C, puis sont
transportés au laboratoire 2iE pour les analyses avant 24 heures selon la méthode standard
APHA (2012).
Etude de la stratification de la biomasse du bassin lamellé
Pour étudier la stratification qui se développe dans le bassin lamellé, quelques paramètres
physico-chimiques et bactériologiques ont été analysés in situ et au laboratoire en utilisant
la méthode standard APHA (2012). Le pH, l’oxygène dissous, la température, la conductivité
électrique, la DCO, la Chlorophylle (a) et les coliformes fécaux dont E. coli étaient les
paramètres considérés. Les paramètres in situ (pH, température oxygène dissous, et la
conductivité) ont été mesurés à sept (7) différents niveaux (15, 30, 45, 60, 75, 90 et 105 cm
de profondeur) par compartiment et ceux-ci trois (3) fois par jour. Les échantillons destinés
aux analyses du laboratoire ont été prélevés respectivement à 15 ; 60 et 105 cm de
profondeur dans chaque compartiment du bassin une fois dans la semaine.
Quantification et distribution de la biomasse planctonique et sessile sur les chicanes et les bouchons du bassin lamellé
Après deux années de fonctionnement, l’échantillonnage pour la quantification et la
distribution de la biomasse planctonique et sessile a été fait de façon ponctuelle entre 08h :
00 et 09h : 00 à trois profondeurs différentes (15, 60 et 90 cm) dans la colonne d'eau et
dans chaque compartiment (A, B, C et D) du bassin lamellé. Ensuite, une seconde étape
d’échantillonnage a été menée immédiatement après avoir soigneusement vidé le bassin
lamellé. La biomasse amassée sur les parois (longitudinales et transversales) du bassin et les
trois lamelles immergées (les deux faces avec les bouchons) a été collectée par raclage
minutieux à l’aide des spatules sur une surface de 0.01 m2 à des profondeurs de 15 cm, 60
cm et 90 cm. Les échantillons ont été recueillis et conditionnés dans des bouteilles en verre
borosilicaté puis transportés au laboratoire. En plus des paramètres in situ (pH, température
oxygène dissous, et la conductivité), le poids sec, le poids humide du biofilm, la chlorophylle
a, les matières en suspension, la biomasse microbienne (bactérienne et fongique) et la
biomasse zooplanctonique ont été analysés.
Les échantillons de plancton récoltés ont été analysés au Laboratoire de Biologie et Ecologie
Animale (LBEA) de l’Université de Ouagadougou (Burkina Faso). Les observations ont été
faites dans un volume de 0,5 ml d’échantillon et analysés entre lame et lamelle au
microscope optique. L’opération de comptage a été répétée quatre (04) fois pour le même
échantillon pour optimiser la qualité des résultats. Des clés de détermination et des
catalogues d’identification ont été utilisés pour identifier les spécimens rencontrés. Ce sont
ceux de Koste et Voigt (1978) ; Pontin (1978) ; de Pourriot (1980) et Hamadi et al, (2011)
pour les Rotifères. Dussart (1980) pour les copépodes et les ouvrages de références: Korinek

Résumé substantiel en Français
xii
(1984), Notemboomram (1981), Rey et Saint-Jean (1980), Amoros (1984) pour les
Cladocères.
Accumulation de boues dans R1, R2 et BL
La répartition des boues accumulées au fond des réacteurs anaérobies à haut rendement
(R1 et R2) et du bassin lamellé (BL) a été définie par la méthode de serviette blanche dite
« White Towel ». La méthode consiste à introduire verticalement au fond des réacteurs,
une tige en bois enrobée d’une serviette blanche. L’épaisseur de boue mesurée est
clairement visible sur le tissu de la serviette après l’avoir doucement retiré des eaux usées.
Un décamètre a été utilisé pour mesurer l’épaisseur de boue correspondante (Llyod &
Vorkas, 1999; Mara, 2004; Konate et al, 2013). Grace aux coordonnées des points
d’échantillonnage et la version 8 du logiciel Surfer, la distribution spatiale des boues en 3D
au fond du bassin a été reproduite.
Collecte et analyse de biogaz
La production du biogaz a été mesurée quotidiement à partir d’un dispositif de collecte de
biogaz de forme géométrique assimilé à un cylindre ayant un volume de 0,024 m3, lequel
ètait soutenu par une tige coulissant verticalement à l’aide d’un ressort. Ainsi, le collecteur
remonte à la surface de l’eau grâce à la pression qu’exerce le biogaz sur le ressort sensible à
cette poussée de gaz. Une fois le collecteur est en surface de l’eau, la lecture du volume de
biogaz peut se faire à l’aide de la graduation sur le collecteur. Ainsi, le volume du gaz
collecté après 24 h a été mesuré avec une échelle graduée qui a été établie au-dessus du
collecteur. De plus, le volume du biogaz collecté a été corrigé à 20°C et à la température de
1 atm suivant la formule des gaz parfaits PV= nRT.
GA 5000 est l’appareil utilisé pour mesure la composition du biogaz dans les deux réacteurs
R1 et R2. En effet, les analyseurs de gaz de la série 5000 (GA 5000) sont conçus pour
mesurer la qualité des gaz des sites d'enfouissement et d'autres sources (digesteurs
anaérobies), et le matériel est certifié uniquement pour une utilisation à température
ambiante comprise entre -10 ºC et +50 ºC et ne doit pas être utilisé en dehors de cette
plage. Il convient de noter que la pression d'entrée ne doit pas dépasser +/- 500 mbar par
rapport à la pression atmosphérique et la pression de sortie ne doit pas dépasser +/- 100
mbar par rapport à la pression atmosphérique. La calibration de l’appareil a été effectuée
par différents types de gaz que l’on peut lire à l’écran, ce sont le méthane (CH4), le dioxyde
de carbone (CO2), l’hydrogène sulfurique (H2S) et autres gaz.
Résultats et Discussion
Caractéristiques des eaux usées brutes et des effluents traités
Les caractéristiques de l'influent brut admis en tête de la station pilote et les effluents de
chaque procédé de traitement, ainsi que les charges organiques volumiques / surfaciques
qui ont été analysées pour les 2 ans de fonctionnement sont conformes aux données de

Résumé substantiel en Français
xiii
littérature (Metcalf et Eddy, 2003; von Sperling et Chernicharo, 2005; Henze et al. 2008;
Khan et al. 2013).
Les valeurs d’E. coli en moyenne 107 UFC /100 ml dans les eaux usées brutes pour les
périodes 1 et 2 restent dans la gamme des valeurs de référence pour les eaux usées
d'origine domestique (Metcalf et Eddy, 2003). Cependant, durant ces deux périodes de
suivi, une forte variabilité d’E. coli et des coliformes fécaux a été observée dans l'influent
brut et dans les effluents de chaque procédé de traitement, à l'exception de l’effluent du
Bassin lamellé où aucune souche d’E. coli n’été détectée. Cette situation de forte variabilité
pourrait s’expliquer par l'incidence des personnes infectées dans la communauté (campus
2iE), la saison de l'année (chaud ou froid), la période et la méthode d'échantillonnage
(échantillonnage ponctuel aux heures de pointe entre 8 h : 00 et 9 h : 00 ), le statut socio-
économique des populations qui contribuent à la production d'eaux usées, la faible
consommation d'eau par habitant, tel que discuté amplement par Oliveira et von Sperling
(2006) et Henze et al. (2008).
Dans le même temps, les valeurs moyennes de DCO, DBO5 et MES des eaux usées brutes
pour les périodes 1 et 2 ont été estimées à 424 et 425 mg/l, à 252 et 255 mg/l, et à 148 et
134 mg/l respectivement. Il en résulte que ces valeurs sont en deçà des gammes
habituellement espérées dans les eaux usées domestiques des pays en voie de
développement (Metcalf et Eddy, 2003 ; von Sperling et Chernicharo, 2005; Henze et al,
2008; Khan et al, 2013). Cela pourrait s’expliquer par l’effet de dilution des eaux usées du
campus de 2iE, car aucun dispositif économiseur d'eau n’était en cours d’utilisation.
Cependant, ces résultats montrent un rapport de DCO/DBO5 < 2, d’où ces eaux usées
d'origine domestique sont facilement biodégradables (Metcalf et Eddy, 2003). Par ailleurs,
de forte variations de DCO, DBO5 et MES a été observée à chaque niveau du processus de
traitement et pour les deux périodes, ce qui reflète une bonne réponse de la station pilote.
Par exemple, les coefficients de variation de la DCO, DBO5 et MES des eaux usées brutes au
cours de la période 1 étaient respectivement de 47 %, 34 % et 55%. Ce constat est confirmé
par des études antérieures menées par Maiga et al. (2006) et Konaté et al. (2013) sur le
même site d’étude. Toutefois, cette situation peut s’expliquer par les activités au sein du
campus, marquée par la mobilité du personnel et des étudiants.
La variation des valeurs de la température, de l’oxygène dissous et du pH dans les eaux
brutes et à la sortie de point des unités de traitement, sont dans la gamme favorable au bon
développement des microorganismes épurateurs de la matière organique (Metcalf et Eddy,
2003). En outre, les pH des deux réacteurs anaérobies sont dans l’intervalle favorable au
développement des bactéries méthanogènes (Peña, 2002; Foresti et al. 2006). Cependant, le
pH reste élevé (entre 8 et 9,8 pour les périodes 1 et 2) dans l’effluent du bassin lamellé, qui
est le résultat de la symbiose algues microorganismes (Curtis et al. 1992; Kayombo et al.
2002). Contrairement au bassin lamellé, des faibles valeurs de pH (entre 3,9 et 6,7 durant P1
et P2) ont été obtenus dans l’effluent du filtre à sable. Cela peut être dû à l'alimentation

Résumé substantiel en Français
xiv
intermittente et à la libération des H+ qui acidifient le milieu et réduit le pH durant de la
forte nitrification observée dans le filtre à sable (Metcalf et Eddy, 2003).
Par ailleurs, la valeur de la température moyenne de l'influent brut est passée de 29 à 31 °C
à la fois dans R1 et R2, puis a été réduite à 28 °C dans le filtre à sable et le bassin lamellé. Par
conséquent, l'utilisation de réacteurs anaérobies peints en noir dans le climat ensoleillé du
Sahel a entraîné une augmentation de la température de 2 °C durant toute l'année.
Des faibles valeurs d'oxygène dissous avec une faible variabilité ont été enregistrées dans
les eaux usées brutes et les effluents de R1 et R2 ; ce qui démontre les bonnes conditions
anaérobies de ces réacteurs. En revanche, des valeurs élevées d'oxygène dissous ont été
observées à la fois dans le filtre à sable et dans le bassin lamellé pendant les deux périodes
de suivi. Toutefois, cette situation peut s’expliquer par l’activité photosynthètique des
algues et l’aération induite par la disposition des chicanes dans le bassin. Ces résultats sont
conformes à ceux des études de Olukanni et Ducoste (2011) et Bolton et al. (2010). Dans le
cas du filtre à sable, ces valeurs pourraint être liées à la ré-oxygénation des pores du sable
entre les alimentations (en moyenne 5 heures), ce qui donnerait suffisamment de temps
pour drainer le filtre.
Les concentrations moyennes en NH3 -N dans les eaux usées brutes sont passées de 36 à 38
mg/l dans R1, puis ont diminué légèrement à 37 dans R2. Ces valeurs croissantes sont
semblables à celles trouvées par Foresti et al. (2006) qui ont rapporté des valeurs de 30 mg/l
dans l’influent brut et 50 mg/l de NH3-N dans l’effluent d’un réacteur anaérobie. Khan et al.
(2013) ont expliqué que cette augmentation de NH3-N pourrait être due à l'hydrolyse de
l'azote organique dans le processus anaérobie. En revanche, dans le bassin lamellé, les
concentrations de NH3 -N sont subitement passées de 37 mg/l dans l'influent à 5 mg/l dans
l’effluent. Camargo-Valero (2008) a constaté que, selon les caractéristiques des bassins de
lagunages et des conditions climatiques locales, les mécanismes et les voies par lesquelles
l'azote sous ses diverses formes est éliminé pourrait être attribué à la volatilisation de
l'ammoniac, à la sédimentation de l'azote organique par l'intermédiaire de l'absorption
biologique, à sa rétention dans les boues au fond du bassin, à la nitrification – dénitrification
et à l’assimilation du nitrate et de l'ammoniac par les algues. Cependant, des études menées
ulterierement ont montré que seulement 2% de l'azote ammoniacal global pourrait être
éliminé par volatilisation (Camargo-Valero et Mara, 2007a, 2010; Assunção et von Sperling
2012; Bastos et al. 2014).
De cette étude, il apparaît que les concentrations de nitrates dans les eaux usées brutes à la
fois pour P1 et P2 respectivement de 3,5 et 4,7 mg/l ont été successivement réduites à 2,6
et 3 mg/l dans R1, à 1,7 et 2 mg/l dans R2, et 1,06 à 1,02 mg/l dans le bassin lamellé. Les
causes possibles peuvent être des nitrates qui ont été transformés par d'autres organismes
présents dans les unités de traitement sous d’autres formes d'azote (Metcalf et Eddy, 2003;
Camargo-Valero, 2008; Babu, 2011). Contrairement au bassin lamellé, les concentrations de
nitrates ont augmenté de manière significative de plus de 34 et 49 fois respectivement
pendant les périodes 1 et 2 dans le filtre à sable. Ce fait pourrait être dû à l’alimentation

Résumé substantiel en Français
xv
intermittente où à une importante ré- oxygénation qu’a lieu dans le milieu poreux entre les
deux alimentations du filtre à sable.
Similairement à NH3-N, les concentrations d'ortho phosphate pour les deux périodes ont
augmenté successivement de 9,9 et 10,5 mg/l de l’influent brut, à 12,2 et 12,9 mg/l dans
l’effluent R1, et à 14,9 et 13,9 mg/l dans l’effluent R2. Cependant, dans les deux post-
traitements aérobies (BL et FS), les concentrations en ortho phosphates sont réduites à 3,8
et 5,2 mg/l respectivement pendant P1. Les mécanismes d'élimination pourraient être dus à
des activités microbiennes selon les conditions d'anaérobiose suivi d’aérobiose (Henze et al.
2008; Khan et al. 2013).
En résumé, les analyses statistiques ont montré que la diminution du temps de séjour
hydraulique de 1.5 jours à 1 jour dans les réacteurs anaérobies a une influence sur les
concentrations des effluents de ces réacteurs. Statistiquement, il y avait de différence
significative entre les deux filières de traitement RA-BL et RA-FS et entre les deux périodes
(p> 0,05), en matière de concentrations en MES, DBO5, NH3-N, NO3-N, PO4-P et E. coli sauf
pour DCO.
Performances épuratoires de la station pilote
Après deux années de fonctionnement, les rendements épuratoires moyens obtenus
montrent une bonne élimination de la pollution organique et des particules en suspension :
79%, 81% et 72% dans la filière RA-BL contre 84%, 88% et 88% dans la filière RA-FS
respectivement en DCO, DBO5 et MES. En termes d’abattement microbien, les deux options
se révèlent plus efficace : 6 et 5 unités log d’élimination d’Escherichia coli respectivement
pour RA-BL et RA-FS. La filière RA-BL élimine 84% de NH3-N tandis que RA-SF ne peut abattre
que 64%. En outre, ces rendements moyens d'abattement de la pollution sur la période de
suivi étaient dans la gamme rapportée par d’autres auteurs avec des options de traitement
dans des conditions climatiques similaires (Kilani et Ogunrombi, 1984; von Sperling et al.
2002, 2003; Shilton et Mara, 2005; Banda, 2007).
Les analyses statistiques ont révélé qu’il y avait de différence significative entre les deux
filières de traitement RA-BL et RA-FS et entre les deux périodes (p> 0,05), en matière de
rendements épuratoires pour la plupart des paramètres qui ont été analysés, à l'exception
de la DCO. Les concentrations résiduelles en matières organiques et pathogènes de
l'effluent traité répondent aux normes recommandées par l’Organisation Mondiale de la
Santé (OMS, 2006) pour une réutilisation des effluents en agriculture non restrictive. Au
vue, de cette bonne performance épuratoire, ces deux options de traitement peuvent être
considérées comme des technologies alternatives de traitement des eaux usées à faible
coût pour les populations à faible revenu dans les zones urbaines et péri-urbaines en
Afrique Subsaharienne.
Performance hydraulique du bassin lamellé comparée au bassin sans lamelle
Les essais de traçage ont été effectuées sur le bassin lamellé (BL) et le bassin sans lamelle
(BT) en utilisant comme traceur le sel de cuisine, afin de déterminer avec les courbes de

Résumé substantiel en Français
xvi
restitution, le temps de séjour hydraulique réel, la vitesse d’écoulement des eaux usées, le
coefficient de dispersion, l’efficacité volumétrique et le modèle hydraulique de chacun des
bassins. En outre, cette étude a été réalisée pour confirmer l'effet des lamelles avec des
bouchons en plastique fixés sur la performance hydraulique d’un bassin lamellé (trois
lamelles verticales contrecourant) dans le contexte Sahélien.
Les temps de séjour hydraulique réel moyen étaient 4,1 et 3,2 jours respectivement pour BL
et BT, contre un temps de séjour hydraulique théorique de 6,6 jours. Ceci a montré que
l'introduction de trois lamelles verticales contre-courant dans un bassin recevant les
effluents de deux réacteurs anaérobies pourrait augmenter le temps de séjour moyen
d'environ 1 jour, c’est-à-dire une augmentation d’environ 22% du temps de séjour
hydraulique réel. L’efficacité volumétrique du bassin lamellé était de 62 %, une zone
inactive ‹‹morte›› de 38 % et un coefficient de dispersion de 0.53, contre une efficacité
volumétrique du bassin témoin de 49 %, une zone inactive ‹‹morte›› de 51 % et un
coefficient de dispersion de 0.66. Ces résultats sont en accord avec ceux rapportés par de
Babu (2011) et Shilton et Harrison (2003) en terme de dispersion élevée et d’augmentation
du temps de séjour.
Les études hydrodynamiques effectuées sur le bassin lamellé et le bassin sans lamelle de la
station pilote ont montré que l'écoulement était du type de réacteur complètement mixte
en série et dispersif. Ce qui a permis de déduire que les modèles dispersifs sont plus
appropriés pour non seulement simuler le comportement du bassin lamellémais aussi
prédire ces performances épuratoires. Par conséquent, ces résultats montrent qu'il existe
un potentiel important de réduire l’emprise sur le terrain des ouvrages d’où le coût de la
technologie.
Distribution et abattement d'Escherichia coli dans le bassin lamellé
Cette étude de la distribution et de l’abattement d'Escherichia coli dans le bassin lamellé
(BL) révèle de manière générale, une charge très faible en coliformes fécaux à la surface du
bassin et une charge relativement élevée au fond du bassin et ceci est observable dans tous
les compartiments du bassin. Une décroissance successive de la charge bactérienne
s’observe lorsque l’effluent passe d’un compartiment à un autre jusqu’à atteindre une
valeur nulle en E. coli à la surface du dernier compartiment du bassin. En effet, il a été
constaté que les concentrations de E. coli étaient plus faibles dans les couches supérieures
de l'ensemble des quatre compartiments du BLavec un niveau indétectable (<1 UFC/100 ml)
dans le dernier compartiment jusqu'à une profondeur de 0,60 m. Cette évolution de E. coli
dans BL a confirmé les résultats de l'étude précédente sur le suivi de la performance
épuratoire où E. coli n’a pas été détecté dans l’effluent du basin durant toute la période
d’étude. En outre, ces résultats ont révélé l’avantage de recueillir à la surface les effluents
d’un bassin (qualité de l’effluent).
Par ailleurs, il a été constaté qu'il y avait une différence significative dans le coefficient du
taux d’abattement d’E. coli entre le bassin lamellé et celui sans lamelle. Cela impliquait que

Résumé substantiel en Français
xvii
les lamelles avec les bouchons en plastique pourraient avoir un rôle important dans non
seulement, l’amélioration de l’hydrodynamisme du bassin, mais aussi dans l'abattement d’E.
coli. La sédimentation combinée avec les effets synergétiques d’autres facteurs
environnementaux, physiques, chimiques et opérationnels (intensité du rayonnement
solaire, la température, pH, oxygène dissout, profondeur du bassin, biomasse algale, limite
en nutriments, hydrodynamique etc…) pourraient être responsable de l'abattement d’E. coli
dans ce système (Kilani and Ogunrombi, 1984; Curtis et al. 1992; Davies-Colley et al. 1999;
van der Steen et al. 2000; Oragui, 2003; von Sperling et al. 2003; von Sperling, 2005; Abis et
Mara, 2006; Davies et al. 2009 ; Maïga et al. 2009; Nelson et al. 2009 ; Bolton et al. 2010;
Buchanan et al. 2011; Ukpong, 2013; Ouali et al. 2012, 2014).
Biodiversité algale et zooplanctonique développée sur les bouchons en plastique fixés
aux lamelles et dans la colonne d'eau du bassin lamellé
Les biofilms adhérés sur les lamelles, les murs intérieurs du bassin, les bouchons et dans la
colonne d’eau ont été quantifiés en matière sèche. Cette adhésion et suspension varient
considérablement selon les profils profondeurs (de la surface vers le fond du bassin) et les
profils longitudinaux (d’entré vers la sortie du bassin). La densité du biofilm était plus élevée
à la surface et décroit progressivement vers le fond du bassin et vers la sortie du bassin. Les
densités moyennes étaient décroissantes selon les profondeurs respectivement de 370
g/m2 à 0.1 g/m2 sur les lamelles. En plus on observe que le biofilm est dense sur la Face B
(contre-courant) des lamelles que celle de la face A (co-courant). Ces résultats sont en
conformité avec les études menées par Babu (2011) sur l’effet des lamelles sur la structure
de biofilm algal-bactérien dans un bassin lamellé. Le degré d’adhésion des biofilms dépend
de plusieurs facteurs dont la composition du biofilm, la nature de support, les facteurs
environnementaux, mais aussi le type des eaux usées (Characklis et al. 1990; Esterl et al.
2003; Babu, 2011; Paul, 2012).
En revanche en comparant la biomasse en suspension dans la colonne d'eau avec celle
adhérée sur les lamelles, il était évident de constater que celle adhérée (1,5 kg de biomasse)
était 36 fois plus importante que celle dispersée dans l'eau (0,04 kg de biomasse). Par
conséquent, l'introduction de trois lamelles verticales contre-courant dans un bassin
recevant les effluents de deux réacteurs anaérobies à haut rendement pourrait engendrer
une augmentation d’environ 267 % la biomasse épuratrice dans un contexte sahélien. Ainsi,
cette situation corrobore avec les résultats sur la bonne performance épuratoire du bassin
lamellé démontrée plus haut.
Après le dépouillement des échantillons pour les zooplanctons, un total de 19 taxa ont été
recensés. Ces organismes planctoniques appartiennent à 9 familles que sont : la famille des ;
Daphnidae, Moinidae, Sididae, Cyclopidae, Diaptomidae qui font partir de la classe des
Crustacés. Puis les familles des Brachionidaes, Testudinellidae, Asplanchnidae, Lecanidae,
qui sont des rotifères. De l’analyse quantitative et qualitative de ces échantillons, les
Rotifères, les Copépodes, les Cladocères et des ostracodes ont été identifiés comme étant
les grands groupes zooplanctoniques qui composent la faune aquatique. D’un point de vue

Résumé substantiel en Français
xviii
richesse spécifique, les Rotifères (14 Taxa) dominent le peuplement zooplanctonique
comme dans la plupart des eaux douce, suivi des Cladocères (4 Taxa), puis viennent les
Copépodes (2 Taxa) avec une densité élevée des Nauplii et des Copépodites. Ces résultats
sont similaires à ceux rapportés par (Ouéda et al. 2010) dans deux lacs de barrages ruraux et
(Ouédraogo, 2013) dans des réservoirs urbains au Burkina Faso qui malgré les différentes
pressions exercées sur les hydro systèmes, ces organismes sont présents avec des richesses
spécifiques assez importantes. La dominance des rotifères s’expliquent par le fait qu’ils ont
une grande capacité d’adaptation, ils s’adaptent mieux au milieu pollué (Hamaidi et al.
2008). Les rotifères sont des organismes microscopiques répandus dans les eaux douces et
saumâtres. Ces organismes sont quantitativement dominants dans les communautés zoo-
planctoniques des lacs et des parties calmes des rivières en raison de leur reproduction
parthénogénétique et leur cycle de développement de courte durée. Beaucoup d’espèces
de ce groupe du genre brachionus et keratella sont utilisées dans les fermes aquacoles pour
l’alimentation des alevins (Ouéda et al. 2010).
Les analyses des principales composantes du bassin lamellé pilote et expérimental montre
un écosystème viable où l’on retrouve une stratification décroissante de la biomasse algale,
bactérienne, fongique et zooplanctonique. Les paramètres physico-chimiques tels que le
pH ; la température et l’oxygène dissous conditionnant les réactions physico-chimiques et la
survie des micro-organismes sont fortement corrélés à la biomasse. Les corrélations établies
entre certains groupes de la flore bactérienne et les matières en suspension semblent
correspondre au phénomène d’adsorption des bactéries par la matière en suspension décrit
dans la littérature. La distribution de l’activité symbiotique (Algale-bactérienne) et
parasitaire (phytoplancton-zooplancton) a montré que les lamelles ont eu un effet sur la
qualité de l'eau et l'écologie du bassin.
Production et composition de biogaz dans les deux réacteurs anaérobies à haut
rendement
La production moyenne journalière du volume de biogaz enregistrée par le premier réacteur
anaérobie à haut rendement (R1) était de 107± 17 litres soit un volume surfacique de 9,7±
1,5 L/m2 par jour, où 2,5 L/g de matières volatiles solides (MVS) éliminées. Quant au second
réacteur anaérobie à haut rendement (R2) connecté en série à (R1), la production moyenne
journalière du volume de biogaz de ce réacteur était de 105±14 litres soit un volume
surfacique de 9,5± 1,4 L/m2 par jour, où 1,8 L/g de matières volatiles solides (MVS)
éliminées. La quantité de biogaz enregistrée dans R1 est supérieure à celle de R2, cela
pourrait s’expliquer par le fait que R1 était placé en tête du traitement avec une forte
charge organique comparé à R2. Bien que les taux de production de biogaz fussent plus
élevés en R1 qu’en R2, les analyses statistiques ont montré qu’il n’y avait pas de différence
significative entre ces deux réacteurs (p> 0,05). En outre, ces taux de production de biogaz
restent faibles comparativement à ceux rapportés par Konaté et al. (2013) obtenu à partir
d’un anaérobie dans des conditions climatiques similaires. Cette différence pourrait
s’expliquer par les facteurs environnementaux, les conditions opérationnelles : telles que la

Résumé substantiel en Français
xix
charge organique, le temps de séjour etc...(El-Fadel et Massoud, 2001; Stadmark et
Leonardson, 2005).
La composition moyenne du biogaz enregistrée durant toute la période de suivi des deux
réacteurs anaérobies est donnée comme suit :
54% ± 10 méthane, 6% ± 1 du dioxyde de carbone, 8 % ± 2 N2 et 32 % d'autres gaz (H2,
H2S, H2O, ...) pour R1 ;
44% ± 5 méthane, 12% ± 2 dioxyde de carbone 9 % ± 1 N2 et 34 % d'autres gaz (H2, H2S,
H2O, ...) pour R2
La teneur en méthane était plus élevée dans R1, éventuellement en raison de la charge
organique et température interne plus élevées que celles de R2. La teneur en H2S du biogaz
était très faible voir négligeable (1 ppm et de 0 ppm dans R1 et R2 respectivement). En effet,
Konaté et al. (2013) a attribué ce fait à la rareté des sulfates dans les eaux usées domestique
au Burkina Faso. D'autre part, la teneur des autres gaz n’était pas négligeable, puisque
environ 32 % du biogaz était attribué à d'autres gaz, tels que H2, H2O. Cela pourrait
s’expliquer par les processus de dénitrification et d’autres facteurs environnementaux et
conditions opérationnelles. Cependant, la teneur en méthane reste dans la gamme des
valeurs de référence des eaux usées d'origine domestique (Hodgson et Paspaliaris, 1996;
Kotsyurbenko et al. 2004).
Taux d'accumulation de boues de deux réacteurs anaérobies à haut rendement et du
bassin lamelle
Les taux d’accumulation de boues très faibles ont été enregistrés dans les deux réacteurs
anaérobies à haut rendement et dans le bassin lamellé : 0,0006 ; 0,0002 et 0,0014 m3 de
boue per habitant et par an respectivement. Ces taux d'accumulation de boues restent très
faibles comparés aux gammes de valeurs rapportées dans la littérature (Gomes de Souza,
1987; Mara et Pearson, 1998; Keffala et al. 2011; Picot et al. 2005) et même celles de
conditions climatiques similaires (Nelson et al. 2004; Konaté et al. 2010, 2013).Cette faible
production de boues pourrait être due à la forte biodégradabilité des eaux usées
domestiques, combinée avec les conditions climatiques favorables (températures
mésophiles constants dans le Sahel). Cette configuration de deux réacteurs anaérobies à
haut rendement connectés en série, puis suivis par un bassin lamellé avec des bouchons en
plastique fixés aux chicanes offre une excellente option de traitement des eaux usées
domestiques qui minimise la production de boues, d’où pourrait réduire son coût de
fonctionnement et d'entretien.
Conclusion
Cette étude a permis de concevoir, de mettre en œuvre, d’optimiser et de suivre les
performances épuratoires de deux filières de traitement des eaux usées domestiques sous
le climat sahélien de Ouagadougou au Burkina Faso. Les résultats présentent des
rendements épuratoires très satisfaisants pour l'élimination des matières organiques, des
matières en suspension, des pathogènes et des nutriments. En outre, cette étude a montré

Résumé substantiel en Français
xx
que l'introduction de trois lamelles verticales (avec les bouchons en plastique fixés aux
lamelles) contrecourant dans un bassin (BL) recevant les effluents de deux réacteurs
anaérobies pourrait avoir un rôle important dans non seulement l’augmentation du temps
de séjour hydraulique, la diversité écologique, l’accroissement de la biomasse épuratrice
(267%), mais aussi dans l'abattement des bactéries (E. coli).
En plus, les deux réacteurs anaérobies à haut rendement (R1 et R2) en tête du traitement de
ces deux filières ont démontré une capacité importante de production de biogaz tant en
quantité qu’en qualité sous climat Sahélien. Plus important encore, l’accumulation de boues
très faible a été enregistrée respectivement dans R1, R2, et BL : 0,0006 ; 0,0002 et 0,0014
m3 de boues par habitant par an, réduisant ainsi le coût de son extraction et de sa gestion.
Il ressort de cette étude que les concentrations résiduelles en matières organiques et
pathogènes de l'effluent traité répondent aux normes recommandées par l’Organisation
Mondiale de la Santé pour une réutilisation des effluents en agriculture non restrictive.
Au vue, de cette bonne performance épuratoire, ces deux options de traitement pourraient
être considérées comme, des technologies alternatives de traitement des eaux usées à
faible coût pour les populations à faible revenu dans les zones urbaines et péri-urbaines en
Afrique Subsaharienne. Cela pourrait contribuer d’avantage aux efforts de réduction de la
pauvreté et de la famille qui sévissent cette partie de l’Afrique.
Enfin, pour une vulgarisation à grande échelle de ces technologies, d'autres investigations
supplémentaires pourraient s’intéresser à l'utilisation de ces effluents en aquaculture et en
agriculture.

List of abbreviations
xxi
List of abbreviations
AR-BP : two-stage high-rate Anaerobic Reactors followed by a Baffled Pond
AR-SF : two-stage high-rate Anaerobic Reactors coupled with wet-dry Sand Filters BP : Baffled Pond with attached-growth
BOD5 : 5-day Biochemical Oxygen Demand
COD : Chemical Oxygen Demand CP : Control Pond DO : Dissolved Oxygen IPCC : Intergovernmental Panel on Climate Change HLR : Hydraulic loading rate MPN : Most Probable Number SF wet-dry Sand Filters ST : Septic Tank TSS : Total Suspended Solids UASB : Upflow Anaerobic Sludge Blanket WSP : Waste Stabilization Ponds WTTs : Wastewater Treatment Technologies

Table of contents
xxii
Table of contents Dedication .................................................................................................................................. ii
Abstract .................................................................................................................................... iii
List of Publications ................................................................................................................... iv
Acknowledgements .................................................................................................................... v
Résumé substantiel en Français ............................................................................................... vii
List of abbreviations ............................................................................................................... xxi
Table of contents .................................................................................................................... xxii
List of Figures ........................................................................................................................ xxv
List of Tables ....................................................................................................................... xxvii
1. Introduction ........................................................................................................................ 1
1.1 Importance of wastewater treatment and reuse for sustainable sanitation in poor
urban neighbourhoods ............................................................................................................ 1
1.2 Wastewater treatment options ..................................................................................... 3
1.3 Anaerobic treatment technologies ............................................................................... 3
1.4 Post-treatment of anaerobic effluent ........................................................................... 4
1.5 Low-cost treatment options in Sub-Saharan Africa .................................................... 7
1.6 Scope, aim and objectives of this research work ........................................................ 9
1.7 Structure of the thesis ................................................................................................ 10
1.8 References ................................................................................................................. 11
2. Design, implementation and performance evaluation of AR-BP and AR-SF ................. 15
2.1 Design and implementation of the pilot plant ........................................................... 15
2.1.1 Anaerobic systems .................................................................................................. 15
2.1.2 Semi-aerobic and aerobic systems .......................................................................... 19
2.1.3 Approach to the development of AR-BP and AR-SF ............................................. 23
2.2 Description and operation of the pilot plant .............................................................. 24
2.2.1 Two-stage High-rate Anaerobic Reactors ............................................................... 25
2.2.2 Baffled pond with attached growth ......................................................................... 25
2.2.3 Wet and sand filters ................................................................................................ 26
2.2.4 Pilot Plant start-up and operation ............................................................................ 27
2.3 Performance evaluation of the two treatment options: AR-BP and AR-SF .............. 27
2.3.1 Methodology ........................................................................................................... 28
2.3.2 Results and Discussion ........................................................................................... 29
2.4 Conclusions ............................................................................................................... 47
2.5 References ................................................................................................................. 47
3. Hydraulic performance of the baffled pond and its control ............................................. 51
3.1 Hydraulics and wastewater treatment ....................................................................... 51

Table of contents
xxiii
3.1.1 The need for hydraulic analysis .............................................................................. 51
3.1.2 Tracer selection ....................................................................................................... 52
3.1.3 Patterns of flow in ponds ........................................................................................ 53
3.2 Methodology ............................................................................................................. 57
3.2.1 Pilot plant description ............................................................................................. 57
3.2.2 Tracer experimental procedures .............................................................................. 57
3.3 Results and Discussion .............................................................................................. 59
3.3.1 Evaluation of the tracer Test ................................................................................... 59
3.3.2 Model fitting ........................................................................................................... 64
3.4 Conclusions ............................................................................................................... 65
3.5 References ................................................................................................................. 66
4. E. coli distribution and its removal in a Sahelian Baffled Pond ...................................... 69
4.1 Removal mechanisms of E. coli in WSP................................................................... 69
4.2 Methodology ............................................................................................................. 70
4.2.1 Experimental setup.................................................................................................. 70
4.2.2 Sampling and analysis............................................................................................. 71
4.3 Results and Discussion .............................................................................................. 72
4.3.1 Baffled Pond investigation ...................................................................................... 72
4.3.2 pH, DO and Temperature variations and distributions in the BP ........................... 77
4.4 Conclusions ............................................................................................................... 81
4.5 References ................................................................................................................. 81
5. Biofilm characteristics and zooplankton composition in a Baffled Pond in the Sahel
Region of Africa ...................................................................................................................... 84
5.1 Importance of biofilm biomass and zooplankton development in WSP ................... 84
5.2 Methodology ............................................................................................................. 86
5.2.1 Pilot plant description ............................................................................................. 86
5.2.2 Sampling and analysis............................................................................................. 86
5.3 Results and Discussion .............................................................................................. 88
5.3.1 Biomass on attached media and in the water column ............................................. 88
5.3.2 Zooplankton in the Baffled Pond ............................................................................ 93
5.3.3 Interactions between biotic and abiotic aspects of the Baffled Pond ...................... 96
5.3.4 Sludge accumulation rates in the Baffled Pond .................................................... 104
5.4 Conclusions ............................................................................................................. 106
5.5 References ............................................................................................................... 107
6. Biogas production from high-rate anaerobic reactors in Sahelian climate .................... 109
6.1 Biogas recovery from anaerobic treatment processes ............................................. 109
6.2 Methodology ........................................................................................................... 111

Table of contents
xxiv
6.2.1 Description of the experimental setup .................................................................. 111
6.2.2 Biogas collection, sampling and analysis ............................................................. 111
6.2.3 Wastewater characterization ................................................................................. 113
6.2.4 Sludge accumulation assessment .......................................................................... 113
6.3 Results and Discussion ............................................................................................ 113
6.3.1 Characteristics of the influents and effluents of R1 and R2 ................................. 113
6.3.2 Biogas production rates ......................................................................................... 114
6.3.3 Biogas composition ............................................................................................... 116
6.3.4 Sludge accumulation rates .................................................................................... 117
6.4 Conclusions ............................................................................................................. 118
6.5 References ............................................................................................................... 118
7. Conclusion and perspectives .......................................................................................... 121
7.1 Overall conclusion................................................................................................... 121
7.2 A prospectus for future research ............................................................................. 123

List of Figures
xxv
List of Figures Figure 1.1: Overview of major options for wastewater treatment ........................................................................ 3 Figure 1. 2: Schematic view of the pilot plant ...................................................................................................... 10
Figure 2.1: The four functional zones of a Septic tank ......................................................................................... 16 Figure 2.2: Picture of the pilot plant .................................................................................................................... 25 Figure 2.3: Schematic view and picture of the two anaerobic reactors connected in series ............................... 25 Figure 2.4: Schematic view and picture of the control pond and the baffled pond ............................................. 26 Figure 2.5: Schematic view and picture of the two sand filters ........................................................................... 27 Figure 2.6: Variations of E. coli concentrations over time in raw and treated wastewater from each treatment units during Period 1. ........................................................................................................................................... 30 Figure 2.7: (a), (b) and (c). Variations in the concentrations of oxygen demand (BOD5, COD) and suspended solids (TSS) over time in raw and treated wastewater from each treatment unit during Period 1. .................... 34 Figure 2.8: Variations in (a) temperature and (b) dissolved oxygen over time in raw and treated wastewater from each treatment unit during Period 1. .......................................................................................................... 36 Figure 2.9: Variations of ammonium, nitrite and nitrate concentrations over time in influent and effluent wastewater from (a) the baffled pond and (b) the sand filter during Period 1. ................................................... 38 Figure 2.10: Variations of orthophosphate concentrations over time in raw and treated wastewater from each treatment unit during Period 1. ............................................................................................................................ 39 Figure 2.11: The time required for an equal amount of wastewater to pass through the Sand Filter during Periods 1 and 2 ..................................................................................................................................................... 42
Figure 3.1: Results of a laboratory test (in 2iE) of the relationship between electrical conductivity and sodium chloride concentration ......................................................................................................................................... 57 Figure 3.2: Injection of the kitchen salt (NaCl) tracer and measurements of the electrical conductivity at the outlets of the baffled and Control Ponds ............................................................................................................. 58 Figure 3.3: Tracer response curves showing the relationship between salt concentration and transit time in the Baffled and Control Ponds .................................................................................................................................... 60 Figure 3.4: Normalised tracer salt concentration-transit time curves for the Baffled and Control Ponds .......... 61 Figure 3.5: Top view of tracer concentrations at 15, 60 and 90 cm deep in the Baffled Pond (left) and the Control Pond (right); before the tracer was added, one day after injection and at the end of the experiment. 63 Figure 3.6: Comparison between the actual tracer residence time distributions function and the Mixed –Reactors-in-Series Model (Gamma distribution model) ....................................................................................... 65
Figure 4.1: (a) Photograph of the Baffled Pond (b) Side view of the Baffled Pond with attached plastic bottle caps and the sampling points ............................................................................................................................... 72 Figure 4.2: Arithmetic average distribution pattern of E. coli over depth and longitudinal distance in the four compartments of the Baffled Pond (20 samples for each depth) ........................................................................ 74 Figure 4.3: Arithmetic average distribution pattern of Chlorophyll-A over depth and longitudinal distance in the four compartments of the Baffled Pond (20 samples for each depth)................................................................. 76 Figure 4.4: Arithmetic average distribution pattern of COD over depth and longitudinal distance in the four compartments of the Baffled Pond (20 samples for each depth) ........................................................................ 77 Figure 4.5: Arithmetic daily (8:00am, 1:00pm and 5:00pm) averageprofiles of: (a) pH, (b) DO and (c) Temperature in the four compartments of the Baffled Pond .............................................................................. 80
Figure 5.1: Biofilm dry weight densities on baffles, bottle caps and walls at depths of 15 cm, 60 cm and 90 cm after 2 years of operation of in the Baffled Pond ................................................................................................. 89 Figure 5.2: TSS distribution pattern at the depths of 15 cm, 60 cm and 90 cm, in the four compartments of the Baffled Pond ......................................................................................................................................................... 90 Figure 5.3: Chlorophyll-A distribution pattern at depths of 15 cm, 60 cm and 90 cm (a) on baffles and (b) in the water column of the four compartments of the Baffled Pond ............................................................................. 91 Figure 5.4: Distributions of three categories of bacteria at depths of 15 cm, 60 cm and 90 cm in the water columns of the four compartments of the Baffled Pond...................................................................................... 92 Figure 5.5: Distribution of fungi at depths of 15 cm, 60 cm and 90 cm (1) in the water columns of the four compartments and (2) on the baffles of the Baffled Pond. .................................................................................. 93

List of Figures
xxvi
Figure 5.6: Photographs of some of the species of the four main groups of zooplankton found in the Baffled Pond ...................................................................................................................................................................... 94 Figure 5.7: Scatterplot of a Principal Components Analysis of the abundance of 23 zooplankton species present at 12 points along the transit of wastewater through the Baffled Pond. ............................................................. 98 Figure 5. 8: Scatterplot of the abundances of algae and fungi on different parts of the baffles in the Baffled Pond. ..................................................................................................................................................................... 99 Figure 5.9: Scatterplot of a Canonical Correspondence Analysis of the abundance of algae, fungi, and four categories of bacteria (E. coli, FB- fastidious bacteria, NB- non-fastidious bacteria, and EB-enterobacteria) present at 12 points in the water column along the transit of wastewater through the Baffled Pond, also taking into account five environmental variables: total suspended solids (TSS), pH, temperature (Temp), electrical conductivity (Cond), and dissolved oxygen (DO). ............................................................................................... 101 Figure 5.10: Correlation scatterplot of the PCA analysis of the Baffled Pond showing: (a) the grouping of components and (b) the sampling depths position in the factorial plan............................................................ 103 Figure 5.11: Sludge distribution pattern in the Baffled Pond after 2 years of operation ................................... 104
Figure 6.1: Reaction sequence for the anaerobic digestion of complex macromolecules ................................. 110 Figure 6.2: Schematic view of the biogas collector ............................................................................................ 112 Figure 6.3: Portable biogas analyser GA 5000 .................................................................................................... 113 Figure 6.4: Variations in biogas production and internal water temperature over time in the first anaerobic reactor (R1) ......................................................................................................................................................... 115 Figure 6.5: Variations in biogas production and internal water temperature over time in the second anaerobic reactor (R2) ......................................................................................................................................................... 116 Figure 6.6: Average composition of the biogas produced from (a) R1 and (b) R2 ............................................. 117

List of Tables
xxvii
List of Tables Table 1.1: overview of various anaerobic effluent post treatment performances ................................................ 6
Table 2.1: Design and operation values for anaerobic ponds .............................................................................. 16 Table 2.2: Design equations for septic tank ......................................................................................................... 17 Table 2.3: Design guidelines for UASB with granular sludge ................................................................................ 18 Table 2.4: Design models for facultative ponds ................................................................................................... 20 Table 2.5: Summary of the design characteristics of each treatment unit .......................................................... 24 Table 2.6: Summary of methods and parameters analysed ................................................................................. 29 Table 2.7: Summary of Period 1 influent and effluent concentrations, as well as volumetric/surface loading rates, at each treatment ....................................................................................................................................... 31 Table 2.8: Summary of P2 influent and effluent concentrations, as well as volumetric/surface loading rates, at each treatment unit .............................................................................................................................................. 32 Table 2.9: P-values of the t-test comparing effluent concentrations and removal efficiencies in both Baffled Pond and Sand Filter treatment options and between Periods 1 and 2 .............................................................. 33 Table 2.10: Removal efficiencies of E. coli, Total Suspended Solids (TSS), Biochemical Oxygen Demand (BOD5) and Chemical Oxygen Demand (COD) for the two treatment combinationsand similar processes reported in the literature. .............................................................................................................................................................. 46
Table 3.1: Description of axial dispersion values ................................................................................................. 55 Table 3.2: Parameters used to describe the hydraulic characteristics of the Baffled and Control Ponds ........... 61
Table 4.1: Summary of E. coli concentration per 100 ml at different depths and in all compartments of the Baffled Pond ......................................................................................................................................................... 73 Table 4.2: Summary of hydraulic characteristics, E. coli removal efficiencies and decay rates in the Baffled Pond and the Control Pond ........................................................................................................................................... 75 Table 4.3: Summary of average values of pH, DO and temperature in the four compartments and at different depths of the Baffled Pond during the morning, noon and afternoon ................................................................ 78
Table 5.1: Summary of the methods for the four microbial colonies .................................................................. 87 Table 5.2: Summary of the identified zooplankton species in the Baffled Pond ................................................. 94 Table 5.3: Zooplankton distribution pattern at depths of 15, 60 and 90 cm in the four compartments of the Baffled Pond ......................................................................................................................................................... 96 Table 5.4: Eigenvalues and percentages of variance explained by Axes F1 and F2 of a Principal Components Analysis of the zooplankton species abundances in the various sectors of the Baffled Pond (Figure 5.7) .......... 97 Table 5.5: Eigenvalues of Axes F1 and F2, together with the percentages of the variance that they explain in a Canonical Correspondence Analysis of different types of microbes and physical and chemical factors in the various sectors of the Baffled Pond (Figure 5.9) .................................................................................................. 99 Table 5.6: Eigenvalues of Axes F1 and F2, together with the percentages of the variance that they explain in a Principal Components Analysis of different types of microbes, zooplankton , and physical and chemical factors in the various sectors of the Baffled Pond (Figure 5.10) .................................................................................... 101 Table 5.7: Sludge accumulation rate in the Baffled Pond .................................................................................. 105 Table 5.8: Sludge accumulation rates in various waste stabilization ponds ...................................................... 105
Table 6.1: Influent and effluent characteristics of the anaerobic reactors R1 and R2 ....................................... 114 Table 6.2: Sludge distribution and accumulation in the anaerobic reactors R1 and R2..................................... 118

Optimisation of two-stage high-rate anaerobic reactors coupled with baffled pond and wet-dry sand
filters for domestic wastewater treatment in a warm-dry climate (Ouagadougou, Burkina Faso)
PhD Thesis report Moumouni Diafarou Ali Page 1
Chapter 1
1. Introduction
1.1 Importance of wastewater treatment and reuse for sustainable sanitation in poor urban neighbourhoods
According to the World Commission on Sustainable Development, sustainability has been
defined as ‘’development that meets the needs of the present generation without
compromising the ability of future generations to meet their needs’’. Therefore sustainable
urban sanitation can be achieved when solutions are put in place to prevent waste
generation threats to public health in the city and threats to the environment (including
surface water, groundwater, air and soil) in a way that can be repeated time and time again
indefinitely.
Wastewater management is one of the major issues faced by most developing countries and
is particularly problematic among the low-income inhabitants of sub-Saharan African cities.
Huge amounts of wastewater are generated and discharged haphazardly in the environment
without any treatment and in most cases are used as water sources for peri-urban irrigation
(Qadir et al., 2010; Khan et al., 2013; Maiga et al., 2014; Saldías et al., 2015). Among others,
Kayombo et al., (2005) found that the persistence of many water borne diseases (cholera,
typhoid, dysentery, infectious hepatitis, parasitosis, and poliomyelitis) in these regions is
due to the inadequate wastewater treatment systems. Therefore, sustainable wastewater
management is required to improve public health and to produce microbiologically safe
effluent for crop irrigation and fish farming.
Over recent decades, wastewater collection and treatment technologies in developed
countries have been greatly improved and have become very important assets in mitigating
the impact of domestic and industrial effluents on the environment. Developing countries,
on the other hand, remains far behind. In West Africa for instance, only 31% of the
population uses improved sanitation facilities and nearly one in four (1/4) uses no form of
sanitation by practicing open defecation (MDGs report, 2008). Furthermore, according to
Kulabako (2005), 90% of urban wastewater collection and treatment systems in developing
countries are based on septic tanks and pit latrines. However, these systems present health
risks in urban areas, if the water table is high and flooding is frequent, since the effluent
from these systems is only partially treated before being discharged into the immediate
environment. Furthermore, the wastewater collection and treatment facilities are often
non-existent and the few that do exist are inadequate to thoroughly clean all the harmful
substances and organisms, which eventually find their way to surface water and
groundwater (Drechsel and Evans, 2010), and thereby to people's homes once again, where
they transmit all sorts of water-borne diseases.

Optimisation of two-stage high-rate anaerobic reactors coupled with baffled pond and wet-dry sand
filters for domestic wastewater treatment in a warm-dry climate (Ouagadougou, Burkina Faso)
PhD Thesis report Moumouni Diafarou Ali Page 2
This situation is getting worse due to the rapid urbanization and industrialization of African
cities, which are expected to double their population by 2030 (UN-Habitat, 2008). Also, in
recent decades, because of the recurrent episodes of drought experienced by arid and semi-
arid countries, the immigration of rural populations to cities has accelerated. Large numbers
of Sahelian cultural and religious habits involve using water for sanitation, spilling of
greywater into the streets (lack of sewerage), and open defecation in the back yards of slum
areas. For instance, a survey in 2007 showed that 57% of the households in Burkina Faso
were practicing open defecation (Koné, 2011). In most cases within this country, population
density in cities is greater than 160 persons per hectare and most of its cities are
impoverished and lack planned and adequate services. The consequences are enormous,
ranging from the high cost of drinking water treatment, land degradation, and algal blooms
causing eutrophication of rivers to threats to biodiversity, human health and environmental
health in general. For instance, according to the World Bank (2008), about 3 million peoples
die prematurely every year in the developing countries, due to water-borne diseases, and
most of the victims are children under five years of age and women without adequate water
supply and sanitation.
Moreover, Cisneros (2011) asserted that many low-income countries are located in arid or
semi-arid regions. The climates of these areas are often characterized by long dry seasons
and temperatures between 25 and 34°C. These regions also have short rainy seasons with
great constancy (≥ 2500h/year) and energy (19.5-22.7 MJ/m2/day) in the form of solar
radiation.
Apart from the sanitation problems of these arid or semi-arid regions, they also face great
water scarcity. Due to the scarcity of water resources, the reuse of highly concentrated
untreated wastewater in peri-urban irrigation has become more common in recent years
(Qadir et al., 2010), thus making it key to first destroy the faecal pathogens that are present
in the wastewater. Therefore, there is an increasing interest in these regions in the reuse of
treated wastewater for urban irrigation, the reuse of treated excreta for fertilizer (Sangaré
et al., 2014), and the recovery of energy via the production of biogas (Mendoza et al., 2009).
Treating municipal wastewater to reach World Health Organization (WHO) reuse standards
at a low-cost remains a great challenge and there is an urgent need to optimize wastewater
treatment technologies in low-income countries.
Hence, investing in sanitation and hygiene is not only about saving human lives and dignity;
it is the foundation for investing in human development, especially in poor urban and peri-
urban areas. However, one of the main bottlenecks encountered by the municipalities of
sub-Saharan African countries is the limited information and awareness about more
appropriate and sustainable technologies for managing sanitation problems in such a way
that project costs are affordable while still protecting public health and water resources.
From a sustainability perspective, Jeppsson and Hellström (2002) have highlighted that the
most sustainable systems for wastewater treatment are those systems that are aimed at

Optimisation of two-stage high-rate anaerobic reactors coupled with baffled pond and wet-dry sand
filters for domestic wastewater treatment in a warm-dry climate (Ouagadougou, Burkina Faso)
PhD Thesis report Moumouni Diafarou Ali Page 3
reusing the water for irrigation, the nutrients for fertilization and the organic matter for
energy generation. Innovative and appropriate design parameters which account for local
conditions in wastewater collection, treatment and disposal or reuse systems, can
contribute to sustainable urban wastewater management particularly, in West African cities.
1.2 Wastewater treatment options
The number of available wastewater treatment technologies, and their combinations, is
nearly unlimited. Therefore, each pollution problem calls for a specific, optimal solution
involving a series of operations and processes, as organized in flow diagrams (Tilley et al.,
2008). The basic choices in technology involve the following dichotomies: (i) dry or wet, (ii)
centralized or decentralized (with sewers or not), (iii) mechanized or natural, (iv) biological
or chemical-physical, and (v) aerobic or anaerobic. Figure 1.1 presents an overview of these
major options. Recent studies have shown that sustainable performance of a technology can
only by achieved if the selection of the treatment technologies considers the environmental,
economic and social factors associated with each geographical context (Mena-Ulecia and
Hernández, 2015). Therefore, alternative sustainable concepts for developing countries
should aim at removing the disadvantages of traditional concepts without losing the
benefits.
(adapted from Van der Steen, 2008 lecture notes)
Figure 1.1: Overview of major options for wastewater treatment
1.3 Anaerobic treatment technologies
Anaerobic digestion refers to fermentation processes in which organic material is degraded
by various anaerobic bacteria and biogas (composed of mainly methane and carbon dioxide)
is produced. Anaerobic wastewater treatment option has been given more attention over
the aerobic wastewater treatment since the era of energy crisis in the 1970s associated with
On-site Sanitation Intermediate Sanitation : Low
cost Sewerage/Shallow Sewerage
Off-site Sanitation
Dry Systems Wet systems Natural treatment systems
base on biodegration
Infiltration
(cess) pit
Pour flush
toilet/aqua
privy + septic
tank systems
Mechanized
treatment
Constructed
Wetlands
CW
Ponds/lagoons
Aerated
Lagoons
Waste
Stabilization
Ponds (WSP)
Anaerobic
Treatment
Aerobic
treatment
Biofilm
systems :
Trickling
filters,
Rotating
biological
contactors
(RBC)
Conventional
Activated
sludge (AS)
with separate
sludge
treatment
Modified
AS by
extending
aeration (+
oxidation
ditch)
Upfow
Anaerobic
Sludge Blanket
(UASB)
systems
Anaerobic
filter
Post
treatment
(duckweed
pond)
Post
treatment
by various
ponds
systems
Horizontal
flow CW
Vertical
flow CW
Ecosan

Optimisation of two-stage high-rate anaerobic reactors coupled with baffled pond and wet-dry sand
filters for domestic wastewater treatment in a warm-dry climate (Ouagadougou, Burkina Faso)
PhD Thesis report Moumouni Diafarou Ali Page 4
the increased demand for industrial wastewater treatment (Henze et al., 2008). The
development of the Upflow Anaerobic Sludge Blanket reactor (UASB) by Lettinga and co-
workers (Lettinga et al., 1980) represents a breakthrough for anaerobic treatment because
of its potential for net energy production.
Anaerobic treatment technologies can be divided into low-rate systems (such as septic
tanks, anaerobic ponds or lined pits) or high-rate systems (UASB, Anaerobic filter, anaerobic
contact process). High-rate systems have the advantage of supporting higher hydraulic
loading rates and thus smaller tanks volumes, shorter retention times, reduced area
requirements, and can be applied for both small and large scales, to treat domestic and
industrial wastewater. However, the high rate systems are in general more complicated to
construct, operate and maintain than low-rate systems.
Anaerobic treatment has been reported to be very effective in removing biodegradable
organic compounds, leaving mineralized substances such as NH4+, PO4
3- and S2- in solution,
but often is considered a pretreatment (Metcalf and Eddy, 2003; von Sperling and
Charnicharo, 2005; Henze et al., 2008). There are reports indicating that not only the
organic removal in anaerobic systems is deficient for full treatment, but the pathogen
removal is also not sufficient (Lettinga et al., 1993; Metcalf and Eddy, 2003). Moreover, it is
clear from numerous studies that the quality of anaerobic effluent rarely meets the
discharge standards of most countries, despite several modifications (Lettinga et al., 1993;
Khan et al., 2011a). For instance, UASB reactors have undergone several improvements:
introduction of settlers at the top of gas-liquid-solid-separator, addition of anaerobic filters,
two UASB reactors placed in series and even the incorporation of an external sludge
digester (van Haandel and Lettinga, 1994; Lettinga, 2008; Lew et al., 2003; El Hamouri, 2004;
von Sperling and Chernicharo, 2005; Khan et al., 2011a, b and c). Consequently, some
additional or post-treatment is necessary in order to achieve the desired effluent quality
and thus avoid the contamination of the receiving water bodies.
1.4 Post-treatment of anaerobic effluent
The inability of anaerobic processes alone to meet disposal standards of most countries has
driven the development of subsequent post-treatment. A variety of post-treatment
configurations based on various combinations with UASB or anaerobic reactors have been
studied in some countries across the world (Table 1.1). It is clear from numerous studies
that combined biological anaerobic and aerobic treatment configurations are well-known
for their low-cost, operational simplicity, efficiency, and reliable removal of nutrients (N and
P) and pathogens (viruses, bacteria, protozoans and helminths) (Peña, 2002; von Sperling et
al., 2002; von Sperling and Chernicharo, 2005; Khan et al., 2014).
A common process used at several wastewater treatment plants (some in laboratory or pilot
scale) in warm countries, such as Brazil, Colombia, India, Egypt, Morocco and Uganda is
apply a UASB followed by final polishing units (FPU) or polishing ponds (PP) (Table 1.1). It is

Optimisation of two-stage high-rate anaerobic reactors coupled with baffled pond and wet-dry sand
filters for domestic wastewater treatment in a warm-dry climate (Ouagadougou, Burkina Faso)
PhD Thesis report Moumouni Diafarou Ali Page 5
obvious from this overview that the West African countries, with such favorable climatic
conditions, are lagging behind in this respect. Apart from being efficient in removing
pollutants, this combination anaerobic and aerobic processes offers technical, economical
and operational advantages (von Sperling et al., 2002; Peña, 2002; El-Hamouri, 2004; von
Sperling and Chernicharo, 2005; von Sperling et al., 2005; El-Shafai et al., 2007; Babu, 2011;
Khan et al., 2014). Despite these great efforts, the final effluent is still generally devoid of
dissolved oxygen (DO) and rich in nutrients. Moreover, polishing ponds operate at long
hydraulic retention times (10 to 50 days), which would require more land (Mara, 1996;
Khan, 2012). The need for extensive parcels of land is a big challenge and is critical in
application of this technology, even in developing countries where land may not be so
expensive.

Optimisation of two-stage high-rate anaerobic reactors coupled with baffled pond and wet-dry sand
filters for domestic wastewater treatment in a warm-dry climate (Ouagadougou, Burkina Faso)
PhD Thesis report Moumouni Diafarou Ali Page 6
Table 1.1: overview of various anaerobic effluent post treatment performances
(Adapted from Khan, 2012)
Hybrid treatment systems
Effluent concentration (and % removal efficiency) Reference & Country BOD COD TSS NH4
+-N TN TP FC
mg/l mg/l mg/l mg/l mg/l mg/l MP /100mL
CEPT+UASB+Zeolite 32 (85) 45 (91) 24 (88) 0.3 (99) 0.5 (99) 0.5 (94) 1E+5 (99) (Aiyuk et al. 2004) Belgium
UASB+ Dissolved Air Flotation
- 17 (98) 4 (98.4)
- - 0.6 (98) - (Penetra et al. 1999) Brazil
UASB+Coagulation flocculation
>20 (91) >50 (87) >30 (82)
- - - 4.3E+3 (99.9)
(Jaya Prakash et al. 2007) India
UASB+Slow Sand Filtration
12 (92.6) 27 (91) 20 (91) - - - 1E+3 (99.995)
Tyagi et al. 2009) India
UASB+Polishing ponds 24 (92) 108 (79) 18 (96) 20 (50) 25 (55) - 5.8E+2 (99.999)
(Khan et al. 2014) India
UASB+constructed wetlands
- 52 (82) 174 (65)
14 (70) 17.5 (70)
0.74 (89)
1E+3 (99.99)
Sousa et al. 2001) Brazil
UASB+Duckweed ponds
14 (96) 49 (93) 32 (91) 0.41 (98)
4.4 (85) 1.1 (78) 4E+3 (99.998)
(El-Shafai et al. 2007) Egypt
UASB+Down-flow hanging sponge
9 (96) 46 (91) 17 (93) 18 (28) 28 (40) - 3.4E+4 (99.95)
(Machdar et al. 2000) Japan
UASB+ Sequencing Batch Reactor
5.8 (97) 26 (94) 5 (98) 0 (100) 12.6 (77)
1.2 (65) 7.5E+2
Moawad et al., 2009) Egypt (Khan et al., 2011a) India
UASB+ Rotating Biological Contactors
- 43 - 2.2 (92) - - 9.8E+2 (99.9)
Tawfik et al. 2005) Egypt
UASB+Trickling filter 17-57 (80-94)
60-120 (74-88)
<30 (73-89)
- - - - Chernicharo & Nascimento, 2001) Brazil
UASB+Overland flow system
48-62 (53-83)
98-119 (77-83)
17-57 14-18 - - 2.4E+5 (99-99.9)
(Chernicharo et al. 2001) Brazil
UASB+ Activated Sludge Process
- 50 (85 -93)
13-18 (82)
- - - - (von Sperling et al. 2001) Brazil
UASB+Flash aeration system
22 (89) 57 (86) 47 (83) - - - 5E+3 (99) (Khan et al 2011b) India
UASB+ Baffled Pond 60 200 90 - - - 3.87E+6 (99.77)
(von Sperling et al. 2002) Brazil
Septic Tank+ Land infiltration
20 (91) 100 30 (86) (75) - (99.999) Mena-Ulecia & Hernández 2015) Chile
RACHAHR + MP 25 (93.6) 170 (78.8)
115 (65.2)
- - 2.4 (70.7)
2.4E+3
(99.993) (El Hamouri, 2004) Morocco
WSPs (AP+FP+MP) 220 (87) (81) 110 (66)
29.1 (38.5)
- 12.5 (17.2)
5.4E+3 (99.966)
(Maiga et al. 2006) Burkina Faso
Anaerobic Tank + FP+ Baffled Ponds
- - 28 19.1 (74.5)
- - - (Babu, 2011) Uganda
UASB= Upflow anaerobic sludge blanket (reactor); AP= Anaerobic Pond; FP= Facultative pond; MP= Maturation; Pond CEPT= Chemically Enhanced Primary Treatment; WSPs= Waste Stabilization Ponds, RACHAHR= ‘’Réacteur Anaérobie et Chenal à Haut Rendement’’ i.e. Anaerobic Reactor with a High rate algal pond

Optimisation of two-stage high-rate anaerobic reactors coupled with baffled pond and wet-dry sand
filters for domestic wastewater treatment in a warm-dry climate (Ouagadougou, Burkina Faso)
PhD Thesis report Moumouni Diafarou Ali Page 7
1.5 Low-cost treatment options in Sub-Saharan Africa
The systems that have been developed in the industrialized world could not solve the
existing sanitation problems, especially in low-income urban areas. Some, because of their
high capital investments, maintenance costs and skilled manpower requirement have been
a major barrier for their implementation by many countries in Africa (Veenstra and Alaerts,
1996; Agunwamba, 2001b; Bolton et al., 2010; Olukanni and Ducoste, 2011).
Consequently, Constructed Wetlands (CW), conventional Wastewater Stabilization Ponds
(WSP) and Septic Tanks (ST) are the most common low-cost wastewater treatment
technologies used in developing nations, especially in tropical regions (Mara, 2004; Babu,
2011; Mekonnen et al., 2015). The main reason could be due to cost effectiveness in
construction and maintenance of these technologies.
Constructed wetlands (CW) are described as engineered systems that have been designed
and constructed to mimic natural wetland systems. CW use mainly aquatic plants that have
root systems which provide attachment sites for bacterial growth and activity. According to
Yalcuk et al., (2010), CW can serve as primary, secondary or tertiary water treatment
systems. The major advantages of CW systems are their low operation costs, low energy
requirements, resilience in the face of loading shocks, and effectiveness in reducing organic
matter, odour and total suspended solids. In addition, CW have the potential for resource
recovery, in the form of the harvested biomass, which could be applied as fodder for
animals. Therefore, CW are an attractive alternative for African countries. Recently,
Mekonnen et al., (2015) have reviewed the application and the performance of CW, at
laboratory to full scales in African countries, including Tanzania, Egypt, Kenya, Nigeria, South
Africa, Tunisia, Morocco, Uganda, Cameroon, Ethiopia, Benin, Burkina Faso and Cote
d’Ivoire.
On the other hand, the major bottlenecks of CW include the need of a relatively large area
for construction (2-10 m2/inhabitant), their incomplete removal of pathogen, limited
nitrification, and the possible breeding of mosquito if there is free surface water. Moreover,
the efficiency of CW may be reduced over time due to clogging if too many suspended solids
remain in the influent wastewater (Babu, 2011).
Another inexpensive alternative wastewater treatment option for African countries consists
in Waste Stabilization Ponds (WSP). Mara (2004) has described, these as large, shallow
basins enclosed by earthen embankments in which raw wastewater is treated by entirely
natural symbiotic processes involving both algae and bacteria. The ponds can be used
individually or in series. Mainly, three types of ponds are used: anaerobic, facultative, and
maturation. Each of these ponds has different treatment and design characteristics. Apart
from being a low-cost treatment technology, WSP are also reported to be a modern
wastewater reclamation and resource recovery technology in tune with modern
environmentally conscious societies (Pearson, 1996, Babu, 2011). WSP are effective in

Optimisation of two-stage high-rate anaerobic reactors coupled with baffled pond and wet-dry sand
filters for domestic wastewater treatment in a warm-dry climate (Ouagadougou, Burkina Faso)
PhD Thesis report Moumouni Diafarou Ali Page 8
removing organic matter (Mara and Pearson, 1998; Metcalf & Eddy, 2003; Henze et al.,
2008) and are highly efficient in pathogen removal (Curtis et al., 1992; Davies-Colley et al.,
1999; Van der Steen et al., 1999; Zimmo et al., 2002; Maïga et al., 2009; Bolton et al., 2010).
In addition, they are simple to operate and maintain, low in energy requirements and robust
in structure (Mara, 2004; von Sperling and Chernicharo, 2005). Furthermore, another
advantage of WSP is that the effluent may be used for crop irrigation. The algae in the
effluent are very useful, since they act as a slow-release fertilizer and over time increase the
organic content of the soil and thus its water-holding capacity (Mara, 2004).
However, WSP are perceived to have odour problems and require large areas of land (2-5
m2/inhabitant) (Pattarkine et al., 2006). Despite this, there are currently many of these
functioning in big modern cities like Melbourne, Australia; Amman, Jordan; and Nairobi,
Kenya (Mara, 2004; Khan, 2012). Upgrading the anaerobic ponds to Upflow Anaerobic
Sludge Blanket (UASB) reactors may be an appropriate alternative as suggested by many
researchers (Peña, 2002; El Hamouri, 2004; Mara, 2004). On the other hand, UASB reactors
have suffered from the need for skilled manpower, complex infrastructures, and larger
budgets for operation and maintenance.
Last but not least, Septic Tanks (ST) are also known as a low-cost wastewater collection and
treatment option in low to medium density urban areas in Africa. ST are described as small
rectangular chambers (with 2 to 3 compartments), built below ground level, in which
household or communal (up to 300 person’ equivalent) wastewater is kept for days or years
(Mara, 1996). Apart from being low-cost, septic tanks require small extensions of land, no
electricity, minimal operation and maintenance, only locally available materials, and no
special adaptations to control flies and odor if used correctly. However, these systems
require frequent emptying (faecal sludge management) and cannot efficiently remove
organic matter, suspended solids or pathogens in accordance with the effluent quality
disposal standards for most countries. Therefore, a post-treatment after the ST is always
necessary. One of the cheapest options could be a septic tank followed by sand filtration.
But, on the other hand, it has also been reported by Tyagi et al. (2009) that rapid sand
filtration is known to frequently clog.
In summary, the adaptability of these treatment options, their adaptability to the Sahelian
context has yet to be demonstrated. Therefore, the selection of the best combination of
anaerobic-aerobic systems to treat urban domestic sewage here is a challenging task
involves finding a proper, reliable and efficient system that is easy to operate and maintain,
technically feasible, locally applicable, and economically viable. A comprehensive
investigation to understand the performance of low–cost wastewater treatment
technologies in the Sahelian context is key to improving sanitation here.

Optimisation of two-stage high-rate anaerobic reactors coupled with baffled pond and wet-dry sand
filters for domestic wastewater treatment in a warm-dry climate (Ouagadougou, Burkina Faso)
PhD Thesis report Moumouni Diafarou Ali Page 9
1.6 Scope, aim and objectives of this research work
Aside from their health, environmental and economic benefits, solutions to wastewater
collection and treatment should preferably be simple and ‘’low-tech’’, to increase their
affordability in poor urban communities. This commonly means that the technology should
be less mechanized and have a lower degree of automatic process control, and that its
construction, operation and maintenance should involve locally available personnel and
materials, rather than imported mechanized components. It is also suggested that
communal sanitation is indeed the only viable alternative for slums (Schouten and
Mathenge, 2010), although this could stand further analysis.
The aim of this research was to develop pilot-scale domestic wastewater treatment systems
that: (i) are acceptable and applicable to the local conditions of low-income neighbourhoods
within sub-Saharan African cities, (ii) minimize area requirements, (iii) are simple and
inexpensive in their operation and maintenance; (iv) require a low capital investment, and
(v) include more compact treatment systems that combine efficient technologies
(anaerobic-aerobic) with low energy consumption. Based on these criteria, and in the light
of the above challenges, two options of domestic wastewater treatment technologies were
designed and implemented at the International Institute for Water and Environmental
Engineering (2iE) campus in Ouagadougou, Burkina Faso, in West Africa. These were
monitored under different operational conditions and optimized for the local climate.
The first option includes two-stage, high-rate Anaerobic Reactors with biogas recovery,
followed by a Baffled Pond (AR-BP). This was inspired by conventional waste
stabilization ponds (WSP), but the anaerobic pond was modified to form two anaerobic
reactors, the facultative pond was not applied, and special plastic baffles with rough
surfaces were introduced into the maturation pond. The baffles were made with sheets
of plastic onto which caps of waste plastic bottles were affixed to increase the surface
area (up to 60%) for the growth of biofilm. This configuration was expected to improve
the hydraulic and biofilm patterns of the pond and, as a result, increase the removal
efficiency for organics and pathogens.
The second option consists of the same two-stage, high-rate Anaerobic Reactors, but in
this case followed by Vertical-flow Wet and Dry Sand Filters (AR-SF). This process is
similar to the conventional Septic Tank, but differs from it due to the collection of biogas
and the higher quality of its effluent. As a result, this technology could be a better
variation on the standard septic tank.
Figure 1.2 presents the schematic view of the two treatment options, used in this study.
Taking into account geographical and climate factors, these hybrid treatment systems which
have not been tested before in West Africa can be used as alternatives for low-cost
domestic wastewater treatment.
Optimisation of two-stage high-rate anaerobic reactors coupled with baffled pond and wet-dry sand
filters for domestic wastewater treatment in a warm-dry climate (Ouagadougou, Burkina Faso)
PhD Thesis report Moumouni Diafarou Ali Page 10
Figure 1. 2: Schematic view of the pilot plant
The overall aim of this research work was to optimize the performance of two-stage high-
rate anaerobic reactors, followed by baffled pond with attached growth or wet-dry sand
filters treating domestic wastewater for the urban poor, at pilot scale (approximately 50
population equivalent) in the warm, dry climate of Ouagadougou, Burkina Faso.
The specific objectives to be achieved in this research include:
designing, implementing and testing of the performance of this technology at a pilot
scale, in terms of the removal of organics, nutrients, and pathogens;
investigating the hydraulic performance of the baffled pond with attached-growth,
compared to that of the unbaffled pond;
understanding the efficiency of removal of Escherichia coli in the baffled pond with
attached-growth;
evaluating the diversity and biomass of algae and zooplankton in the biofilm that
develops on the plastic bottles caps affixed to the baffles and in the water column of the
polishing pond;
estimating the potential for biogas production, its composition, and the rate of sludge
accumulation in the two-stage high-rate Anaerobic Reactors.
1.7 Structure of the thesis
This thesis comprises seven chapters, including this introductory section, conclusions, and
future perspectives section. The following paragraphs provide a brief overview of each part.
The first section of this thesis that was presented is a general introduction to the
importance of wastewater treatment and reuse for sustainable environmental management
in low-income, urban neighbourhoods in Africa. It presented an overview of the major
wastewater treatment options, with a particular emphasis on low-cost options, their
limitations, and different combinations of anaerobic and aerobic processes. Additionally, it
Baffled pond with attached plastic bottles corks
Buffer tank
Inlet
Anaerobic Reactor R1 Anaerobic Reactor R2
Biogas
collector
Biogas Biogas
Outlet Pump
Baffle 1
Biogas
collector
Baffle 2 Baffle 3
Control pond
Sand filter 1 Sand filter 2
Flow Splitter

Optimisation of two-stage high-rate anaerobic reactors coupled with baffled pond and wet-dry sand
filters for domestic wastewater treatment in a warm-dry climate (Ouagadougou, Burkina Faso)
PhD Thesis report Moumouni Diafarou Ali Page 11
gives the objectives and justifications for this research, plus a brief description of the
project.
The second chapter details the various aspects considered in the design and implementation
of the pilot project. This chapter also presents the results of the performance evaluation of
the two options, under two distinct theoretical hydraulic retention times in the two high-
rate Anaerobic Reactors. The results are critically analysed and compared with the
literature.
The third chapter presents a tracer test that was carried out on the baffled and unbaffled
ponds, using common kitchen salt (sodium chloride). In addition, it focuses on the hydraulic
characteristics and models that could be applied in predicting the performance of the ponds
in terms of the removal of organic matter and pathogens.
The fourth chapter highlights the reasons why Escherichia coli were not found in the
effluent of the baffled pond. Furthermore, the die-off rates of Escherichia coli in both
baffled and unbaffled ponds were derived based on the hydraulic model obtained from the
tracer test (Chapter 3). The importance of the baffles is also described in this.
The fifth chapter mainly focuses on the characteristics of the biofilm that formed in the
baffled pond, in terms of algal biomass distribution, microbial diversity, and zooplankton
species composition and distribution in the bulk water and attached media. Moreover, a
statistical tool, Principal Component Analysis, was used to analyse the correlations among
phytoplankton, zooplankton, bacteria, and suspended solids.
The sixth chapter presents and discusses the potential for biogas production, its quality, and
the rate of sludge accumulation in the two anaerobic reactors. Finally, the thesis ends with
some general conclusions, as well as some perspectives for the future of decentralized
sanitation in Africa (chapter 7).
1.8 References
[1] Agunwamba, J. C. (2001b). Analysis of socioeconomic and environmental impacts of waste stabilization pond and unrestricted wastewater irrigation: interface with maintenance. Environ. Manage. 27 (3):463–476.
[2] Aiyuk, S., Amoako, J., Raskin, L., van Haandel, A., Verstraete, W. (2004).Removal of Carbon and Nutrients from Domestic Wastewater using a Low Investment, Integrated Treatment Concept. Wat. Res., 38, 3031–3042.
[3]Babu, M. (2011). Effect of algal biofilm and operational conditions on nitrogen removal in wastewater stabilization ponds. PhD. Thesis at Wageningen University and UNESCO-IHE Institute of Water Education Netherlands, 144 p.
[4] Bolton, N. F., Cromar, N. J., Hallsworth, P. and Fallowfield, H. J. (2010). A review of the factors affecting sunlight inactivation of micro-organisms in waste stabilisation ponds: preliminary results for enterococci. Water Sci. Technol. 61(4): 885-890
[5] Chernicharo, C.A.L., Nascimento, M.C.P. (2001). Feasibility of a Pilot- Scale UASB/Trickling Filter System for Domestic Sewage Treatment, Wat.Sci.Technol., 44 (4), 221-228.
[6] Chernicharo, C.A.L., Cota, R.S., Zerbini, A.M., von Sperling, M., Brito, L.H.N.C. (2001). Post-treatment of Anaerobic Effluents in an Overland Flow System. Wat.Sci.Technol. 44 (4), 229–236.

Optimisation of two-stage high-rate anaerobic reactors coupled with baffled pond and wet-dry sand
filters for domestic wastewater treatment in a warm-dry climate (Ouagadougou, Burkina Faso)
PhD Thesis report Moumouni Diafarou Ali Page 12
[7] Cisneros B. J. (2011). Safe Sanitation in Low Economic Development Areas: Universidad Nacional Autonoma de Mexico, Coyoacan, Mexico
[8] Drechsel, P. and Evans, A. E. V. (2010), Wastewater use in irrigated agriculture. Irrigation and Drainage Systems 24 (1–2), 1–3.
[9] El Hamouri Bouchaïb (2004). Réacteur Anaérobie et Chenal à Haut Rendement: Pour l’épuration des eaux usées des petites communautés-Réalisation, exploitation et performances. Rabat, Morocco (Anaerobic Reactor with a High rate algal pond (RACHAHR))
[10] El-Shafai, S.A., El-Gohary, F.A., Nasr, F.A., van der Steen, P., Gijzen, H.J. (2007). Nutrient Recovery from Domestic Wastewater using a UASB-Duckweed Ponds System. Biores. Technol., 98, 798–807.
[11] Jaya Prakash K., V.K.Tyagi, A.A.Kazmi & Arwind Kumar, 2007, Post- Treatment of UASB Reactor Effluent by Coagulation and Flocculation Process, AIChE, Environmental Progress, Vol. 26, No.2 pp 164-168.
[12] Jeppsson, U., Hellström, D. (2002), “Systems analysis for environmental assessment of urban water and wastewater systems”. Wat. Sci. Tech., vol. 46, no. 6-7, pp. 121-129.
[13] Jorgensen, S.E. and Williams, D.W. (2001). Water quality; the impact of eutrophication. In: Lakes and Reservoirs, volume 3. UNEP-International Environment Technology Centre
[14] HamodaI M.F, Al-Ghusain, N.Z Al-Mutairi (2004). Sand filtration of wastewater for tertiary treatment and water reuse. Desalination 164 p. 203-211
[15] Henze, M., van Loosdrecht, M.C.M, Ekama, G.A. and Brdjanovic. D. (2008). Biological Wastewater Treatment: Principles, Modelling and Design. Published by IWA Publishing, London, UK.
[16] Kayombo, S., Mbwette, T. S. A., Mayo, A. W., Katima, J. H. Y. & Jørgensen, S. E. (2002). Diurnal cycles of variation of physical–chemical parameters in waste stabilization ponds. Ecological Engineering, 18 (3), 287-291
[17] Kayombo, S., Mbwette, T. S. A., Katima, J. H. Y., Ladegaard, N., Jorgensen, S.E. (2005). Waste Stabilization Ponds and Constructed wetlands Design Manual. http://www.unep.or.jp (Accessed on 04/09/2012).
[18] Khan A.A., Rubia Z.G., Tyagi V.K., Khursheed A., Beni L., Mehrotraa I., Kazmi A.A. (2011a). Sustainable options of post treatment of UASB effluent treating sewage: A review. Resources, Conservation and Recycling 55, p. 1232– 1251;
[19] Khan A. A., Gaur R. Z., Lew B., Diamantis V., Mehrotra I., Kazmi A. A. (2011b). UASB/Flash aeration enable complete treatment of municipal wastewater for reuse. Bioprocess and Biosystem Engineering. Vol. 35(6):907-13.
[20] Khan A. A., Gaur R. Z., Lew B., Mehrotra I., Kazmi A. A. (2011c). Effect of aeration on the quality of effluent of UASB reactor treating sewage. Journal of Environmental Engineering- ASCE, Vol. 137 (6); 464-472.
[21] Khan A. A. (2012). Post treatment of UASB effluent: Aeration and Variant of ASP. PhD Thesis,Indian Institute of Technology, (IIT) Roorkee India.
[22] Khan A. A., Gaur R. Z., Mehrotra I., Diamantis V., Lew B. and Kazmi A. A. (2014). Performance assessment of different STPs based on UASB followed by aerobic post treatment systems. Journal of Environmental Health Science & Engineering 12 (1) 43
[23] KonéM. (2011). ‘’Infiltration-percolation sur sable et sur filtre de Coco, filtres plantes et épuration d’eaux usées domestiques à dominance agroalimentaires sous climat tropical sec: cas des eaux résiduaires urbaines de Ouagadougou, Burkina Faso.’’Infiltration-percolation through sand and Coco filters, and domestic wastewater from food dominance treatment plants in dry tropical climate: case of urban wastewater in Ouagadougou, Burkina Faso. PhD Thesis, University Claude Bernard Lyon I -France/University of Ouagadougou Burkina Faso P.232
[24] Kulabako R. (2005). Analysis of the impact of Anthropogenic pollute on on shallow groundwater in peri-urban Kampala. RITA LWR LIC Thesis pp 67
[25] Lettinga G., Van Velsen A.F.M., Hobma S.W., De Zeeuw W. and Klapwijk A. (1980), Use of upflow sludge blanket (USB) reactor concept for biological wastewater treatment, especially for anaerobic treatement. Biotechnol. Bioeng. 22, 699-734.
[26] Lettinga G., deMan A., van der Last, A. R. M., Wiegant, W., van Knippenberg, K., Frijns, J., van Buuren, J. C. L. (1993). Anaerobic Treatment of Domestic Sewage and Wastewater. Wat. Sci. Technol., 27(9), 67-73.
[27] Machdar, I., Sekiguchi, Y., Sumino, H., Ohashi, A., Harada, H. (2000b). Combination of a UASB Reactor and a Curtain type DHS (Downflow Hanging Sponge) Reactor as a Cost-Effective Sewage Treatment System for Developing Countries. Wat. Sci. Technol., 42 (3–4), 83–88.
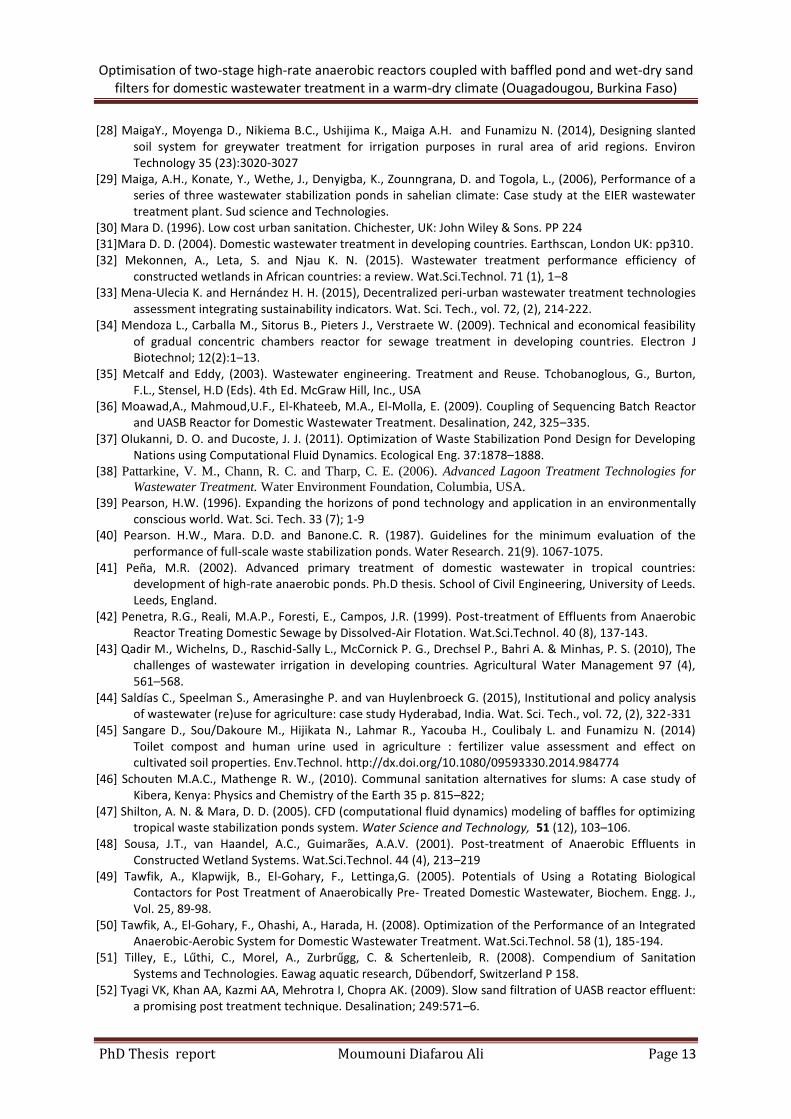
Optimisation of two-stage high-rate anaerobic reactors coupled with baffled pond and wet-dry sand
filters for domestic wastewater treatment in a warm-dry climate (Ouagadougou, Burkina Faso)
PhD Thesis report Moumouni Diafarou Ali Page 13
[28] MaigaY., Moyenga D., Nikiema B.C., Ushijima K., Maiga A.H. and Funamizu N. (2014), Designing slanted soil system for greywater treatment for irrigation purposes in rural area of arid regions. Environ Technology 35 (23):3020-3027
[29] Maiga, A.H., Konate, Y., Wethe, J., Denyigba, K., Zounngrana, D. and Togola, L., (2006), Performance of a series of three wastewater stabilization ponds in sahelian climate: Case study at the EIER wastewater treatment plant. Sud science and Technologies.
[30] Mara D. (1996). Low cost urban sanitation. Chichester, UK: John Wiley & Sons. PP 224 [31]Mara D. D. (2004). Domestic wastewater treatment in developing countries. Earthscan, London UK: pp310. [32] Mekonnen, A., Leta, S. and Njau K. N. (2015). Wastewater treatment performance efficiency of
constructed wetlands in African countries: a review. Wat.Sci.Technol. 71 (1), 1–8 [33] Mena-Ulecia K. and Hernández H. H. (2015), Decentralized peri-urban wastewater treatment technologies
assessment integrating sustainability indicators. Wat. Sci. Tech., vol. 72, (2), 214-222. [34] Mendoza L., Carballa M., Sitorus B., Pieters J., Verstraete W. (2009). Technical and economical feasibility
of gradual concentric chambers reactor for sewage treatment in developing countries. Electron J Biotechnol; 12(2):1–13.
[35] Metcalf and Eddy, (2003). Wastewater engineering. Treatment and Reuse. Tchobanoglous, G., Burton, F.L., Stensel, H.D (Eds). 4th Ed. McGraw Hill, Inc., USA
[36] Moawad,A., Mahmoud,U.F., El-Khateeb, M.A., El-Molla, E. (2009). Coupling of Sequencing Batch Reactor and UASB Reactor for Domestic Wastewater Treatment. Desalination, 242, 325–335.
[37] Olukanni, D. O. and Ducoste, J. J. (2011). Optimization of Waste Stabilization Pond Design for Developing Nations using Computational Fluid Dynamics. Ecological Eng. 37:1878–1888.
[38] Pattarkine, V. M., Chann, R. C. and Tharp, C. E. (2006). Advanced Lagoon Treatment Technologies for
Wastewater Treatment. Water Environment Foundation, Columbia, USA.
[39] Pearson, H.W. (1996). Expanding the horizons of pond technology and application in an environmentally conscious world. Wat. Sci. Tech. 33 (7); 1-9
[40] Pearson. H.W., Mara. D.D. and Banone.C. R. (1987). Guidelines for the minimum evaluation of the performance of full-scale waste stabilization ponds. Water Research. 21(9). 1067-1075.
[41] Peña, M.R. (2002). Advanced primary treatment of domestic wastewater in tropical countries: development of high-rate anaerobic ponds. Ph.D thesis. School of Civil Engineering, University of Leeds. Leeds, England.
[42] Penetra, R.G., Reali, M.A.P., Foresti, E., Campos, J.R. (1999). Post-treatment of Effluents from Anaerobic Reactor Treating Domestic Sewage by Dissolved-Air Flotation. Wat.Sci.Technol. 40 (8), 137-143.
[43] Qadir M., Wichelns, D., Raschid-Sally L., McCornick P. G., Drechsel P., Bahri A. & Minhas, P. S. (2010), The challenges of wastewater irrigation in developing countries. Agricultural Water Management 97 (4), 561–568.
[44] Saldías C., Speelman S., Amerasinghe P. and van Huylenbroeck G. (2015), Institutional and policy analysis of wastewater (re)use for agriculture: case study Hyderabad, India. Wat. Sci. Tech., vol. 72, (2), 322-331
[45] Sangare D., Sou/Dakoure M., Hijikata N., Lahmar R., Yacouba H., Coulibaly L. and Funamizu N. (2014) Toilet compost and human urine used in agriculture : fertilizer value assessment and effect on cultivated soil properties. Env.Technol. http://dx.doi.org/10.1080/09593330.2014.984774
[46] Schouten M.A.C., Mathenge R. W., (2010). Communal sanitation alternatives for slums: A case study of Kibera, Kenya: Physics and Chemistry of the Earth 35 p. 815–822;
[47] Shilton, A. N. & Mara, D. D. (2005). CFD (computational fluid dynamics) modeling of baffles for optimizing tropical waste stabilization ponds system. Water Science and Technology, 51 (12), 103–106.
[48] Sousa, J.T., van Haandel, A.C., Guimarães, A.A.V. (2001). Post-treatment of Anaerobic Effluents in Constructed Wetland Systems. Wat.Sci.Technol. 44 (4), 213–219
[49] Tawfik, A., Klapwijk, B., El-Gohary, F., Lettinga,G. (2005). Potentials of Using a Rotating Biological Contactors for Post Treatment of Anaerobically Pre- Treated Domestic Wastewater, Biochem. Engg. J., Vol. 25, 89-98.
[50] Tawfik, A., El-Gohary, F., Ohashi, A., Harada, H. (2008). Optimization of the Performance of an Integrated Anaerobic-Aerobic System for Domestic Wastewater Treatment. Wat.Sci.Technol. 58 (1), 185-194.
[51] Tilley, E., Lűthi, C., Morel, A., Zurbrűgg, C. & Schertenleib, R. (2008). Compendium of Sanitation Systems and Technologies. Eawag aquatic research, Dűbendorf, Switzerland P 158.
[52] Tyagi VK, Khan AA, Kazmi AA, Mehrotra I, Chopra AK. (2009). Slow sand filtration of UASB reactor effluent: a promising post treatment technique. Desalination; 249:571–6.

Optimisation of two-stage high-rate anaerobic reactors coupled with baffled pond and wet-dry sand
filters for domestic wastewater treatment in a warm-dry climate (Ouagadougou, Burkina Faso)
PhD Thesis report Moumouni Diafarou Ali Page 14
[53] UN-HABITAT (2008), THE STATE OF 2008 AFRICAN CITIES, A framework for addressing urban challenges in Africa, 1st edition, chp.1 P.4, Earthscan, London
[54] Van der Steen, N. P. (2008). Sustainable wastewater treatment and reuse, lecture note, Delft, UNESCO- IHE: Institute for water Education. Netherlands
[55] Van Haandel A. C., Lettinga G. (1994). Anaerobic sewage treatment: a practical guide for regions with a hot climate. Chichester, UK: John Wiley & Sons; p. 226
[56] Veenstra, S. and Alaerts, G. (1996). Technology selection for pollution control. In: Balkema A, Aalbers H and Heijndermans E (Eds). Workshop on sustainable municipal waste water treatment systems, Leusdan, the Netherlands, 17-40
[57] von Sperling, M., Freire, V.H., Chernicharo, C.A.L. (2001). Performance Evaluation of a UASB–Activated Sludge System Treating Municipal Wastewater. Wat.Sci.Technol. 43 (11), 323–328.
[58] von Sperling, M. Chernicharo, C.A.L. Soares A.M.E. and Zerbini A.M. (2002). Coliform and helminth eggs removal in a combined UASB reactor–baffled pond system in Brazil: performance evaluation and mathematical modelling. Wat.Sci.Technol. 45 (10), 237–242
[59] von Sperling, M. and Chernicharo, C.A.L. (2005). Biological wastewater treatment in warm climate regions. Volume 1, IWA publishing, Alliance House, 12 Carton Streets London ISBN: 1843390027, UK, P. 856
[60] von Sperling,M. and Mascarenhas, L.C.A.M. (2005). Performance of Very Shallow Ponds Treating Effluents from UASB Reactors. Wat.Sci. Technol., 51 (12), 83-90.
[61] World Bank (2008), Environmental Health and Child Survival: Epidemiology, Economics Experiences. World Bank, Washington, DC, USA, 210 p.
[62] Yalcuk, A., Baldan, N. P. & Yaprak, S. T. (2010). Performance evaluation on the treatment of olive mill waste water in vertical subsurface flow constructed wetlands. Desalination 262, 209–214.

Optimisation of two-stage high-rate anaerobic reactors coupled with baffled pond and wet-dry sand filters for
domestic wastewater treatment in a warm-dry climate (Ouagadougou, Burkina Faso)
PhD Thesis report Moumouni Diafarou Ali Page 15
Chapter 2
2. Design, implementation and performance evaluation of AR-BP and AR-SF
2.1 Design and implementation of the pilot plant
The design of the two options AR-BP and AR-SF was based on two concepts of low-cost
wastewater treatment technologies as described in the introduction section. The two
concepts are: (i) anaerobic systems based on the anaerobic ponds of WSPs, septic tanks, and
Upflow Anaerobic Sludge Blanket (UASB) reactors; and (ii) aerobic systems including the
facultative and maturation ponds of WSPs and the vertical-flow sand filtration.
2.1.1 Anaerobic systems
Anaerobic systems are mainly designed to remove organic matter and suspended solids via
the sedimentation of the settleable fraction and its subsequent anaerobic digestion in the
resulting sludge layer (Peña, 2002, Mara, 2004, Camargo-Valero, 2008). Furthermore,
Camargo-Valero (2008) found that about 30 percent of influent soluble organic matter is
transformed by anaerobic processes to biogas (CH4, CO2). A brief review of the design
procedures for Anaerobic Ponds (AP), UASB reactors, and septic tanks is presented in the
following paragraphs.
Anaerobic Pond
The design procedure for anaerobic ponds is based on calculations of the influent
volumetric organic load, as a function of temperature and wastewater strength.
Hydraulically, either a plug flow or a completely mixed model is assumed (Peña et al., 2000).
Typical design values and operation information for anaerobic ponds are showed in Table
2.1 (Peña, 2002; Mara, 2004; Camargo-Valero, 2008). These literature values were used
based on Burkina Faso climatic conditions (warm-dry) for a rational approach to design the
anaerobic reactor. It was suggested by AWWA (1991) that before undertaking a final
process design, to carry out extensive raw sewage BOD5 sampling during at least two years,
since high levels of this parameter often represent the main limiting factor in the design
process within developing countries.

Optimisation of two-stage high-rate anaerobic reactors coupled with baffled pond and wet-dry sand filters for
domestic wastewater treatment in a warm-dry climate (Ouagadougou, Burkina Faso)
PhD Thesis report Moumouni Diafarou Ali Page 16
Table 2.1: Design and operation values for anaerobic ponds
Parameters Design value
Temperature (0C) Mean air temperature of the coldest month
pH (-) 7.5
Depth (m) 3 to 5
Theoretical hydraulic retention time (d) 1 to 3
Influent sulphate concentration (mg/l) <500 Design values of volumetric organic loading λv
λv
(gBOD/m3d) BOD5 (removal %)
Temperature (T) 0C
100 40 <10 20T-100 2T+20 10 to 20 10T+100 2T+20 20 𝑡0 25
350 70 >25
Anaerobic Pond volume Vap(m3) Vap=
BODinfluent(g m3⁄ )×influent flow rate (m3 d⁄ )
λv
(2.1)
Sludge accumulation rate SAR 0.04 m3/person equivalent (PE)/year
Interval of desludging n (years) Once every 1 to 3 years whenn=Vap
3×
1
PE×SAR (2.2)
Source: Peña (2002), Mara (2004), Camargo-Valero (2008), Van der Steen (2008)
Septic tanks
The design procedure for Septic tanks that is presented here and described by Mara (1996)
is based on Brazilian septic code. This reactor is considered to have four zones, each of
which serves a different function: scum storage zone, sedimentation zone, sludge digestion
zone, and digested sludge storage zone (Figure 2.1). Table 2.2 outlines the basic equations
mainly used to estimate the total septic tank design capacity. For better on-site effluent
disposal, the septic tank should be divided into at least two compartments and usually two-
thirds the total volume is assigned to the first compartment and one-third to the second
(Mara 1996).
Source: Mara (1996)
Figure 2.1: The four functional zones of a Septic tank
By knowing the local conditions, such as the population served, the wastewater generated per capita per day, and the mean air temperature in the coldest month, the equations in Table 2.2 could be systematically applied to determine a septic tank design capacity.
Scum storage
Sedimentation zone
Sludge digestion
Digested sludge storage
Inlet Outlet

Optimisation of two-stage high-rate anaerobic reactors coupled with baffled pond and wet-dry sand filters for
domestic wastewater treatment in a warm-dry climate (Ouagadougou, Burkina Faso)
PhD Thesis report Moumouni Diafarou Ali Page 17
Table 2.2: Design equations for septic tank
Septic tank Zone Design equation
Scum storage Vsc (m3)
According to the Brazilian septic code, the volume of scum is about 30-40% of that of the sludge, thus the
volume for scum storage may be calculated as follows:
𝑉𝑠𝑐 = 0.4𝑉𝑠𝑙 (2.3) Where: Vsc is the volume of scum in m3 and Vsl is the
volume of sludge accumulation in m3
Sedimentation Vh (m3)
The required time to allow settleable solids to sediment is given by Equation 2.2. It decreases with the number of people served:
𝑡ℎ = 1.5 − 0.3 ∗ log (𝑃 ∗ 𝑞) (2.4) Where: th= minimum mean hydraulic retention time for sedimentation, in days, (should not be less than 0.2 day)
P=contributing population, q=wastewater flow per person, l/day.
The volume for sedimentation (Vh in m3) is given by: 𝑉ℎ = 10−3 ∗ 𝑃 ∗ 𝑞 ∗ 𝑡ℎ (2.5)
Sludge digestion Vd(m3)
The requiredtime for anaerobic digestion to settle digested solids (td, days) is given by the Equation 2.4. It varies with temperature (T, in °C):
𝑡𝑑 = 1853𝑇−1.25 (2.6) Various equations for td were derived in the literature by considering the process growth kinetics of a completely mixed anaerobic digester (Mara 1996). The volume of fresh sludge is assumed to be 1liter per person per day (l/cd). When it passes to the sludge storage zone and digests during td days, its volume reduces to 0.5 l/cd. Therefore, the volume of the sludge digestion zone (Vd, in m3) may be calculated as:
Vd=0.5*10-3*P*td (2.7)
Digested sludge storage Vsl (m3)
The rate of accumulation of digested sludge (r, in m3 per person per year) and the interval between successive desludging operations (n, years) are the main variables to evaluate the volume of the sludge storage zone. The following design values for (r) are used:
For n<5:……………………r=0.06 m3/person year And n>5:…………………..r=0.04 m3/person year
The sludge storage volume (Vsl, in m3) is given by: Vsl=r*P*n (2.8)
Total volume of the septic tank V (m3)
The reactor capacity of the septic tank (V in m3) is the sum of the volumes for scum storage, sedimentation, digestion and sludge storage(volume for the free board should be considered):
𝑉=Vsc+Vh+Vd+Vsl (2.9) Since Vsc=0.4Vsl, then 2.9 becomes:
V=Vh+Vd+1.4Vsl (2.10)
Source: Mara (1996)

Optimisation of two-stage high-rate anaerobic reactors coupled with baffled pond and wet-dry sand filters for
domestic wastewater treatment in a warm-dry climate (Ouagadougou, Burkina Faso)
PhD Thesis report Moumouni Diafarou Ali Page 18
UASB reactor
The design of UASB reactor combines the features of a high-rate bioreactor with those of an
in-built secondary at the top. The major parameters considered when designing a UASB
reactor are: organic load, hydraulic load, gas load, and solids retention time (SRT).
Prior to designing a UASB reactor, a thorough wastewater characterisation is necessary.
When the allowable organic loading rate or the volumetric loading rate is known, the
required UASB reactor volume can be easily calculated from the influent flow rate and its
concentration (Equation 2.11) (Henze et al. 2008):
VUASB=CODinf*Qinf
λv (2.11)
Where: VUASB = volume of the UASB reactor (m3)
CODinf= influent COD (kg/m3)
Qinf= influent flow rate (m3/day)
λv= Volumetric organic loading rate (kgCOD/m3/day
The λv depends on temperature, sludge quality, and wastewater composition (Table 2.3).
Table 2.3: Design guidelines for UASB with granular sludge
Operational Temperature (0C) Volumetric organic loading rate (kg COD/m3/day)
Soluble COD 30% SS-COD
15 1.5-3 1.5-2
20 2-4 2-3
25 4-8 3-6
30 8-12 6-9
35 12-18 9-14
40 15-24 14-18
Source: Henze et al. (2008)
Once the size of the reactor is fixed, the upflow velocity can be determined from Equation
2.12:
Uupw=Qinf
A (2.12)
Where: UUpw = average upflow velocity of the wastewater (m/h)
Qinf= influent flow rate (m3/h)
A= cross sectional area of the reactor (m2)
Some typical values of UUpw from the literature are applied depending on the wastewater
characteristics: 3 m/h for soluble industrial wastewater; 1 to 1.5 m/h for partially soluble
(pre-settled sewage); and 0.5 m/h for wastewater with a high content of suspended solids
(Henze et al. 2008). In addition to the wastewater upflow velocity, the UASB reactor is also

Optimisation of two-stage high-rate anaerobic reactors coupled with baffled pond and wet-dry sand filters for
domestic wastewater treatment in a warm-dry climate (Ouagadougou, Burkina Faso)
PhD Thesis report Moumouni Diafarou Ali Page 19
mixed by the turbulence brought about by the biogas production. The biogas upward
velocity can be calculated using Equation 2.13 below:
Ubiogas=CODload
CODconv-meth
100
0.35
Fmeth-biogas
(T+273)
273Uupw (2.13)
Where: Ubiogas = Biogas upward velocity (m/h)
CODload= influent COD concentration (kg/m3)
CODconv-meth= % of the COD (in m3/day) converted to methane
Fmeth-biogas= methane fraction of biogas (generally between 0.6 and 0.9 of the wastewater)
T= average ambient temperature (0C)
UUpw = average upflow velocity of the wastewater (m/h)
Another parameter for optimal UASB design is sludge retention time (SRT; Equation 2.14).
SRT=Total sludge present in the UASB reactor (kg)
Sludge withdrawn per day from the reactor(kg
day) (in days) (2.14)
Generally, UASB reactors are applied where the temperature in the reactors will be above
20°C. At equilibrium condition, sludge withdrawn has to be equal to sludge produced daily
(Henze et al. 2008).
2.1.2 Semi-aerobic and aerobic systems
Facultative pond
A number of empirical and theoretical models exist for the design of facultative ponds.
These include first-order plug flow reactors, first-order completely mixed reactors, first-
order dispersed flow reactors (Equations 2.19 to 2.21), and surface organic loading
(Equations 2.22, 2.23) (Table 2.4). All of these provide reasonable designs, as long as the
basis for the formula is understood and proper parameters are selected. This wide variation
reflects the variety in design and the great importance of local climatic conditions
(Thirumurthi, 1974).

Optimisation of two-stage high-rate anaerobic reactors coupled with baffled pond and wet-dry sand filters for
domestic wastewater treatment in a warm-dry climate (Ouagadougou, Burkina Faso)
PhD Thesis report Moumouni Diafarou Ali Page 20
Table 2.4: Design models for facultative ponds
Model Characteristics
Marais and Shaw (1961)
𝑪𝒆 =𝑪𝒊
(𝟏+𝑲𝒕×𝜽)𝒏 (2.15)
Where: Ce= effluent BOD5 from the last pond n, (mg/l) Ci = influent BOD5 (mg/l) Kt = reaction rate constant at temperature T, (d
-1)
θ =theoretical hydraulic retention time (d) n = number of ponds in series
Model based on first-order kinetics in n ideal
completely mixed reactors in series with equal
retention time. This model assumes light penetration
to the bottom ofpond. The value of ktis temperature
dependent as follows:
Kt=K35(1.085)(35-T) (2.16)
Where:
k35= reaction rate constant at 35°C = 1.2 day-1
T = minimum operating water temperature (°C)
Reed et al. (1988)
𝑪𝒆 = 𝑪𝒊 × 𝒆−𝑲𝒕×𝜽 (2.17) Where: Ce= effluent BOD5 (mg/l) Ci = influent BOD5 (mg/l) Kt = reaction rate constant at temperature T, (d
-1)
θ =theoretical hydraulic retention time (d)
Model based on first-order kinetics in ideal plug flow
reactors. The value of kt is temperature dependent as
follows:
Kt=K20(1.09)(T-20) (2.18)
where
k20 = reaction rate constant at 20°C day-1
T =minimum operating water temperature ( °C)
k20 depends on the BOD5 surface loading rate,but if
this is not known, a value of 0.1 d-1
may be used
Thirumurthi (1969), based on Wehner and Wilhelm’s equation (1956)
Ce=Ci×4ae
12δ
(1+a)2ea
2δ-e-
a2δ
(2.19)
Where:
a=√1+4Ktθδ (2.20) Ce= effluent BOD5 (mg/l) Ci = influent BOD5 (mg/l) Kt = reaction rate constant at temperature T, (d
-1)
θ =theoretical hydraulic retention time (d) δ =dispersion number
This is a dispersed flow model based on firstorder
kinetics. The value of is unknown at design stage
and can be determined directly by tracer studies
when the pond is in operating. The value of k is
temperature dependent as follows:
Kt=K20(1.09)(T-20) (2.21)
where
k20 = reaction rate constant at 20°C, d-1
T = minimum operating water temperature, °C
McGarry and Pescod (1970)
𝝀𝒔 = 𝟔𝟎(𝟏. 𝟎𝟗𝟗)𝑻 (2.22) Where: λs= maximum BOD5 loading before failure, (kg/ha d) T= Temperature (
0C)
Model based on the maximum surface BOD loading
rate that can be applied to a facultative pond before
it fails.
Mara (1987)
𝝀𝒔 = 𝟑𝟓𝟎(𝟏. 𝟏𝟎𝟕 − 𝟎. 𝟎𝟎𝟐𝑻)𝑻−𝟐𝟓 (2.23) Where: λs= BOD5 loading rate, (kg/ha d) T= Temperature (
0C)
This surface BOD loading rate model is based on
McGarry – Pescod’s model and incorporates a safety
factor to give a global design equation for facultative
ponds loading.
Maturation Pond
Maturation ponds are mainly designed to reduce the amount of pathogenic organisms
(faecal coliform bacteria and helminth eggs), but also BOD, suspended solids and nutrients
(nitrogen and phosphorus). The size and number of these ponds working in series are
normally determined by the required microbiological quality of the final effluent (Mara,

Optimisation of two-stage high-rate anaerobic reactors coupled with baffled pond and wet-dry sand filters for
domestic wastewater treatment in a warm-dry climate (Ouagadougou, Burkina Faso)
PhD Thesis report Moumouni Diafarou Ali Page 21
2004; Camargo-Valero, 2008). Marais (1974) proposed a model for Escherichia coli die-off
based on first-order kinetics in an ideal completely mixed reactor. The faecal coliform (FC)
removal is expressed as follows:
Ne
Nin=
1
[1+KdHRT
n]n (2.24)
Kd=2.61(1.19)T-20 (2.25)
Where: Nin= number of faecal coliform in the influent (MPN/100mL)
Ne= number of faecal coliform in the effluent (MPN/100mL)
Kd=First order decay coefficient (day-1).
HRT=hydraulic retention time (days)
n= number of maturation ponds in series
T= minimum operating water temperature (°C)
Marais’ model has been criticised because it only includes time and temperature. According
to Camargo-Valero (2008) the von Sperling’s model can be recommended in preference to
Marais’s model, since it takes into consideration some additional parameters of pond
geometry. The von Sperling (2005) model (Equations 2.30 and 2.31) was derived from an
extensive evaluation of the coliform decay in facultative and maturation ponds, based on
data from 186 different ponds in the world.
Ne
Nin=[
4𝑎
(1+𝑎)2]𝑒𝑥𝑝 [
1−𝑎
2𝛿] (2.26)
a=√1+Kd(T)*δ*HRT (2.27)
𝛿 = [𝐿
𝐵]−1 (2.28)
Kd(T)=𝐾𝑑(20)(1.07)T-20 (2.29)
Kd(20)=0.682H-1.286𝐻𝑅𝑇−0.103 (2.30)
Or simplified Kd(20)=0.549H-1.456 (2.31)
Where: Nin= number of faecal coliform in the influent (MPN/100mL)
Ne= number of faecal coliform in the effluent (MPN/100mL)
δ= dispersion number
Kd(T)= first order decay coefficient at temperature T (day-1).
Kd(20)= first order decay coefficient at temperature 20 °C (day-1).
HRT=hydraulic retention time (days)
L, B, H= pond length, width and depth respectively (m)
T= Temperature (°C)
For modern, optimal and suitable design procedures, for both facultative and maturation
ponds, most designers prefer the dispersed-flow model based on first-order kinetics (von
Sperling, 2005). It is more flexible, may be set to adjust to different pond geometries, and

Optimisation of two-stage high-rate anaerobic reactors coupled with baffled pond and wet-dry sand filters for
domestic wastewater treatment in a warm-dry climate (Ouagadougou, Burkina Faso)
PhD Thesis report Moumouni Diafarou Ali Page 22
the unknown dispersion number () during the design stage can be determined based on
the von Sperling (1999) Equation (2.28).
Baffled pond design
Inclusion of baffles in pond systems has been an extensive area of interest for many
researchers (Kilani and Ogunrombi, 1984; Muttamara and Puetpaiboon, 1997; Oke and
Otun, 2001; von Sperling et al., 2002, 2003; Shilton and Harrison, 2003; Shilton and Mara,
2005; Banda, 2007; Babu, 2011; Olukanni and Ducoste, 2011; Sah et al., 2012; Olukanni,
2013; Cortés-Martínez et al., 2014). These studies have revealed that the addition of baffles
or wind-induced mixing improves the hydraulic conditions of the ponds, enhances pond
ecology and hence in most cases also improves the effluent quality. Moreover, these
researchers have tested different lengths of baffles and have concluded that the use of
channels or baffles to 70 percent of the length gives better results, both in the hydraulic
system of the pond and in the wastewater treatment. Furthermore, some researchers have
found that the introduction of artificial attached growth media in the pond water could
enhance the performance of WSP in terms of the removal of organic, ammonia nitrogen and
suspended solids (Shin and Polprasert, 1988).
In traditional baffle designs, a minimum of two baffles is recommended. However, according
to Oke and Otun, (2001) and Shilton and Harrison, (2003) including a greater number of
baffles significantly improves hydraulic efficiency of the ponds. Then, on the other hand, it is
important to consider the costs of construction by conducting a cost effectiveness study.
Thus, much investigation is currently being done on mathematical modeling to optimize the
design of baffled ponds. For instance, Olukanni and Ducoste, (2011) used a computational
fluid dynamics (CFD) model coupled with an optimization program to optimize the selection
of the best WSP configuration, based on cost and treatment efficiency. These studies
revealed that it was possible to minimize the baffled pond cost, meet or exceed a target
effluent log reduction of faecal coliforms, and at the same time reduce the amount of
construction material, while tolerating some degree of fluid mixing within a pond.
Furthermore, recently Cortés-Martínez et al., (2014) used the Matlab optimization Toolbox
to show that short baffles could provide similar improvements as longer “traditional” baffle
designs, and therefore potentially offering significant savings in construction costs. In
addition, in the same study, it was found that more than four baffles gave only marginal
improvements.
Vertical-flow sand filtration
The American Water Works Association (AWWA) has merely described the filter as a bed of
sand supported by a layer of gravel, all of which is confined within a box, with accessories to
introduce and remove water. Filtration is one of the principal treatments applied in the
treatment of potable water, however, now filtration is used as post-treatment in
wastewater treatment plants. The first filtration process developed for the treatment of

Optimisation of two-stage high-rate anaerobic reactors coupled with baffled pond and wet-dry sand filters for
domestic wastewater treatment in a warm-dry climate (Ouagadougou, Burkina Faso)
PhD Thesis report Moumouni Diafarou Ali Page 23
wastewater was the Slow Sand Filter, with typical filtration rates of 30 to 60 l/m2/day, and
later optimized to rapid sand filtration of 80 to 200 l/m2/minute (Metcalf and Eddy, 2003).
According to AWWA (1991), a sand filter is simple in design, construction and operation. The
key design parameters mainly include: Hydraulic loading rate (HLR), sand size, sand bed
depth, water depth, and frequency of backwashing. The first step to consider in the design
process is to size the bed (AWWA, 1991). The bed area and depth are basic dimensions that
drive the rest of the design. The bed area is calculated by using Equation 2.32, based on a
selected HLR. However, the depth of the sand bed is determined by the number of years of
operation desired before resanding is needed and by any constraints on the filter box depth
(Equation 2.33).
HLR =Q
A (2.32)
n =yi−yf
R∗f (2.33)
Where: HLR= Hydraulic loading rate (m3/m2/h) Q= flow rate of water (m3/h) A= required bed area (m2) n= years of operation before sand bed rebuilding is necessary (years) yi=initial sand bed depth (m) yf= final sand bed depth before rebuilding (m) R=sand bed removal per scraping (m/scraping) f= frequency of scraping (scrapings/years)
2.1.3 Approach to the development of AR-BP and AR-SF
The basic principles that have governed the design of two-stage high-rate anaerobic
reactors followed by two polishing options (baffled pond with attached growth and wet-dry
sand filters) are summarized in the following points:
An optimal combination of low-cost, anaerobic and aerobic systems, which can
achieve high-quality effluent and also offer resource recovery (water, nutrients and
energy);
The selected treatment units should be affordable for the local population and only
include locally available construction materials;
The anaerobic system was conceived based on the design concepts described in the
above paragraphs (anaerobic pond, UASB reactor, and septic tank design
procedures) and then the optimal option was adopted;
The pilot plant was intended to be used by an urban poor community with about 50
inhabitants and each of them could contribute 40 L/capita/day (Maiga et al., 2014);
A design flow of 1 m3/day was considered at the initial point, then it was increased
gradually (to 1.5 m3/day) to check for the optimum operating condition;
An average temperature for the coldest month of 25 0C was adopted;
An influent concentration of faecal coliforms of 106 MPN/100 mL and biochemical
oxygen demand (BOD) of 250 mg/L were assumed (Maiga et al., 2006);

Optimisation of two-stage high-rate anaerobic reactors coupled with baffled pond and wet-dry sand filters for
domestic wastewater treatment in a warm-dry climate (Ouagadougou, Burkina Faso)
PhD Thesis report Moumouni Diafarou Ali Page 24
Three vertical baffles with 70 percent pond depth length were adopted, since the
literature has recommended a minimum of two and a maximum of four baffles
(Section 2.1.2);
A hydraulic loading rate of 0.02 m/h for a maximum sand bed area of 1 m2 was
adopted for the sand filter design.
2.2 Description and operation of the pilot plant
The application of the above design criteria resulted in the following characteristics of the
pilot plant (Table 2.5). The anaerobic treatment unit that receives the fresh sewage includes
two anaerobic reactors operated in series, and then the aerobic units finish the treatment
via either a baffled pond or sand filters operated in parallel.
Table 2.5: Summary of the design characteristics of each treatment unit
Treatment unit
Wastewater flow rate
Depth Surface area
Water Volume
Theoretical Hydraulic
Retention Time
Number of baffles
(m3/day) (m) (m
2)
(m
3)
(days) (units)
Anaerobic Reactor (R1) 1 to 1.5 1 1.5 1.5 1.5 to 1 -
Anaerobic Reactor (R2) 1 to 1.5 1 1.5 1.5 1.5 to 1 -
Baffled Pond (BP) 0.5 1.1 3.2 3.5 7 3
Control Pond (CP) 0.5 1.1 3.2 3.5 7 0
Sand Filter (SF)* 0.5 0.8 0.5 to 1 0.5 Infiltration time
5 minutes -
*: The two sand filters have the same characteristics but only one was in operation at one time
The pilot plant, illustrated in Figures 1.2 & 2.2, was designed and implemented at the International Institute for Water and Environmental Engineering (2iE) campus in Ouagadougou, Burkina Faso, in West Africa. This region is characterized by the Sudano Sahelian climate, which consists of two seasons: a dry season of 8 months from October to May, and a short rainy season of 4 months from June to September. Annual precipitation is between 600 and 900 mm. The coldest month of the year is January, with a mean temperature of 25oC, and April is the warmest one with an average of 34oC (min 16 oC and max 42oC). The climate of the site was described in detail by Konate et al., (2010). The wastewater from the hostels and offices (excluding wastewater from laboratories) was collected through a pipe network to a buffer tank installed upstream of the pilot plant. A peristaltic pump was used to provide an intermittent flow 3 times a day (at 8:00 am, 1:00 pm and 5:00 pm) from the buffer tank to the system. The system comprised two anaerobic reactors in series followed by two parallel polishing treatment units: a baffled pond and sand filters. The first and second anaerobic reactors were designed for organic matter removal, while the baffled pond and the sand filters were designed for further pathogen removal. Gravity flow of wastewater within the system was adapted to minimise operation and maintenance costs as shown in Figures 1.2. and 2.2.

Optimisation of two-stage high-rate anaerobic reactors coupled with baffled pond and wet-dry sand filters for
domestic wastewater treatment in a warm-dry climate (Ouagadougou, Burkina Faso)
PhD Thesis report Moumouni Diafarou Ali Page 25
Figure 2.2: Picture of the pilot plant
2.2.1 Two-stage High-rate Anaerobic Reactors
Two circular black plastic tanks of 1.4 m diameter (capacity of 2 m3 each) were connected in
series to serve as the high-rate anaerobic reactors (R1 and R2) and their theoretical
hydraulic retention time was 1.5 days each. At the top of the water surface of the anaerobic
reactors, 0.5 m3 was left for the biogas collection and storage. The anaerobic reactors were
simple tanks without internal structures, like covered anaerobic ponds. A mild slope
(0.08 %) was provided between the two reactors, to allow gravity flow from the first reactor
to the second. The flow from the second anaerobic reactor to both the baffled pond unit
and one of the sand filters was regulated by a rectangular crested weir (Figure 2.3 and Table
2.5).
Figure 2.3: Schematic view and picture of the two anaerobic reactors connected in series
2.2.2 Baffled pond with attached growth
The baffled pond (BP) was rectangular: 3.2 m long x 1.0 m wide x 1.25 m deep (including 15
cm of freeboard, thus the wastewater was 1.1 m deep). It was expected that a depth of 1.1
m would be sufficient to maintain aerobic conditions, especially since the wastewater is
forced by a baffle to come to the surface in the middle of the pond (Babu, 2011). The pond
was made of hollow cement bricks and covered with a thin layer of cement mortar to
Θ 1.4 m
To Post-treatment
1 m
1 m
0.5 m3
Inlet Inlet
outlet
outlet
upflow upflow
1. Peristaltic pump 2. Raw wastewater sampling
point 3. Anaerobic reactor 1 (R1) 4. Anaerobic reactor 1 (R2) 5. Flow splitter (crested weir) 6. Biogas collection points 7. Sand filters (SF1 & SF2) 8. Baffled pond (BP) 9. Control pond (CP) 10. Three vertical baffles with
affixed caps of waste plastic bottles
1
2
3
4 5
6
7
8 9
10

Optimisation of two-stage high-rate anaerobic reactors coupled with baffled pond and wet-dry sand filters for
domestic wastewater treatment in a warm-dry climate (Ouagadougou, Burkina Faso)
PhD Thesis report Moumouni Diafarou Ali Page 26
reduce leakage that may contaminate the groundwater. Three vertical baffles with some
specified intervals were installed, giving four compartments in the pond. The baffles were
made with thin, flexible sheets of plastic on which caps from waste plastic bottles were
affixed to increase the surface area (up to 60%) for the growth of biofilm. The baffles were
placed perpendicular to the influent flow direction, completely across the pond, with two
baffles extending downwards 70% of the pond depth while the one in the middle extended
the same distance up from the bottom, creating alternate upward and downward flows. The
wastewater was forced to flow under the first baffle, over the second one, and finally
beneath the third baffle in order to flow out of the system. This configuration was simulated
by Olukanni and Ducoste (2011) via a Computational Fluid Dynamics (CFD) model, which
indicated a high faecal coliform log-unit removal, at a lower cost than the conventional
horizontal flow. The theoretical mean hydraulic retention time for the baffled pond with
attached growth was 7 days. The control pond (CP) has the same design and environmental
conditions, except that baffles were not placed (Figure 2.4 and Table 2.5).
Figure 2.4: Schematic view and picture of the control pond and the baffled pond
2.2.3 Wet and sand filters
The sand filters (SF1 and SF2) were made up of three layers of local available filter media: one layer of coarse sand (0.50 m thick, with particles 0.05–2 mm in size), one layer of medium-size gravel (0.15 m thick, with particles 10–20 mm in size) and one layer of coarse gravel (0.15 m thick, with particles 20–40 mm in size), from the top to the bottom respectively. Perforated pipes (holes: 5 mm diameter, with a regular holes interval of 50
0.33 m
0.54 m 1.06 m 1.06 m 0.54 m
3.2 m
outlet
0.15 m
1.1 m
outlet inlet
inlet
Control Pond
Baffled Pond
Plastic bottles caps
0.10 m
Efflu
ent f
rom
ana
erob
ic re
acto
r 2
Inlet Inlet
outlet outlet Baffles with affixed plastic caps
Baffled pond Control pond

Optimisation of two-stage high-rate anaerobic reactors coupled with baffled pond and wet-dry sand filters for
domestic wastewater treatment in a warm-dry climate (Ouagadougou, Burkina Faso)
PhD Thesis report Moumouni Diafarou Ali Page 27
mm) were used to spread the influent over the top surface (1 m2) of the sand filter. To avoid clogging, two infiltration units were considered. It was arranged in such a way that, when one was in operation, the other was taken out (Figure 2.5 and Table 2.5). By using the Stopwatch-and-Bucket Method, the average infiltration time was estimated at 5 minutes.
Figure 2.5: Schematic view and picture of the two sand filters
2.2.4 Pilot Plant start-up and operation
Before supplying the pilot plant with the domestic wastewater, clean water was used to
wash and to test the water proofness of the system. On March 6, 2013, the first anaerobic
reactor was filled with 1.5 m3 of wastewater for acclimatization and growth of the necessary
community of bacteria. Then one week later, the second anaerobic reactor was filled by
pumping 1.5 m3 of wastewater from R1. One week later, a constant flow of wastewater
regulated by the peristaltic pump was supplied to the system. The pilot plant was operated
under two conditions referred to as period 1 and 2. During period 1 (P1), from 8 May 2013
to 6 May 2014, an intermittent flow of 1 m3 per day, pumped in three moments (at 8:00 am,
1:00 pm and 5:00 pm) was maintained. The theoretical hydraulic retention times of R1, R2,
and BP during this period (P1) were 1.5, 1.5 and 7 days respectively, while the infiltration
time of the sand filter was around 5 minutes. It should be noted that during P1, the CP had
not yet been constructed. In period 2 (P2), from 13 May 2014 to 12 May 2015, the influent
wastewater flow rate was increased to 1.5 m3 a day in 3 times (at 8:00 am, 1:00 pm and 5:00
pm). Therefore, the theoretical hydraulic retention times of R1 and R2 were reduced to 1
day each, whereas that of BP was maintained at 7 days. On the other hand, the CP was put
in operation, while the surface area of the unused sand filter was reduced by half (0.5 m2).
The major aim of increasing the influent flow rate, and reducing the sand bed area was to
estimate optimal operating conditions of the pilot plant.
2.3 Performance evaluation of the two treatment options: AR-BP and AR-SF
The pilot plant included two options of domestic wastewater treatment. The first, two-stage high-rate anaerobic reactors followed by a Baffled Pond (AR-BP) and the second two-stage high-rate anaerobic reactors coupled with wet-dry sand filters (AR-SF). This section focuses on the evaluation of the performance of these two options in terms of the removal of
Sand filter 2 Sand filter 1
Eff
lue
nt
fro
m a
na
ero
bic
re
act
or
2
Perforated pipes Perforated pipes
outlet
Sand Sand
coarse gravel
mean gravel
coarse gravel
mean gravel
0.2
m
0.5
m
1 m
0.1
5 m
0.1
5m
Inlet

Optimisation of two-stage high-rate anaerobic reactors coupled with baffled pond and wet-dry sand filters for
domestic wastewater treatment in a warm-dry climate (Ouagadougou, Burkina Faso)
PhD Thesis report Moumouni Diafarou Ali Page 28
organics, pathogens and nutrients under the two operating periods (P1 and P2), as described in Section 2.2.4.
2.3.1 Methodology
Sampling and analysis
Grab samples of 500 ml were taken each week during the entire duration of the study,
between 8:00 to 9:00 a.m., at the following points in the system:
the influent wastewater (RW),
the effluent of the first anaerobic reactor (R1),
the effluent of the second anaerobic reactor (R2),
the effluent of the baffled pond with attached growth (BP),
the effluent of the wet-dry sand filter (SF), and
the effluent of the control pond (CP).
Wastewater samples were collected in plastic bottles for organic and nutrient parameters
and in glass bottles for indicator microorganisms. The collected samples were stored at 4 ºC
and analysed within 3 hours for TSS, BOD5, COD, nutrients and indicator microorganisms in
the 2iE Laboratory, whereas pH, temperature, dissolved oxygen (DO) and electrical
conductivity (EC) were measured immediately, in situ, according to the Standard Methods
APHA (2012), as summarized in Table 2.6.

Optimisation of two-stage high-rate anaerobic reactors coupled with baffled pond and wet-dry sand filters for
domestic wastewater treatment in a warm-dry climate (Ouagadougou, Burkina Faso)
PhD Thesis report Moumouni Diafarou Ali Page 29
Table 2.6: Summary of methods and parameters analysed
Parameters Reagents / apparatus
General
parameters
pH, water temperature (T), dissolved oxygen (DO), electrical conductivity (EC), and redox potential
In-situ measurement with an integrated portable probe fitted with calibrated electrodes using the manufacturer’sinstructions (WTW 340i/SET).
Total suspended solids (TSS)
Filtration of the samples through pre-weighed 0.45 μm GFC (Whatman® glass microfiber filters ) filter.
Organic
parameters
Total and filtered Chemical oxygen demand (COD)
Potassium dichromate method using a spectrophotometer at 620 nm light waves (Hack Lange, DR 5000)
Total and filtered 5-day biochemical oxygen demand (BOD5)
Using BOD meter-WTW OxiTop, after 5 days of incubation at 20 ⁰C
Nutrients
Ammonia (NH3) Nessler solution method using a spectrophotometer at 425 nm light waves (Hack Lange, DR 5000)
Nitrite (NO2) Nitriver method using a spectrophotometer at 585 nm light waves (Hack Lange, DR 5000)
Nitrate (NO3) Nitraver method using a spectrophotometer at 500 nm light waves (Hack Lange, DR 5000)
Orthophosphate (PO4) Phosver method using a spectrophotometer at 890 nm light waves (Hack Lange, DR 5000)
Total phosphate (P) Vanadomolybdate method using a spectrophotometer at 430 nm light waves (Hack Lange, DR 5000)
Indicator
microorganisms Escherichia coli (E. coli)and Faecal coliform
Spread plate method using Chromocult Coliform Agar (Merck KGaA 64271, Darmstadt, Germany) as culture medium.
Statistical analyses
To appreciate the additional value of each treatment option, for each period, some statistical tests were conducted with STATISTICA 8.0 software (IBM). The t-test for independent (paired) samples for the treatment units in parallel at 5% significance level was used.
2.3.2 Results and Discussion
A total number of 565 samples were collected and analysed from the inlet of the pilot plant to the outlets of each treatment units, during each of the two periods.
Characteristics of raw and treated wastewater
Tables 2.7 and 2.8 summarize the averages and the standard deviations of influent and effluent concentrations, together with the volumetric/surface mass loading rates for parameters that were analysed during Period 1 (P1) and Period 2 (P2). The allowable volumetric/surface mass loading rates are similar to the range of those reported in the literature (Metcalf & Eddy, 2003; von Sperling & Chernicharo, 2005; Van der Steen, 2008; Henze et al., 2008; Khan et al., 2013).

Optimisation of two-stage high-rate anaerobic reactors coupled with baffled pond and wet-dry sand filters for
domestic wastewater treatment in a warm-dry climate (Ouagadougou, Burkina Faso)
PhD Thesis report Moumouni Diafarou Ali Page 30
The p-values of the t-test comparing effluent concentrations and removal efficiencies in both BP and SF treatment options and for both periods are shown in Table 2.9.
The E. coli concentrations (around 107) in the raw wastewater (Tables 2.7 and 2.8) are similar to the range of those reported in the literature (Metcalf and Eddy, 2003; von Sperling and Chernicharo, 2005; Henze et al., 2008; Khan et al., 2013). E. coli was not detected in the effluent of any of the samples from the Baffled Pond during either period, whereas, about 1000 MPN/100ml of E. coli were found in Sand Filter effluents (Tables 2.7 and 2.8). In both Periods 1 and 2, a high variability of both E. coli and faecal coliforms was noticed in the raw wastewater and effluents of each treatment unit, except for the Baffled Pond, where no E. coli were detected (Figure 2.6). Possible explanations for this great variability of faecal indicators in raw wastewater could be: time of the year (hot or cold), type of sampling used (grab samples were collected at peak hours 8:00 am to 9: 00 am here), socioeconomic status of the populations contributing to the wastewater generation, low per capita water consumption, as discussed in more detail by Oliveira & von Sperling (2006) and Henze et al. (2008).
In order to understand the absence of E. coli in the Baffled Pond effluent, a Control Pond without baffles was constructed to provide a basis of comparison (Chapter 4).
Figure 2.6: Variations of E. coli concentrations over time in raw and treated wastewater
from each treatment units during Period 1.
Note that similar trends were observed during Period 2.
On the other hand, the mean concentrations in the raw wastewater for Periods 1 and 2
were estimated to be 424 and 425 mg/l for COD, 252 and 255 mg/l for BOD5, and 148 and
134 mg/l for TSS, respectively (Tables 2.7 and 2.8). In general, a difference was noticed
between the ranges usually reported in the literature (Metcalf and Eddy, 2003; von Sperling
and Chernicharo, 2005; Henze et al., 2008; Khan et al., 2013) and those effectively observed,
taking into consideration COD, BOD5, and TSS constituents in the domestic wastewater of
developing countries, with a prevalence of influent concentrations lower than expected.
This could be as a result of the high dilution factor of the 2iE campus wastewater, since no
water-saving devices were in use.
1E+00
1E+07
RW
R1
R2
BP
SF
E. c
oli
MP
N/1
00
ml
E. coli : P1
Date

Optimisation of two-stage high-rate anaerobic reactors coupled with baffled pond and wet-dry sand filters for domestic wastewater treatment in a warm-dry climate
(Ouagadougou, Burkina Faso)
PhD Thesis report Moumouni Diafarou Ali Page 31
Raw wastewater (RW)
Anaerobic Reactor (R1)
Anaerobic Reactor (R2)
Baffled Pond (BP)
Sand filter (SF)
Number of Samples
avg* stdeva* avg stdeva* avg stdeva* avg stdeva* avg stdeva* n
pH 7.29 0.28 7.18 0.21 7.34 0.20 8.33 0.58 5.81 0.95
60
Temperature (°C) 30.26 3.96 31.68 4.36 31.3 4.40 28.10 2.93 29.43 2.55 60
Electrical conductivity (µS/cm) 761 191 785 154 773 141 539 104 685 152 60
Dissolved oxygen (mg/L) 0.67 0.5 0.48 0.6 0.57 0.7 8.74 5.3 7.33 3.5 60
TSS (mg/L) 148 82 50 28 16 11 20 10 5 4 54
Total COD (mg/L) 424 201 289 153 200 110 82 35 68 41 54
Total BOD5 (mg/L) 252 87 177 66 120 59 45 17 26 15 54
NH3-N(mg/L) 36.51 12.11 38.53 13.16 37.34 13.52 5.30 2.79 11.98 6.66 52
NO3-N (mg/L) 3.78 1.44 2.61 0.91 1.70 0.61 1.06 0.58 34.51 30.41 52
PO4-P (mg/L) 9.98 5.25 12.25 8.44 14.94 9.91 3.86 2.13 5.20 3.29 52
E. Coli (n°/100 mL) 2E+6 4E+6 4E+5 8E+5 6E+4 1E+5 ND 0 7E+3 2E+4 60
Volumetric/surface loading rate R1 (g/m3/day) R2 (g/m
3/day) BP (g/m
2/day) SF (g/m
3/day)
TSS 102.4 54.5 34.4 18.5 8.1 4.3 32.2 17.3
Total COD 283 134 193 102 45 24 181 96
Total BOD5 168.1 57.7 118.3 43.8 27.7 10.3 110.9 41.1
NH3-N 24.3 8.1 25.7 8.8 6 2.1 24.1 8.2
NO3-N 2.5 1 1.7 0.6 0.4 0.1 1.6 0.6
PO4-P 6.7 3.5 8.2 5.6 1.9 1.3 7.7 5.3
E. coli 2E+6 2E+6 3E+5 6E+5 7E+4 1E+5 3E+5 5E+5
*Arithmeticaverage and standard deviation +Not detected
Table 2.7: Summary of Period 1 influent and effluent concentrations, as well as volumetric/surface loading rates, at each treatment

Optimisation of two-stage high-rate anaerobic reactors coupled with baffled pond and wet-dry sand filters for domestic wastewater treatment in a warm-dry climate
(Ouagadougou, Burkina Faso)
PhD Thesis report Moumouni Diafarou Ali Page 32
Raw wastewater (RW)
Anaerobic Reactor (R1)
Anaerobic Reactor (R2)
Baffled Pond (BP)
Sand filter (SF)
Number of Samples
avg* stdeva* avg stdeva* avg stdeva* avg stdeva* avg stdeva* n
pH 7.36 0.25 7.25 0.20 7.45 0.26 8.39 0.50 5.89 0.98
53
Temperature (°C) 29.5 3.4 31.0 3.9 30.5 3.7 27.9 3 29.1 2.5 53
Electrical conductivity (µS/cm) 879 310 900 270 907 253 617 207 795 289 53
Dissolved oxygen (mg/L) 0.63 0.3 0.72 0.7 0.56 0.8 12.12 7.9 8.05 4.8 53
TSS (mg/L) 134 57 47 17 14 6 15 9 5 3 53
Total COD (mg/L) 425 175 271 117 180 82 85 33 75 32 53
Total BOD5 (mg/L) 255 99 165 68 99 49 40 19 26 16 53
NH3-N (mg/L) 34.45 13.6 40.79 16.95 40.08 17.11 5.71 3.53 12.14 6.97 53
NO3-N (mg/L) 4.78 2.81 3.12 1.67 2.02 1.25 1.02 0.95 49.35 29.69 53
PO4-P (mg/L) 10.57 4.17 12.95 4.78 13.94 5.22 3.02 2.25 6.76 7.29 53
E. Coli (n°/100 mL) 2E+6 3E+6 4E+5 8E+5 7E+4 1E+5 ND 0 9E+3 3E+4 53
Volumetric/surface loading rate R1 (g/m3/day) R2 (g/m
3/day) BP (g/m
2/day) SF (g/m
3/day)
TSS 134.5 57.3 47.4 16.7 7.4 2.6 29.6 10.4
Total COD 424.8 175.4 270.9 116.9 42.3 18.3 169.3 73.1
Total BOD5 254.6 99.1 164.7 68.1 25.7 10.6 103 42.5
NH3-N 34.5 13.6 40.8 16.9 6.4 2.6 25.5 10.6
NO3-N 4.8 2.8 3.1 1.7 0.5 0.3 2 1
PO4-P 10.6 4.2 13 4.8 2 0.7 8.1 3
E. coli 2.3E+6 3.2E+6 4.5E+5 8.4E+5 7E+4 1.3E+5 2.8E+5 5.2E+5
*Arithmeticaverage and standard deviation +Not detected
Table 2.8: Summary of P2 influent and effluent concentrations, as well as volumetric/surface loading rates, at each treatment unit

Optimisation of two-stage high-rate anaerobic reactors coupled with baffled pond and wet-dry sand filters for
domestic wastewater treatment in a warm-dry climate (Ouagadougou, Burkina Faso)
PhD Thesis report Moumouni Diafarou Ali Page 33
Table 2.9: P-values of the t-test comparing effluent concentrations and removal efficiencies
in both Baffled Pond and Sand Filter treatment options and between Periods 1 and 2
Parameter
AR-BP against AR-SF Period 1 against Period 2
Period 1 Period 2 Eff. Concentrations R. efficiencies
Eff. Con. R. effic. Eff. Con. R. effic. AR-BP AR-SF AR-BP AR-SF
TSS 0.0000 0.0000 0.0000 0.0000 0.0089 0.2855* 0.0911
* 0.7241
*
COD 0.0598* 0.0071 0.1307
* 0.1011
* 0.6286
* 0.2852
* 0.6954
* 0.1212
*
BOD5 0.0000 0.0000 0.0000 0.0002 0.2324* 0.8474
* 0.2118
* 0.6821
*
NH3-N 0.0000 0.0000 0.0000 0.0000 0.5077* 0.9069
* 0.2909
* 0.2613
*
NO3-N 0.0000 0.0000 0.0000 0.0000 0.7829* 0.0129 0.0188 0.2408
*
PO4-P 0.0155 0.0087 0.0005 0.0000 0.0508* 0.1604
* 0.0002 0.4733
*
E. coli (log) 0.0219 0.0000 0.0131 0.0000 - 0.6991* 0.7578
* 0.5268
*
*p ≥ 0.05: samples are not significantly different.
The weekly variability of COD, BOD5, and TSS influent and effluent concentrations, of all
treatment units during Period 1 are presented in Figure 2.7. Those of Period 2 were not
presented here, since their distribution patterns are similar to those of Period 1. Great
variability in BOD5, COD and TSS were observed at each level of the treatment process and
for both periods, which reflected a good response of the system to the high variability of
raw sewage that it received. For instance, the coefficients of variation of total COD, BOD5,
and TSS in the raw wastewater during Period 1 were respectively 47%, 34%, and 55%. This
has reflected a situation with high variability in the characteristics of the raw sewage
produced in accordance with campus activities, marked by the mobility of staff and
students. These variations are in line with the findings of Maiga et al. (2006) and Khan et al.
(2013).

Optimisation of two-stage high-rate anaerobic reactors coupled with baffled pond and wet-dry sand filters for
domestic wastewater treatment in a warm-dry climate (Ouagadougou, Burkina Faso)
PhD Thesis report Moumouni Diafarou Ali Page 34
Figure 2.7: (a), (b) and (c). Variations in the concentrations of oxygen demand (BOD5, COD)
and suspended solids (TSS) over time in raw and treated wastewater from each treatment
unit during Period 1.
Note that similar trends were observed during Period 2
The pH values of the raw sewage and the effluents of the anaerobic reactors were in the
neutral range, which indicates favourable conditions for bacterial growth and biological
degradation of organic matter to produce biogas, as clearly stated in the literature (Peña,
2002; Foresti et al., 2006). Besides, Figure 2.8 (a) depicts low variability of pH in the raw
wastewater and the effluents of both of the anaerobic reactors (R1, R2) during Period 1. The
same trends were also observed during Period 2 (not shown). Moreover, Mara (2004)
reported that most bacteria prefer neutral or slightly alkaline conditions, around 6.5–8.5.
Therefore, the anaerobic reactors may promote bacterial growth, which is beneficial to
efficiently degrade the organic matter content in the wastewater. However, the pH
remained high, between 8 and 9.8 for Periods 1 and 2 in the Baffled Pond (Tables 2.7 and
0
50
100
150
200
250
300
350
400
450
500
RW
R1
R2
BP
SF
(a) Total BOD5: P1
Tota
l BO
D5 m
g/l
Date
050
100150200250300350400450500550600650700750800850900950
1000
RW
R1
R2
BP
SF
Tota
l CO
D m
g/l
Date
(b) Total COD: P1
0
50
100
150
200
250
300
350
400
450
RW
R1
R2
BP
SF
(c) TSS : P1
TSS
mg/
l
Date

Optimisation of two-stage high-rate anaerobic reactors coupled with baffled pond and wet-dry sand filters for
domestic wastewater treatment in a warm-dry climate (Ouagadougou, Burkina Faso)
PhD Thesis report Moumouni Diafarou Ali Page 35
2.8), which was the result of the photosynthesis and stabilization system (Curtis et al. 1992;
Kayombo et al. 2002). Contrary to the BP, low pH values from 3.9 to 6.7 for P1 and 3.7 to 7
for P2 were obtained in effluent of the Sand Filter. This may be due to the intermittent
feeding and the release of H+ that consumed the alkalinity of the medium and possibly
reduces the pH during the high nitrification occurring in the system (Metcalf and Eddy,
2003).
On the other hand, the average temperature of the raw wastewater has increased from 29
to 31°C in both R1 and R2, and then decreased to 28 or 29 °C in the Sand Filter and the
Baffled Pond (Tables 2.7 and 2.8) for both Periods 1 and 2. Therefore, the use of anaerobic
reactors painted black in the sunny climate of the Sahel resulted in an increase in
temperature of 2°C throughout the year. Figure 2.8 (b) shows similar trends and low
variability for the weekly temperature was recorded in all treatment units. This situation
may be explained by the sampling time which was between 8:00 a.m. to 9:00 a.m., since the
air was still cool at that time.
Low values with low variability of dissolved oxygen were recorded in raw wastewater and
effluents of R1 and R2 (Figure 2.8b), which shows the typical values expected in anaerobic
conditions. However, high values were observed in both the Sand Filter and the Baffled
Pond during both Periods 1 and 2. The main reasons of these high levels of DO in the baffled
pond could be due to the photosynthesis of algae combined with alternate upward and
downward flow induced by the baffles as previously reported by Olukanni & Ducoste (2011)
and Bolton et al. (2010). In the case of the Sand Filter, it could be linked to the re-
oxygenation of the sand pores between feedings (on average 5 hours), this would give
enough time for the wastewater to fully drain.
3
4
5
6
7
8
9
10
RW
R1
R2
BP
SF
Date
pH (a) pH: P1

Optimisation of two-stage high-rate anaerobic reactors coupled with baffled pond and wet-dry sand filters for
domestic wastewater treatment in a warm-dry climate (Ouagadougou, Burkina Faso)
PhD Thesis report Moumouni Diafarou Ali Page 36
Figure 2.8: Variations in (a) temperature and (b) dissolved oxygen over time in raw and
treated wastewater from each treatment unit during Period 1.
(Note that similar trends were observed during Period 2)
The concentration of NH3-N in the influent wastewater increased from 36 to 38 mg/l in R1
and then slightly decreased to 37 in R2 for P1. In addition, during P2 the mean
concentration of NH3-N in the raw wastewater increased from 34 to 40 mg/l in R1 then
remained similar in R2 (Tables 2.7 and 2.8). This result coincides with the results reported
by Foresti et al., (2006) who showed that in anaerobically treated wastewater, the NH3-N
concentration varied between 30 and 50 mg/l. Khan et al., (2013) explained that the
increase of NH3-N was due to the hydrolysis of organic nitrogen in anaerobic process.
On the other hand, the concentration of NH3-N in the Baffled Pond effluent dropped from
37 or 40 mg/l in the influent to 5 mg/l in the effluent for both Periods 1 and 2 respectively.
Camargo-Valero (2008) found that depending on the characteristics of the ponds and local
weather conditions, the mechanisms and pathways by which nitrogen in its various forms is
removed from WSP can be attributed: to ammonia volatilisation, sedimentation of organic
nitrogen via biological uptake, its retention in the ponds’ bottom sludge; nitrification–
denitrification and nitrate and ammonia assimilation by algae. However, it was later
reported that only 2% of the overall ammonia nitrogen removed could be due to
volatilization (Camargo-Valero and Mara, 2007a, 2010; Assunção and von Sperling 2012;
Bastos et al., 2014).
-4
0
4
8
12
16
20
24
28
32
36
0
5
10
15
20
25
30
35
40
45
RW-T
R1-T
R2-T
BP-T
SF-T
RW-DOR1-DO
R2-DO
BP-DO
(b) T & DO: P1 T 0C DO mg/l
Date
Temperature
Dissolved oxygen

Optimisation of two-stage high-rate anaerobic reactors coupled with baffled pond and wet-dry sand filters for
domestic wastewater treatment in a warm-dry climate (Ouagadougou, Burkina Faso)
PhD Thesis report Moumouni Diafarou Ali Page 37
From this study, it appears that the nitrate concentrations (No3-N) in the raw wastewater
for both P1 and P2 respectively from 3.5 and 4.7 mg/l were successively reduced to 2.6 and
3 mg/l in R1, to 1.7 and 2 mg/l in R2, and to 1.06 and 1.02 in BP as shown in Tables 2.7 and
2.8. Possible causes may be that nitrates have been converted by other organisms present
in those treatment units to dinitrogen gas or to other nitrogen forms (NH3) through two
other processes namely; assimilatory nitrate reduction and dissimilatory nitrate reduction
(Metcalf and Eddy, 2003; Camargo-Valero, 2008; Babu, 2011). In dissimilatory nitrate
reduction, nitrates are reduced to ammonia to yield energy rather than for biomass
development. This implies that the ammonium produced would accumulate in the
surrounding medium, which could be the case in the anaerobic reactors R1 and R2.
However, Schumacher and Sekoulov (2002) have reported that assimilatory nitrate
reduction to ammonia was carried out by attached algal biofilms on their cell surfaces with
high pH (>10) and oxygen concentrations of 9 mg/l. This fact, could explain the nitrate
reduction in the Baffled Pond (Figure 2.9a).
On the other hand, the nitrate concentrations rose significantly by more than 34 (from 1.70
to 34.51 mg/l) and 49 (from 2.02 to 49.35 mg/l) times respectively during Periods 1 and 2 in
the Sand Filter, which achieved a high degree of nitrification. This fact could be due to the
intermittent feeding, where an important re-oxygenation takes place within the porous
media between the two supplies of wastewater in the Sand Filter. From the weekly
variability curves (Figure 2.9b), it is clearly showed that when NH4 and NO2 concentrations
decrease, the NO3 concentrations increase, which is suited to the normal path of the
nitrification process.
05
1015202530354045505560657075808590
inf NO3-N
Inf NO2-N
Inf NH4-N
eff NH4-N
eff NO3-N
eff NO2-N
(a) Nitrogen transformation in BP: P1
NH
4 -
NO
2 -
NO
3 -N
mg/
l
Date

Optimisation of two-stage high-rate anaerobic reactors coupled with baffled pond and wet-dry sand filters for
domestic wastewater treatment in a warm-dry climate (Ouagadougou, Burkina Faso)
PhD Thesis report Moumouni Diafarou Ali Page 38
Figure 2.9: Variations of ammonium, nitrite and nitrate concentrations over time in influent
and effluent wastewater from (a) the baffled pond and (b) the sand filter during Period 1.
(Note that similar trends were observed during Period 2.)
In a similar way to the ammonia, the orthophosphate concentrations (PO4-P) for both
periods increased successively from 9.9 and 10.5 mg/l in raw wastewater, to 12.2 and 12.9
mg/l in R1, and to 14.9 and 13.9 mg/l in R2 (Tables 2.7 and 2.8) during the first stage of
treatment. Nevertheless, in both aerobic treatments, BP and SF, the orthophosphate
concentrations dropped to 3.8 and 5.2 mg/l respectively during P1. Henze et al., (2008) and
Khan et al., (2013), when describing mechanisms for enhanced biological phosphorus
removal, explain that under good anaerobic conditions, soluble phosphate increases due to
the hydrolysis of phosphorous and phosphate. However, in the subsequent aerobic process
(in the presence of oxygen or nitrate), soluble phosphate decreases under two main
mechanisms: biomass assimilation and phosphate precipitation at high pH conditions as
reported in the literature (Comeau et al., 1987; Gerber et al., 1987; von Sperling and
Mascarenhas, 2005; Henze et al., 2008), but it was not clear here whether such conditions
were the causes of this fact in these treatment units. The weekly variability of
orthophosphate influent and effluent concentrations, of all treatment units during Period 1,
can be visualized in Figure 2.10. Those of period 2 were not presented here, since their
distribution patterns are similar to period 1.
0
5
10
15
20
25
30
35
40
45
50
55
60
65
70
75
80
85
90
95
100
inf NO3-N
Inf NO2-N
Inf NH4-N
eff NH4-N
eff NO3-N
eff NO2-N
(b) Nitrogen transformation in SF: P1
NH
4 -
NO
2 -
NO
3 -
N m
g/l
Date

Optimisation of two-stage high-rate anaerobic reactors coupled with baffled pond and wet-dry sand filters for
domestic wastewater treatment in a warm-dry climate (Ouagadougou, Burkina Faso)
PhD Thesis report Moumouni Diafarou Ali Page 39
Figure 2.10: Variations of orthophosphate concentrations over time in raw and treated
wastewater from each treatment unit during Period 1.
(Note that similar trends were observed during Period 2.)
In summary, the statistical analyses showed that the effluent concentration was influenced
by the reduction in the theoretical hydraulic retention times between Period 1 and Period 2
(from 1.5 to 1 day) in Anaerobic Reactors 1 and 2. In fact, there were significant differences
in TSS, BOD5, NH3, NO3, PO4 and E. coli concentrations (but not COD) in both AR-BP and AR-
SF between Periods 1 and 2 (t-test, p= 0.05) (Table 2.9). Furthermore, the overall effluent
quality in terms of bacteria, organics and nutrients of both treatment options, during
Periods 1 and 2 was in compliance with the World Health Organization reuse guidelines
(WHO, 2006) for restricted irrigation. Therefore, the treated wastewater could be
acceptable for irrigation and fertilization (Tables 2.7 and 2.8). Indeed, nitrogen and
phosphorus are essential plant nutrients and, in general, have a positive effect on plant
growth, unless applied in excess (Maiga et al. 2014).
Overall performance of the pilot plant
The removal efficiencies in terms of E. coli, faecal coliform, TSS, BOD5, COD, NH3-N and PO4-
P of each treatment unit and options of the pilot plant during Periods 1 and 2 are reported
in Figure 2.12, showing the central tendency and dispersion of these constituents. Table
2.10 gives a comparison of the performance of the pilot plant to some technologies
reported in the literature. In general, it is important to notice that better removal
efficiencies were obtained within all options and treatment units for both periods.
0
10
20
30
40
50
60
RW
R1
R2
BP
SF
Date
PO
4-P
mg/
l
PO4: P1

Optimisation of two-stage high-rate anaerobic reactors coupled with baffled pond and wet-dry sand filters for
domestic wastewater treatment in a warm-dry climate (Ouagadougou, Burkina Faso)
PhD Thesis report Moumouni Diafarou Ali Page 40
The statistical analyses (Table 2.9) revealed that the removal efficiencies during Periods 1
and 2, for both treatment options (AR-BP and AR-SF) were significantly different for most
constituents, with exception of COD. The differences in the results are probably due to the
different inherent processes specific to each aerobic treatment. On the other hand,
decreasing the theoretical hydraulic retention times of Anaerobic Reactors 1 and 2 from 1.5
days to 1 day, while maintaining those of aerobic treatments (BP and SF), did not
significantly affect the performance of either the anaerobic reactors or the aerobic
treatments. Indeed, there was no significant difference between TSS, COD, BOD5, NH3-N,
NO3-N, PO4-P and E. coli removal rates when comparing the values obtained in AR-BP and
AR-SF during Periods 1 and 2 (t-test, p= 0.05; Table 2.9).
R1 and R2 Performances
In the first stage of the treatment units (R1 and R2), more than 53% of both BOD5 and COD,
about 1 log unit of both E. coli and faecal coliform, and interestingly more than 88 % of TSS
were removed (Figure 2.12a-e). Pearson et al., (1996), Peña, (2002), Mara, (2004) and von
Sperling and Mascarenhas (2005) obtained similar results with anaerobic ponds and similar
climatic conditions, influent wastewater, and surface loading rates. In addition, the present
results are better than those of conventional waste stabilisation ponds (WSP), where the
anaerobic pond, which is the initial treatment reactor, is designed to eliminate suspended
solids and some of the soluble organic matter (Maiga et al., 2006).
However, the results revealed during Periods 1 and 2 an increase of both NH3-N and PO4-P
in Anaerobic Reactors R1 and R2 (Figure 2.12f,g), indicating the poor removal of nutrients in
anaerobic processes (Khan et al., 2013; Bastos et al., 2014). On the other hand, about 30 to
32% (P1) and 33 to 35% (P2) of NO3-N was removed in R1 and R2 respectively, which
indicated that a slight denitrification process was taking place in these anaerobic reactors.
The result could be related to the favourable temperature and biological activities in the
reactors.
AR-BP Performance
The results obtained from this study have shown the benefits of combining anaerobic
reactors and a baffled pond with attached-growth media (AR-BP) with respect to NH3-N and
pathogen removal. Removal of 84% of NH3-N and up to 7 log units of E. coli (AR-BP) were
achieved (Figure 2.12a, f). These results are similar to those found previously by Shin &
Polprasert, (1988), Camargo-Valero and Mara, (2007a, 2010), Assunção and von Sperling,
(2012) and Bastos et al., (2014).
It is interesting to observe that E. coli was not detected in any of the 113 samples of the
effluent from the BP during the 2 periods of monitoring. A complete removal of E. coli from
biological plants has not previously been reported in the literature. However, former studies
have shown that the introduction of baffles in WSPs not only improved the hydraulics of the
ponds, but also their treatment efficiencies (Muttamara and Puetpaiboon, 1997; Von

Optimisation of two-stage high-rate anaerobic reactors coupled with baffled pond and wet-dry sand filters for
domestic wastewater treatment in a warm-dry climate (Ouagadougou, Burkina Faso)
PhD Thesis report Moumouni Diafarou Ali Page 41
Sperling et al., 2002, 2003; Shilton and Mara 2005; Olukanni and Ducoste, 2011). Certainly,
this efficiency of the BP in terms of indicator microorganisms may be explained by the
combination of the physical-chemical conditions and environmental factors: high
temperature (>29°C), high pH (>9), a shallow pond (1.1 m), reasonable hydraulic retention
time (7 days), and others relevant parameters not considered here such as ultraviolet light
radiation, a significant amount of dissolved oxygen, algal biomass, nutrient limitation and
competition, as described by Shin and Polprasert, (1988), Curtis et al.,(1992), Davies-Colley
et al.,(1999), Maïga et al., (2009) and Bolton et al., (2010). Although, the effect of baffles
with attached growth in a polishing pond in Sahelian conditions had not been investigated
previously in detail, but, based on two years of monitoring, the introduction of these
appropriate baffles seems to be one of the aspects that have greatly improved the efficiency
of pathogen removal in this pilot plant.
These results of AR-BP confirm that this treatment option could be set as an alternative low-
cost biological wastewater treatment for poor neighbourhoods in sub-Saharan African cities,
since its performance was within reported ranges of other treatment facilities working in
similar climatic conditions (Kilani and Ogunrombi, 1984; von Sperling et al., 2002, 2003;
Shilton and Mara, 2005; Banda, 2007; Table 2.10) and even better efficiencies in terms of
some constituents were achieved. One reason could be attributed to good combination of
the unit operations of the pilot plant and also the prevailing physical-chemical conditions
and environmental factors resulting from the processes. Besides, this combination was
simple to operate, little maintenance was required, no energy were needed (in fact, it
provides energy in the form of biogas) and the investment cost was minimised by using
locally available materials.
AR-SF Performance
This option of anaerobic reactors coupled with a wet-dry sand filter (AR-SF), has also given
similar results and even better performance in terms of COD (84%), BOD5 (89%) and TSS
(96%) removal efficiencies, when compared to the AR-BP (Figure 2.12c, d and e). Moreover,
despite the similarities in removal efficiencies, the statistical analyses (Table 2.9) showed
that there is a significant difference in the performance of these two treatment options.
Similar performance is reported by Li et al. (2012) where, pilot scale direct rapid sand filters
were used to treat full-scale activated sludge effluent. The mean removals of TSS reported
by the same authors ranged from 50 to 88%, and are inversely related to the loading rate
and the average size of the grains of sand. It is important to notice that the good
performance of this AR-SF was consistent with the hypothesis that a sand filter would be
able to remove TSS, turbidity, and organics from wastewater (Nakhla and Farooq, 2003).
The reason for this phenomenon is that the removal mechanism of TSS in the filtration
process is the combination of transport and attachment (Li et al., 2012).
On the other hand, the average concentration of NO3-N increased in the SF, which showed a
high nitrification rate. These results coincide well with those of Panuvatvanicha et al.,

Optimisation of two-stage high-rate anaerobic reactors coupled with baffled pond and wet-dry sand filters for
domestic wastewater treatment in a warm-dry climate (Ouagadougou, Burkina Faso)
PhD Thesis report Moumouni Diafarou Ali Page 42
(2009), who suggest that an increase in sand depth could improve nitrification in filtration
systems. One reason could be the oxygen accumulated in the biofilms surrounding sand
surfaces and also in the pore spaces mainly in the intervals between feedings, therefore,
resulting in fast consumption of available nitrogen by the nitrifiers.
Lesser performance in term of E. coli, (5 log-units) removal in AR-SF was achieved compared
to the AR-BP (Figure 2.12a). Nonetheless, the mean faecal coliform removal rate was higher
than 0.6–1.5 log units reported by Li et al., (2012). The discrepancies in the results are
probably due to the different process parameters and environmental conditions, such as
low pH (5.6). Furthermore, the SF was operated during the study with no clogging effect,
since the infiltration time remained constant on average during Periods 1 and 2 (Figure
2.11). This is in contradiction with the findings of Tyagi et al., (2009). This good performance
could be due to the high reduction of TSS occurring in the anaerobic reactors that precede
the sand filter and also the available surface area that could be optimized.
Figure 2.11: The time required for an equal amount of wastewater to pass through the Sand
Filter during Periods 1 and 2
The argument stated in the AR-BP option could also be applied to the AR-SF option, in terms
of performance compared to those reported in the literature (Table 2.10). This could be
suggested as an alternative low-cost wastewater treatment technology for the urban poor
of West Africa.
3
4
5
6
7
Period 1
Period 2
Tim
e to
infr
ate
the
flo
w
Sampling date May 2013 - April 2015

Optimisation of two-stage high-rate anaerobic reactors coupled with baffled pond and wet-dry sand filters for
domestic wastewater treatment in a warm-dry climate (Ouagadougou, Burkina Faso)
PhD Thesis report Moumouni Diafarou Ali Page 43
Figure 2.12a: E. coli removal efficiency of each treatment unit and options for both P1 & P2
Figure 2.12b: Faecal coliform removal efficiency of each treatment unit and combination,
for Periods 1 and 2
0,8 1,2
3,8
2,6
4,6
5,8
0,0
1,0
2,0
3,0
4,0
5,0
6,0
7,0
8,0
R1 R2 BP SF AR-SF AR-BP
E. C
OLI
REM
OV
AL
EFFI
CIE
NC
IES
(lo
g u
nit
)
Treatment units and options
25%
50%
90%
10%
Min
Max
75%
Mean
E. Coli: P1
0,8 1,1
3,9
2,5
4,4
5,8
0,0
1,0
2,0
3,0
4,0
5,0
6,0
7,0
8,0
R1 R2 BP SF AR-SF AR-BP
E. C
OLI
REM
OV
AL
EFFI
CIE
NC
IES
(lo
g u
nit
)
Treatment units and options
25%
50%
90%
10%
Min
Max
75%
Mean
E. Coli: P2
0,8 1,1
2,3 1,8
3,7 4,2
0,0
1,0
2,0
3,0
4,0
5,0
6,0
7,0
8,0
R1 R2 BP SF AR-SF AR-BP
FAEC
AL
CO
LIFO
RM
REM
OV
AL
EFFI
CIE
NC
IES
(lo
g u
nit
)
Treatment units and options
25%
50%
90%
10%
Min
Max
75%
Mean
Faecal coliform: P1
0,9 1,1
2,4
1,3
3,3
4,4
0,0
1,0
2,0
3,0
4,0
5,0
6,0
7,0
8,0
R1 R2 BP SF AR-SF AR-BP
FAEC
AL
CO
LIFO
RM
R
EMO
VA
L EF
FIC
IEN
CIE
S (l
og
un
it)
Treatment units and options
25%
50%
90%
10%
Min
Max
75%
Mean
Faecal coliform: P2

Optimisation of two-stage high-rate anaerobic reactors coupled with baffled pond and wet-dry sand filters for
domestic wastewater treatment in a warm-dry climate (Ouagadougou, Burkina Faso)
PhD Thesis report Moumouni Diafarou Ali Page 44
Figure 2.12c: Total Suspended Solids (TSS) removal efficiency of each treatment unit and
combination, for Periods 1 and 2
Figure 2.12d: Removal efficiency for Total Biochemical Oxygen Demand (BOD5) of each
treatment unit and combination, for Periods 1 and 2.
64 65
-36
63
96 85
-120
-100
-80
-60
-40
-20
0
20
40
60
80
100
120
R1 R2 BP SF AR-SF AR-BP
TSS
REM
OV
AL
EFFI
CIE
NC
IES
(%)
Treatment units and options
25%
50%
90%
10%
Min
Max
75%
Mean
TSS: P1
63 68
-11
65
96 87
-120
-100
-80
-60
-40
-20
0
20
40
60
80
100
120
R1 R2 BP SF AR-SF AR-BP
TSS
REM
OV
AL
EFFI
CIE
NC
IES
(%)
Treatment units and options
25%
50%
90%
10%
Min
Max
75%
Mean
TSS: P2
30 34
56
72
88 81
0
10
20
30
40
50
60
70
80
90
100
R1 R2 BP SF AR-SF AR-BP
TOTA
L B
OD
5 R
EMO
VA
L EF
FIC
IEN
CIE
S (%
)
Treatment units and options
25%
50%
90%
10%
Min
Max
75%
Mean
BOD5: P1
35 41
54
68
89 83
0
10
20
30
40
50
60
70
80
90
100
R1 R2 BP SF AR-SF AR-BP
Tota
l BO
D5
REM
OV
AL
EFFI
CIE
NC
IES
(%)
Treatment units and options
25%
50%
90%
10%
Min
Max
75%
Mean
BOD5: P2

Optimisation of two-stage high-rate anaerobic reactors coupled with baffled pond and wet-dry sand filters for
domestic wastewater treatment in a warm-dry climate (Ouagadougou, Burkina Faso)
PhD Thesis report Moumouni Diafarou Ali Page 45
Figure 2.12e: Removal efficiency for Total Chemical Oxygen Demand (COD) of each
treatment unit and combination, for Periods 1 and 2.
Figure 2.12f: Removal efficiency for Ammonia (NH3-N) of each treatment unit and
combination, for Periods 1 and 2
31 30
55
66
84 79
0
10
20
30
40
50
60
70
80
90
100
R1 R2 BP SF AR-SF AR-BP
TOTA
L C
OD
REM
OV
AL
EFFI
CIE
NC
IES
(%)
Treatment units and options
25%
50%
90%
10%
Min
Max
75%
Mean
COD: P1
34 33
49 56
81 78
0
10
20
30
40
50
60
70
80
90
100
R1 R2 BP SF AR-SF AR-BP
TOTA
L C
OD
REM
OV
AL
EFFI
CIE
NC
IES
(%)
Treatment units and options
25%
50%
90%
10%
Min
Max
75%
Mean
COD: P2
-9 -1
84 64 65
83
-100
-80
-60
-40
-20
0
20
40
60
80
100
R1 R2 BP SF AR-SF AR-BP
NH
3-N
REM
OV
AL
EFFI
CIE
NC
IES
(%)
Treatment units and options
25%
50%
90%
10%
Min
Max
75%
Mean
NH3-N: P1
-19 -1
82 65
61 80
-100
-80
-60
-40
-20
0
20
40
60
80
100
R1 R2 BP SF AR-SF AR-BP
NH
3-N
REM
OV
AL
EFFI
CIE
NC
IES
(%)
Treatment units and options
25%
50%
90%
10%
Min
Max
75%
Mean
NH3-N: P2

Optimisation of two-stage high-rate anaerobic reactors coupled with baffled pond and wet-dry sand filters for
domestic wastewater treatment in a warm-dry climate (Ouagadougou, Burkina Faso)
PhD Thesis report Moumouni Diafarou Ali Page 46
Figure 2.12g: Removal efficiency for Orthophosphate (PO4-P) of each treatment unit and
combination, for Periods 1 and 2.
Table 2.10: Removal efficiencies of E. coli, Total Suspended Solids (TSS), Biochemical Oxygen
Demand (BOD5) and Chemical Oxygen Demand (COD) for the two treatment
combinationsand similar processes reported in the literature.
E. coli TSS BOD5 COD
Log unit % % %
R1+R2+BP* 4 – 7 71 - 94 60 - 97 61 - 93
R1+R2+SF@ 1 – 7 91 - 99 70 - 97 61 - 99
WSPs (AP+FP+MP)a
(Maiga et al. 2006)
1 - 6
66 87
81
UASB+SSFb(Khan et al. 2013)
1 - 3
91 92.6
91
UASB + Constructed Wetlands (Khan et al. 2013)
1 - 2
65 -
82
Chlorination/ozonationd
(Van der Steen 2008)
2 - 6
NA NA
NA
UASB+POSTe (Oliveira & von Sperling 2011)
1 - 6
82 88
77
* R1+R2+BP=Anaerobic reactor N°1 + Anaerobic reactor N°2 + Baffled Pond @
R1+R2+SF=Anaerobic reactor N°1 + Anaerobic reactor N°2 + Sand filter aWaste Stabilisation Ponds (WSP) =Anaerobic Pond + Facultative Pond + Maturation Pond
b Slow Sand filter
eUASB + POST= Upflow Anaerobic Sludge Blanket includes as post-treatment: aerated filter; anaerobic filter; trickling filter;
flotation unit; facultative pond or maturation pond.
-23 -27
71 61 42
57
-300
-250
-200
-150
-100
-50
0
50
100
150
R1 R2 BP SF AR-SF AR-BP
PO
4-P
RE
MO
VA
L
EF
FIC
IEN
CIE
S (
%)
Treatment units and options
25%
50%
90%
10%
Min
Max
75%
Mean
PO4-P: P1
-41 -10
78 45 36
72
-500
-450
-400
-350
-300
-250
-200
-150
-100
-50
0
50
100
150
R1 R2 BP SF AR-SF AR-BP
PO
4 -
P R
EM
OV
AL
EF
FIC
IEN
CIE
S (
%)
Treatment units and options
25%
50%
90%
10%
Min
Max
75%
Mean
PO4-P: P2

Optimisation of two-stage high-rate anaerobic reactors coupled with baffled pond and wet-dry sand filters for
domestic wastewater treatment in a warm-dry climate (Ouagadougou, Burkina Faso)
PhD Thesis report Moumouni Diafarou Ali Page 47
2.4 Conclusions
The design, implementation and evaluation of the two-stage high-rate anaerobic reactors
followed by a baffled pond with attached growth or a wet-dry sand filter for domestic
wastewater treatment in a sub-Saharan Africa warm and dry climate of Ouagadougou were
conducted and optimized. Based on the results obtained in this study, the two combinations
have revealed efficient and attractive alternative to treat wastewater in West Africa, under
a Sahelian climate. In this study, a great variability was noticed in the effluent
concentrations and in the removal efficiencies, considering all analysed constituents and all
treatment units. It was found out that high pathogen removal efficiencies were achieved in
both treatment options. Moreover, the anaerobic reactors coupled with the sand filter
option presented high nitrification rate, while the Baffled Pond with attached-growth
revealed a better efficiency in ammonia nitrogen and E. coli removals. Furthermore, no E.
coli were ever detected in effluent of the Baffled Pond, nor did clogging occur in the Sand
Filter, during the entire study. Based on the outcome of this research, it was concluded that,
both treatment options could be applied as alternative low-cost wastewater treatment
technologies for African cities and it is recommendable to reuse the effluent for restricted
peri-urban irrigation.
However, because of the fact that the AR-BP has raised more unanswered questions, and by
taking into account that the reuse of AR-SF effluents may be detrimental to plants (high pH,
NO3), if great care is not taken. It is also worth noting that a large amount of wastewater
may be lost during the feedings of the sand filter due to evaporation, hence the following
chapters will mainly focus on the AR-BP option. Therefore, in order to gain as much as
possible an insight into this combination (AR-BP), the following chapters will stress: the
hydraulic performance of the baffled pond, the complete elimination of E. coli in the baffled
pond, the diversity and biomass of algae and zooplankton in the biofilm that develops on
the plastic bottle caps affixed on the baffles, and the potentials of biogas recovery from the
Anaerobic Reactors 1 and 2.
2.5 References
[1] APHA (2012). Standard Methods for the Examination of Water and Wastewater. 22sd
edition. American
Public Health Association/American Water Works Association/Water Environment Federation;
American, Washington DC, USA
[2] Assunção, F. A. L. and von Sperling, M. (2012). Importance of the ammonia volatilization rates in shallow
maturation ponds treating UASB reactor effluent. Water Science and Technology, 66 (6), 1239–1246.
[3] AWWA (1991). American Water Works Association manual of Design for slow sand filtration. AWWA
Research Foundation West,Quincy Avenue, Denver, CO 80235 USA.
[4]Babu, M. (2011). Effect of algal biofilm and operational conditions on nitrogen removal in wastewater
stabilization ponds. PhD. Thesis at Wageningen University and UNESCO-IHE Institute of Water
Education Netherlands, 144 p.
[5] Banda, C. G. (2007). Computational fluid dynamics modeling of baffled waste stabilization Ponds. PhD
Thesis, School of Civil Engineering, University of Leeds, Leeds, UK

Optimisation of two-stage high-rate anaerobic reactors coupled with baffled pond and wet-dry sand filters for
domestic wastewater treatment in a warm-dry climate (Ouagadougou, Burkina Faso)
PhD Thesis report Moumouni Diafarou Ali Page 48
[6] Bastos, R. K. X., Cabral, V. A. L., Rios, E. N. & Combatt M. P. M. (2014). Further contributions to nitrogen
removal modelling in waste stabilization ponds. Water Science and Technology , 70 (12), 1897–1906
[7] Bolton, N. F., Cromar, N. J., Hallsworth, P. and Fallowfield, H. J. (2010). A review of the factors affecting
sunlight inactivation of micro-organisms in waste stabilisation ponds: preliminary results for
enterococci. Water Science & Technolog, 61 (4), 885-890
[8] Camargo-Valero, M. A. & Mara, D. D. (2007a). Nitrogen removal via ammonia volatilization in maturation
ponds. Water Science and Technology , 55 (11), 87–92.
[9] Camargo-Valero, M. A. (2008). Nitrogen Transformation Pathways and Removal Mechanisms in Domestic
Wastewater Treatment by Maturation Ponds. PhD Thesis. School of Civil Engineering, The University of
Leeds, Leeds, UK. 156 pp.
[10] Camargo-Valero, M. A. and Mara, D. D. (2010). Ammonia volatilisation in waste stabilisation ponds: a
cascade of misinterpretations? Water Science and Technology, 61 (3), 555–561
[11] Comeau, Y., Rabinowitz, B., Hall, K. J. and Oldham, W. K. (1987). Phosphorus release and uptake in
enhanced biological phosphorus removal from wastewater. J. Water Pollut. Control Fed., 59, 707-715.
[12] Cortés-Martínez F., Treviño-Cansino A., Alcorta-García M. A., Kalashnikov V., and Luévanos-Rojas R.
(2014). Mathematical Analysis for the Optimization of a Design in a Facultative Pond: Indicator
Organism and Organic Matter. Hindawi Publishing Corporation Mathematical Problems in Engineering,
http://dx.doi.org/10.1155/2014/652509 (accessed 2/01/2015)
[13] Curtis, T. P., Mara, D. D., and Silva, S. A. (1992). Influence of pH, oxygen, and humic substances on ability
of sunlight to damage fecal coliforms in waste stabilization pond water. Applied and Environmental
Microbiology,58(4), 1335-1343.
[14] Davies-Colley, R. J., Donnison, A. M., Speed, D. J., Ross, C. M. & Nagel, J. W. (1999). Inactivation of faecal
indicator micro-organisms in waste stabilisation ponds: Interactions of environmental factors with
sunlight. Water Research, 33 (5), 1220-1230.
[15] El Hamouri Bouchaïb (2004). Réacteur Anaérobie et Chenal à Haut Rendement: Pour l’épuration des eaux
usées des petites communautés-Réalisation, exploitation et performances. Rabat, Morocco (Anaerobic
Reactor with a Highly Efficient Channel (RACHAHR))
[16] Foresti, E., Zaiat, M. and Vallero, M. (2006). Anaerobic processes as the core technology for sustainable
domestic wastewater treatment: Consolidated applications, new trends, perspectives, and challenges.
Reviews in Environmental Science and Bio/Technology, 5, 3–19.
[17] Gerber, A., Devilliers, R. H., Mostert, E. S., and Winter, C. T. (1987). Interaction between phosphate,
nitrate and organic substrate in biological nutrient removal processes. Water Science Tech.,19 (1-2),
183-194.
[18] Henze, M., van Loosdrecht, M.C.M, Ekama, G.A. and Brdjanovic. D. (2008). Biological Wastewater
Treatment: Principles, Modelling and Design. Published by IWA Publishing, London, UK.
[19] Kayombo, S., Mbwette, T. S. A., Mayo, A. W., Katima, J. H. Y. & Jørgensen, S. E. (2002). Diurnal cycles of
variation of physical–chemical parameters in waste stabilization ponds. Ecological Engineering, 18 (3),
287-291
[20] Khan, A. A. (2012). Post Treatment of UASB Effluent: Aeration and Variant of ASP. PhD Thesis. IIT Roorkee,
India.
[21] Khan, A. A., Gaur, R. Z., Kazmi A. A. and Lew, B. (2013). Sustainable Post Treatment Options of Anaerobic
Effluent. Biodegradation - Engineering and Technology, http://dx.doi.org/10.5772/56097
[22] Kilani, J.S. & Ogunrombi, J.A. (1984). Effects of baffles on the performance of model waste stabilization
ponds. Water Res., 18 (8), 941–944.
[23] Konaté Y., Maϊga A. H., Wethe J., Basset D., Casellas C., and Picot B. (2010). Sludge accumulation in
anaerobic pond and viability of helminth eggs: a case study in Burkina Faso. Water Science and
Technology, 61(4):919-925.

Optimisation of two-stage high-rate anaerobic reactors coupled with baffled pond and wet-dry sand filters for
domestic wastewater treatment in a warm-dry climate (Ouagadougou, Burkina Faso)
PhD Thesis report Moumouni Diafarou Ali Page 49
[24] Li, Y., Yu, J., Liu, Z. and Ma, T. (2012). Estimation and modeling of direct rapid sand filtration for total fecal
coliform removal from secondary clarifier effluents. Water Science and Technology, 65 (9), 1615–1623.
[25] Maiga, A. H., Konate, Y., Wethe, J., Denyigba, K., Zounngrana, D. and Togola, L. (2006). Performance of a
series of three wastewater stabilization ponds in Sahelian climate: Case study of the EIER wastewater
treatment plant. Sud Science and Technologies.http://hdl.handle.net/2042/30373
[26] Maiga, Y., Moyenga, D., Nikiema, B.C., Ushijima, K., Maiga, A.H. and Funamizu, N. (2014). Designing
slanted soil system for greywater treatment for irrigation purposes in rural area of arid regions.
Environmental Technology, 35 (23), 3020-3027
[27] Maiga Y., Wethe J., Denyigba, K. and Ouattara A. S. (2009). The impact of pond depth and environment
conditions on sunlight inactivation of Escherichia coli and enterococci in wastewater in a warm climate.
Canadian Journal of Microbiology,55 (12), 1364-1374
[28] Mara D. D. (1987). Waste stabilisation ponds: Problems and controversies. Water Quality International, 1,
20-22.
[29]Mara, D.D. (2004). Domestic Wastewater Treatment in Developing Countries. London, UK: Earthscan
Publications.
[30] Marais G. v R. (1974). Faecal bacterial kinetics in waste stabilization ponds. Journal of Environmental
Engineering Division, American Society of Civil Engineers, 100 (EE1), 119-139.
[31] Marais G. v R. and Shaw V. A. (1961). A rational theory for the design of sewage stabilization ponds in
Central and South Africa. Transactions of the South African Institute of Civil Engineering, 3, 205-227.
[32] McGarry M. G. and Pescod M. B. (1970). Stabilization Pond Design Criteria for Tropical Asia. In 2nd
International Symposium for wastewater treatment lagoons, McKinney, R. ed., Kansas City, Missouri,
USA.
[33] Meneses-Jácome, A., Osorio-M olina, A., Parra-Saldívar, R., Gallego-Suárez, D., Velásquez-Arredondo, H. I.
and Ruiz-Colorado A. A. (2015). LCA applied to elucidate opportunities for biogas from wastewaters in
Colombia. Wat. Sci. Technol., 71 (2), 211–219.
[34] Metcalf & Eddy (2003). Wastewater engineering, Treatment and Reuse. Tchobanoglous, G., Burton, F.L.,
Stensel, H.D (Eds). 4th Ed. McGraw Hill, Inc., USA.
[35] Muttamara S. and Puetpaiboon U.(1997). Roles of baffles in waste stabilization ponds. Water Science and
Technology, 35, (8), 275–284,
[36] Nakhla, G. and Farooq, S. (2003). Simultaneous nitrification–denitrification in slow sand filters. Journal of
Hazardous Materials, 96 (2-3), 291-303
[37] Oke I. A. and Otun J. A. (2001). Mathematical analysis of economic sizing of stabilization ponds. Nigerian
Journal of Engineering, 9, (1), 13–21.
[38] Oliveira, S. C. & von Sperling M. (2011). Performance evaluation of different wastewater treatment
technologies operating in a developing country. Journal of Water, Sanitation and Hygiene for
Development, 1 (1), 37-56
[39] Olukanni, D.O (2013). Evaluation of the Influence of Reactor Design on the Treatment Performance of an
Optimized Pilot-Scale Waste Stabilization Pond. International Journal of Engineering and Technology, 3 (
2): 189-198.
[40] Olukanni, D.O. & Ducoste, J.J. (2011). Optimization of Waste Stabilization Pond Design for Developing
Nations using Computational Fluid Dynamics. Ecological Eng., 37: 1878–1888.
[41] Panuvatvanicha, A., Koottatep, T. & Koné D. (2009). Influence of sand layer depth and percolate
impounding regime on nitrogen transformation in vertical-flow constructed wetlands treating faecal
sludge. Water research , 43; 2623 – 2630
[42] Parker, D. (1988). Wastewater technology innovation for the year 2000. Journal of Environmental
Engineering,114 (3): 487-506).
[43] Pattarkine, V. M., Chann, R. C. and Tharp, C. E. (2006). Advanced Lagoon Treatment Technologies for
Wastewater Treatment. Water Environment Foundation, Columbia, USA.

Optimisation of two-stage high-rate anaerobic reactors coupled with baffled pond and wet-dry sand filters for
domestic wastewater treatment in a warm-dry climate (Ouagadougou, Burkina Faso)
PhD Thesis report Moumouni Diafarou Ali Page 50
[44] Pearson, H. W., Avery, S. T., Mills, S. W., Njaggah, P. and Odiambot, P. (1996). Performance of the phase II
Dandora Waste Stabilization Ponds the largest in Africa: the case for Anaerobic Ponds. Water Science
and Technology, 33 (7), 91-98.
[45] Peña, M.R. (2002). Advanced primary treatment of domestic wastewater in tropical countries:
development of high-rate anaerobic ponds. Ph.D thesis. School of Civil Engineering, University of Leeds.
Leeds, England.
[46] Peña M. R., Mara D. D., and Sanchez A. (2000). Dispersion studies in anaerobic ponds: implications for
design and operation. Water Science and Technology, 42 (10-11):273–282
[47] Reed S. C., Middlesbrooks E. J. and Crites R. W. (1988). Natural Systems for Waste Management and
Treatment. McGraw Hill, New York.
[48] Sah L., Rousseau D. P. L., and Hooijmans C. M. (2012). Numerical modelling of waste stabilization ponds:
where do we stand? Water, Air & Soil Pollution, 223, (6), 3155–3171
[49] Schumacher, G. and Sekoulov, I. (2002). Polishing of secondary effluent by an algal biofilm. Wat. Sci. Tech.
46 (8); 83-90
[50] Shin, H. K., and Polprasert, C., (1988). Ammonia nitrogen removal in attached-growth ponds. Journal of
Environmental Engineering, 114,(4):846-863
[51] Shilton A. & Harrison J. (2003). Development of guidelines for improved hydraulic design of waste
stabilisation ponds. Water Science and Technology, 48 (2): 173–18
[52] Shilton, A.N. & Mara, D. D. (2005). CFD (computational fluid dynamics) modeling of baffles for optimizing
tropical waste stabilization ponds system. Water Science and Technology, 51 (12), 103–106.
[53] Thirumurthi D. (1969). Design Principles of Waste Stabilization Ponds. Journal of the Sanitary Engineering
Division, American Society of Civil Engineers, 96(SA2), 311-330.
[54]Thirumurthi D. (1974). Design criteria for waste stabilization ponds. Journal of the Water Pollution Control
Federation, 46 (9):2094–2106
[55] Tyagi, V.K, Khan A.A, Kazmi A.A, Mehrotra, I. & Chopra A.K. (2009). Slow sand filtration of UASB reactor
effluent: a promising post treatment technique. Desalination, 6-249:571.
[56] Van der Steen, N. P. (2008). Sustainable wastewater treatment and reuse, lecture note, Delft, UNESCO-
IHE: Institute for water Education.
[57] Von Sperling, M. (1999). Performance evaluation and mathematical modelling of coliform die-off in
tropical and subtropical waste stabilization ponds. Water Res. 33 (6), 1435–1448.
[58] von Sperling, M., Chernicharo, C. A. L., Soares, A. M. E. & Zerbini, A. M. (2002). Coliform and helminth eggs
removal in a combined UASB reactor-baffled pond system in Brazil: performance evaluation and
mathematical modelling. Water Science and Technology, 45 (10), 237–242.
[59] von Sperling, M., Chernicharo, C. A. L., Soares, A. M. E. & Zerbini, A. M. (2003). Evaluation and modelling
of helminth eggs removal in baffled and unbaffled ponds treating anaerobic effluent. Water Science and
Technology, 48 (2), 113–120.
[60] von Sperling, M. and Chernicharo, C. A. L. (2005). Biological Wastewater Treatment in Warm Climate
Regions. Volume one, P. 856. Published by IWA Publishing, London, UK
[61] von Sperling M. and Mascarenhas L.C.A.M. (2005). Performance of very shallow ponds treating effluents
from UASB reactors. Wat. Sci. Technol., 51 (12), 83–90.
[62] von Sperling M. (2005). Modelling of coliform removal in 186 facultative and maturation ponds around
the world. Water Research, 39:5261–5273
[63] Wehner J. F. and Wilheim R. H. (1956). Boundary conditions of flow reactor. ChemicalEngineering Science,
6(2), 89-93.
[64] WHO (2006). Guidelines for the safe use of wastewater, excreta and greywater, Vol. 4: Excreta and
greywater use in agriculture. Geneva: WHO Press.

Optimisation of two-stage high-rate anaerobic reactors coupled with baffled pond and wet-dry sand filters for
domestic wastewater treatment in a warm-dry climate (Ouagadougou, Burkina Faso)
PhD Thesis report Moumouni Diafarou Ali Page 51
Chapter 3
3. Hydraulic performance of the baffled pond and its control
In order to predict a wastewater pond's behavior, one would ideally have a complete
picture of how the fluid passes through it. Since this is impractical, another approach is to
find out how long individual particles remain in the pond. This can be determined easily and
directly by the widely-used tracer test (Levenspiel, 1999). The objective of this chapter was
to investigate the effect of baffles with increased surface area on the hydraulic
characteristics of a baffled pond under Sahelian conditions. To achieve this, a tracer test was
carried out on baffled and unbaffled ponds using common kitchen salt (sodium chloride).
Furthermore, the analyses of the hydraulic characteristics and the models that could be
applied in predicting the performance of the ponds in terms of the removal of organic
matter and pathogens are considered.
3.1 Hydraulics and wastewater treatment
3.1.1 The need for hydraulic analysis
Wastewater treatment performances are influenced by many factors, such as the geometry
of the treatment reactor, the location of inlet and outlet of the reactor, the loading regime,
the climatic and the environmental conditions (Safieddine, 2007; Badrot-Nico et al., 2009;
Abbassi et al; 2010). Another important parameter that has proved to affect the overall
treatment efficiency is the hydraulic behavior of the wastewater treatment reactor
(Nameche and Vasel, 1998; Shilton et al., 2000; Metcalf & Eddy 2003; Short et al; 2010;
Babu, 2011). Moreover, numerous studies have found that the removal of pollutants within
a wastewater treatment reactor (e.g., a wastewater pond) occurs via a diverse range of
interactions between the sediments, litter, substrate, microorganisms, and the wastewater
as it moves through the system. Therefore, the dynamics of water movement through the
reactor has a significant influence on the efficiency and extent of these interactions.
Moreover, many of the important biogeochemical reactions rely on contact time between
wastewater constituents and microorganisms and the associated substrate, whereas
wastewater velocity can be an important determining factor for other pollutant removal
processes, such as mass transfer (Metcalf & Eddy, 2003; Małoszewski et al., 2006; Chang et
al., 2011). Consequently, any short-circuiting or dead zones that occur within a reactor will
have an effect on contact time, flow velocities and, therefore, treatment efficiency.
The introduction of baffles (with various configurations or wind-induced mixing) in ponds
has been shown to improve their performance in terms of hydraulic and treatment
efficiency, compared to unbaffled ponds (Kilani and Ogunrombi, 1984; Muttamara and
Puetpaiboon, 1997; von Sperling et al., 2002, 2003; Shilton and Harrison, 2003; Shilton and
Mara, 2005; Banda, 2007; Babu, 2011; Olukanni and Ducoste 2011; Sah et al., 2012;
Olukanni, 2013; Cortés-Martínez et al., 2014). However, many of the treatment plants that
have been built do not perform hydraulically as designed, because of a lack of appreciation

Optimisation of two-stage high-rate anaerobic reactors coupled with baffled pond and wet-dry sand filters for
domestic wastewater treatment in a warm-dry climate (Ouagadougou, Burkina Faso)
PhD Thesis report Moumouni Diafarou Ali Page 52
of the hydraulics of these reactors. Hydraulic analysis is a gateway to better modelling of
wastewater treatment systems (von Sperling et al., 2002, 2003; Metcalf & Eddy 2003;
Badrot-Nico et al., 2009). Thus, understanding the mixing and the transport mechanisms in
wastewater basins is vital in improving treatment performance and design (Nameche and
Vasel, 1998; Shilton et al., 2000; Abbassi et al; 2010; Short et al; 2010; Babu, 2011; Chang et
al., 2011). Very few studies have been conducted specifically in the warm and dry climatic
conditions of West Africa, to investigate at a pilot scale the combined impact of both baffles
and attached-growth on the hydraulic performance of waste stabilisation ponds (WSP). In
this regard, this study was to investigate the effect of baffles with increased surface area on
the hydraulic characteristics of WSP under Sahelian conditions.
The principal technique by which researchers and engineers have gained information about
the direction and velocity of water movement or energy carried by water is through the use
of inert tracers. In addition, this is also an indirect way of identifying other hydraulic
parameters, such as dispersivity, actual (measured) mean hydraulic retention time, dead
volume; short circuiting index, dispersion number, and even porosity and hydraulic
conductivity in pack medium through further analyses (Babu, 2011; Chang et al., 2011).
3.1.2 Tracer selection
Over centuries, a number of tracers have been used to determine the hydraulic
performance of reactors. According to Metcalf & Eddy, (2003) and Chang et al., (2011), an
ideal tracer should be representative, should not affect the flow, (i.e., it follows the same
path as the water) and is easily detected. In addition, it must be conservative, inexpensive to
analyse, and have low toxicity, high solubility, and low background concentration in the
natural environment. It is clear from numerous studies that the most popular choices for
tracers are isotopes, ions, and dyes. For instance, the most common tracers include stable
nitrogen isotopes 15N, stable oxygen isotope 18O/16O ratio, Congo Red, fluorosilicic acid
(H2SiF6), hexafluoride gas, lithium chloride (LiCl), potassium permanganate, rhodamine WT,
and sodium chloride (Metcalf and Eddy, 2003; Lin et al., 2003; Dierberg and DeBusk, 2005;
Kadlec et al., 2005 ; Małoszewski et al., 2006; Ronkanen and Kløve 2007, 2008; Camargo-
Valero, 2008; Babu, 2011; Chang et al., 2011). Although isotope technology has high
accuracy, it has been reported to be expensive (Chang et al., 2011). On the other hand, ionic
compounds, especially bromide and lithium chloride, have been widely used due to their
ease of analysis, as well as their common application in studying natural systems (Metcalf
and Eddy, 2003). Other type of tracers like, rhodamine WT was found to be sensitive to light
and temperature and, in addition, requires a fluorometer, which is expensive. Sodium
chloride is the cheapest and easiest option, despite its tendency to form density currents,
but this can be avoided by the correct mixing of the tracer (Metcalf and Eddy, 2003).
In tracer studies, a tracer is injected in the reactor (pond) influent and its concentration in
the effluent is recorded in a series of grab samples collected at specific time intervals

Optimisation of two-stage high-rate anaerobic reactors coupled with baffled pond and wet-dry sand filters for
domestic wastewater treatment in a warm-dry climate (Ouagadougou, Burkina Faso)
PhD Thesis report Moumouni Diafarou Ali Page 53
(Metcalf and Eddy, 2003). Two methods are frequently used to introduce the tracer into the
reactor: the Step Method and the Pulse Method, with the choice depending on the influent
and effluent configurations. The Step Method involves a continuous addition of the tracer
until the effluent concentration is equal to the influent concentration. In the Pulse Method,
the tracer is added for a short period of time, usually less than the theoretical retention
time. Tracer response curves are usually used to analyse the hydraulic characteristics of
reactors, because of the complexity of the hydraulic flow pattern of the reactors. More
details about the tracer response curves analysis are available in the books of Levenspiel,
(1999) and Metcalf & Eddy, (2003).
3.1.3 Patterns of flow in ponds
The various pond systems that exist differ from each other in geometry, hydraulic flows,
important biochemical processes, and hence their performance in pollutant removal. To
develop pollutant removal models, the concepts of local pollutant reduction are combined
with wastewater treatment hydraulic considerations and biochemical processes (von
Sperling et al., 2002, 2003; Sah et al., 2012). Conceptual modelling of the hydrodynamic
regime is widely used to predict the mean hydraulic retention time and the performance of
wastewater ponds (Badrot-Nico et al., 2009; Olukanni and Ducoste 2011; Sah et al., 2012;
Olukanni, 2013; Cortés-Martínez et al., 2014).
Generally, three different regimes are considered when designing or modelling the hydraulic
regimes of ponds: Plug Flow (PF), Completely Stirred Tank Reactor (CSTR), and Dispersed
Flow (DF). More details about these models are presented in Table 2.4 of Chapter 2. The
two idealised and extreme models of CSTR and PF are frequently assumed, but according to
von Sperling (2002), the CSTR conceptual model is valid only for length to width ratios not
significantly greater than unity. When the ratio of the length to the width exceeds unity, von
Sperling (2002, 2005) recommends considering a DF regime. Moreover, the ideal flow
regimes (PF and CSTR) are hard to achieve in practice, since there are many factors leading
to non-ideal flow in ponds reactors: short circuiting, temperature differences (density
current: cold or hot), wind-driven circulation patterns, mixing, pond geometry; axil
dispersion (advection and dispersion). The acceptability of the Completely Stirred or Plug
Flow models is based on simplicity rather than what actually takes place in the ponds.
Non-ideal flow regimes are currently more and more used for better representation of real
pond hydraulics. Agunwamba et al., (1992); Levenspiel, (1999); Małoszewski et al., (2006)
and Kadlec & Wallace (2009) describe reactors with non-ideal flow using the Dispersion and
Mixers-in-Series Models. The Dispersion Model is regarded as a process between PF and
CSTR, which are deemed as two extremes of the hydraulic patterns in unit operation.
Depending on the intensity of intermixing, the prediction of this model ranges from PF at
one extreme and CSTR at the other (The number of reactors in series (N) tends to infinity
and N equal to unity respectively in Equation 3.7; Kadlec & Wallace, 2009). The Mixers-in-

Optimisation of two-stage high-rate anaerobic reactors coupled with baffled pond and wet-dry sand filters for
domestic wastewater treatment in a warm-dry climate (Ouagadougou, Burkina Faso)
PhD Thesis report Moumouni Diafarou Ali Page 54
Series Model considers the system to be divided into a series of mixed reactor tanks. The
dispersion number (d) and the number of reactors in series (N) are the parameters used in
describing the Dispersion Model and the Mixers-in-Series Model respectively. Prior to a
tracer test, the behavior of the ponds was not known, so, both models were tested to see
which fit the experimental tracer data best.
The parameters for the Dispersion and the Mixers-in-Series Models (d and N) can be
calculated from the tracer response curve using mean retention time (tm) (Equation 3.1) and
variance (σ) (Equation 3.2). A detention time distribution (DTD) is commonly used to
represent the time (ti) that various fractions of water spend in the pond (Metcalf & Eddy,
2003; Levenspiel, 1999).
The mean retention time (tm) is approximated if the concentration versus time tracer
response curve (C) is defined by discrete time measurements as shown in Equation 3.1
below
t𝑚=∑ tiCi𝛥𝑡i
∑ Ci𝛥𝑡 (3.1)
Where tm= mean detention time based on discrete time step measurements (days)
ti= time at measurement (days)
Ci= tracer concentration measurement (g/m3)
Δti= time increment (days)
𝜎𝑐2=
∑ ti2 CiΔti
∑ CiΔt-tm
2 (3.2)
Where σc2= variance based on discrete time measurements
Dispersion model
The following equations (2.3, 2.4 and 2.5) are used to determine the dispersion number (d)
as described by Metcalf & Eddy, (2003) and Levenspiel, (1999).
d=D
vL (3.3)
Where d = dispersion number, (no units) D = coefficient of dispersion (m2/s)
v = fluid velocity (m/s)
L = reactor length (m)
Metcalf & Eddy, (2003) has described the relationships among variance of normalized tracer
responseσn2, variance σc
2 derived from tracer response curve (C), mean detention time (tm),
and dispersion number (d) for a pulse tracer input as follows:
𝜎𝑛2 =
𝜎𝑐2
𝑡𝑚2 = 2
𝐷
𝑣𝐿 (3.4)

Optimisation of two-stage high-rate anaerobic reactors coupled with baffled pond and wet-dry sand filters for
domestic wastewater treatment in a warm-dry climate (Ouagadougou, Burkina Faso)
PhD Thesis report Moumouni Diafarou Ali Page 55
2d=σc
2
tm2 (3.5)
Where 𝜎𝑛2 = variance of normalized tracer response C curve
𝜎𝑐2 = variance derived from curve C
tm= mean retention time
According to Metcalf and Eddy, (2003), the calculated dispersion values are used to explain
the degree of axial dispersion in wastewater treatment as presented in Table 3.1.
Table 3.1: Description of axial dispersion values
d Degree of Axial Dispersion
0 ideal plug flow
<0.05 low dispersion
0.05-0.25 moderate dispersion
>0.25 high dispersion
approaches infinity (∞) system is considered completely mixed
Source: (Metcalf and Eddy, 2003)
Moreover, other mathematical transport (Equation 3.6) has been reported by Małoszewski
et al., (2006) to best describe the hydraulic flow patterns in ponds. This includes the Multi-
Flow Dispersion Model (MFDM) and Single-Flow Dispersion Model (DM). The MFDM depicts
tracer transport along several individual flow paths (characterized by different water
velocities and dispersivities), while the DM assumes convective-dispersive transport along a
single flow path.
αLiVi
∂2Ci
∂x2+Vi
∂Ci
∂x=
∂Ci
∂t (3.6)
Where: Ci (t) is the concentration of tracer in the effluent from the ith flow-path, and, αLi and
vi are the longitudinal dispersivity and the mean water velocity for the ith flow path,
respectively, x is the length of the flow-path and t is the time after injection.
The solution of Equation 3.6 for an instantaneous injection was more elaborated by
Małoszewski et al., (2006).
Mixers-in-Series Model
The Mixers-in-Series Model is reported by Kadlec and Wallace, (2009) to be a gamma
distribution of detention times given in Equation 3.7 below:
𝑔(𝑡) =𝑁
𝑡𝑚𝛤(𝑁)∗ (
𝑁𝑡
𝑡𝑚)𝑁−1 ∗ 𝑒𝑥𝑝 (−
𝑁𝑡
𝑡𝑚) (3.7)
Where: Γ(N)=gamma function of N , = ( N-1)!, factorial, if N is an integer, d-1
N=number of tanks (shape parameter), unitless
t = detention time, (days)
tm = mean detention time, (days)

Optimisation of two-stage high-rate anaerobic reactors coupled with baffled pond and wet-dry sand filters for
domestic wastewater treatment in a warm-dry climate (Ouagadougou, Burkina Faso)
PhD Thesis report Moumouni Diafarou Ali Page 56
When N= 1, the gamma distribution becomes the exponential distribution. Both the gamma
distribution and the gamma function are readily available as computer spreadsheet tools
(GAMMADIST and GAMMALN in Excel™). Equation 3.7 may easily be fitted to tracer data by
selecting N and t to minimize error by using SOLVER in Excel™.
The number of complete mixed reactors in series (N) can also be calculated using the mean
retention time (Equation 3.1) and variance (Equation 3.2) derived from tracer response
curve as in the Equation 3.8 below:
N=tm
2
σn2 (3.8)
Where N = number of mixers in series.
Other hydraulic characteristics
The dead volume, an index of short circuiting and the volumetric efficiency of the pond
reactor, can be determined using Equations 3.10, 3.11 and 3.12 respectively (Levenspiel,
1999)
After determination of the mean theoretical detention time (tHRT) with Equation 2.9, the
fraction of dead volume can be calculated as:
tHRT=Vr
Q (3.9)
𝐷ead volume=(1-tm
tHRT)*100% (3.10)
Where: tHRT = theoretical hydraulic retention time (days), Vr= volume of the reactor (m3), Q=
flow rate (m3/day) and tm = mean detention time (days)
The index of short-circuiting (αs) indicates how fast the influent reaches the effluent point. It
is expressed as values that range from 0 to 1. When αs approaches 1, the extent of short
circuiting can be considered large.
αs=tm-tp
tm (3.11)
Where: αs= index of short-circuiting and tp=time taken to reach the maximum tracer concentration.
The volumetric efficiency can be calculated by dividing the mean hydraulic retention time
(tm) by the mean theoretical detention time (tHRT).
Volumetric efficiency=tm
tHRT (3.12)

Optimisation of two-stage high-rate anaerobic reactors coupled with baffled pond and wet-dry sand filters for
domestic wastewater treatment in a warm-dry climate (Ouagadougou, Burkina Faso)
PhD Thesis report Moumouni Diafarou Ali Page 57
3.2 Methodology
3.2.1 Pilot plant description
The Baffled Pond with attached-growth and the control pond used in this study were
described in Chapter 2 (Figure 2.4). The operational conditions were also as described in
Chapter 2. After evaluating the performance of the two options (AR-BP and AR-SF) of the
pilot plant, and because of the fact that the AR-BP option has exhibited higher pathogen
removal with zero level detection of E. coli (Chapter 2), there was a need to study the effect
of baffles on the hydraulic characteristics of the baffled pond. This is addressed in this
chapter by comparing the tracer results of the Baffled Pond with those of the Control Pond.
3.2.2 Tracer experimental procedures
Due to the advantages of ease of detection and operation, low cost, low toxicity, high
solubility, and inexpensive analysis, sodium chloride (common kitchen salt) was selected as
the tracing substance to determine the hydraulic flow patterns and the actual HRT of both
the Baffled Pond (BP) and the Control Pond (CP) in this pilot project.
First of all, the kitchen salt crystal (sodium chloride) was purchased at the local market in
Ouagadougou and ground into a powder. The determination of the quantity to be used in
the ponds was based on experience in Brazil (von Sperling Marcos, UFMG Belo Horizonto,
Brazil). Since the background concentration of salt in domestic sewage is high, larger
amount was required to observe peak conductivity (µs/cm) in the ponds. For example, a
pond of 100 m3 needs an addition of 320 kg of NaCl, which means a peak concentration of
3200 mg NaCl /l could be achieved. In addition, to the quantity of salt required for the tracer
test, the correlation between salinity and conductivity should also be determined, since it is
only the conductivity that would be measured in situ. Therefore, a laboratory test was
conducted to determine the correlation between salinity and conductivity. The results show
a good linear correlation of R2=0.998 (Figure 3.1).
Figure 3.1: Results of a laboratory test (in 2iE) of the relationship between electrical
conductivity and sodium chloride concentration
y = 564,11x - 8,35 R² = 0,998
0
1000
2000
3000
4000
5000
6000
7000
8000
0 2 4 6 8 10 12 14
conductivity ms/cm
NaC
l mg/
l

Optimisation of two-stage high-rate anaerobic reactors coupled with baffled pond and wet-dry sand filters for
domestic wastewater treatment in a warm-dry climate (Ouagadougou, Burkina Faso)
PhD Thesis report Moumouni Diafarou Ali Page 58
Twenty-four kilograms of kitchen salt powder (NaCl) was injected after dissolving it in 45 l of
tap water, which was the volume necessary to completely dissolve it. The tracer solution
was injected via the flow distribution box (Figure 3.2) by using a plastic bucket with faucet
located at the bottom to regulate the outflow of the tracer solution. Chang et al. (2011)
recommend injecting the tracer during less than 2% of the theoretical hydraulic retention
time (HRT), which in this case was 7 days for both the BP and the CP, so it was decided to
inject the tracer during 1 hour. During the injection, the dissolved salt solution was gently
stirred to keep a homogeneous solution.
However, before injecting the NaCl, the electrical conductivity of both ponds was measured
at three different depths: 15, 60, and 90 cm in each compartment of the BP and the
corresponding positions in the CP. Then, the tracer test was performed simultaneously for
the two ponds and was run for 12 days (from 25 May to 5 June, 2015). The measurements
of the electrical conductivity and the wastewater temperature were taken manually and
simultaneously every 5 minutes, during the pumping hours, three times a day at 8:00 am,
1:00 pm and 5:00 pm, at the outlets of both ponds (Figure 3.2). This task was continued,
until the baseline conductivity values (initial values) were once again reached. Moreover, to
appreciate the dispersion of the dissolved salt, the electrical conductivity of both ponds was
measured at three different depths and at four positions along the longitudinal length (as
done before the injection of the tracer), one day after this injection and the last day of the
experiment. The flow rates through the BP and the CP were controlled by the crested weir
and stayed practically constant during tracer test (Q= 0.5 m3/d for each pond).
Figure 3.2: Injection of the kitchen salt (NaCl) tracer and measurements of the electrical
conductivity at the outlets of the baffled and Control Ponds
The computational procedures for calculating the tracer actual (measured) mean hydraulic
retention time, dead volume, short-circuiting index, dispersion number and number of
reactors in series were carried out based on the Excel Spreadsheet model provided by
professor von Sperling Marcos (UFMG , Belo Horizonto, Brazil), which was adapted from

Optimisation of two-stage high-rate anaerobic reactors coupled with baffled pond and wet-dry sand filters for
domestic wastewater treatment in a warm-dry climate (Ouagadougou, Burkina Faso)
PhD Thesis report Moumouni Diafarou Ali Page 59
Levenspiel, (1999); Metcalf and Eddy, (2003); and Kadlec and Wallace, (2009) books. In
addition, the gamma distribution model (Equation 3.7) was used to evaluate the degree
that the model fits with the experimental data. At last, the NaCl distribution in both ponds
was calculated by the Surfer Software Package.
3.3 Results and Discussion
3.3.1 Evaluation of the tracer Test
The results of the tracer test with salt (sodium chloride, NaCl) were corrected for the
background content of salt, based on measurements taken before the injection of the
tracer. The data received from actual tracer studies from the field were plotted and found
to be skewed with long tails (Figures 3.3 and 3.4). Various parameters were used to
represent the hydraulic characteristics in the Baffled and Control ponds (Table 3.2). The
hydraulic characteristics were calculated based on Levenspiel (1999); Metcalf and Eddy
(2003); and Kadlec and Wallace, (2009) and the concentration and time data that were
obtained (section 3.1.3). Tracer distribution patterns were drawn, at depths of 15, 60 and
90 cm, to depict the flow patterns in both the Baffled and Control ponds immediately before
the injection of the tracer, one day after the injection and at the end of the experiment
(Figure 3.5). The light green color of Figure 3.5 shows lesser concentration of the tracer,
while the blue to the dark blue colors indicates higher concentrations and the more
concentrated contours lines represents uniform distribution of the tracer.
The flow patterns of the Baffled and Control Ponds were different from one another,
implying that the baffles arrangement affected the flow pattern (Figure 3.3). This was also
observed by Babu (2011) who explained this phenomenon as being due to the vertical
baffles placed perpendicular to the flow direction seemed to perform best in reducing short-
circuiting. However, the tracer movement towards the outlet seems to be fast at the
beginning for both ponds. The tracer took about 3 hours 20 minutes to reach the first peak
in the BP, while 4 hours was necessary to attain the first peak in the CP (Figures 3.3 and
3.4). One might have expected tracer progress towards the outlet to be slower in the BP,
but this was not the case (Figures 3.3 and 3.4). This early arrival of tracer at the outlet of BP
can be reasoned partially by remembering that the velocity distribution in the Baffled Pond
was parabolic (Safieddine, 2007), and besides, the baffles sheets did not fit not tightly
against the walls of the pond, so the wastewater could also flow around them. Moreover,
similar observations were also reported by Safieddine, (2007) and Chang et al., (2011), who
explained that this could happen when the location of the dead regions were towards the
outlet of the pond. Figure 3.5 presents a typical situation concerning the positions of the
dead regions. This confirms the results previously reported by these researchers.
Another important issue from the flow distribution visualization techniques, which cannot be
obtained by residence time distribution analyses alone, was the exact behavior of the tracer
at certain points in time in the pond and the locations of probable dead zones (Figure 3.5).

Optimisation of two-stage high-rate anaerobic reactors coupled with baffled pond and wet-dry sand filters for
domestic wastewater treatment in a warm-dry climate (Ouagadougou, Burkina Faso)
PhD Thesis report Moumouni Diafarou Ali Page 60
For instance, after one day, most of the tracer was still in the first compartment and bottom
layers of the Baffled Pond, whereas in the Control Pond it was seen to mainly distribute
towards the outlet and top layers (Figure 3.5). A similar trend has also been reported by
Olukanni and Ducoste (2011) Computational Fluid Dynamic (CFD) model. Furthermore, at
the end the experiment, the Baffled Pond was able to achieved the initial condition, while
this was not the case in the Control Pond, since more tracer concentrations was retained in
the middle and bottom layers of the left side corners of the Control Pond, which could
represent the dead zones (Figure 3.5). This agrees with the findings reported by some
researchers who found that an increase in the number of baffles reduced the amount of
dead water within the system (Kilani and Ogunrombi, 1984; Lloyd et al., 2003; Aldana et al.,
2005). This confirms the advantage of installing baffles to improve hydraulic performance.
On the other hand, visual examination of the tracer response curves for both the Baffled
and Control Ponds (Figure 3.3) shows that the curves were characterized by several peaks
(maxima). Under quasi steady state hydraulic conditions during the experiment, this effect
suggests that the tracer is transported along different flow-paths (Małoszewski et al., 2006).
This agrees with the findings reported by Małoszewski et al. (2006) and Camargo-Valero,
(2008) who found that the peaks might result from sampling and analytical uncertainties or
from small unsteadiness of flow. In addition, critical analysis of the normalized tracer
response curves strongly suggests that the hydraulic regime in both ponds was close to
complete mixing and even better the surface area under the BP curve represents half of that
the CP (Figure 3.4). These findings are in compliance with the results reported by Camargo-
Valero, (2008) who reported that such tracer response curve depict a rapid mixing in the
pond, involving a process with a very high reaction rate.
Figure 3.3: Tracer response curves showing the relationship between salt concentration and
transit time in the Baffled and Control Ponds
300
500
700
9001100
1300
1500
1700
1900
2100
2300
2500
2700
0 2000 4000 6000 8000 10000 12000 14000 16000
C (
mgN
aC
l/L)
Time (min.)
Baffled and Control ponds output tracer response curves
Control pond
Baffled pond

Optimisation of two-stage high-rate anaerobic reactors coupled with baffled pond and wet-dry sand filters for
domestic wastewater treatment in a warm-dry climate (Ouagadougou, Burkina Faso)
PhD Thesis report Moumouni Diafarou Ali Page 61
Figure 3.4: Normalised tracer salt concentration-transit time curves for the Baffled and
Control Ponds
The actual mean hydraulic retention times (tm) for both the BP and the CP (4.1 and 3.2 days
respectively) were shorter than their theoretical hydraulic retention time (tHRT) which was
6.6 days; Table 3.2). This has also been observed in previous tracer studies in ponds
(Małoszewski et al., 2006; Camargo-Valero, 2008, Chang et al., 2011). The reason why the
actual mean retention time was lower than the theoretical hydraulic retention time could
be attributed to retardation of wastewaters in zones of stagnant flow (dead zones) and to
the occurrence of preferential or bypassing flows (Małoszewski et al., 2006). However, when
comparing the two ponds, it was seen that the actual HRT for the BP was higher than that of
The CP. Such a discrepancy may be due to the longer distance and travel time created by the
baffles (Shilton and Harrison, 2003), which increased the mean retention time by
approximately 1 day (22 % increament). A similar conclusion was reached by Babu, (2011)
who found that by installing 15 baffles perpendicular to the influent flow directionin
maturation ponds, the HRT was increased by about 2 days.
Table 3.2: Parameters used to describe the hydraulic characteristics of the Baffled and
Control Ponds
Parameters Baffled Pond (BP) Control Pond (CP)
Theoretical HRT (tHRT, days) 6.6 6.6
Actual HRT (tm, days) 4.1 3.2
Number of mix reactors in series (N) 1 2
Dispersion number (d) 0.53 0.66
Volumetric efficiency (%) 62 49
Dead volume (%) 38 51
Recovery of tracer (%) 231 229
The data processed showed that the BP and the CP were described by 1 and 2 mixed
reactors in series respectively (Table 3.2). Furthermore, they were found to have high
0
1
2
3
4
5
6
7
8
0 0,5 1 1,5 2 2,5 3 3,5
C/C
o
t/t mean
Tracer normalized curves of the baffled and control ponds
CP
BP

Optimisation of two-stage high-rate anaerobic reactors coupled with baffled pond and wet-dry sand filters for
domestic wastewater treatment in a warm-dry climate (Ouagadougou, Burkina Faso)
PhD Thesis report Moumouni Diafarou Ali Page 62
dispersion numbers (0.5 and 0.6 for the BP and the CP respectively). According to the
Mixers-in-Series Model, the BP and the CP can be respectively described by 1 and 2 mixed
reactors in series with high dispersion (Levenspiel, 1999; Metcalf and Eddy, 2003; Kadlec
and Wallace, 2009). This finding was opposite to that of Kone et al. (2002), who reported
plug flow with dispersion in a facultative pond operated under the same climatic conditions.
Such disparity of flow regime could be due the type of tracer used to perform the test.
The percentage of dead zones in the BP and the CP was found to be 38% and 51%
respectively. This shows that the volume of the BP pond was more efficiently used than the
volume of the CP pond, in which more than half of the total volume was found to dead
zones. Once again, it can be concluded that the addition of baffles with plastic bottle caps
affixed to it can increase the surface area for biofilm growth, and they can also have a
positive effect on pond hydraulics (Kilani and Ogunrombi, 1984; Lloyd et al., 2003; Shilton
and Harrison, 2003; Aldana et al., 2005; Babu, 2011; Olukanni and Ducoste, 2011).
The percentage recovery of NaCl was greater than 200%, which means that the total
concentrations of NaCl measured at the end of the experiment were greater than the total
initial NaCl input (Table 3.2). A similar observation was also reported by Babu, (2011), who
explained that this could be accounted for by the analytical grade of the tracer. Another
possible explanation may be related to the high background content of salt in the domestic
wastewater before and during the experiments. In light of this high tracer recovery, it is
evident that loss of water from the ponds through seepage into the ground is negligible.

Optimisation of two-stage high-rate anaerobic reactors coupled with baffled pond and wet-dry sand filters for
domestic wastewater treatment in a warm-dry climate (Ouagadougou, Burkina Faso)
PhD Thesis report Moumouni Diafarou Ali Page 63
Figure 3.5: Top view of tracer concentrations at 15, 60 and 90 cm deep in the Baffled Pond
(left) and the Control Pond (right); before the tracer was added, one day after injection and
at the end of the experiment.
Note: Light green indicates less tracer and dark blue indicates more.
Before tracer input: NaCl distribution in CP at 15 cm deep
After one day: NaCl distribution in CP at 15 cm deep
After 10 days: NaCl distribution in CP at 15 cm deep
Before tracer input: NaCl distribution in CP at 60 cm deep
After one day: NaCl distribution in CP at 60 cm deep
After 10 days: NaCl distribution in CP at 60 cm deep
Before tracer input: NaCl distribution in CP at 90 cm deep
After one day: NaCl distribution in CP at 90 cm deep
After 10 days: NaCl distribution in CP at 90 cm deep
Before tracer input: NaCl distribution in BP at 15 cm deep
After one day: NaCl distribution in BP at 15 cm deep
After 12 days: NaCl distribution in BP at 15 cm deep
Before tracer input: NaCl distribution in BP at 60 cm deep
After one day: NaCl distribution in BP at 60 cm deep
After 12 days: NaCl distribution in BP at 60 cm deep
Before tracer input: NaCl distribution in BP at 90 cm deep
After one day: NaCl distribution in BP at 90 cm deep
After 12 days: NaCl distribution in BP at 90 cm deep
Po
nd
wid
th
Outlet Inlet
Pond length
Outlet Inlet Baffles
Pond length

Optimisation of two-stage high-rate anaerobic reactors coupled with baffled pond and wet-dry sand filters for
domestic wastewater treatment in a warm-dry climate (Ouagadougou, Burkina Faso)
PhD Thesis report Moumouni Diafarou Ali Page 64
3.3.2 Model fitting
The flow regimes in the Baffled and Control Ponds can be characterized by selecting the
curve that most closely fits the experimental tracer response curves in the family of
theoretical curves, such as the gamma distribution model, the multi-flow dispersion model,
the single-flow dispersion model (Equations 3.6 and 3.7) and many others mathematical
transport models. Hence, in this study the Excel Spreadsheet model provided by professor
Marcos von Sperling Marcos (UFMG, Belo Horizonto, Brazil), was used to evaluate the index
of the model fitting process of the experimental data with the gamma distribution model
(Figure 3.6). The tracer data of the Baffled Pond best fit the estimated data from the gamma
distribution much better than those of the Control Pond (Figures 3.6a and b). However, in
both cases, the real flow pattern deviates slightly from ideal behavior depicted by the
gamma distribution model. For the Control Pond, a better fit in the tail rather than the peak
area was achieved (Figure 3.6b), whereas that of the Baffled Pond approximately follows
the model but deviates somewhat towards the tail (Figure 3.6a). The model fitting data
from this exercise showed for N=1 (number of mixed reactors in series) and d=0.53
(dispersion number), a correlation coefficient of 0.451 was achieved in the Baffled pond,
while in the control pond, for N=2 and d=0.66, a correlation coefficient of 0.423 was
obtained. This fairly weak correlation could likely be attributed to the sampling
measurement periods, since the tracers concentrations were only recorded during pumping
hours, which corresponded to the outflow times. Similar observations were also reported by
Chang et al., (2011), who found that sampling period had an effect on the tracer response
curve.
However, despite this weak correlation, one can assert that the Dispersion and Mixed
reactors-in-Series Models are basically suitable for cases in which the real flow pattern
deviates only slightly from ideal behavior (von Sperling et al., 2002, 2003, 2005;
Małoszewski et al., 2006; Safieddine, 2007, Olukanni and Ducoste, 2011; Olukanni, 2013;
Cortés-Martínez et al., 2014). Furthermore, because the Dispersion Model is more flexible
and is able to represent all types of reactors and besides, the first-order decay (K)
coefficients derived from that model are assumed to best represent the reality of reaction
kinetics (von Sperling et al., 2002, 2003, 2005). Thus, the first-order organic and fecal
coliform removal rates for each pond could therefore be calculated using the classical
equations of Wehner and Wilhelm (1956) given by equations 2.19, 2.20 and 2.21 (Table 2.4
in Chapter 2), since the actual hydraulic retention times and the dispersion numbers are
known.

Optimisation of two-stage high-rate anaerobic reactors coupled with baffled pond and wet-dry sand filters for
domestic wastewater treatment in a warm-dry climate (Ouagadougou, Burkina Faso)
PhD Thesis report Moumouni Diafarou Ali Page 65
Figure 3.6: Comparison between the actual tracer residence time distributions function and
the Mixed –Reactors-in-Series Model (Gamma distribution model)
3.4 Conclusions
The tracer study was carried out to confirm the effect of baffles with a roughened surface
on the hydraulic patterns by comparing the results of the tracer response curves of a baffled
pond and its control under Sahelian conditions. The actual mean hydraulic retention times
for the BP and the CP were 4.1 and 3.2 days respectively. This indicates that by introducing
three verticals baffles in a pond receiving an anaerobically treated effluent could increase
the mean retention time by approximately 1 day (ie. 22 % increased). Therefore, these
findings show that there is significant potential for size reduction and cost optimization to
be achieved by the incorporation of properly designed baffles in ponds in tropical climates.
Moreover, it was found that the volume of the Baffled Pond was more efficiently used for
0,00002
0,00004
0,00006
0,00008
0,00010
0,00012
0,00014
0,00016
0,00018
0 5000 10000 15000 20000
Resid
tim
e d
ist
(1/m
in)
Time (min.)
Baffled pond adjusted residence time distribution curve
Tracer
Estimated
(a)
0,00002
0,00004
0,00006
0,00008
0,0001
0,00012
0,00014
0,00016
0 5000 10000 15000
Resid
tim
e d
ist
(1/m
in)
Time (min.)
Control pond adjusted residence time distribution curve
Tracer
Estimated
(b)

Optimisation of two-stage high-rate anaerobic reactors coupled with baffled pond and wet-dry sand filters for
domestic wastewater treatment in a warm-dry climate (Ouagadougou, Burkina Faso)
PhD Thesis report Moumouni Diafarou Ali Page 66
wastewater treatment than the unbaffled Control Pond, since more half of the volume of
the latter was calculated to be an inactive, ‘dead’ zone. The actual mean retention times
based on the tracer study calculations for each pond was lower than the theoretical mean
retention times. A possible explanation could be attributed to the slowing of wastewaters in
zones of stagnant flow and to the occurrence of preferential or bypassing flows. On the
other hand, the tracer experiments showed that the outcome of the fluid flow pattern of
these ponds can be fairly approximated as resulting of one and two mixed reactors in series
with high dispersion for the Baffled and Control Ponds respectively. Consequently, both
Dispersed and Mixed-Reactors-in-Series Models are more appropriate for predicting the
performance of the Baffled Pond. Because of the high tracer recovery from both ponds, one
can conclude that the loss of water through seepage is negligible and that sodium chloride
can be considered an economical and conservative tracer.
3.5 References
[1]Abbassi R., Khan F., and Hawboldt K. (2010). A methodology of finding dispersion coefficients using
computational fluid dynamics (CFDs). International Journal of Water Resources and Environmental
Engineering 2(5), 114-120
[2]Agunwamba, J. C., Egbuniwe, N. and Ademiluyi, J. O. (1992). Prediction of the dispersion number in waste
stabilization ponds. Water Research, 26(1), 85–89.
[3]Aldana, G. J., Lloyd, B. J., Guganesharajah K., and Bracho. N. (2005). The development and calibration of a
physical model to assist in optimizing the hydraulic performance and design of maturation ponds.
Water Science and Technology 51 (12): 173-181.
[4]Babu, M. (2011). Effect of algal biofilm and operational conditions on nitrogen removal in wastewater
stabilization ponds. PhD. Thesis at Wageningen University and UNESCO-IHE Institute of Water
Education Netherlands, 144 p.
[5] Badrot-Nico, F., Guinot, V. & Brissaud, F. (2009). Fluid flow pattern and water residence time in waste
stabilisation ponds. Water Science and Technology 59 (6), 1061–1068.
[6] Banda, C. G. (2007). Computational fluid dynamics modeling of baffled waste stabilization Ponds. PhD
Thesis, School of Civil Engineering, University of Leeds, UK, Leeds.
[7] Camargo-Valero, M. A. (2008). Nitrogen Transformation Pathways and Removal Mechanisms in Domestic
Wastewater Treatment by Maturation Ponds. PhD Thesis. School of Civil Engineering, The University of
Leeds, Leeds 156 pp.
[8]Chang N.-B., Xuan Z., and Wanielista M. P. (2011). A tracer study for assessing the interactions between
hydraulic retention time and transport processes in a wetland system for nutrient removal. Bioprocess
Biosyst Eng; DOI 10.1007/s00449-011-0578-z
[9] Cortés-Martínez F., Treviño-Cansino A., Alcorta-García M. A., Kalashnikov V., and Luévanos-Rojas R. (2014).
Mathematical Analysis for the Optimization of a Design in a Facultative Pond: Indicator Organism and
Organic Matter. Hindawi Publishing Corporation Mathematical Problems in Engineering,
http://dx.doi.org/10.1155/2014/652509 (access 2/01/2015)
[10]Dierberg F. E., DeBusk T. A. (2005). An evaluation of two tracers in surface-flow wetlands: Rhodamine-WT
and lithium. Wetlands 25(1):8–25
[11] Iasenza R. (1998).Mixing and transport processes in wastewater basins. MSc. Thesis report, Civil
Engineering and Applied Mechanics of McGill University, Montreal, Canada
[12]Kadlec R. H., Tanner C. C., Hally V. M., Gibbs M. M. (2005). Nitrogen spiraling in subsurface-flow
constructed wetlands: implications for treatment response. Ecol. Eng.; 25:365–381

Optimisation of two-stage high-rate anaerobic reactors coupled with baffled pond and wet-dry sand filters for
domestic wastewater treatment in a warm-dry climate (Ouagadougou, Burkina Faso)
PhD Thesis report Moumouni Diafarou Ali Page 67
[13]Kadlec R. H., and Wallace S. D. (2009). Treatment wetlands, 2nd edn. Taylor and Francis Group, Boca
Raton, 1048pp
[14] Kilani, J.S. & Ogunrombi, J.A. (1984). Effects of baffles on the performance of model waste stabilization
ponds. Water Res., 18 (8), 941–944.
[15] Kone D., Seignez C. and Holliger C. (2002). Review of wastewater stabilization ponds performances in
West and Central Africa (Etat des lieux du lagunage en Afrique de l'ouest et du centre). Proceedings of
International Symposium on Environmental Pollution Control and Waste Management, Tunis (EPCOWM
2002), 698-707.
[16] Levenspiel, O. (1999). Chemical Reaction Engineering, 3rd ed. John Wiley and sons, New York, 668 p.
[17]Lin AY.-C., Debroux J.-F., Cunningham J. A., Reinhard M. (2003). Comparison of rhodamine WT and
bromide in the determination of hydraulic characteristics of constructed wetlands. Ecol. Eng.; 20:75–88
[18]Lloyd B. J., Vorkas C. A., and Guganesharajah R. K. (2003). Reducing hydraulic short-circuiting in maturation
ponds to maximize pathogen removal using channels and wind breaks. Water Science and Technology
48 (2 ): 153–162
[19]Małoszewski P., Wachniew P., Czupryński P. (2006). Hydraulic characteristics of a wastewater treatment
pond evaluated through tracer test and multi-flow mathematical approach. Pol. J. Environ. Stud.
15(1):105–110
[20]Metcalf & Eddy (2003). Wastewater engineering, Treatment and Reuse. Tchobanoglous, G., Burton, F.L.,
Stensel, H.D (Eds). 4th Ed. McGraw Hill, Inc., USA.
[21] Muttamara S. and Puetpaiboon U.(1997). Roles of baffles in waste stabilization ponds. Water Science and
Technology, 35, (8), 275–284,
[22]Nameche, T.H. and Vasel, J.L. (1998). Hydrodynamic studies and modelization for aerated lagoons and
waste stabilization ponds. Wat. Res. 32 (10). 3039-3045
[23] Olukanni, D.O (2013). Evaluation of the Influence of Reactor Design on the Treatment Performance of an
Optimized Pilot-Scale Waste Stabilization Pond. International Journal of Engineering and Technology, 3
(2).
[24] Olukanni, D.O. & Ducoste, J.J. (2011). Optimization of Waste Stabilization Pond Design for Developing
Nations using Computational Fluid Dynamics. Ecological Eng., 37: 1878–1888.
[25] Ronkanen A. K., Kløve B. (2007). Use of stabile isotopes and tracers to detect preferential flow patterns in
a peatland treating municipal wastewater. J. Hydrol. 347:418–429
[26] Ronkanen A. K., Kløve B. (2008). Hydraulics and flow modelling of water treatment wetlands constructed
on peatlands in Northern Finland. Water Res 42:3826–3836
[27] Safieddine,T. (2007). Hydrodynamics of Waste Stabilization Ponds and Aerated Lagoons. PhD. Thesis,
Department of Bioresource Engineering, Macdonald Campus, McGill University, Montreal, Canada, 242
p.
[28] Sah L., Rousseau D. P. L., and Hooijmans C. M. (2012). Numerical modelling of waste stabilization ponds:
where do we stand? Water, Air & Soil Pollution, 223, (6), 3155–3171
[29] Shilton A. & Harrison J. (2003). Development of guidelines for improved hydraulic design of waste
stabilisation ponds. Water Science and Technology, 48 (2): 173–18
[30] Shilton, A.N. & Mara, D. D. (2005). CFD (computational fluid dynamics) modeling of baffles for optimizing
tropical waste stabilization ponds system. Water Science and Technology, 51 (12), 103–106.
[31]Shilton, A., Wilks, T., Smyth, J. and Bickers, P. (2000). Tracer studies on a New Zealand waste stabilization
pond and analysis of treatment efficiency. Wat. Sci. Tech. 42 (10-11), 343-348
[32]Short, M.D., Cromar, N.J., and Fallowfield, H.J. (2010). Hydrodynamic performance of pilot-scale
duckweed, algal-based, rock filter and attached-growth media reactors used for waste stabilization
pond research. Ecol. Eng. 36, 1700-1708.
[33] Von Sperling M. (2005). Modelling of coliform removal in 186 facultative and maturation ponds around
the world. Water Research, 39: 5261 – 5273

Optimisation of two-stage high-rate anaerobic reactors coupled with baffled pond and wet-dry sand filters for
domestic wastewater treatment in a warm-dry climate (Ouagadougou, Burkina Faso)
PhD Thesis report Moumouni Diafarou Ali Page 68
[34] von Sperling, M., Chernicharo, C. A. L., Soares, A. M. E. & Zerbini, A. M. (2002). Coliform and helminth eggs
removal in a combined UASB reactor-baffled pond system in Brazil: performance evaluation and
mathematical modelling. Water Science and Technology, 45 (10), 237–242.
[35] von Sperling, M., Chernicharo, C. A. L., Soares, A. M. E. & Zerbini, A. M. (2003). Evaluation and modelling
of helminth eggs removal in baffled and unbaffled ponds treating anaerobic effluent. Water Science and
Technology, 48 (2), 113–120.

Optimisation of two-stage high-rate anaerobic reactors coupled with baffled pond and wet-dry sand filters for
domestic wastewater treatment in a warm-dry climate (Ouagadougou, Burkina Faso)
PhD Thesis report Moumouni Diafarou Ali Page 69
Chapter 4
4. E. coli distribution and its removal in a Sahelian Baffled Pond
The performance evaluation (Chapter 2) revealed zero detection of Escherichia coli in the
effluent of the Baffled Pond with attached growth during the two years of operation with
two different hydraulic flow rates. The aim of this chapter was to investigate and
understand this lack of detection of Escherichia coli. Furthermore, the die-off rates of
Escherichia coli in both the Baffled and Control Ponds were derived based on the Dispersed-
flow Model obtained from the tracer test (Chapter 3). The importance of these baffles with
roughened surfaces is also discussed in greater depth here.
4.1 Removal mechanisms of E. coli in WSP
New concepts have to be developed to control the growing problems of water pollution in
developing countries (Parker, 1988). For this reason, many researchers have strived to
improve existing wastewater treatment systems. Wastes Stabilization Ponds (WSPs), for
example, have undergone many innovations. Some studies discussed and demonstrated the
role of baffles in WSPs and have concluded that they improve the hydraulics and increase
the efficiency of organic and pathogens removal (Kilani and Ogunrombi, 1984; Muttamara
and Puetpaiboon, 1997; von Sperling et al., 2003; Ouali et al., 2012). A number of previous
studies have also looked at the optimization aspects of WSPs with respect to many factors
such as cost and efficiency of treatment plant construction and operation (Oke and Otun
2001; Olukanni and Ducoste, 2011; Cortés-Martínez et al., 2014). In a study conducted by
Shin and Polprasert (1987, 1988) have shown that the introduction of artificial media for
biofilms to attach to within the pond water enhance the performance of WSPs in terms of
the removal of organics, ammonia and suspended solids.
Furthermore, WSPs have been an important research area over the past two decades to
understand the driving processes of disinfection in these systems. Indeed, E. coli and faecal
coliform bacteria have been widely used as biological indicators for monitoring wastewater
treatment systems. Previous studies have shown that the main factors driving disinfection
(E. coli decay) in ponds are: solar radiation (especially UVB and UVA) (von Sperling, 2005;
Davies et al., 2009 ; Nelson et al., 2009 ; Bolton et al., 2010; Ouali et al., 2012, 2014), pH,
dissolved oxygen, temperature, ammonia content (Curtis et al., 1992; Davies-Colley et al.,
1999; van der Steen et al., 2000; Oragui, 2003; Abis and Mara, 2006; Maïga et al.,
2009; Buchanan et al., 2011; Ukpong, 2013), algal biomass (van der Steen et al., 2000),
nutrient limitations, activity of bacteriophage viruses, water depth (Maïga et al., 2009),
hydrodynamics of the ponds (Kilani and Ogunrombi, 1984; von Sperling et al., 2003).
Several studies on the effects of individual parameters from this list on microbial indicator
species in aquatic systems have been conducted using laboratory or pilot plant conditions,
but converged on the conclusion that a synergistic effect of physical, chemical and
environmental factors were responsible for the inactivation of pathogens in these systems

Optimisation of two-stage high-rate anaerobic reactors coupled with baffled pond and wet-dry sand filters for
domestic wastewater treatment in a warm-dry climate (Ouagadougou, Burkina Faso)
PhD Thesis report Moumouni Diafarou Ali Page 70
(Curtis et al., 1992; Davies-Colley et al., 1999; Oragui, 2003; Maïga et al., 2009; Nelson et al.,
2009; Bolton et al., 2010; Ouali et al., 2014).
For instance, Oragui, (2003) found that, in a two-meter-deep facultative pond, pathogen
concentrations decreased largely in the top meter of the pond. He argued that this decline
in the top layer was due to the combined effects of high pH and toxicity of ammonia and
sulphide. Earlier studies carried by Curtis et al. (1992) on the exposure of faecal indicator
microorganisms to high pH values in the absence of light have shown that pH alone was not
toxic, unless extreme values were used, which would be hardly reached in pond systems.
Similar experiments by the same authors showed that high concentrations of dissolved
oxygen alone did not affect these microorganisms. It was concluded that a combination of
high dissolved oxygen, solar radiation, high pH, and algal growth had a lethal effect on the
microorganisms. Furthermore, Maiga et al., (2009) found a strong correlation between the
inactivation of coliform bacteria and pond depth, with shallower ponds being more effective
(t test, α=0.05). They also found that the damage caused to enteric pathogens was more
pronounced in the presence of sunlight than in the dark.
On the other hand, various studies focused on the development of empirical models, which
according to Bastos et al., (2011) followed a first-order kinetic, regardless of the mechanism
of bacterial inactivation. However, besides this progress, no one has reported complete
inactivation of E. coli in conventional or improved WSPs.
The current study analyses an alternative treatment system combining two high-rate
anaerobic reactors in series, followed by a baffled pond with attached-growth on recycled
plastic bottle caps, which was developed and tested under Sahelian climate at the 2iE
Research Site in Ouagadougou, Burkina Faso (West Africa). The system was operated at a
pilot scale under two different flow rates (1 and 1.5 m3/d) and an average influent E. coli
count of 5.6 x 10⁷/100 ml (Chapter 2). This pilot plant was monitored for two years and no
E. coli were ever detected in the effluent.
The objective of this study was to investigate and understand the non-detection of E. coli at
the outlet of this improved WSP. Some of the most significant physical, chemical, and
environmental factors which could be responsible for the inactivation of E. coli in the baffled
pond were investigated, as reported by previous studies.
4.2 Methodology
4.2.1 Experimental setup
The Baffled Pond with attached-growth and the Control Pond used in this study are
described in Chapter 2 (Figure 2.4), together with their operational conditions. After
evaluating the performance of the two options (AR-BP and AR-SF) of the pilot plant, and
because of the fact that the AR-BP option exhibited higher pathogen removal with zero
detection of E. coli (Chapter 2), there was an interest to understand the mechanisms that
led to such important results. This was addressed by carrying out an intensive investigation

Optimisation of two-stage high-rate anaerobic reactors coupled with baffled pond and wet-dry sand filters for
domestic wastewater treatment in a warm-dry climate (Ouagadougou, Burkina Faso)
PhD Thesis report Moumouni Diafarou Ali Page 71
on the distribution of E. coli in both the Baffled and Control Ponds, in order to give a better
description and improved understanding of the non-detection of E-coli in the effluent of this
Baffled Pond.
4.2.2 Sampling and analysis
A “shaft syringe” developed by Konaté et al., (2010) was modified and was used for
sampling. The sampler was made of a 3 m plastic rod on which 60 mL syringes were fixed.
The syringes were 15 cm equidistant from one to another and a string was fixed to each
syringe to facilitate the wastewater sampling. Grab samples of 500 ml were taken weekly
between 8:00 to 9:00 am, at three different depths (15, 60 and 105 cm) and in each
compartment (A, B, C and D) of the pond during five months from March to July 2014
(Figure 4.1). The collected samples were stored at 4ºC and analysed within 3 hours for E.
coli, chlorophyll-A and total chemical oxygen demand (COD), according to APHA (2012).
The spread plate method was used to determine the presence and abundance of E. coli as
an indicator microorganism in the samples and Chromocult Agar (Merck KGaA 64271,
Darmstadt, Germany) was used as the culture medium. Chlorophyll-A was measured using
the spectrophotometric method (APHA, 2012). It consisted of a sequential procedure of
filtration, centrifugation and extraction of the chlorophyll by using an organic solvent (90%
acetone). The extracted chlorophyll was then analysed by a spectrophotometer Hach Lange
DR 5000 with 750 nm and 665 nm light absorption wavelengths. Dissolved COD was
analysed by using potassium dichromate as a strong oxidizing agent and was measured with
a spectrophometer at a wavelength of 620 nm (Hach Lange, DR 5000).
The pH, water temperature (T) and dissolved oxygen (DO) were measured in situ with an
integrated portable pH-T-DO meter (WTW 340i/SET) fixed to a cylindrical iron rod carefully
graduated. This device was previously calibrated using standard buffer solutions before any
usage. The measurements were carried out during the pumping hours, three times a day at
8:00 am, 1:00 pm and 5:00 pm at seven different depths (15, 30, 45, 60, 75, 90 and 105 cm
from top to bottom) and in each compartment (A, B, C and D) of the pond. The sampling
positions are depicted on Figure 4.1.

Optimisation of two-stage high-rate anaerobic reactors coupled with baffled pond and wet-dry sand filters for
domestic wastewater treatment in a warm-dry climate (Ouagadougou, Burkina Faso)
PhD Thesis report Moumouni Diafarou Ali Page 72
Figure 4.1: (a) Photograph of the Baffled Pond (b) Side view of the Baffled Pond with
attached plastic bottle caps and the sampling points (Note: The three orange sampling points in each compartment were forE-coli; Chlorophyll-A and COD, while all the seven
sampling points in each compartment were for pH, temperature and dissolved oxygen.)
Tracer experiments (Chapter 3) indicated that it was reasonable to consider both ponds to
be Mixed-Reactors-in-Series or Dispersion Model. However, because the Dispersed-flow
Model is more flexible and is able to represent all types of reactors and besides, the first-
order decay (K) coefficients derived from that model are assumed to best represent reality
and the true reaction kinetics (Wehner and Wilhelm, 1956; von Sperling, 2002, 2003; von
Sperling et al., 2003). The first order decay coefficients for each pond were therefore
derived using the classical equations (Wehner and Wilhelm, 1956; Equations 2.19, 2.20 and
2.21; Table 2.4 in chapter 2).
4.3 Results and Discussion
A total of 240 samples were collected from different depths and in the four compartments
of the Baffled Pond and tested for E. coli, Chlorophyll-A and COD.
4.3.1 Baffled Pond investigation
E. coli distribution pattern
Arithmetic mean and standard deviation of E. coli from different depths and in the four
compartments are listed in Table 4.1. Influent values ranged from 103 to 104 per 100 ml at
the inlet and the final concentration of E. coli at the outlet was consistently <1 per 100 ml.
(a)
(b)
1.06 m 0.54 m 0.54 m 1.06 m

Optimisation of two-stage high-rate anaerobic reactors coupled with baffled pond and wet-dry sand filters for
domestic wastewater treatment in a warm-dry climate (Ouagadougou, Burkina Faso)
PhD Thesis report Moumouni Diafarou Ali Page 73
This pattern clearly indicates that the gradual decrease in E. coli concentration follows the
theoretical water course in the pond. E. coli concentrations were consistently lower in the
top 0.60 m of the water column, and higher in the lower layers of all four compartments
(Figure 4.2, Table 4.1). E. coli concentrations diminished from the bottom toward the top of
the pond and also from the inlet toward the outlet (Figure 4.2).
It is important to point out that from a depth of 0.60 m upward in Compartment D, no E. coli
were detected throughout the entire experiment (Figure 4.2). Since the effluent of the
Baffled Pond was collected from the top layer, at a depth of 0.15 m, no E. coli were detected
in the effluent. Based on the relatively high concentrations of E. coli detected at the bottom,
it seems that the environmental conditions of the upper layer were more favourable for the
destruction of E. coli. Some of the E. coli removal in the Baffled Pond may have occurred
through sedimentation of these bacteria through association with particulate matter, such
as dead algae. Most of the settling occurred in the first compartments of the pond (Figure
4.2). This removal via sedimentation is clearly related to the hydraulic retention time (Stott,
2003; Konaté et al., 2010). This finding contrasts with the results of van der Steen et al.,
(2000) and Sarikaya et al., (1987b), who reported that after treatment in an anaerobic pond
or anaerobic reactor, E. coli sedimentation was of minor importance.
Table 4.1: Summary of E. coli concentration per 100 ml at different depths and in all
compartments of the Baffled Pond
Sampling depth (m)
compartment Number of samples per depth A B C D
0.15 Avg* 1.0E+03 8.8E+02 3.8E+02 <1
20 δ* 1.7E+03 1.7E+03 7.4E+02 NA
0.60 Avg 1.3E+03 1.1E+03 8.4E+02 <1
20 δ 1.8E+03 2.8E+03 1.4E+03 NA
1.05 Avg 2.2E+03 2.0E+03 1.1E+03 5.8E+02
20 δ 5.2E+03 3.7E+03 1.8E+03 7.2E+02
Avg: Arithmetic average; δ: standard deviation; <1 per 100ml; NA: Not applicable

Optimisation of two-stage high-rate anaerobic reactors coupled with baffled pond and wet-dry sand filters for
domestic wastewater treatment in a warm-dry climate (Ouagadougou, Burkina Faso)
PhD Thesis report Moumouni Diafarou Ali Page 74
Figure 4.2: Arithmetic average distribution pattern of E. coli over depth and longitudinal
distance in the four compartments of the Baffled Pond (20 samples for each depth)
A comparative study was conducted by monitoring the Baffled and unbaffled Control Ponds
for six months working, under the same environmental conditions. Table 4.2 presents a
summary of the hydraulic characteristics, E. coli removal efficiencies and decay rates in both
the BP and the CP. In 31 tests, the residual concentrations of E. coli remained higher than
1000 per 100 ml at the outlet of the CP. E. coli decay showed an average removal of around
4.5 log-units in the BP and 1.1 log-units in the CP. Lower values 2.2 and 2.3 log-units
compare to the BP and higher values with respect to the CP were reported by Van der Steen
et al., (2000). The statistical analyses revealed that the performance of the BP and the CP in
terms of E. coli removal were significantly different (t-test, 𝛂=0.05). When comparing the
hydraulic characteristics, it was shown that the actual HRT of the BP (4.1 days) was higher
than that of the CP (3.2 days). This was believed to be due to the longer travel time created
by the baffles in the pond. High dispersion numbers were determined (0.5 and 0.6 in BP and
CP respectively). The dead volumes in the BP and the CP were found to be 38% and 51%
respectively, while their effective volumetric efficiencies were 62% and 49% respectively
(Table 4.2), as discussed earlier in Chapter 3. Therefore, the volume of the BP was used
more efficiently for wastewater treatment than in the CP. According to both the Mixers-in -
Series and the Dispersion Models, the BP and the CP behaved like Mixed-Reactors-in-Series
(Levenspiel, 1999; Metcalf and Eddy, 2003). It can be concluded that the baffles with
attached media, which increase the hydraulic retention time in the BP, may have played an
important role in the removal of E. coli.
Other parameters that may have contributed to the elimination of E. coli are discussed later.
The inactivation of E. coli in WSPs is due to very complex interactions of physical, chemical
and biological processes (van der Steen et al., 2000). For instance, the photo-oxidation
0,E+00
5,E+02
1,E+03
2,E+03
2,E+03
3,E+03
3,E+03
4,E+03
4,E+03
5,E+03
5,E+03
6,E+03
6,E+03
7,E+03
7,E+03
8,E+03
8,E+03
0 0,5 1 1,5 2 2,5 3
Co
nce
ntr
ati
on
E.
coli
(N
o/1
00
mL
)
Longitudinal distance (m)
Depth 0.15 m
Depth 0.60 m
Depth 1.05 m
A B C D
+
Standard
deviation

Optimisation of two-stage high-rate anaerobic reactors coupled with baffled pond and wet-dry sand filters for
domestic wastewater treatment in a warm-dry climate (Ouagadougou, Burkina Faso)
PhD Thesis report Moumouni Diafarou Ali Page 75
process was reported by Curtis et al., (1992) to be affected by the pH and the DO of the
wastewater, which could also be the case in the present study, where simultaneous high pH
and DO were achieved. The effects of factors influencing inactivation rate (k) of E. coli in
dark and light conditions were reported by previous researchers. It appeared to be high
(0.796 h-1) in the light and low (0.045 h-1) in the dark (Maiga et al., 2009). The k value of 1.1
day-1 found in the CP is in agreement with the findings of von Sperling (2002, 2003), von
Sperling et al. (2003) and Van der Steen et al., (2000). The k in the BP was 9.1 day–1, eight
times the k value in the CP. This increase in E. coli decay efficiency may be explained by the
presence of the baffles in the BP. Therefore, the shallower pond depth (1.1 m), combined
with the hot climatic conditions in this country, are ideal conditions for E. coli decay (Maiga
et al., 2009; Bolton et al., 2010; Konaté et al., 2010; Ouali et al., 2014).
Table 4.2: Summary of hydraulic characteristics, E. coli removal efficiencies and decay rates
in the Baffled Pond and the Control Pond
Parameter Influent
wastewater Baffled Pond Control Pond
Number of samples
Flow (m3 day
-1) 0.5 0.5 0.5 31
Actual hydraulic retention time (days)
- 4.1 3.2 1
Dispersion number - 0.5 0.6 1 Volumetric efficiency (%) - 62 49 1 Dead volume (%) - 38 51 1
Flow type
-
One mixed reactor
Two mixed reactors in
series 1
E. coli concentration (N°/100 mL)
1E+5± 2E+5 < 1 4E+03±7E+03 31
E. coli log-unit removal (%)
- 4.5±0.8 1.1±0.7 31
kd first-order E. coli decay coefficient (day
–1 )
- 9.1±3.2 1.1±1.2 31
Chlorophyll-A Distribution Pattern
Figure 4.3 shows the profile of Chlorophyll-A concentrations in the four compartments and
at different depths. In the upper layers of all the compartments, above a depth of 0.60 m,
higher values of Chlorophyll A (≥ 1000 µg/l) were observed and lower values ( ≤ 200 µg/l )
were found deeper in the pond (Figure 4.3). The low concentration of Chlorophyll-A in the
bottom layers may be due to the scarce amount of sunlight that reaches there (Maϊga et al.,
2009). The algal growth (with a high concentration of Chlorophyll-A) in the upper layers of
the Baffled Pond has two opposing effects on E. coli (Van der Steen et al., 2000). In the first
place, algal and other particles absorb solar radiation in the upper layers of the pond and, as
a result, protect E. coli from destruction. Secondly, pH and DO will increase due to algal
photosynthesis, therefore stimulating the photo-oxidation process that kills E. coli (Curtis et

Optimisation of two-stage high-rate anaerobic reactors coupled with baffled pond and wet-dry sand filters for
domestic wastewater treatment in a warm-dry climate (Ouagadougou, Burkina Faso)
PhD Thesis report Moumouni Diafarou Ali Page 76
al., 1992). The algal distribution profile for this study was similar to that predicted by the 3D
model of Sah et al., (2011), which was developed for a secondary facultative pond.
Figure 4.3: Arithmetic average distribution pattern of Chlorophyll-A over depth and
longitudinal distance in the four compartments of the Baffled Pond (20 samples for each
depth)
COD distribution pattern
Figure 4.4 shows the profile of dissolved COD concentrations in the four compartments and
at different depths. One of the conditions for the survival of E. coli is the availability of
carbon sources to sustain its cellular metabolism (Van der Steen et al., 2000). Therefore, the
availability of carbon sources for the E. coli was measured via the dissolved COD
concentration. The Baffled Pond had lower COD concentrations in the upper layers (a mean
of 120 mg/L) and high values (250 mg/L) in the lower layers for all compartments, especially
in the intermediate ones (B and C) (Figure 4.4). The results of this experiment indicate
similar distribution patterns for E. coli and COD. This interdependency between E. coli and
COD is in line with the findings of van der Steen et al. (2000), where very low E. coli decay is
expected in the bottom layer, since enough carbon and nutrients are available.
On the other hand, the fact that higher concentrations of COD and E. coli were observed in
the lower layers and higher algal values in the upper layers leads one to the conclusion that
this polishing Baffled Pond was operating as a facultative pond. In addition, these results
(high concentrations of COD and faecal coliform bacteria in the lower layers) are in
agreement with those of El Halouani et al., (1993), Metcalf and Eddy (2003), Henze et al.,
(2008), and Buchanan et al., (2011), who argued that the die-off rate of coliform bacteria
depends on the amount and type of organic matter in the wastewater and its temperature.
If the water contains significant concentrations of organic matter and is at an elevated
temperature, the bacteria may increase in number which was the case of this present study
for the bottom layers. A similar phenomenon was been observed by Gerba (2008) in
0,00
0,20
0,40
0,60
0,80
1,00
1,20
1,40
0 0,5 1 1,5 2 2,5 3
Co
nce
ntr
ati
on
ch
loro
ph
yll
a
(mg
/L)
Longitudinal distance (m)
Depth 0.15 m
Depth 0.60 m
Depth 1.05 m
A B C D
+
-
Standard
deviation

Optimisation of two-stage high-rate anaerobic reactors coupled with baffled pond and wet-dry sand filters for
domestic wastewater treatment in a warm-dry climate (Ouagadougou, Burkina Faso)
PhD Thesis report Moumouni Diafarou Ali Page 77
eutrophic tropical waters, which received organically enriched waters after heavy rainfall.
Figure 4.4: Arithmetic average distribution pattern of COD over depth and longitudinal
distance in the four compartments of the Baffled Pond (20 samples for each depth)
4.3.2 pH, DO and Temperature variations and distributions in the BP
pH, DO and Temperature diurnal variations
Dissolved oxygen (DO), pH, and temperature were recorded at seven different depths of
each compartment of the Baffled Pond and three times a day during the pumping hours
(Table 4.3). Early in the mornings at 8:00 am, the average pH recorded throughout the
experimental period was 8.7 in all compartments of the entire depth of the Baffled Pond. In
the afternoons and evenings, at 1:00 pm and 5:00 pm, the pH had increased to 9.5 and 9.6
respectively, in the upper layers of all compartments up to a depth of 0.60 m, then
decreased in the bottom layers of all compartments to 8.9, 8.8 respectively (Table 4.3). The
results are consistent with the explanation by Bolton et al., (2010) that diurnal changes in
pH occur mainly in WSPs due to algal photosynthesis.
Indeed, similar trends were also obtained with respect to DO. In the upper layers of all the
compartments, up to a depth of 0.60 m, in the morning, the average DO concentration was
3.7 mg/L and then decreased to 2.9 mg/L in the lower layers of all compartments. However,
there was an increase of DO in the afternoons and evenings and a decrease from top to
bottom in all compartments: 9.4 to 4.8 mg/L and 12.5 to 4.4 mg/L respectively (Table 4.3).
The main reasons of these high levels of DO in the Baffled Pond could be due to the
photosynthesis of algae combined with alternate upward and downward flow induced by
the baffles (Olukanni and Ducoste, 2011; Bolton et al., 2010).
Temperature, pH and DO showed similar trends. Lower values were recorded in the
mornings and higher values in the afternoons and evenings from top to bottom in all
compartments: 30.1 ◦C to 29.8 ◦C, 33.6 ◦C to 30.3 ◦C and 33.3 ◦C to 30.4 ◦C respectively
(Table 4.3). This result is comparable to that observed by Abis and Mara (2006) and Ukpong
(2013), whose work was also done in a hot climate.
From this study, it appears that pH, DO and temperature varies:
0
80
160
240
320
400
480
560
0 0,5 1 1,5 2 2,5 3
Co
nce
ntr
ati
on
CO
D (
mg
/L)
Longitudinal distance (m)
Depth 0.15 m
Depth 0.60 m
Depth 1.05 m
A B C D
+
Standard
deviation

Optimisation of two-stage high-rate anaerobic reactors coupled with baffled pond and wet-dry sand filters for
domestic wastewater treatment in a warm-dry climate (Ouagadougou, Burkina Faso)
PhD Thesis report Moumouni Diafarou Ali Page 78
during the day time at 8:00 am, 1:00 pm and 5:00 pm,
from the upper layers to the lower layers and
from one compartment to another.
These findings agree with those of Maïga et al., (2009), van der Steen et al., (2000), Sarikaya
et al., (1987b), and von Sperling and Mascarenhas (2005), who reported that a shallow
depth helped to create a predominantly aerobic environment and solar radiation, can easily
reach the entire depth of the pond. Besides, the diurnal variations of pH, DO and
temperature were in agreement with the seasonal fluctuation recorded during the
experimental period and this is linked to the intensity of solar radiation (Kayombo et al.,
2002).
Table 4.3: Summary of average values of pH, DO and temperature in the four compartments and at different depths of the Baffled Pond during the morning, noon and afternoon
Compartment Variables
Time of
sampling
Sampling depth (cm)
15a 30 45 60 75 90 105
Avg± Std*
A
pH
8:00am 8.6 ± 0.5 8.5 ± 0.7 8.6 ± 0.7 8.6 ± 0.7 8.6 ± 0.7 8.6± 0.7 8.6± 0.7
1:00pm 9.3 ± 0.8 9.4 ± 0.8 9.3 ± 0.7 9.0 ± 0.6 8.9 ± 0.6 8.8± 0.6 8.7± 0.6
5:00pm 9.5 ± 0.7 9.4 ± 1 9.3 ± 0.9 9.0 ± 0.8 8.7 ± 0.8 8.7± 0.7 8.6± 0.7
DO mg/L
8:00am 4± 1.1 3.4± 1.1 3.2± 1 3± 0.9 2.8± 0.7 2.7± 0.6 2.6± 0.5
1:00pm 8.9± 1.5 8.5± 1.7 7.6± 1.7 6.6± 1.6 5.9± 1.4 4.9 ± 1.3 4.3± 1.2
5:00pm 11.2± 2.2 11.4± 2.2 10.8± 2.4 8.2± 3.3 5.8± 2.1 4.6± 2.1 3.9± 1.4
T oC
8:00am 30.2± 2 30.2± 2 29.9± 2 29.8± 2 29.8± 2 29.8± 2 29.8± 2
1:00pm 33.5± 2 32.8± 2 31.6± 2 30.8± 2 30.4± 2 30.2± 2 30.2± 2
5:00pm 33.4± 2 33.3± 2 32.6± 2 31.6± 2 30.9± 2 30.6± 2 30.3± 2
B
pH
8:00am 8.7± 0.7 8.7± 0.7 8.7± 0.7 8.7± 0.7 8.7± 0.7 8.7± 0.7 8.6± 0.7
1:00pm 9.6± 0.8 9.5± 0.9 9.2± 0.7 9± 0.7 8.9± 0.7 8.8± 0.7 8.8± 0.7
5:00pm 9.6± 1 9.6± 1 9.3± 0.9 9± 0.8 8.8± 0.8 8.7± 0.8 8.6± 0.7
DO mg/L
8:00am 3.7± 1.1 3.4± 1.1 3.2± 0.9 3.1± 0.8 3± 0.8 3± 0.7 2.9± 0.7
1:00pm 9.3± 1.8 9.1± 1.9 8.6± 2 7.9± 1.9 6.8± 1.4 5.9± 1.2 5± 1
5:00pm 12.5 ± 2.2 12.5± 2.1 11.7± 2.2 9.9± 2.3 7.3± 1.8 5.7± 1.6 4.8± 1.6
T oC
8:00am 30.1± 2 30.1± 2 30.1± 2 30± 2 29.9± 2 29.9± 2 29.8± 2
1:00pm 33.5± 2 33.1± 2 31.9± 3 30.9± 3 30.4± 2 30.4± 2 30.4± 2
5:00pm 33.2± 3 33.2± 2 32.4± 2 31.4± 2 30.7± 2 30.5± 2 30.5± 2
C
pH
8:00am 8.8± 0.7 8.7± 0.8 8.7± 0.8 8.7± 0.8 8.7± 0.8 8.7± 0.8 8.7± 0.8
1:00pm 9.6± 0.9 9.6± 0.9 9.3± 0.8 9.1± 0.7 8.9± 0.7 8.8± 0.7 8.8± 0.7
5:00pm 9.7± 1 9.6± 1 9.3 ± 0.9 9± 0.8 8.8± 0.8 8.7± 0.8 8.7± 0.7
DO mg/L
8:00am 3.6 ± 1.3 3.4± 1.3 3.3± 1.3 3.2± 1.1 3± 0.9 3± 0.8 3± 0.8
1:00pm 9.3± 1.8 8.8± 1.8 8.6± 2.2 8.2± 2.3 7.2± 2.4 5.7± 1.7 4.9± 1.7
5:00pm 12.7± 2.4 12.7± 2.6 10.1± 2.4 10.3± 2.2 7.9± 2.3 5.7± 1.9 4.6± 1.3
T oC
8:00am 30.1± 2 30.1± 2 30.1± 2 30± 2 29.9± 2 29.9± 2 29.8± 2
1:00pm 33.6± 2 33.3± 2 32± 3 31.2± 3 30.7± 2 30.5± 2 30.3± 2
5:00pm 33.3± 3 33.3± 2 33.5± 2 31.5± 2 30.9± 2 30.5± 2 30.4± 2
D
pH
8:00am 8.8± 0.6 8.7± 0.8 8.7± 0.7 8.7 ± 0.7 8.7± 0.7 8.7± 0.7 8.7± 0.7
1:00pm 9.6± 1 9.6± 0.9 9.3± 0.7 9.1± 0.7 8.9± 0.7 8.8± 0.7 8.7± 0.7
5:00pm 9.7± 1 9.6± 1 9.3± 0.9 8.9± 0.8 8.7± 0.8 8.7± 0.8 8.6± 0.7
DO mg/L
8:00am 3.5± 1.3 3.2± 1.2 3.1± 1.2 3± 0.9 2.8± 0.8 2.7± 0.7 2.7± 0.7
1:00pm 10± 2.5 9.6± 2.3 8.7± 2.1 7.2± 2.2 6.4± 1.9 5.6± 1.6 4.9± 1.3
5:00pm 13.4± 2.2 13.2± 2.5 11.7± 2.6 9± 2.5 6.7± 2.4 5± 2 4.1± 1.4
T oC
8:00am 30 ± 2 30± 2 30± 2 30± 2 29.9± 2 29.9± 2 29.8± 2
1:00pm 33.7± 3 33.3± 2 32.1± 3 31.1± 2 30.7± 2 30.5± 2 30.4± 2
5:00pm 33.4± 3 33.3± 3 32.5± 3 31.4± 2 30.9± 2 30.6± 2 30.5± 2 apH, DO and Temperature were recorded 450 times at each depth; *Avg: Arithmetic average; Std: standard deviation

Optimisation of two-stage high-rate anaerobic reactors coupled with baffled pond and wet-dry sand filters for
domestic wastewater treatment in a warm-dry climate (Ouagadougou, Burkina Faso)
PhD Thesis report Moumouni Diafarou Ali Page 79
pH, DO and Temperature profiles
Figure 4.5 depicts pH, dissolved oxygen (DO) and temperature profiles. The pH recorded in
the upper layers of Compartments A, B, C and D respectively were: 9.2, 9.3, 9.3 and 9.4,
then decreased progressively to approximately 8.7 in the lower layers of all compartments
(Figure 4.5a). These high pH values achieved in this experimental study are in agreement of
those reported by Curtis et al., (1992) and Kayombo et al., (2002). Moreover, similar profile
of pH was predicted by the 3D model of Sah et al., (2011), which was developed for a
secondary facultative pond. It is also reported by Bolton et al., (2010) that pH could result in
a decreased stability of the cells of micro-organism in the ponds (Figure 4.2).
Furthermore, similar profiles were also achieved for the DO. Higher values of DO were
recorded in the top layers (8.1, 8.5, 8.5 and 8.8 mg/L in Compartments A, B, C and D
respectively) and decreased to lower values in the lower layers (respectively to 3.6, 4.2, 4.2
and 3.4 mg/l; Figure 4.5b). The DO profile for this study was similar to that predicted by the
3D model of Sah et al., (2011), which was developed for a secondary facultative pond.
Bolton et al., (2010), comment that DO stratification can vary significantly through the water
column, with nearly all effective light being absorbed in upper layers. It is also assumed that
an increase in DO would result in an increase in highly reactive oxygen species formation
and therefore increase the photo-oxidation. This fact could be the reason why low E. coli
concentrations were found in this Baffled Pond (Figure 4.2). The results of this study are also
in agreement with those of Davies-Colley et al., (1999) who reported that the endogenous
photo-inactivation of E. coli was strongly dependent on DO.
Temperature, pH and DO showed similar profiles. The temperature falls from 32, 33, 32 and
31◦C in the top layer (up to a depth of 15cm) to 30, 30, 30 and 28 ◦C at a depth of 75 cm in
Compartments A, B, C and D respectively. However, below there, the temperature remains
constant (Figure 4.5c). The model developed by Ukpong (2013), based on published data
from ponds operated in similar climatic conditions to predict the vertical temperature
profile in waste stabilization ponds shows a comparable trend (Figure 4.5c). The reasons for
this phenomenon (thermal stratification in ponds) are well documented in the literature
(Abis & Mara, 2006; Ukpong, 2013). Certainly, the higher relative temperature difference
from the surface layer of the pond to the bottom layer during thermal stratification
processes could be related to the complex mechanisms of thermal energy transfer between
the water surface and the air.
The profiles for pH, DO and temperature in those three cases were similar to those of the
Baffled Pond (Figure 4.5). In the upper layers of all the compartments (down to a depth of
0.60 m), higher values of pH (≥9), DO (≥9 mg/L) and temperature (≥32°C) were observed,
whereas lower values were found in the lower layers (Figure 4.5). The results are consistent
with those of Ouali et al., (2014) and Curtis et al., (1992) who found that the die-off rates of
E. coli were dependent on pH, DO and temperature, with more rapid disinfection at higher
values of these parameters

Optimisation of two-stage high-rate anaerobic reactors coupled with baffled pond and wet-dry sand filters for
domestic wastewater treatment in a warm-dry climate (Ouagadougou, Burkina Faso)
PhD Thesis report Moumouni Diafarou Ali Page 80
Figure 4.5: Arithmetic daily (8:00am, 1:00pm and 5:00pm) averageprofiles of: (a) pH, (b) DO
and (c) Temperature in the four compartments of the Baffled Pond
(DO, pH and temperature were recorded 450 times at each depth)
0
20
40
60
80
100
120
7,5 8,0 8,5 9,0 9,5 10,0 10,5
Dep
th i
n c
m
pH
pH profile: March to July 2014
A B
C D
Standard
deviation
+
-
(a)
0
20
40
60
80
100
120
2 2,5 3 3,5 4 4,5 5 5,5 6 6,5 7 7,5 8 8,5 9 9,5 10 10,5 11
Dep
th i
n c
m
mg/l
Dissolved oxygen profile: March-july 2014
A B
C D
Standard
deviation
+ -
(b)
0
20
40
60
80
100
120
25 26 27 28 29 30 31 32 33 34 35
Dep
th i
n c
m
T°C
Temperature profile: March to July 2014
A B
C D
Standard
deviation
+ -
(c)

Optimisation of two-stage high-rate anaerobic reactors coupled with baffled pond and wet-dry sand filters for
domestic wastewater treatment in a warm-dry climate (Ouagadougou, Burkina Faso)
PhD Thesis report Moumouni Diafarou Ali Page 81
4.4 Conclusions
The investigation carried out in the Baffled Pond to understand the non-detection (< 1 per
100 ml) of E. coli in its effluent has confirmed the results of the previous study of the
performance evaluation of the two-stage high rate anaerobic reactor followed by a Baffled
Pond with attached-growth for domestic wastewater treatment in a sub-Saharan African,
warm-dry climate. The results obtained from this study have revealed the benefits of
releasing the effluent from the top layer pond with respect to E. coli inactivation. Moreover,
it was found that there was a significant difference in the removal efficiencies and die-off
rates for E. coli between the BP and the CP. This implied that the baffles with attached
media, which increased the hydraulic retention time in the BP compared to CP, may have
played an important role in the removal of E. coli. In addition, the effluent from the baffled
pond was released from the top layer, where there were consistently fewer E. coli.
Sedimentation, combined with the synergetic effects of the physical, chemical, and
environmental factors may be responsible for the inactivation of E. coli in this system. It is
advisable to investigate the importance of predation by zooplankton in the elimination of E.
coli from this sort of Baffled Pond. Based on the outcome of this research, it was concluded
that treatment via anaerobic reactors followed by Baffled Ponds could be applied widely as
a low-cost alternative to treat the wastewater low-income city-dwellers, and it would be
recommended for the effluent to be used for restricted irrigation of peri-urban agriculture.
4.5 References
[1] Abis K. L. and Mara D. D. (2006). Temperature Measurement and Stratification in Facultative Waste
Stabilisation Ponds in the UK Climate. Environmental Monitoring and Assessment; 114(1-3):35-47
[2] APHA (2012). Standard Methods for the Examination of Water and Wastewater. 22sd
edition. American
Public Health Association/American Water Works Association/Water Environment Federation;
American, Washington DC, USA.
[3] Bastos R. K. X., Rios E. N., Bevilacqua P. D. & Andrade R. C. (2011). UASB-polishing ponds design
parameters: contributions from a pilot scale study in southeast Brazil. Water Science and Technology;
63 (6):1276–1281.
[4] Bolton N. F., Cromar N. J., Hallsworth P., Fallowfield H. J. (2010). A review of the factors affecting sunlight
inactivation of micro-organisms in waste stabilisation ponds: preliminary results for enterococci. Water
Sci Technol.; 61(4):885-890
[5] Buchanan A., Cromar N., Bolton N. and Fallowfield H. J. (2011). The E. coli removal performance of two
waste stabilisation ponds in the Barossa Valley region of South Australia. In 9th IWA Specialist Group
Conference on Waste Stabilization Ponds. Adelaide, Australia.
[6] Cortés-Martínez F., Treviño-Cansino A., Alcorta-García M. A., Kalashnikov V., and Luévanos-Rojas R. (2014).
Mathematical Analysis for the Optimization of a Design in a Facultative Pond: Indicator Organism and
Organic Matter. Hindawi Publishing Corporation Mathematical Problems in Engineering,
http://dx.doi.org/10.1155/2014/652509 (accessed 2/01/2015)
[7] Curtis T. P., Mara D. D. and Silva S. A. (1992).Influence of pH, oxygen, and humic substances on ability of
sunlight to damage fecal coliforms in waste stabilization pond water. Applied and Environmental
Microbiology 58(4):1335-1343.

Optimisation of two-stage high-rate anaerobic reactors coupled with baffled pond and wet-dry sand filters for
domestic wastewater treatment in a warm-dry climate (Ouagadougou, Burkina Faso)
PhD Thesis report Moumouni Diafarou Ali Page 82
[8] Davies C. M., Roser D. J., Feitz A. J. and Ashbolt, N. J. (2009). Solar radiation disinfection of drinking water at
temperate latitudes: Inactivation rates for an optimised reactor configuration. Water Research; 43
(3):643–652.
[9] Davies-Colley R. J., Donnison A. M., Speed D. J., Ross C. M. and Nagel J. W. (1999). Inactivation of faecal
indicator micro-organisms in waste stabilisation ponds: Interactions of environmental factors with
sunlight. Water Research; 33(5):1220-1230
[10] El Halouani H., Picot B., Casellas C., Pena G. and Bontoux J. (1993). Elimination de l’azote et du phosphore
dans um lagunage à haut rendement (Removal of ammonia and phosphorous in a high rate algal pond).
Revue des Sciences de l´eau; 6:47-61.
[11] Gerba C. P. (2008). Pathogen Removal, in Henze, M., van Loosdrecht, M.C.M; Ekama G.A., and Brdjanovic.
D. (Eds.), Biological Wastewater Treatment: Principles, Modelling and Design. Published by IWA
Publishing, London, UK; 221-239
[12] Henze M., van Loosdrecht M. C. M., Ekama G. A. and Brdjanovic D. (2008). Biological Wastewater
Treatment: Principles, Modelling and Design. Published by IWA Publishing, London, UK
[13] Kayombo S., Mbwette T. S. A., Mayo A. W., Katima J. H. Y. and Jørgensen S. E. (2002). Diurnal cycles of
variation of physical–chemical parameters in waste stabilization ponds. Ecological Engineering;
18(3):287-291
[14] Kilani J. S. and Ogunrombi J. A. (1984). Effects of baffles on the performance of model waste stabilization
ponds. Water Res. 1984; 18 (8):941–944.
[15] Konaté Y., Maϊga A. H., Wethe J., Basset D., Casellas C. and Picot B. (2010). Sludge accumulation in
anaerobic pond and viability of helminth eggs: a case study in Burkina Faso. Water Science and
Technology; 61(4):919-925.
[16] Levenspiel, O. (1999). Chemical Reaction Engineering 3rd
ed. John Wiley and sons, New York 1999. [17]Maïga Y., Wethe J., Denyigba K. and Ouattara A. S. (2009). The impact of pond depth and environment
conditions on sunlight inactivation of Escherichia coli and enterococci in wastewater in a warm climate.
Canadian Journal of Microbiology; 55(12):1364-1374
[18] Metcalf & Eddy. (2003). Wastewater engineering, Treatment and Reuse. Tchobanoglous G, Burton FL,
Stensel HD (Eds). 4th
Ed. McGraw Hill, Inc, USA
[19] Muttamara S., and Puetpaiboon U. (1997). Roles of baffles in waste stabilization ponds. Water Sci Technol;
35 (8):275–284.
[20] Nelson K. L., Kadir K., Fisher M. B. and Love D. (2009). New insights into sunlight disinfection mechanisms
in waste stabilisation ponds. 8th IWA Specialist Group Conference on Waste Stabilisation Ponds Belo
Horizonte, Brazil, 26–30 April 2009.
[21] Oke I.A., Otun J.A. (2001). Mathematical analysis of economic sizing of stabilization ponds. Nigerian J. Eng.
; 9 (1):13–21.
[22] Olukanni D. O. and Ducoste J. J.(2011). Optimization of Waste Stabilization Pond Design for Developing
Nations using Computational Fluid Dynamics. Ecological Eng.; 37:1878–1888.
[23] Oragui J. (2003).Viruses in feces, in Mara D and Horan N (Eds), The Handbook of water and wastewater
Microbiology. Academic Press, San Diego; 473-476.
[24] Ouali A., Jupsin H., Ghrabi A. and Vasel J. L. (2014). Removal kinetic of Escherichia coli and enterococci in
a laboratory pilot scale wastewater maturation pond. Water Science and Technology; 69(4):755–759
[25] Ouali A., Jupsin H., Vasel J. L., Marouani L. & Ghrabi A. (2012). Removal improvement of bacteria (E. coli
and enterococci) in maturation pond using baffles. Water Science and Technology; 65 (4):589–595.
[26] Parker D. (1988) Wastewater technology innovation for the year (2000). Journal of Environmental
Engineering. 1988; 114(3): 487-506.
[27] Sah L., Rousseau D. P. L., Hooijmans C. M. and Lens P. N. L. (2011). 3D model for a secondary facultative
pond. Ecological Modelling; 222 :1592–1603

Optimisation of two-stage high-rate anaerobic reactors coupled with baffled pond and wet-dry sand filters for
domestic wastewater treatment in a warm-dry climate (Ouagadougou, Burkina Faso)
PhD Thesis report Moumouni Diafarou Ali Page 83
[28] Sarikaya H. Z., Saatchi A. M. and Abdulfuttah A. F. (1987b). Effect of pond depth on bacterial die-off. J.
Environ. Eng.; 113(6):1350-1362.
[29] Shin H. K., and Polprasert C. (1988). Ammonia nitrogen removal in attached-growth ponds. The Journal of
Environmental Engineering; 114, (4)
[30] Shin H. K., and Polprasert C. (1987). Attached-growth waste stabilization pond treatment evaluation.
Water Science and Technology; 19(12): 229-235
[31] Stott R. (2003).Fate and behaviour of parasites in wastewater treatment systems, in Mara D. and Horan
N. (Eds.), The Handbook of water and wastewater Microbiology. Academic Press, San Diego; 491-521.
[32] Ukpong E. C. (2013). Model for Vertical Temperature Profile in Waste Stabilization Ponds. The
International Journal of Engineering and Science; 2(7), 58-74
[33] van der Steen P., Brenner A., Shabtai Y. and Oron G. (2000). Improved fecal coliform decay in integrated
duckweed and algal ponds. Water Science and Technology; 42 (10–11):363–370
[34] von Sperling M. (2005). Modelling of coliform removal in 186 facultative and maturation ponds around
the world. Water Research; 39:5261–5273
[35] Von Sperling M. (2003). Influence of the dispersion number on the estimation of coliform removal in
ponds. Water Science and Technology; 48 (2): 181–18
[36] Von Sperling M. (2002). Relationship between first-order decay coefficients in ponds, for plug flow, CSTR
and dispersed flow regimes. WaterScience and Technology; 45 (1):17–24
[37] von Sperling M., Chernicharo C. A. L., Soares A. M. E. and Zerbini A. M.(2003). Evaluation and modelling of
helminth eggs removal in baffled and unbaffled ponds treating anaerobic effluent. Water Science and
Technology; 48 (2):113–120.
[38] von Sperling M., and Mascarenhas L. C. A. M. (2005). Performance of very shallow ponds treating effluents
from UASB reactors. Water Sci. Technol.; 51 (12):83–90.
[39] Wehner J. F., Wilhelm R. H. (1956). Boundary conditions of flow reactor. Chem. Eng. Sci; 6 (2):89–93.

Optimisation of two-stage high-rate anaerobic reactors coupled with baffled pond and wet-dry sand filters for
domestic wastewater treatment in a warm-dry climate (Ouagadougou, Burkina Faso)
PhD Thesis report Moumouni Diafarou Ali Page 84
Chapter 5
5. Biofilm characteristics and zooplankton composition in a Baffled Pond in the Sahel Region of Africa
This chapter focuses on the characteristics of the biofilm that formed in the Baffled Pond, in
terms of algal biomass distribution, microbial diversity, and zooplankton species
composition and distribution in the water column and on the attached media. The potential
correlations among phytoplankton, zooplankton, bacteria, suspended solids, and several
environmental variables are also discussed.
5.1 Importance of biofilm biomass and zooplankton development in WSP
Biofilm has been defined as ‘’a layer of microorganisms in an aquatic environment held
together in a polymeric matrix attached to a substratum’’, and these adherent
microorganisms are frequently embedded within a self-produced matrix of an Extracellular
Polymeric Substance (EPS) (van der Wende and Characklis, 1990). In the natural aquatic
environment, bacteria may be planktonic (i.e., suspended in the water) or sessile (i.e., fixed
to a surface). Biofilms may contain many different types of microorganisms, including
bacteria, archaea, protozoa, fungi, and algae, with each group performing specialized
metabolic functions (Donlan, 2002). Bacteria living in a biofilm also usually have significantly
different properties from free-floating bacteria of the same species, as the dense and
protected environment of the film allows them to cooperate and interact in various ways.
Although biofilm formation is sometimes considered detrimental in certain instances, it can
also be harnessed for beneficial purposes (Brading et al., 1995). For instance, Bitton, (2005)
pointed out an increased interest in biofilm microbiology within the field of wastewater
treatment, which is leading to the development of specialized biological wastewater
treatment systems. The role played by the microorganisms in wastewater treatment plant
depends on the process being used and biofilms are very efficient at degrading soluble
organic matter, transforming and removing nitrogen, and filtering out suspended solids and
other microorganisms (von Sperling and Chernicharo, 2005). Biofilms also help to remove of
phosphorus by simply creating the favourable conditions for microorganisms to carry out
this process (Henze et al., 2008). Indeed, biological wastewater treatment occurs through
the role of microorganisms, since domestic wastewater consists of roughly 70-80% organic
matter, most of which can be consumed by these organisms (Bitton, 2005).
A mutualistic relationship between bacteria and algae also enhances the treatment that
takes place in the Waste Stabilization ponds (WSP) (Kayombo et al., 2002). In addition, WSP
have been shown to contain a complex ecosystem, consisting of algae, virus, protozoa,
rotifers, insects, crustaceans, and fungi (von Sperling and Chernicharo, 2005). These
microbial communities stabilize the organic waste and lower the levels of pathogens in the
effluent. Last but not least, biofilms are known to be important components of food chains
in rivers and streams and are grazed by the aquatic invertebrates that many fish later eat

Optimisation of two-stage high-rate anaerobic reactors coupled with baffled pond and wet-dry sand filters for
domestic wastewater treatment in a warm-dry climate (Ouagadougou, Burkina Faso)
PhD Thesis report Moumouni Diafarou Ali Page 85
(Oueda, 2009). In addition, many fish, such as the family Loricaridae, feed on the biofilm
directly (Bitton, 2005).
In any case, biofilm formation is difficult to control and the attachment of microorganisms
to surfaces is a very complex process, with many variables affecting the outcome (Brading et
al., 1995). The principal factors include oxygen, pH, temperature, nutrients, cations, type of
substrate, extracellular polymeric substance (EPS) and flow velocity (Characklis et al., 1990;
Esterl et al., 2003). Characklis et al. (1990) noted that the extent of microbial colonization
increases as the surface roughness increases, and this was mainly due to lower shear forces
on rougher surfaces. It has also been shown that bacteria preferentially attach to a variety
of surfaces (Pringle and Fletcher, 1983). Surprisingly, microorganisms attach more rapidly to
hydrophobic, non-polar surfaces (e.g., Teflon and other plastics) than to hydrophilic
materials (e.g., glass or metal; Fletcher and Loeb, 1979; Pringle and Fletcher, 1983;
Bendinger et al., 1993; Donlan, 2002). In this context, provision of artificial plastic media
may be a good option for encouraging the development of microbial biomass in wastewater
treatment plants and hence enhance their performance.
In this regard, various strategies have been developed for effective control of biofilm for
constructive purposes. For instance, Babu, (2011) investigated the effect of baffles on the
algal-bacterial biofilm structure and the composition of zooplankton in WSP for nitrogen
removal, and found that baffles improved water quality, which in turn affected the ecology
of the treatment plant, and thus its performance.
Another subject of importance is the effect of zooplankton on wastewater treatment
(Mitchell and Williams, 1982). There are three major classes of crustacean zooplankton in
these ponds: copepods, cladocera and rotifers (Babu, 2011). These have different sizes and
feeding habits, although overlap does exist (Oueda, 2009). Zooplankton have been reported
to be more abundant in ponds with low organic loading (Uhlman, 1980), and they also
release nutrients back into the water (Lehman, 1980; Lampert et al., 1986; Lai and Lam,
1997). Babu, (2011) found that the presence of zooplankton in ponds did not contribute
much to nitrogen removal. Therefore, the effect of zooplankton on nutrient removal in
ponds is still not well understood.
Although researchers are becoming increasingly aware of the importance of roles that
biofilm play in wastewater treatment processes, little research has been done in Sahelian
climatic conditions. Hence, a greater understanding of biofilm processes, including their
distribution, dynamism, and diversity, in both sessile and planktonic placement in WSP, is
key to providing good treatment and optimal system performance. Therefore, in this study,
baffles with additional rough surfaces as attachment media support (plastic) were
incorporated in a pilot-scale wastewater pond and investigated under Sahelian climatic
conditions for algal biomass distribution, microbial diversity, and zooplankton species
composition and distribution in the water column and on the attached media of the pond.

Optimisation of two-stage high-rate anaerobic reactors coupled with baffled pond and wet-dry sand filters for
domestic wastewater treatment in a warm-dry climate (Ouagadougou, Burkina Faso)
PhD Thesis report Moumouni Diafarou Ali Page 86
5.2 Methodology
5.2.1 Pilot plant description
The Baffled Pond with attached-growth used in this study, and its operational conditions,
were as described in Chapter 2 (Figure 2.4). In order to better understand the non-
detection of E. coli in the effluent of this Baffled Pond, algal biomass distribution, microbial
diversity, and zooplankton species composition and distribution in the bulk water and
attached media were studied
5.2.2 Sampling and analysis
After two years of operation of the Baffled Pond, grab samples of 500 ml were taken
between 8:00 to 9:00 am, at three different depths (15, 60 and 90 cm) in the water column
and in each compartment (A, B, C and D). Next, the pond was carefully emptied and the
entire biofilm was carefully scraped off within sample plots of 10 cm by 10 cm (0.01 m2), at
depths of 15 cm, 60 cm and 90 cm on: one transversal wall, one longitudinal wall and the
two faces (Face A and Face B) of the three vertical baffles with affixed waste plastic bottle
caps. The collected samples were appropriately stored and analysed for: dry weight of
biofilm, Total Suspended Solids (TSS), Algal biomass (Chlorophyll-A), zooplankton and
microbial diversity. The sampling positions were as described in Chapter 4 (Figure 4.1).
Dry weight
The biofilm samples were dried at 105 oC for 1.5 h to determine the dry weight as TSS
(APHA, 2012).
TSS
The TSS was determined by filtration of the water column samples through pre-weighed 0.45 μm Whatman Glass Microfiber Filter (GFC) as described in APHA (2012).
Algal biomass
Chlorophyll-A, as an indicator of algal biomass, was measured using the spectrophotometric
method described in APHA (2012). It consisted of a sequential procedure of filtration,
centrifugation and extraction of the chlorophyll by using an organic solvent (90 % acetone).
The extracted chlorophyll was then analysed by a spectrophotometer Hach Lange DR 5000
at the light absorption wavelengths of 750 nm and 665 nm, to be expressed in units of mg/L.
Zooplankton
For the study of zooplankton, two types of assessment were carried out: qualitative and
quantitative. The first established species richness and diversity, while the second
highlighted their distributional densities (Oueda et al., 2007). Water samples were stored in
bottles of 250 ml, preserved with 2% formaldehyde. However, for the scraped biofilm
samples, 250 ml of distilled water were added to dilute the samples and were also
preserved with 2% formaldehyde. The samples were transferred to the Laboratory of
Biology and Animal Ecology (LBEA) of the University of Ouagadougou (Burkina Faso) for

Optimisation of two-stage high-rate anaerobic reactors coupled with baffled pond and wet-dry sand filters for
domestic wastewater treatment in a warm-dry climate (Ouagadougou, Burkina Faso)
PhD Thesis report Moumouni Diafarou Ali Page 87
analysis of zooplankton. In the laboratory, the samples were washed over a 100 µm sieve
(plankton net) to remove the fixative. Sub-samples of 0.5 ml were taken from well agitated
samples to ensure a homogeneous distribution of organisms. The sub-samples were put on
a counting chamber and examined under a microscope at both X100 magnification for
taxonomic analysis and X40 magnification for counts to determine species composition and
abundance, respectively. In order to optimize the quality of the results, the identification
and counting procedures were repeated four times for each sample. Identifications were
conducted to the lowest possible taxon using published keys and figures (Sars, 1895; Koste
and Voigt, 1978; Pontin, 1978; Dussart, 1980; Pourriot, 1980; Rey and Saint-Jean, 1980;
Notenboom-Ram, 1981; Amoros, 1984; Koȓinek, 1999; Hamaidi et al., 2008; Oueda, 2009).
Microbial community
The spread plate method was used to determine the abundance of microbial colonies in the
water and biofilm samples, cultured on Blood agar, nutrient agar, MacConkey agar and
Sabouraud agar to evaluate different types of microbes (Table 5.1; APHA, 2012).
Table 5.1: Summary of the methods for the four microbial colonies
Types of Microbes Incubation
temperature (oC)
Incubation
duration
Culture medium
Fastidious bacteria 37 24 to 48 hours Blood agar
Non-fastidious
bacteria
37 24 hours Nutrient agar
Enterobacteria 37 24 to 48 hours MacConkey agar
Fungi: Yeasts and
Molds
26 5 to 7 days Sabouraud Agar
Physical and chemical parameters
The pH, water temperature (T) and dissolved oxygen (DO) were measured in situ with an
integrated portable pH-T-DO meter (WTW 340i/SET) fixed to a cylindrical iron rod carefully
graduated (Section 4.2.2). This device was previously calibrated using standard buffer
solutions before any usage. The measurements were carried out between 8:00 am to 9:00
a.m., at depths of 15 cm, 60 cm and 90 cm, in each compartment (A, B, C and D) of the
Baffled Pond, before it was drained.
Statistical analysis
Two multivariate statistical technique, called Principal Components Analysis (PCA) and
Canonical Correspondence Analysis (CCA), were applied using the XLSTAT 7.5.2 and the
Paleontological Statistics Software Package for Education and Data Analysis (PAST 3.04), in
order to appreciate the interactions between biotic and abiotic components of the Baffled
Pond. The data were normalized before doing this CCA by dividing each variable by its own
greatest value, such that all the data only ranged up to one.

Optimisation of two-stage high-rate anaerobic reactors coupled with baffled pond and wet-dry sand filters for
domestic wastewater treatment in a warm-dry climate (Ouagadougou, Burkina Faso)
PhD Thesis report Moumouni Diafarou Ali Page 88
Sludge accumulation in the Baffled Pond
The 'White Towel Technique' was used to assess the sludge that had accumulated in the
Baffled Pond after two years of continuous operation. The method consisted of wrapping a
white towel around the bottom of a cylindrical iron rod attached with a graduated tape. The
depth of the sludge was measured by lowering the rod vertically into the pond until it
reaches the bottom; it is then slowly withdrawn to read the depth of sludge left on the
towelling material (Llyod & Vorkas, 1999; Mara, 2004; Konate et al., 2013). The Baffled Pond
was divided into bathymetric sections of 7 cm2 and a total of 40 locations were measured
for sludge thicknesses.
5.3 Results and Discussion
The results of this study are presented mainly via bar diagrams, in order to easily compare
the biofilm distribution on both the attached media and in the bulk water. The density and
types of zooplankton are also shown in tabular form. The wastewater arrives at the Baffled
Pond with one set of organisms and leaves with an almost entirely different one. In
particular, E. coli, an indicator of faecal bacteria, is abundant in the influent wastewater, but
is reduced to undetectable levels at least 15 cm before the water leaves the pond.
5.3.1 Biomass on attached media and in the water column
Biofilm biomass on attached media
There was great variation in the dry weight densities of biofilm on plastic baffles, plastic
bottle caps and cement walls, after 2 years of operation of the Baffled Pond (Figure 5.1).
Thick, dense biofilm occurred in the upper sections, above a depth of 60 cm, on all of the
attached media, and then decreased toward the bottom, except for the case of the plastic
bottle caps. The densest biofilms, of up to 370 g/m2 were recorded at a depth of 15 cm, on
the baffle plates of Face B (counter current), on both Baffles 2 and 3. This is consistent with
the findings of Babu (2011), in which the variation in dry weights could have been caused by
biofilm components including algae, heterotrophs bacteria, midge larvae and detritus, as
well as depending on the aerobic and anaerobic conditions. This variation could also be due
to the preferential behaviour of microorganisms to attach to hydrophobic, non-polar
surfaces, such as plastic (Pringle and Fletcher, 1983). Another reason for thick, dense
biofilms to form on the upper structures may be the high content of algae in the biofilm
(Figure 5.3). On the other hand, the thick, dense biofilms in the lower plastic caps could be
related to the greater contribution of detritus, since their cylindrical holes retain such
sediments. The introduction of baffles with affixed bottles caps has allowed producing 1.5
kg of dry weight biofilm in the Baffled pond of 15.79 m2 attached surface area.
Biofilms were thicker on the counter-current faces (Figure 5.1), possibly due to their greater
protection against the shear forces induced by the water flow, which could otherwise make
the biofilm slough off of the substrate (van der Wende and Characklis, 1990).

Optimisation of two-stage high-rate anaerobic reactors coupled with baffled pond and wet-dry sand filters for
domestic wastewater treatment in a warm-dry climate (Ouagadougou, Burkina Faso)
PhD Thesis report Moumouni Diafarou Ali Page 89
Figure 5.1: Biofilm dry weight densities on baffles, bottle caps and walls at depths of 15 cm,
60 cm and 90 cm after 2 years of operation of in the Baffled Pond
TSS in the water column
There was also great variation in the amount of suspended solids at different depths, in the
four compartments of the Baffled Pond (Figure 5.2). High concentrations were observed in
the top layers, at a depth of at 15 cm, in all compartments, with a maximum of 35 mg/l,
which gradually decreased toward the bottom. These high levels of TSS in the top layers of
the water column may be due to the abundance of algae (Figure 5.3) and other planktonic
microorganisms, since algal photosynthesis mainly occurred in the top layers, where
sunlight and carbon dioxide are available (Maiga et al., 2009). Nonetheless, these TSS
concentrations were lower than those reported in the literature (Oliveira and von Sperling,
2011). The results are consistent with Shin and Polprasert (1987), who explain that attached
biofilms could adsorb some of the dispersed planktonic microorganisms and other particles,
thus reducing TSS concentrations. A total of 0.04 kg of TSS was found in the water column of
the Baffled Pond of 3.2 m3 wastewater volume.
When comparing the TSS in the water column with the attached biofilm, it was evident that
more biomass was found on the substrates (1.5 kg of attached biomass) than was dispersed
in the water (0.04 kg of biomass in the water column) (Figures 5.1, 5.2). The biomass
attached on the media constituted 35.5 times of that in the water column. Therefore, the
baffles enhanced the growth of attached biomass, increasing the biomass volume in the
pond and consequently leading to better removal of organics and nutrients (Shin and
Polprasert, 1987).
0
100
200
300
400
500
600
Fa
ce
A -
ba
ffle
Fa
ce
B -
ba
ffle
Fa
ce
A -
Ca
p
Fa
ce
B -
Ca
p
Fa
ce
A -
ba
ffle
Fa
ce
B -
ba
ffle
Fa
ce
A -
Ca
p
Fa
ce
B -
Ca
p
Fa
ce
A -
ba
ffle
Fa
ce
B -
ba
ffle
Fa
ce
A -
Ca
p
Fa
ce
B -
Ca
p
Tra
nsve
rsa
l
Lon
gitu
din
al
Baffle 1 Baffle 2 Baffle 3 Walls
Dry
we
igh
t g
/m2
15 cm
60 cm
90 Cm

Optimisation of two-stage high-rate anaerobic reactors coupled with baffled pond and wet-dry sand filters for
domestic wastewater treatment in a warm-dry climate (Ouagadougou, Burkina Faso)
PhD Thesis report Moumouni Diafarou Ali Page 90
Figure 5.2: TSS distribution pattern at the depths of 15 cm, 60 cm and 90 cm, in the four
compartments of the Baffled Pond
Attached and dispersed algal biomass
Chlorophyll-A, which is an indicator of algal biomass was most concentrated on Baffle 2
(Figure 5.3). It was also fairly abundant on the entire length of each baffle. This implied that
more algal activity occurred in the central region of the pond. The abundance of algae at the
bottom of the baffles was consistent with the findings of Barranguet et al. (2005), who
reported that when algal-bacterial biofilm develop under low light, the proportion of
heterotrophic bacteria to algae increases.
On the other hand, the algal biomass in the water column, increased toward the outlet,
reaching a maximum concentration of 12 mg/l in the upper layers down to a depth of 60
cm. Concentrations were considerably lower in the deeper layers, with values as low as 1
mg/l (Figure 5.3b). The low concentration of Chlorophyll-A in the lower layers may be due to
the fact that sunlight did not reach so deep (Maiga et al., 2009).
By comparing the results between attached and dispersed algal biomass (Figure 5.3), it
becomes evident that the attached algal biomass is more important than that in the water
column. Shin and Polprasert (1987) and Babu (2011) also found that the addition of artificial
media in ponds increased the growth of algae and thus enhanced the removal of organics
and nutrients. Moreover, these results are in line with the findings of Characklis et al.,
(1990), who explained that microbial colonization appears to increase as the surface
roughness increases. As a result, the introduction of the baffles with roughened surfaces in
the polishing pond seems to be an excellent way to encourage the growth of an ample
biofilm in such ponds.
0
10
20
30
40
50
60
A B C D
TS
S m
g/l
compartments
TSS: Water column
15 cm
60 cm
90 cm

Optimisation of two-stage high-rate anaerobic reactors coupled with baffled pond and wet-dry sand filters for
domestic wastewater treatment in a warm-dry climate (Ouagadougou, Burkina Faso)
PhD Thesis report Moumouni Diafarou Ali Page 91
Figure 5.3: Chlorophyll-A distribution pattern at depths of 15 cm, 60 cm and 90 cm (a) on
baffles and (b) in the water column of the four compartments of the Baffled Pond
Distribution bacterial colonies in the water column
There was considerable variation in the distributions of fastidious bacteria, non-fastidious
bacteria and enterobacteria throughout the pond (Figure 5.4). Concentrations diminished
with depth and also varied from one compartment to another, with the only exception of
fastidious bacteria in Compartment A. This means that fastidious bacteria which include
presumably the most pathogenic bacteria are getting wiped out quickly in the pond. These
distributions are similar to those of TSS (Figure 5.2) in the water column. Furthermore, there
was a strong linear correlation between non-fastidious bacteria and TSS a (correlation
coefficient R2= 0.979), and this can also be seen in the graph of the Canonical
Correspondence Analysis (Figure 5.9). This phenomenon appears to be related firstly, to the
adsorption and/or the attachment of bacteria to suspended solids and, secondly, to the
symbiotic algal-bacterial activity in the course of organic matter degradation in the upper
layers, due to the fast adaption of the non-fastidious bacteria.
The high concentration of the fastidious bacteria in the top layer (15 cm) of the first
compartment (A) could be explained by their complex nutritional requirements, since they
only grow when specific nutrients are included in their diet. Therefore, the inlet point seems
to contain the specific nutrients necessary for their growth (Figure 5.4).
0
10
20
30
40
50
60
70
80
90
100
Baffle 1 Baffle 2 Baffle 3
Chlo
rophyl
l-A
mg/l
Chlorophyll-A: baffles
15 cm
60 cm
90 cm
(a)
0102030405060708090
100
A B C D
Compartment
Ch
loro
ph
yll-
A m
g/l
Chlorophyll-A: water column
15 cm
60 cm
90 Cm
(b)

Optimisation of two-stage high-rate anaerobic reactors coupled with baffled pond and wet-dry sand filters for
domestic wastewater treatment in a warm-dry climate (Ouagadougou, Burkina Faso)
PhD Thesis report Moumouni Diafarou Ali Page 92
Figure 5.4: Distributions of three categories of bacteria at depths of 15 cm, 60 cm and 90 cm
in the water columns of the four compartments of the Baffled Pond
Distribution of fungi on baffles and in the water columns
The concentrations of yeasts and moulds on the structures inside the pond increased with
depth and toward the outlet (Figure 5.5). On the other hand, these fungi were almost
absent in the water columns throughout the pond, with only very low concentrations being
observed in the bottom layers of Compartments A and D. This indicates that fungi prefer to
grow on hard surfaces rather than being dispersed in the water. Moreover, there are
reports indicating that the presence of fungi has two contradictory advantages in the
treatment of wastewater. In the first place, fungi have the capacity to survive in acidic
environments and with little nitrogen content, which makes them important for improving
biological wastewater treatment processes, whereas, in the second place, certain
filamentous fungi can deteriorate the sludge settleability (bulking the sludge), therefore
reducing the efficiency of the treatment process (Metcalf and Eddy, 1991; von Sperling and
Chernicharo, 2005, Henze et al., 2008). It is important to point out that this latter adverse
effect was not the case in this study, since the fungi were attached to the baffles and may
have contributed to the improved treatment performance that was achieved. In addition,
unlike algae, fungi can assimilate dissolved carbon dioxide in the water phase, and they are
also known to contribute to the removal of organic waste contained in sewage (Brading et
al., 1995). For these reasons, the introduction of baffles with roughened surfaces may have
increased the growth of fungi in the pond, which may have played an important role in
improving the treatment performance of the system.
0,E+00
2,E+07
4,E+07
6,E+07
8,E+07
1,E+08
1,E+08
1,E+08
2,E+08
2,E+08
2,E+08
A B C D A B C D A B C D
Compartment Compartment Compartment
org
. /1
00
ml
15 cm
60 cm
90 Cm
Fastidious Non-Fastidious Enterobacteria

Optimisation of two-stage high-rate anaerobic reactors coupled with baffled pond and wet-dry sand filters for
domestic wastewater treatment in a warm-dry climate (Ouagadougou, Burkina Faso)
PhD Thesis report Moumouni Diafarou Ali Page 93
Figure 5.5: Distribution of fungi at depths of 15 cm, 60 cm and 90 cm (1) in the water
columns of the four compartments and (2) on the baffles of the Baffled Pond.
5.3.2 Zooplankton in the Baffled Pond
A total of 19 zooplankton taxa were identified (Table 5.2). These planktonic organisms
belong to 5 families of crustaceans (Daphnidae, Moinidae, Sididae, Cyclopidae,
Diaptomidae) and 4 families of rotifers (Brachionidaes, Testudinellidae, Asplanchnidae,
Lecanidae). The rotifers, copepods, cladocerans and ostracods were the most abundant
members of this aquatic fauna (Figure 5.6). It is important to point out that copepod larvae
cannot be identified to species; therefore they were counted separately from adults. In
terms of biodiversity and species richness, rotifers were dominant, with 14 species
identified and at least one species in most of the samples, followed by the cladocerans (with
4 species) and finally the copepods (with 4 species and a high density of Nauplii and
Copepodites; Table 5.2, Figure 5.6). These results are similar to those reported by Oueda et
al., (2007) who found, in their study of the diversity, abundance and seasonal dynamics of
zooplankton community in a south Saharan reservoir of Burkina Faso, many abundant
species richness of zooplankton, despite various pressures on these water reservoirs.
The dominance of rotifers may be explained by the fact that they are very adaptable, even
to such a polluted environment (Hamaidi et al., 2008). Rotifers are microscopic organisms
common in fresh and brackish waters and are quantitatively dominant in zooplankton
communities in lakes and calm parts of rivers, partially due to their parthenogenetic
reproduction and rapid maturation. Many species of this group (e.g., Brachionus keratella)
are used in aquaculture farms for feeding juvenile fish (Oueda, 2009). Furthermore, rotifers
are known to be very efficient at consuming dispersed bacteria and small particles of
organic matter. In addition, according to Metcalf and Eddy (1991) their presence in the
effluent of a treatment system indicates an efficient biological purification process.
0,E+00
5,E+04
1,E+05
2,E+05
2,E+05
3,E+05
3,E+05
4,E+05
A B C D 1 2 3
Compartments Baffles
org
. / 100 m
l
Yeast & Moulds in the water column and on the baffles
15 cm
60 cm
90 Cm
(1) (2)

Optimisation of two-stage high-rate anaerobic reactors coupled with baffled pond and wet-dry sand filters for
domestic wastewater treatment in a warm-dry climate (Ouagadougou, Burkina Faso)
PhD Thesis report Moumouni Diafarou Ali Page 94
Table 5.2: Summary of the identified zooplankton species in the Baffled Pond
Class Sub-class Family Species
Crustaceans
Branchiopodes
Daphnidae Ceriodaphnia cornuta Sars, 1886 Sididae Diaphanosoma excisum Sars, 1885
Moinidae Moinodaphnia macleayi King, 1853
Moina micrura Kurz, 1874
Copepods
Diaptomidae Tropodiaptomus incognitus Dussart Gras1966
Cyclopidae Mesocyclops leuckarti Claus 1857 Nauplii spp Copepodites spp
Rotifers
Brachionidae
Brachionus falcatus (Ehrb., 1838) Brachionus caudatus (Barrois Daday, 1894) Brachionus angularis (Gosse, 1851) Brachionus quadridentatus (Hermann, 1783) Brachionus calyciflorus (Pallas, 1766) Epiphanes spp Keratella cochlearis (Gosse, 1851) Keratella tropica (Apstein, 1907)
Asplanchnidae
Asplanchna brightwelli (Gosse, 1850) Asplanchnopus multiceps (Schrank, 1783)
Lecanidae Lecane luna (Müller1776)
Testudinellidae Filinia longiseta (Ehrb., 1834) Filinia terminalis (Plate, 1886) Hexarthra spp
ostracods
Figure 5.6: Photographs of some of the species of the four main groups of zooplankton
found in the Baffled Pond
Copepodite, Nauplii and were the most constant and abundant zooplankton genera in the
Copepoda group, being found in all depths of all compartments (Table 5.3). Likewise, the
Diaphanosoma excisum and Moinodaphnia maleayi of the Cladocera group were also
ubiquitous. Their abundant and constant presence could be due their documented
Tropodiaptomus incognitus
Filinia longiseta Brachionus quadridentatus
Ceriodaphnia cornita Moina micrura
d) Ostracod (1 specie ) c) Rotifera (14 species)
b) Cladocera (4 species) a) Copepoda (2 species)
Nauplii
ostracod

Optimisation of two-stage high-rate anaerobic reactors coupled with baffled pond and wet-dry sand filters for
domestic wastewater treatment in a warm-dry climate (Ouagadougou, Burkina Faso)
PhD Thesis report Moumouni Diafarou Ali Page 95
preference to feed on a wide variety of phytoplankton, from unicellular picoplankton (e.g.,
Chlorella sp.) to larger phytoplankton (e.g., Coelastrum reticulatum coenobia), and to the
largest algae that are found in these conditions (e.g., Cyclotella sp, Scenedesmus opoliensis;
Pagano, 2008). Unlike the other two groups, the rotifers exhibited uneven distribution
patterns in the Baffled Pond and were more species-diverse than the other groups of
zooplankton. Babu (2011) found that copepods and rotifers compete for the palatable forms
of algae; therefore the abundance of copepods like Nauplii in the Baffled Pond was
disadvantageous for the rotifers. Furthermore, this dispersed nature of rotifers in the
Baffled Pond could be attributed to their preference to consume dispersed bacteria and
small particles of organic matter, detritus and algae in the water column (Starkweather,
1980).
Ostracods were found only in the bottom of the first compartment of the Baffled Pond
(Table 5.3). Their identification in this system may be of great importance to domestic
wastewater treatment, because they are able to ingest massive quantities of a wide variety
of food items within a few minutes and then survive starvation for several weeks (Vannier et
al., 1998). Ostracods eat living prey, such as polychaete worms, or dead animals, including
fishes and squid, which may explain why they were found at the bottom of the pond
(Vannier et al., 1998).
Zooplanktons were almost entirely absent from the surfaces of the baffles. This may be
explained by their nature of floating freely in the water column (van der Wende and
Characklis, 1990). However, some individuals of Nauplii, Copepodites, Brachionus
calyciflorus, Epiphanes, and Asplanchna brightwelli were encountered in some surface
samples, which may be due to the presence of algae there and they had gotten trapped
while grazing.
In summary, the abundant presence of zooplankton could play an important role in the
control of bacterial and algal populations in the Baffled Pond. More interestingly, if this
technology is combined with aquaculture, it would have great potential to contribute to the
alleviation of hunger in low-income neighborhoods of cities. For instance, Oueda, (2009)
found various species of fish, such as Brycinus nurse, Oreochromis niloticus, Tilapia zillii,
Synodontis membranaceus, and Clarias anguillaris in Sahelian lakes to consume different
sorts of aquatic insect larvae, terrestrial insects, phytoplankton and zooplankton. This can
be an attractive application of aquaculture in the Sahel.

Optimisation of two-stage high-rate anaerobic reactors coupled with baffled pond and wet-dry sand filters for
domestic wastewater treatment in a warm-dry climate (Ouagadougou, Burkina Faso)
PhD Thesis report Moumouni Diafarou Ali Page 96
Table 5.3: Zooplankton distribution pattern at depths of 15, 60 and 90 cm in the four
compartments of the Baffled Pond
Zooplankton
(org/ 100 ml)
Compartment
A B C D depth (cm)
15 60 90 15 60 90 15 60 90 15 60 90
Copepoda Tropodiaptomus incognitus (A)*
1000 1400 1800 1000 800 2600 600 1400 1400 400 1400 1600
Mesocyclops leuckarti (B) 600 1000 2000 2200 800 2400 400 1600 400 200 1400 1000
Nauplii spp (C) 1600 2000 2200 2000 1400 1200 1000 1600 1000 600 2000 1200
Copepodites spp (D) 1200 2400 1600 1600 600 1200 600 1800 1400 600 1800 1400
Cladocera (Branchiopodes)
Ceriodaphnia cornuta (E)
400 400
Diaphanosoma excisum (F) 600 1200 600 1400 600 1400 1600 1600 1000 1600 1800
Moinodaphnia maleayi (G) 400 1000 1000 800 1000 1400 1000 1200 200 400 1000
Moina micrura (H) 400 800 400 400
Rotifera
Filinia terminalis (I) 1000 2000 600 400 2800 200 600 1000 400 600 1000
Filinia longiseta (J)
400 2200 400 400 200 200 400 600
Keratella cochlearis (K) 200 400 400
Keratella tropica (L) 600 800 200
Brachionus falcatus (M) 600 400 400 200 600 600
1000 400 1000 1600
Brachionus caudatus (N) 400 1600 1800 1200
800 400 600 400 400 800
Brachionus quadridentatus (O) 200
600 400 800
Brachionus angularis (P) 800 1800 200
400 400
Brachionus calyciflorus (Q)
1400 2000 200 1400 800 1600 1600 1600
Epiphane spp (R) 200 200 600 400 600 800 800
Asplanchna brightwelli (S) 400 1200 2200 400 400 1400 400 600 800
1000
Asplanchnopus multiceps (T) 200 600 400 400
800
1000
Lecane luna (U) 400
Hexarthra spp (V) 400 1200 600 600 800 1200 400 1000 1400 400 1800 1800
Ostracoda
Ostracods (W) 400
*The letters in parentheses () represent these zooplankton species in the Principal Components Analysis (Section 5.3.3)
5.3.3 Interactions between biotic and abiotic aspects of the Baffled Pond
Principal Components Analysis (PCA) and Canonical Correspondence Analysis (CCA) were
used to visualise the correlations between biotic components including phytoplankton
(Algae); zooplankton (Table 5.3); bacteria (E. coli, fastidious bacteria (FB), non-fastidious
bacteria (NB) and enterobacteria (EB)); fungi and abiotic components comprising total
suspended solids (TSS), pH, temperature (Temp), electrical conductivity (Cond), and

Optimisation of two-stage high-rate anaerobic reactors coupled with baffled pond and wet-dry sand filters for
domestic wastewater treatment in a warm-dry climate (Ouagadougou, Burkina Faso)
PhD Thesis report Moumouni Diafarou Ali Page 97
dissolved oxygen (DO) at three depths in each of the four compartments of the Baffled
Pond.
Principal Components Analysis of the abundance of the zooplankton species
The plane formed by the axes F1 and F2 expresses 61.3% of the information (Table 5.4);
therefore, this factorial plane was used to describe the matrix of correlation of the 23
zooplankton species (Table 5.3) that were present at 12 points along the transit of
wastewater through the Baffled Pond.
Table 5.4: Eigenvalues and percentages of variance explained by Axes F1 and F2 of a
Principal Components Analysis of the zooplankton species abundances in the various sectors
of the Baffled Pond (Figure 5.7)
Axes Eigenvalues Percentage of variance explained (%)
Cumulative percentage (%)
F1 2.33 42.40 42.40 F2 1.04 18.92 61.32
From the scatterplot of the PCA Analysis, one can see that all of the zooplankton species
that were identified tended to increase along Axis F1 (Figure 5.7). Wastewater enters with
very few zooplankton and the species Brachionus angularis (P), Brachionus caudatus (N),
Asplanchna brightwelli (S) Filinia terminalis (I), and Mesocyclops leuckarti (B) increase
rapidly until the water reaches the bottom of the first compartment. Then, in the bottom of
Compartment B, Tropodiaptomus incognitus (A), Brachionus calyciflorus (Q), Diaphanosoma
excisum (F) and Filinia longiseta (J) are more common, while species P, N and S are less
common. Next, abundances decrease as the water goes back to the surface and at C15
reach levels very similar to the influent. As the water goes back down in Compartment C,
zooplankton become abundant again, but with fewer of species P, N and S (presumably
indicators of contaminated water) and more of Hexarthra spp. (V), Diaphanosoma excisum
(F) and Filinia longiseta (J) (potentially indicators of water that is less contaminated by
people). The zooplankton fauna under Baffle 3 is considerably less abundant than that
under Baffle 1, with a different composition of species. Then abundances diminish as the
water rises toward the outlet and leaves the pond with few zooplanktons (Figure 5.7).

Optimisation of two-stage high-rate anaerobic reactors coupled with baffled pond and wet-dry sand filters for
domestic wastewater treatment in a warm-dry climate (Ouagadougou, Burkina Faso)
PhD Thesis report Moumouni Diafarou Ali Page 98
Figure 5.7: Scatterplot of a Principal Components Analysis of the abundance of 23 zooplankton species present at 12 points along the transit of wastewater through the Baffled Pond.
Note: Green lines show the direction and importance of the influence of each species (lettered in their order in Table 5.3). Blue arrows show the trajectory of the wastewater, with deeper tones for deeper waters.
Correlation between the amount of algae and of fungi developed on Baffles
The abundances of the algae and fungi that grew on different parts of the baffles in the
Baffled Pond, as described in Section 5.3.1, varied greatly. There is a strong correlation
between the amount of algae and the amount of fungi, but with one distinct exception
(Figure 5.8). The sample at the depth of 90 cm on Baffle 3 (c90) had inordinately more fungi
than the other samples and was exactly adjacent to the great rise in fungi at the same depth
in Compartment D (D90) in the water column. It is also worth noting that the highest
concentrations of algae occurred in the upper two samples of the middle baffle. Possibly
something inhibited them on the first baffle and there was a lack of nutrients when the
water got to the third baffle.
Axis F1
Ax
is F
2

Optimisation of two-stage high-rate anaerobic reactors coupled with baffled pond and wet-dry sand filters for
domestic wastewater treatment in a warm-dry climate (Ouagadougou, Burkina Faso)
PhD Thesis report Moumouni Diafarou Ali Page 99
Figure 5. 8: Scatterplot of the abundances of algae and fungi on different parts of the baffles
in the Baffled Pond.
Note: The three baffles are lettered (a, b, c) according to the compartment that precedes
them and the numbers refer to the depth in centimetres within the water.
Canonical Correspondence Analysis of Physical-chemical Factors and Microbes
The plane formed by the axes F1 and F2 expresses 93% of the variance in the data (Table
5.5); therefore, this factorial plane was used to describe the matrix of correlations among
different types of microbes and various environmental factors across the different sectors of
the pond (Figure 5.9)
Table 5.5: Eigenvalues of Axes F1 and F2, together with the percentages of the variance that they explain in a
Canonical Correspondence Analysis of different types of microbes and physical and chemical factors in the
various sectors of the Baffled Pond (Figure 5.9)
Axes Eigenvalues Percent of variance explained (%)
Cumulative percentage (%)
F1 0.35 67.8 67.8 F2 0.13 25.2 93.0
According to this multivariate ordination, the wastewater arrives with high numbers of
fastidious bacteria and with a moderate amount of E. coli and these increase toward the
bottom of each compartment, but are largely replaced by non-fastidious bacteria each time
the water travels upward (Figure 5.9). In addition, it should be noted that the points
Algae on Baffles
Fun
gi o
n B
aff
les
mg/L
Org. / 100 ml

Optimisation of two-stage high-rate anaerobic reactors coupled with baffled pond and wet-dry sand filters for
domestic wastewater treatment in a warm-dry climate (Ouagadougou, Burkina Faso)
PhD Thesis report Moumouni Diafarou Ali Page 100
representing Compartment B are in a straight line roughly parallel to the E. coli/NB + EB axis
and this trend continued straight as the water flowed over the central baffle to C15, where
the trend reversed as the water went down Compartment C with a slightly less straight line .
By the time the water leaves the pond, the E. coli have been eliminated entirely (Figure 4.2),
thus lending strong support for the effectiveness of this treatment.
The main deviation from this pattern is that in two separate points (A60, D90) the
abundance of fungi increased greatly and potentially predominated over the bacterial
processes mentioned above, under conditions of greater electrical conductivity and lower
temperatures. The first of these occurred half-way down the first compartment (A), but
upon reaching the bottom, fungi were eliminated entirely and E. coli was at its maximum
(Figure 5.9). The second surge of fungi was at the bottom of the last column (with maximal
electrical conductivity), immediately before the water rose to the outlet without any E. coli.
So fungi may have played an important role in sanitizing the wastewater and potentially one
could investigate ways to encourage the growth of fungi in these ponds.
One would expect the suspended solids to diminish during the transit through the pond, but
the opposite is shown by this ordination to be the case, potentially with more solids being
generated by the algae (Figure 5.9). The ordination implies and the data confirm that the
water at the outlet had the highest values for dissolved oxygen, but also pH, suspended
solids, algae, and non-fastidious bacteria, so this water has been sanitized in terms of E. coli
and presumably pathogenic organisms, but it is still far from being clean water. It contains
abundant nutrients, solids and microorganisms, so it should best not be released into rivers
or bays, but instead used productively in aquaculture or agriculture.
Dissolved oxygen and pH showed almost exactly the same trends, so they seem to be
represented by the same orange line. Also note that the adjacent points A90 and B90 had
such similar conditions, at the bottom, below the first baffle, that they occupied nearly
identical spots on Figure 5.9.

Optimisation of two-stage high-rate anaerobic reactors coupled with baffled pond and wet-dry sand filters for
domestic wastewater treatment in a warm-dry climate (Ouagadougou, Burkina Faso)
PhD Thesis report Moumouni Diafarou Ali Page 101
Figure 5.9: Scatterplot of a Canonical Correspondence Analysis of the abundance of algae, fungi, and four
categories of bacteria (E. coli, FB- fastidious bacteria, NB- non-fastidious bacteria, and EB-enterobacteria) present at 12 points in the water column along the transit of wastewater through the Baffled Pond, also taking into account five environmental variables: total suspended solids (TSS), pH, temperature (Temp), electrical conductivity (Cond), and dissolved oxygen (DO).
Note: Orange lines show the direction and importance of the environmental variables. Green lines do the same for each of the six types of microbes. Blue arrows show the trajectory of the wastewater, with deeper tones for deeper waters.
Principal Components Analysis of Physical-chemical Factors, Microbes and
zooplankton
The plane formed by the axes F1 and F2 expresses 100 % of the information (Table 5.6);
therefore, this factorial plane was used to describe the matrix of correlation among the
physical-chemical factors, microbes and zooplankton. This separated the variables into three
groups (Figure 5.10).
Table 5.6: Eigenvalues of Axes F1 and F2, together with the percentages of the variance that they explain in a
Principal Components Analysis of different types of microbes, zooplankton , and physical and chemical factors
in the various sectors of the Baffled Pond (Figure 5.10)
Axes Eigenvalues Percent of variance explained (%)
Cumulative percentage (%)
F1 25.85 92.34 92.34 F2 2.15 7.66 100.00
Indeed, the F1 axis clearly highlighted two opposite groups (1 and 2), whereas the F2 axis
isolated zooplankton species in the compartment B in positive values (Group 3; Figure
5.10a). The first group which is positively correlated with F1 axis includes biotic components
Axis F1
Axi
s F2

Optimisation of two-stage high-rate anaerobic reactors coupled with baffled pond and wet-dry sand filters for
domestic wastewater treatment in a warm-dry climate (Ouagadougou, Burkina Faso)
PhD Thesis report Moumouni Diafarou Ali Page 102
(bacteria, algae) and all monitored abiotic parameters. For the case of the second group
which is negatively correlated with F1 axis comprised only zooplankton in Compartments A,
C, D. Coupling this analysis with respect to the sampling depths in the factorial plan (Figure
5.10b), biotic components in Group 1 colonized better the top layers, while biotic
components in Group 2 preferred the deeper layers. Thus, in the scale of this Baffled Pond,
bacteria and algae were shown to be pelagic species and that of zooplankton in Group 2 as
benthic.
Furthermore, PCA results clearly showed the good correlation among the bacteria, algae,
TSS and the resulting pH and dissolved oxygen in the top layers of all compartments of the
Baffled Pond. This implies a positive relationship, where an increase of one group leads to
the proliferation of the other group. Therefore, the PCA analysis has proven once more
evidence of the symbiotic algal-bacterial activity and abiotic parameters such as pH,
dissolved oxygen and temperature interdependences in the course of organic matter
degradation in the top layer of the Baffled Pond. In addition, the very strong negative
correlation between Group 1 and Group 2, confirms the predation relationship of the
zooplankton at one side and the bacteria and algae on the other hand. This indicates that
any increase of zooplankton would lead systematically to the decrease of bacteria and
algae. Zooplankton dynamics was seen to depend on factors such as temperature and pH, as
has been found in other studies (Pourriot and Champ, 1982; Oueda et al., 2007).
Although, zooplankton in Compartment B had a positive correlation with F2 axis, this result
may be explained by the fact that the water flowed upward. However, this trend was not
observed in Compartment D which has similar flow pattern. Further study can be conducted
to clarify this issue.

Optimisation of two-stage high-rate anaerobic reactors coupled with baffled pond and wet-dry sand filters for
domestic wastewater treatment in a warm-dry climate (Ouagadougou, Burkina Faso)
PhD Thesis report Moumouni Diafarou Ali Page 103
Figure 5.10: Correlation scatterplot of the PCA analysis of the Baffled Pond showing: (a) the
grouping of components and (b) the sampling depths position in the factorial plan Note: Group 1: A_Bact, B_Bact, C_Bact, D_Bact: Fastidious, non-fastidious and enterobacteria bacteria in compartment A,
B, C, and D respectively and at depth 15, 60 and 90 cm (P15, P60and P90 respectively); A_Algae, B_Algae, C_Algae, D_Algae;
A_TSS, B_ TSS, C_ TSS, D_ TSS; A_pH, B_pH, C_pH, D_pH; A_DO, B_DO, C_DO, D_DO; and A_T, B_T, C_T, D_T: Algae; Total
suspended solids; pH, dissolved oxygen; and temperature respectively in the four compartments (A, B, C, D) at depth 15,
60 and 90 cm
Group 2: A_zoo, C_zoo, D_zoo: all identified zooplankton (Table 5.3) in compartment A, C, and D respectively and at depth 15, 60 and 90 cm Group 3: B_zoo: all identified zooplankton (Table 5.3) in compartment B and at depth 15, 60 and 90 cm
A_Bact
B_Bact
C_Bact
D_Bact
A_Zoo
B_Zoo
C_Zoo
D_Zoo
A_TSS
B_TSS
C_TSS
D_TSS
A_Algae
B_Algae
C_Algae
D_Algae
A_pH B_pH
C_pH
D_pH
A_DO
B_DO C_DO
D_DO
A_T
B_T
C_T D_T
-1
-0,5
0
0,5
1
-1 -0,5 0 0,5 1
-- a
xis
F2 (
7.6
6 %
) --
>
-- axis F1 (92.34 %) -->
Variables (axes F1 and F2: 100.00 %)
Group 1
Group 2
Group 3
(a)
P15
P60
P90
-8
-6
-4
-2
0
2
4
6
8
-8 -6 -4 -2 0 2 4 6 8
-- a
xis
F2 (
7.66
%)
-->
-- axis F1 (92.34 %) -->
Sampling depths (axes F1 and F2: 100.00 %)
(b)
Optimisation of two-stage high-rate anaerobic reactors coupled with baffled pond and wet-dry sand filters for
domestic wastewater treatment in a warm-dry climate (Ouagadougou, Burkina Faso)
PhD Thesis report Moumouni Diafarou Ali Page 104
5.3.4 Sludge accumulation rates in the Baffled Pond
After two years of operation, the distribution of sludge was very uneven with thickness
varying from 3 to 7 cm (Figure 5.11). In addition, the maximum sludge thickness was found
to occur near the inlet, outlet and around Baffle 2 in the middle (Figure 5.11). This
distribution pattern is consistent with the findings of several authors in similar and different
climatic conditions (Cavalcanti and Van Haandel, 2001; Picot et al., 2005; Keffala et al., 2011;
Konate et al. 2010, 2013). Indeed, many factors have been reported to influence the sludge
distribution in ponds, including: pond geometry, wind effect, pond age, sedimentation of
dead biomass (algae), and rainwater infiltration (Cavalcanti and Van Haandel, 2001; Nelson
et al., 2004; Picot et al., 2005; Keffala et al., 2011). Furthermore, the accumulation rate was
not reported to be constant and it decreases with time due to anaerobic degradation and
consolidation of sludge. For example, Hammou et al., (1992) reported an accumulation rate
of 4.3 cm/year in a primary pond in Meze (France) after 8 years of operation and Picot et al.,
(2005) found 2.7 cm/year after 14 years of operation of the same pond.
Figure 5.11: Sludge distribution pattern in the Baffled Pond after 2 years of operation
For a population equivalent of 50 PE, after two years of operation, the rate of sludge
accumulation in the Baffled Pond was estimated to be 0.0014 m3 per capita per year, which
represented 4 % of the total volume of the pond (Table 5.7). It is generally assumed that
ponds should be desludged when they are 30% full. If the current accumulation rate
remains stable, the Baffled Pond would require desludging every 15 years. This coincides
with the recommendation in France for the desludging interval of primary facultative ponds
(Picot et al., 2005).

Optimisation of two-stage high-rate anaerobic reactors coupled with baffled pond and wet-dry sand filters for
domestic wastewater treatment in a warm-dry climate (Ouagadougou, Burkina Faso)
PhD Thesis report Moumouni Diafarou Ali Page 105
Table 5.7: Sludge accumulation rate in the Baffled Pond
Parameter Baffled Pond
Compartment A Compartment B Compartment C Compartment D Total
Sludge volume m
3 in
2 years
0.022 0.041 0.049 0.030 0.142
Sludge volume m
3
per year
0.011 0.021 0.024 0.015 0.071
Sludge volume m
3
per capita per year*
0.0002 0.0004 0.0005 0.0003 0.0014
*For a population equivalent of 50 persons
The sludge accumulation rate was very low compared to the values reported in the
literature (Table 5.8; Gomes de Souza, 1987; Mara and Pearson, 1998; Nelson et al., 2004;
Konate et al., 2010). This low accumulation rate of sludge in the Baffled Pond under a
Sahelian climate may be due to the constant mesophilic conditions that favour active sludge
digestion, and also due to the fact that the Baffled Pond is preceded by two-stage high-rate
anaerobic reactors, where most of the sludge is removed. Therefore, combining two-stage
high-rate anaerobic reactors with a baffled pond seem to provide an excellent alternative to
minimize sludge handing, and thus reduce the cost of operation and maintenance.
Table 5.8: Sludge accumulation rates in various waste stabilization ponds
Parameter
Time of operation
Capacity
Volume of sludge accumulated
Sludge accumulation rate Reference
(years) (person equivalent, PE)
(m3)
(cm/year) (m
3/PE/year) (kg_TSS/PE/year) -
Baffled pond with attached growth at 2iE in Burkina Faso
2
50
0.141
-
0.0014
0.28
Current study
Maturation Pond in WSP at 2iE in Burkina Faso
5.5
448
15.5
1.3
0.007
0.26
Konate et al., 2013
Maturation pond in WSP at Tunis
8
282
121.79
1.6
0.029
-
Keffela et al., 2011
19 WSP in the south of France
12 to 24 120 to 10000
1 to 2.7 0.04-0.148 Picot et al., 2005

Optimisation of two-stage high-rate anaerobic reactors coupled with baffled pond and wet-dry sand filters for
domestic wastewater treatment in a warm-dry climate (Ouagadougou, Burkina Faso)
PhD Thesis report Moumouni Diafarou Ali Page 106
5.4 Conclusions
A great diversity and density of algae, bacteria, fungi and zooplankton were found to be
living in the water column and on the attached media of the Baffled Pond, after two years of
operation, and many of these certainly contributed to wastewater treatment. Thick, green
biofilms formed on the upper parts of the both sides of each baffle (both on the plastic that
forms the baffles and the plastic bottle caps affixed to it), reaching 370 g/m2 and decreasing
with depth to a minimum of 0.1 g/m2. The Baffled Pond had both aerobic and anaerobic
zones and may be considered as facultative pond. Three major groups of diverse
zooplankton were found in the water column: Cladocera, Copepoda and Rotifera. This last
group was dominant with 14 identified species, which consume a wide spectrum of natural
food items, including bacteria and algae. The various types of microbes that were tested for
varied greatly in their abundances in the different sectors of the water column of the Baffled
Pond, especially the non-fastidious bacteria that increased near the surface (in each
compartment) as the water approached the outlet. Indeed, strong correlations between
certain types of the bacteria and suspended solids seem to correspond to the adsorption
phenomenon of bacteria in suspended matter that is known to occur. The PCA and CCA
analysis showed more evidence of the symbiotic algal-bacterial activity and the importance
of abiotic parameters such as pH, dissolved oxygen and temperature in the degradation of
organic matter. In addition, the very strong negative correlation between Group 1 and
Group 2, confirms the predation relationship of the zooplankton at one side and the
bacteria and algae on the other hand. As a result, the parasitic symbiosis distributions of
phytoplankton and zooplankton have shown that the baffles had an effect on water quality
which in turn has affected the ecology of the baffled pond.
The dense and abundant zooplankton community may play an important role in the control
of bacterial and algal populations in the Baffled Pond. These same microscopic animals may
serve as food for fish in aquaculture at the end of the wastewater treatment.
There was a very low rate of sludge accumulation in the Baffled Pond of only 0.0014 m3 per
capita per year, which indicates that sludge handing would be minimized and could be done
at low cost taking into account the financial constraints prevailing in sub-Saharan Africa. The
use of the Baffled Pond effluent to produce fish and vegetables in aquaculture, followed by
irrigation of urban agriculture, would be an attractive area of research, to contribute to the
alleviation of hunger in low-income neighborhoods.

Optimisation of two-stage high-rate anaerobic reactors coupled with baffled pond and wet-dry sand filters for
domestic wastewater treatment in a warm-dry climate (Ouagadougou, Burkina Faso)
PhD Thesis report Moumouni Diafarou Ali Page 107
5.5 References
[1] Amoros C. (1984). Introduction pratique à la systématique des organismes des eaux continentales
Françaises. Les crustacées Cladocères. Extrait du bulletin mensuel de la société Linnéenne de Lyon 53è
année n°3 et 4 ; 72-144
[2] APHA (2012). Standard Methods for the Examination of Water and Wastewater. 22sd
edition. American
Public Health Association/American Water Works Association/Water Environment Federation;
American, Washington DC, USA.
[3] Barranguet C., Veuger B., Beusekom S. A. M., Marvan P., Sinke J. J., Admiral W. (2005). Divergent
composition of algal-bacterial biofilms developing under various external factors. Eur. J. Phycol. 40, 1-8
[4] Brading G. M., Jass J., and Lappin-Scott M. H. (1995). Dynamics of bacterial biofilm formation, in Microbial biofilms books; Plant and microbial biotechnology research series 5. Edited Lappin-Scott M. H. and Costuton W. J. and published by the press Syndicate of the University of Cambridge U.k.
[5] Bendinger B., Rijnaarts H. H. M., Altendorf K., Zehnder A. J. B. (1993). Physicochemical cell surface and adhesive properties of coryneform bacteria related to the presence and chain length of mycolic acids. Appl. Environ. Microbiol.; 59:3973–77.
[6] Bitton G. (2005). Wastewater microbiology, the third edition, published by John Wiley & Sons, Inc., Hoboken, New Jersey
[7] Cavalcanti P. and Van Haandel A. (2001). Polishing ponds for post-treatment of digested wastewater, part 1: flow-through ponds. Water Sci. Technol., 44, 237-245.
[8] Characklis W. G., McFeters G. A., Marshall K. C. (1990). Physiological ecology in biofilm systems. In: Characklis W. G, Marshall KC, editors. Biofilms. New York: John Wiley & Sons; p. 341–94.
[9] Donlan R. M. (2002). Biofilms: Microbial Life on Surfaces. Emerging Infectious Diseases; 8 (9):881-890 [10] Dussart B. H., (1980). Copépodes. In: Flore et faune aquatiques de l’Afrique sahélo soudanienne Tome1.
J.R.Durand et C. Lévêque, Edit. ORSTOM, pp.333-356. [11] Esterl S., Hartmann C. and Delgado A. (2003). On the influence of fluid flow in a packed-bed biofilm
reactor. In: Biofilms in Wastewater Treatment, An interdisciplinary Approach, Bishop P., Wuertz S., and Wilderer P. (Ed). IWA publishing House. UK; 88-116
[12] Fletcher M., Loeb G. I. (1979). Influence of substratum characteristics on the attachment of a marine pseudomonad to solid surfaces. Appl. Environ. Microbiol.; 37:67–72.
[13] Gomes de Souza J. M. (1987). Wastewater stabilisation lagoon design criteria for Portugal. Water Sci.
Technol.; 19(12), 7–16.
[14] Hamaidi F., Hamaidi M. S., Guetarni D., Saidi F. et Said M. S. (2008). Rotifères de l’Oued Chiffa (Algérie). Bulletin de l’institut scientifique, Rabat, section sciences de la vie, 2008, n°30.p19-27.
[15] Hammou N., Picot B. and Bontoux J. (1992). Sedimentary deposits in a natural microphyte lagoon variation of quantities, physical-chemical characteristics and heavy metal loads. Environmental Technology, 13, 647–655.
[16] Henze, M., van Loosdrecht, M.C.M, Ekama, G.A. and Brdjanovic. D. (2008). Biological Wastewater
Treatment: Principles, Modelling and Design. Published by IWA Publishing, London, UK.
[17] Keffala C., Effebi K. R., Ghrabi A., Jupsin H., and Vasel J. L. (2011). Sediment accumulation and evaluation of sludge production in wastewater stabilization ponds under Mediterranean climate, Revue des Sciences de l’Eau (J. Water Sci.); 24(1), 63–76.
[18] Kayombo, S., Mbwette, T.S.A., Mayo, A.W., Katima, J.H.Y., Jørgensen, S.E., (2002). Diurnal cycles of variation of physical–chemical parameters in waste stabilization ponds. Ecol. Eng (18), 287-291
[19] Konate Y., Maiga A. H., Casellas C., and Picot B. (2013). Sludge accumulation in stabilisation ponds in the Soudano–Sahelian climate of Burkina Faso. Desalination and Water Treatment, 51; 2453–2460
[20] Konate Y., Maϊga A. H., Wethe J., Basset D., Casellas C., and Picot B. (2010). Sludge accumulation in
anaerobic pond and viability of helminth eggs: a case study in Burkina Faso. Water Science and
Technology, 61(4), 919-925.
[21] Koste and Voigt, (1978). Rotatoria. Gebr. Borntraeger. Berlin. 2 vol, 234 plates: 1-673. [22] Koȓinek V. (1999). A guide to limnetic species of Cladocera of African inland waters (Crustacea,
Branchiopoda) (using the morphology of Parthenogenetic females). Sil, occasional publication, N°1, ISBN 9988-0- 0316-1, 57 p.

Optimisation of two-stage high-rate anaerobic reactors coupled with baffled pond and wet-dry sand filters for
domestic wastewater treatment in a warm-dry climate (Ouagadougou, Burkina Faso)
PhD Thesis report Moumouni Diafarou Ali Page 108
[23] Lampert W., Fleckner W., Rai H. and Taylor B. E. (1986). Phytoplankton control by grazing zooplankton: A study on the spring clear-water phase. Limnol. Ocean. 31 (3), 478-490
[24] Llyod B. and Vorkas C. (1999). Technical report on the evaluation of the Mexicaltzingo WSP system. Technical Report No 5 Under DFID Research Contract No. R6871, Govt. of the United Kingdom, Center for Environmental Health Engineering, University of Surrey, England, 1999.
[25] Maïga Y., Wethe J., Denyigba K. and Ouattara A. S. (2009). The impact of pond depth and environment
conditions on sunlight inactivation of Escherichia coli and enterococci in wastewater in a warm climate.
Canadian Journal of Microbiology; 55(12):1364-1374
[26] Mara D. D. (2004). Domestic wastewater treatment in developing countries. Earthscan, London UK: pp 310.
[27] Mara D. D. and Pearson H. W. (1998). Design Manual for Waste Stabilization Ponds in Mediterranean Countries, Lagoon Technology, Leeds, UK
[28] Metcalf and Eddy (1991). Wastewater engineering, Treatment, Disposal and Reuse, 2nd Ed. Revised by
Tchobanoglous, G., Burton, F.L. McGraw Hill, Inc., USA
[29] Nelson K. L, Cisneros B. J., Tchobanoglous G., and Darby J. L. (2004). Sludge accumulation, characteristics,
and pathogen inactivation in four primary waste stabilization ponds in central Mexico. Water Res.; 38,
111–127.
[30] Notenboom-Ram E. (1981). Verspreiding en écologie Van de Branchiopoda. RIN rapport 81/ 14, Rijks instituut Voor Natuurbeheer, Leersum, pp. 25-26
[31] Oliveira, S. C. & von Sperling M. (2011). Performance evaluation of different wastewater treatment technologies operating in a developing country. Journal of Water, Sanitation and Hygiene for Development, 1 (1), 37-56
[32] Oueda A. (2009). Zooplancton et écologie alimentaire des poissons des lacs artificiels de Bagré et de Loumbila (Burkina Faso). Thèse de doctorat de université de Ouagadougou, 158p.
[33] Oueda A., Guenda W., Kabre A. T., Zongo F. and Kabre G. B. (2007). Diversity, abundance and seasonal dynamic of zooplankton community in a south Saharan reservoir (Burkina Faso). Journal of Biological Sciences 7 (1): 1-9.
[34] Pagano, M. (2008). Feeding of Tropical Cladocerans (Moina micrura, Diaphanosama excisum) and Rotifer (Branchionus calyciflorus) on natural phytoplankton: Effect of phytoplankton size-structure. J. Plank Res.; 30 (4), 401-414
[35] Pontin R. M. (1978). A key to the freshwater planktonic and semi-planktonic Rotifera of the British Isles. Freshwater Biological Association, Scientific publication N°38, SBN 900386 339, ISBN 0367–1887, 178 p.
[36] Pourriot R. (1980). Rotifères. In: Flore et faune aquatique de l’Afrique Sahélo-soudanienne Tome1. J. R. Durand et C. Lévêque, Editions ORSTOM, pp.219-244.
[37] Pourriot R. et Champ P. (1982). Consommateurs et production secondaire. In: Ecologie du Plancton des Eaux Continentales. Pourriot R., Capblancq J., Champ P. and Meyer J. A. (Eds), Masson., Paris, Collection d’Ecologie, 16, 49-112.
[38] Pringle J. H., Fletcher M. (1983). Influence of substratum wettability on attachment of freshwater bacteria to solid surfaces. Appl. Environ. Microbiol.; 45:811–17.
[39] Rey J. and Saint-Jean L. (1980). Branchiopodes. In: Flore et faune aquatiques de l’Afrique sahelo-soudanienne Tome1. J. R. Durand et C. Lévêque, Edit.ORSTOM, pp.307-332.
[40] Sars, G. O. (1895). An account of the Crustacea of Norway. Vol 1 Amphipoda. Description pp. 1 -711. Christiania and Copenhagen. (Alb. Cammermeyer's Forlag).13: 1 - 1 8
[41] Shin H. K., and Polprasert C. (1987). Attached-growth waste stabilization pond treatment evaluation. Water Science and Technology; 19(12): 229-235
[42] Starkwheather, P.L. (1980). Aspects of the feeding behavior and trophic ecology of suspension-feeding
rotifers. Hydrobiologia 73, 63-72
[43] van der Wende E. and Characklis W. G. (1990). Biofilms in Potable Water Distribution Systems; In: Drinking
Water Microbiology. McFeters G. A (ed.), Springer-Verlag New York Inc p. 249-268
[44] Vannier J., Abe K., Ikuta K. (1998). Feeding in myodocopid ostracods: functional morphology and
laboratory observations from videos. Marine Biology; 132(3 ), 391-408
[45] von Sperling, M. and Chernicharo, C. A. L. (2005). Biological Wastewater Treatment in Warm Climate
Regions. Volume one, P. 856. Published by IWA Publishing, London, UK

Optimisation of two-stage high-rate anaerobic reactors coupled with baffled pond and wet-dry sand filters for
domestic wastewater treatment in a warm-dry climate (Ouagadougou, Burkina Faso)
PhD Thesis report Moumouni Diafarou Ali Page 109
Chapter 6
6. Biogas production from high-rate anaerobic reactors in Sahelian climate
This final chapter presents and discusses the potential for biogas production, its quality, and
the rate of sludge accumulation in two pilot-scale anaerobic reactors at the 2iE Campus in
Ouagadougou, Burkina Faso, within the Sahel Region, just to the south of the Sahara Desert.
6.1 Biogas recovery from anaerobic treatment processes
Anaerobic wastewater treatment has been given more attention over the aerobic
wastewater treatment since the energy crisis of the 1970s, together with the increased
demand for industrial wastewater treatment (Henze et al., 2008). Indeed, anaerobic
biological wastewater treatment systems are recognized for their efficient organic matter
removal, low energy requirements, their potential for valuable resources recovery, such as
methane-rich biogas for energy and stable sludge as organic fertilizer for agriculture (Van
Lier et al., 2008; Bodík et al., 2011; Lohani et al., 2013). In addition, these systems produce
more biogas in hot, tropical areas (Haandel and Lettinga, 1994).
Generally, the anaerobic degradation pathway of organic matter to produce biogas is a
multi-step process of reactions in series and in parallel. This process of organic matter
degradation is known to proceed in four key biological and chemical stages namely:
hydrolysis, acidogenesis, acetogenesis and methanogenesis (Figure 6.1; Haandel and
Lettinga, 1994; Van Lier et al., 2008). The methane-producing bacteria are located at the
end of this food chain, which indicates the unidirectional degradation of organic matter to
the end products of methane and carbon dioxide. However, in practice, Van Lier et al.,
(2008) reported that other reverse reactions may occur to produce high concentrations of
volatile fatty acids (VFA) and alcohols, which are of capital importance in the control and
operation of an anaerobic digester.
Biogas production is dependent on several environmental variables, including substrate type
and quality, temperature, pH, retention time, degree of wastewater treatment, competition
between methanogens and sulphate-reducing bacteria, and toxicants (El-Fadel and
Massoud, 2001; Stadmark and Leonardson, 2005). For instance, the hydrolysis process,
which is considered to be the rate-limiting step during anaerobic digestion of complex
substrates, is very sensitive to average temperature and temperature fluctuations (Van Lier
et al., 2008). On the other hand, methanogenesis is sensitive to both high and low pH and
occurs between pH 6.5 and pH 8. According to Haandel and Lettinga (1994),
methanogenesis is often the rate limiting step of the entire anaerobic digestion process,
because it has a cell ‘doubling time’ of a few days compared with the few hours required for
acetogenic bacteria.

Optimisation of two-stage high-rate anaerobic reactors coupled with baffled pond and wet-dry sand filters for
domestic wastewater treatment in a warm-dry climate (Ouagadougou, Burkina Faso)
PhD Thesis report Moumouni Diafarou Ali Page 110
Source: Haandel and Lettinga, (1994)
Figure 6.1: Reaction sequence for the anaerobic digestion of complex macromolecules
In the field of domestic sewage treatment, many types of anaerobic reactors have been
designed and implemented specifically to recover biogas. The Upflow Anaerobic Sludge
Blanket reactor (UASB), which was developed by Lettinga and co-workers (Lettinga et al.,
1980), represents the most widely, used system for anaerobic wastewater treatment in
many parts of the world. For example, in a UASB reactor, 28% to 75% of the chemical
oxygen demand (COD) is transformed into energy in the form of the methane gas (Mendoza
et al., 2009). Furthermore, a number of researchers have investigated the potential for
biogas production from other anaerobic treatments systems, such as conventional,
duckweed-based, and algae-based anaerobic ponds (Van der Steen et al., 2004; Konate et
al., 2013; Sims et al., 2013). These have found a huge potential to produce biogas with a
high content of methane (80%), if the necessary collection systems is constructed.
If this methane is not collected, wastewater treatment contributes significantly to total
greenhouse gas (GHG) emissions is, because it involves conversion of organic matter into
biogas (mainly CH4 and CO2) (Kärrman and Jőnsson, 2001; Van der Steen et al., 2004;
Stadmark and Leonardson, 2005, 2007; Hospido et al., 2007; Margarita and Scarlette, 2007;
Show and Lee, 2008; Sims et al., 2013). Wastewater treatment may account for about 5% of
global methane emissions (Czepiel et al., 1993). According to Le et al., (2007), 0.3 to 0.6 kWh
is required to treat one cubic meter of wastewater using membrane bioreactors and 0.2 to
0.4 kWh/m3 is needed when using the conventional activated sludge process (Amy, 2008). In
Complex organic compounds
(Carbohydrates, proteins, lipids)
Simple organic compounds
(Sugars, amino acids, fatty acids)
Short chain volatile
organic acids
CH4, CO2
H2, CO2 Acetate & acetic acid
Hydrolysis
Methanogenesis
Acidogenesis
Acetogenesis

Optimisation of two-stage high-rate anaerobic reactors coupled with baffled pond and wet-dry sand filters for
domestic wastewater treatment in a warm-dry climate (Ouagadougou, Burkina Faso)
PhD Thesis report Moumouni Diafarou Ali Page 111
addition to the high energy consumption, the waste management sector has contributed
about 3 to 4 percent of the annual global anthropogenic (man-made) GHG emissions (IPCC,
2006).
Therefore, one of the mitigation measures is to apply wastewater treatment options that
consume less energy, combined with energy recovery and reuse. Hence, it is in this regard
that the potential for biogas production in terms of quantity and quality from a two-stage
high-rate anaerobic reactors treating domestic wastewater under a Sahelian climate is
investigated. In fact, this present work could be seen as an extension of the study by Konate
et al., (2013), who measured biogas production and composition generated from an
anaerobic pond treating domestic wastewater in the same area. The main difference from
their study resides in the type of wastewater treatment technology, since it has been
reported to affect the amount of methane released per kilogram of BOD treated (Van der
Steen et al., 2004). In addition, the accumulation of sludge from these anaerobic reactors
was also measured.
6.2 Methodology
6.2.1 Description of the experimental setup
The two-stage high-rate anaerobic reactors used in this study were as described in Chapter
2 (Figure 2.3), as were their operational conditions.
6.2.2 Biogas collection, sampling and analysis
The production of biogas was measured daily from March to August 2015 with two floating
static chambers in Plexiglas adapted from the collectors described in a similar study on
biogas collection in the same climatic conditions (Konate et al., 2013). These devices were
used, because gas-tightness could not be achieved above the water surface inside the
anaerobic reactors (the 0.5 m3 that was left for the biogas collection and storage).
The device used here for the biogas collection consisted of a floating static chamber, with a
basal area of 0.138 m2. It is a half-sphere in shape and covered 9% of the total surface area
of each anaerobic reactor (1.538 m2; Figure 6.2). All the two collectors were supported at
the surface with floats and anchored with strings to the top of the chamber to prevent any
disturbance due to internal mixing of the reactor. The collectors were opaque and also the
reactors lids were set in order to stop ultraviolet (UV) penetration and to prevent algae from
growing within the system (Picot et al., 2003). Therefore, the increase in O2 concentrations
in the collectors was avoided as reported by previous studies (Brockett, 1976; Sharpe and
Harper, 1999). Every 24 h, the buoyancy position of the collector was read with a graduated
scale established on each collector, which gave the corresponding volume of biogas that had
been produced. This reading of the biogas volume had an estimated accuracy of 3%. The
measurements of biogas production were done every day for six months. The two gas
collectors were placed in the middle of the water surface inside the reactor. The ideal gas

Optimisation of two-stage high-rate anaerobic reactors coupled with baffled pond and wet-dry sand filters for
domestic wastewater treatment in a warm-dry climate (Ouagadougou, Burkina Faso)
PhD Thesis report Moumouni Diafarou Ali Page 112
formula (Equation 6.1) was used to correct for the real volume of the collected biogas (R=
0.0821 at P= 1atm, T= 20°C, and n= 1 mole).
PV=nRT (6.1)
Where: P is the pressure of the gas (atm) V is the volume of the gas (m3) T is the temperature (°C) n is number of moles R is the universal gas constant (R= 0.0821 at 1 atm, 20°C and 1 mole)
Source: Konate et al., (2013)
Figure 6.2: Schematic view of the biogas collector
The composition of the biogas in terms of CH4, CO2, H2S and other trace gas was determined
three times a week directly in situ, using a portable biogas analyser (Geotech GA 5000;
Figure 6.3). This apparatus was designed specifically to measure gases from landfills and
other anaerobic sources, with certified allowable ambient temperatures between - 10 ºC
and + 50 ºC. It should be noted that the inlet and outlet pressures should not exceed +/- 500
mbar and +/- 100 mbar with respect to atmospheric pressure respectively. Calibration of the
apparatus was carried out using various types of gas depending on the purpose the study.
Besides, the biogas from the collectors of both anaerobic reactors were sampled once a
month in tedlar bags and transported to 2iE laboratory for analysis with micro-gas
chromatograph (Micro-GC). This was done in order to cross check the results from the field
analyses. In order to optimize the quality of the results, each biogas sample was analyzed in
triplicate.
To appreciate the additional value of each anaerobic reactor (R1 and R2), statistical tests
were conducted with STATISTICA 8.0 software (IBM). The t-test was used to test significant
differences between the two anaerobic reactors in terms of biogas production at the 5%
significance level.
Air expulsion at t=0 Biogas reading at t=24h
1: Biogas collector 2: Biogas outlet 3: Float 4: Vertical axial support 5: Transversal wooden rod 6: Anaerobic reactor water 7: Biogas bubble
Biogas
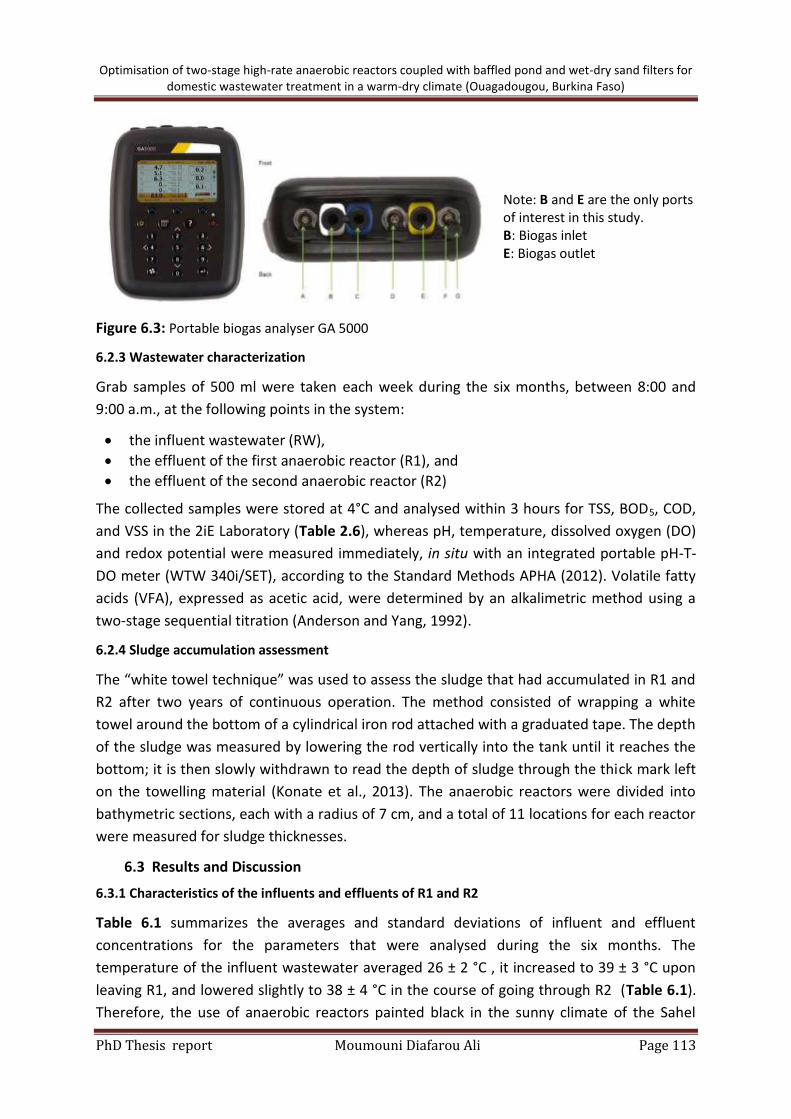
Optimisation of two-stage high-rate anaerobic reactors coupled with baffled pond and wet-dry sand filters for
domestic wastewater treatment in a warm-dry climate (Ouagadougou, Burkina Faso)
PhD Thesis report Moumouni Diafarou Ali Page 113
Figure 6.3: Portable biogas analyser GA 5000
6.2.3 Wastewater characterization
Grab samples of 500 ml were taken each week during the six months, between 8:00 and
9:00 a.m., at the following points in the system:
the influent wastewater (RW),
the effluent of the first anaerobic reactor (R1), and
the effluent of the second anaerobic reactor (R2)
The collected samples were stored at 4°C and analysed within 3 hours for TSS, BOD5, COD,
and VSS in the 2iE Laboratory (Table 2.6), whereas pH, temperature, dissolved oxygen (DO)
and redox potential were measured immediately, in situ with an integrated portable pH-T-
DO meter (WTW 340i/SET), according to the Standard Methods APHA (2012). Volatile fatty
acids (VFA), expressed as acetic acid, were determined by an alkalimetric method using a
two-stage sequential titration (Anderson and Yang, 1992).
6.2.4 Sludge accumulation assessment
The “white towel technique” was used to assess the sludge that had accumulated in R1 and
R2 after two years of continuous operation. The method consisted of wrapping a white
towel around the bottom of a cylindrical iron rod attached with a graduated tape. The depth
of the sludge was measured by lowering the rod vertically into the tank until it reaches the
bottom; it is then slowly withdrawn to read the depth of sludge through the thick mark left
on the towelling material (Konate et al., 2013). The anaerobic reactors were divided into
bathymetric sections, each with a radius of 7 cm, and a total of 11 locations for each reactor
were measured for sludge thicknesses.
6.3 Results and Discussion
6.3.1 Characteristics of the influents and effluents of R1 and R2
Table 6.1 summarizes the averages and standard deviations of influent and effluent
concentrations for the parameters that were analysed during the six months. The
temperature of the influent wastewater averaged 26 ± 2 °C , it increased to 39 ± 3 °C upon
leaving R1, and lowered slightly to 38 ± 4 °C in the course of going through R2 (Table 6.1).
Therefore, the use of anaerobic reactors painted black in the sunny climate of the Sahel
Note: B and E are the only ports of interest in this study. B: Biogas inlet E: Biogas outlet

Optimisation of two-stage high-rate anaerobic reactors coupled with baffled pond and wet-dry sand filters for
domestic wastewater treatment in a warm-dry climate (Ouagadougou, Burkina Faso)
PhD Thesis report Moumouni Diafarou Ali Page 114
resulted in an increase in temperature (Section 2.3.2). Temperature plays a decisive role in
treatment processes, decreasing land requirements, enhancing conversion processes,
increasing removal efficiencies, and boosting biogas production. Increasing temperatures in
anaerobic digesters may even shift the microbial diversity from acetoclastic methanogens to
hydrogenotrophic methanogens, which produce more methane (Liu et al., 2002; Pender et
al., 2004).
The pH values of the influent sewage and the effluents of the anaerobic reactors were in the
neutral range, which indicates favourable anaerobic conditions for bacterial growth and
biological degradation of organic matter to produce biogas (Peña, 2002; Foresti et al., 2006).
Dissolved oxygen was consistently low in the influent wastewater and the effluents of R1
and R2 (Table 6.1), as is expected in anaerobic conditions. In addition, the redox potential
measured in the influent and effluents of both anaerobic reactors had negative values, thus
conditions were favourable for methanogenesis as the exclusive terminal microbial process
(Kotsyurbenko et al., 2004). There was a decrease in VFAs from 66 ± 46 mg/l in the influent
wastewater to 36 ± 16 and 25 ± 9 mg/l in the effluents of R1 and R2 respectively, suggesting
that a good conversion from acitogenesis to methanogenesis was taking place (Pender et
al., 2004).
COD, BOD5, TSS and VSS concentrations of the influent wastewater were lower than normal
for the domestic wastewater of developing countries (Metcalf & Eddy, 2003; von Sperling &
Chernicharo, 2005; Henze et al., 2008). Besides, its COD/BOD5 ratio was 2.1, indicating that
it was easily biodegradable domestic wastewater (Metcalf & Eddy, 2003; Henze et al., 2008).
In summary, the results of this six-month monitoring session are similar to those of Chapter
2 on the performance of the anaerobic reactors, demonstrating the reproducibility of the
experiment.
Table 6.1: Influent and effluent characteristics of the anaerobic reactors R1 and R2
Parameters
RW R1 R2 n
Avg* STD+ avg STD avg STD unit
T (°C) 26.73 2.12 39 2.89 38.75 3.64 24
pH (value) 7.28 0.21 7.21 0.10 7.29 0.13 24
Disolved oxygen (mg/l) 0.81 0.4 0.66 0.7 0.57 0.20 24
Redox potential (mV) -29.6 12 -24.3 10.0 -29.0 12.0 24
Total DBO5 (mg/l) 166 49 120 59 82 46 24
Total COD (mg/l) 357 127 235 87 173 39 24
TSS (mg/l) 61 14 38 7 20 13 24
VSS (mg/l) 49 17 20 10 10 8 24
VFA (mg/l of acetic acid) 66 46 36 16 25 9 24
6.3.2 Biogas production rates
The daily variability in biogas production in the two anaerobic reactors was closely related
to temperature during these six months (Figures 6.4 and 6.5). This correlation with water

Optimisation of two-stage high-rate anaerobic reactors coupled with baffled pond and wet-dry sand filters for
domestic wastewater treatment in a warm-dry climate (Ouagadougou, Burkina Faso)
PhD Thesis report Moumouni Diafarou Ali Page 115
temperature is well established (Toprak, 1995; Hodgson and Paspaliaris, 1996; Picot et al.,
2003, 2011; Konate et al., 2013). In the current study, water temperature varied from 30.1
˚C to 42.7 ˚C with an average of 39.0 ˚C for R1, while in R2 it varied from 29.1 ˚C to 41.4 ˚C
with an average of 38.7 ˚C, thus they operated in mesophilic temperatures. For both
reactors, the highest production rates were recorded when the temperature in the reactors
was highest, and decreased when the temperature was lower. The variation in the biogas
production rate also varied according to the organic loading rate, as has been previously
demonstrated (Konate et al., 2013).
The first anaerobic reactors of this study (R1) produced an average daily volume of biogas of
107 ± 17 L/day (9.7 ± 1.5 L/m2day) or 2.5 L/g of volatile suspended solids (VSS) removed,
while the second one (R2) generated 105 ± 14 L/day (9.5 L/m2day) or 1.8 L/g VSS removed.
R1 produced slightly more than R2 because it was first in the series and received a higher
organic load, which may also explain its higher temperature. Although biogas production
rates were mostly higher in R1, t-tests showed no significant difference between the two
reactors. Moreover, the biogas production rates were found to be lower than those that
Konate et al., (2013) obtained from ananaerobic pond treating domestic wastewater under
the same climatic conditions, but with a higher organic load. This difference in biogas
production may also have been due to other environmental factors and operational
conditions, such as the running period of the system. In any case, organic loading rate is a
key factor in biogas production (El-Fadel and Massoud, 2001; Stadmark and Leonardson,
2005).
Figure 6.4: Variations in biogas production and internal water temperature over time in the
first anaerobic reactor (R1)
5
10
15
20
25
30
35
40
45
60
70
80
90
100
110
120
130
140
150
160
1 11 21 31 41 51 61 71 81
ToC
Bio
ga
s l/d
ay
day
Temperature and Biogas in R1
Biogas
T

Optimisation of two-stage high-rate anaerobic reactors coupled with baffled pond and wet-dry sand filters for
domestic wastewater treatment in a warm-dry climate (Ouagadougou, Burkina Faso)
PhD Thesis report Moumouni Diafarou Ali Page 116
Figure 6.5: Variations in biogas production and internal water temperature over time in the second
anaerobic reactor (R2)
6.3.3 Biogas composition
The biogas collected during this six-month monitoring period (72 samples) had the following
composition:
54 % ± 10 methane, 6% ± 1 carbon dioxide, 8 % ± 2 N2 and 32 % of other gases ( H2, H2S,
H2O, …) for R1
44 % ± 5 methane, 12 % ± 2 carbon dioxide, 9 % ± 1 N2 and 34 % of other gases (H2, H2S,
H2O, …) for R2 (Figure 6.6).
Methane content was higher in the first anaerobic reactor, potentially due to its higher
temperatures and organic loadings being more conducive to the activity of the
microorganisms. The hydrogen sulphide (H2S) content for both reactors was very low, even
negligible in R2 (1 ppm and 0 ppm in R1 and R2 respectively). Konate et al., (2013)
attributed this to the scarcity of sulphates in the wastewater of Burkina Faso. On the other
hand, the content of other gases was not negligible, since about 32 % of the biogas
consisted of other gases, such as H2, H2O. This may be attributed to denitrification processes
occurred in the anaerobic reactors. Nonetheless, the methane content found in this study
was similar to that found elsewhere (Hodgson and Paspaliaris, 1996; Kotsyurbenko et al.,
2004).
5
10
15
20
25
30
35
40
45
60
70
80
90
100
110
120
130
140
150
160
1 11 21 31 41 51 61 71 81
T oC Biogas l/day
day
Biogas et temperature in R2
Biogas
T

Optimisation of two-stage high-rate anaerobic reactors coupled with baffled pond and wet-dry sand filters for
domestic wastewater treatment in a warm-dry climate (Ouagadougou, Burkina Faso)
PhD Thesis report Moumouni Diafarou Ali Page 117
Figure 6.6: Average composition of the biogas produced from (a) R1 and (b) R2
6.3.4 Sludge accumulation rates
As has been seen in anaerobic ponds (Konate et al., 2010, 2013), sludge distribution within
the anaerobic reactors, after two years of operation, was uneven (Table 6.2). The deepest
sludge was found in the middle, and near the outlets of the reactors, as has been found
elsewhere (Picot et al., 2005; Keffala et al., 2011; Konate et al., 2010, 2013). Sludge was
deeper in the first reactor because most suspended solids settled there before continuing to
the second reactor.
On the other hand, for a population equivalent of 50 PE, after two years of operation, the
rates of sludge accumulation in the anaerobic reactors were estimated to be only 0.0006
and 0.0002 m3 per capita per year, in R1 and R2 respectively (Table 6.2). These
accumulation rates were very low, compared other cases (Gomes de Souza, 1987; Mara and
Pearson, 1998; Keffala et al., 2011; Picot et al., 2005) and even those of similar climatic
conditions (Nelson et al., 2004; Konate et al., 2010, 2013). Firstly, this low accumulation rate
may be due to the constant mesophilic temperatures in the Sahelian, which may have
favoured intense sludge digestion. Secondly, the influent wastewater may have had an
especially low content of suspended solids and organics (Table 6.1), combined with settling
and digestion that may have occurred in the buffer tank at the inlet to the pilot project. In
summary, this configuration of two-stage high-rate anaerobic reactors seems to provide an
excellent option for minimizing sludge handing, and hence, reduce the cost of operation and
maintenance.
54
6 8
32
R1 CH4 (%)
CO2 (%)
N2 (%)
Others (%)
(a)
44
12,7 9
34,3
R2 CH4 (%)
CO2 (%)
N2 (%)
Others (%)
(b)

Optimisation of two-stage high-rate anaerobic reactors coupled with baffled pond and wet-dry sand filters for
domestic wastewater treatment in a warm-dry climate (Ouagadougou, Burkina Faso)
PhD Thesis report Moumouni Diafarou Ali Page 118
Table 6.2: Sludge distribution and accumulation in the anaerobic reactors R1 and R2
Parameters Sampling position Inlet(P1) P2
+ P3 P4 P5 P6 P7 P8 P9 P10 Outlet (P11)
Sludge depth in cm
R1 3 3 5 5 5 3 3 3 3 3 4
R2 1 1 1 2 2 2 2 1 1 1 2
R1 R2 R1 + R2 Sludge volume
m3
per 2 years 0.06 0.02
0.079315
Sludge volume
m3
per year 0.0287 0.0109
0.0397
Sludge volume
m3
per capita year*
0.0006 0.0002
0.0008
+Position
*For a population equivalent of 50 persons.
6.4 Conclusions
There is great potential for recovering biogas from the two-stage high-rate anaerobic
reactors treating domestic wastewater under a Sahelian climate, with the added benefit of
very low sludge accumulation rates. Over 9 liters per meter square per day of biogas were
produced per 18 liters per gram of VSS removed with a high methane content of 44 to 54%.
The industrial or domestic use of biogas would be a viable energetic option of energy in
African countries. Biogas production rates were closely associated with the water
temperature inside each reactor. More importantly, very low sludge yields were recorded in
both anaerobic reactors (0.0008 and 0.0002 m3 per capita per year). This low production of
sludge may be due to the high biodegradability of the domestic wastewater, combined with
the prevailing warm, dry climate. Therefore, the low sludge accumulation rates from this
pilot project, combined with efficient biogas production, would be an attractive option for
domestic wastewater treatment in the Sahel. However, before developing this on a massive
scale, an efficient setup for biogas collection and treatment should be designed and
implemented for use in these anaerobic reactors.
6.5 References
[1] Amy, G. (2008). Advanced Wastewater treatment: Membrane Bio-Reactors. Lecture note. UNESCO-IHE Institute for water education, Delft, Netherlands.
[2] Anderson, G. K. and Yang, G. (1992). Determination of bicarbonate and total volatile acid concentration in anaerobic digesters using a simple titration. Water Environ. Res. 64(1), 53–59.
[3] APHA (2012). Standard Methods for the Examination of Water and Wastewater. 22st
edition. American Public Health Association/American Water Works Association/Water Environment Federation; American, Washington DC, USA.
[4] Bodík, I., Sedláèek, S., Kubaská, M., and Hutòan, M. (2011). Biogas Production in Municipal Wastewater
Treatment Plants – Current Status in EU with a Focus on the Slovak Republic. Chem. Biochem. Eng. Q. 25
(3) 335–340.
[5] Brockett O. D. (1976). Microbial reactions in facultative oxidation ponds: anaerobic nature of oxidation
ponds. Water Res., 10, 45–49.

Optimisation of two-stage high-rate anaerobic reactors coupled with baffled pond and wet-dry sand filters for
domestic wastewater treatment in a warm-dry climate (Ouagadougou, Burkina Faso)
PhD Thesis report Moumouni Diafarou Ali Page 119
[6] Czepiel P. M., Crill P. M., and Harriss R. C. (1993). Methane Emissions from Municipal Wastewater
Treatment Processes. Environ. Sci. Technol.; 27, 2472-2477.
[7] El-Fadel M., and Massoud M. (2001). Methane emissions from wastewater management. Environmental
Pollution; 114, 177-185.
[8] Foresti E., Zaiat M. & Vallero M. (2006). Anaerobic processes as the core technology for sustainable
domestic wastewater treatment: Consolidated applications, new trends, perspectives, and challenges.
Reviews in Environmental Science and Bio/Technology, 5, 3–19.
[9] Gomes de Souza J. M. (1987). Wastewater stabilisation lagoon design criteria for Portugal. Water Sci.
Technol.; 19(12), 7–16.
[10] Haandel A. V., and Lettinga G. (1994). Anaerobic Sewage Treatment: A practical guide for regions with a hot climate. John Wiley & Sons, New York, Brisbane, Toronto, Singapore. 226 pp.
[11] Henze, M., van Loosdrecht, M. C. M, Ekama, G. A. and Brdjanovic. D. (2008). Biological Wastewater Treatment: Principles, Modelling and Design. Published by IWA Publishing, London, UK.
[12] Hodgson B. and Paspaliaris P. (1996). Melbourne water’s wastewater treatment lagoons: design
modifications to reduce odours and enhance nutrient removal, Water Sci. Technol. 33(7), 157–164.
[13] Hospido A., Moreira M. T., and Feijoo G. (2007). A Comparison of Municipal Wastewater Treatment Plants for Big Centres of Population in Galicia (Spain). International Journal Life Cycle Analysis; 13, 57–64
[14] IPCC (2006). Wastewater treatment and discharge, IPCC Guidelines for National Greenhouse Gas Inventories, vol. 5, (Doorn M.R.J., Towprayoon, S., Vieira, S. M. M., Irving, W., Palmer, C., Pipatti R., and Wang, C). IGES, Japan, p 28.
[15] Kärrman E., and Jőnsson H. (2001). Normalizing impacts in an environmental systems analysis of wastewater systems. Wat. Sci. Technol.; 43, 293-300.
[16] Keffala C., Effebi K. R., Ghrabi A., Jupsin H., and Vasel J. L. (2011). Sediment accumulation and evaluation of sludge production in wastewater stabilization ponds under Mediterranean climate, Revue des Sciences de l’Eau (J. Water Sci.); 24(1), 63–76.
[17] Kotsyurbenko O. R., Chin K.-J., Glagolev M. V., Stubner S., Simankova M. V., Nozhevnikova A. N. and Conrad R. (2004). Acetoclastic and hydrogenotrophic methane production and methanogenic populations in an acidic West-Siberian peat bog. Environmental Microbiology 6(11),1159–1173.
[18] Konate Y., Maiga A. H., Casellas C., and Picot B. (2013). Biogas production from an anaerobic pond treating domestic wastewater in Burkina Faso. Desalination and Water Treatment. 51; 2445–2452.
[19] Konate Y., Maiga A. H., Casellas C., and Picot B. (2013). Sludge accumulation in stabilisation ponds in the Soudano–Sahelian climate of Burkina Faso. Desalination and Water Treatment, 51; 2453–2460
[20] Konate Y., Maϊga A. H., Wethe J., Basset D., Casellas C., and Picot B. (2010). Sludge accumulation in
anaerobic pond and viability of helminth eggs: a case study in Burkina Faso. Water Science and
Technology, 61(4), 919-925.
[21] Le T., Somerville, H., R. Cubasch, U. Ding, Y. Mauritzen, C. Mokssit, A. Peterson T. and Prather, M. (2007). Historical overview of climate change science. Climate Change 2007: The Physical Science Basis. Contribution of Working Group I to the Fourth Assessment Report of the Intergovernmental Panel on Climate Change Solomon S., Qin D., Manning M., Chen Z., Marquis M., Averyt K. B., Tignor M., and Miller H. L. Eds., Cambridge University Press, Cambridge, 93-128.
[22] Lettinga G., Van Velsen A. F. M., Hobma S. W., De Zeeuw W. and Klapwijk A. (1980). Use of upflow sludge blanket (USB) reactor concept for biological wastewater treatment, especially for anaerobic treatement. Biotechnol. Bioeng. 22, 699-734
[23] Liu W.-T., Chanb O.-C., Fang H. H. P. (2002). Microbial community dynamics during start-up of acidogenic anaerobic reactors. Water Research, 36, 3203 – 3210
[24] Lohani S. P., Chhetri A., Adhikari J., and Bakke R. (2013). Sustainable Biogas Production Potential from Urban Wastewater in Nepal. International Journal of Environmental Science and Development; 4, (5), 595-599
[25] Mara D. D. and Pearson H. W. (1998). Design Manual for Waste Stabilization Ponds in Mediterranean Countries, Lagoon Technology, Leeds, UK

Optimisation of two-stage high-rate anaerobic reactors coupled with baffled pond and wet-dry sand filters for
domestic wastewater treatment in a warm-dry climate (Ouagadougou, Burkina Faso)
PhD Thesis report Moumouni Diafarou Ali Page 120
[26] Margarita P., and Scarlette, L. G. (2007). Application of strategies for sanitation management in wastewater treatment plants in order to control/reduce greenhouse gas emissions. Journal of Environmental Management; 88, 658-664.
[27] Mendoza L., Carballa M., Sitorus B., Pieters J., Verstraete W. (2009). Technical and economical feasibility of gradual concentric chambers reactor for sewage treatment in developing countries. Electron J Biotechnol; 12(2):1–13.
[28] Metcalf and Eddy (2003). Wastewater engineering, Treatment and Reuse. Tchobanoglous, G., Burton, F.L.,
Stensel, H.D (Eds). 4th Ed. McGraw Hill, Inc., USA.
[29] Nelson K. L, Cisneros B. J., Tchobanoglous G., and Darby J. L. (2004). Sludge accumulation, characteristics,
and pathogen inactivation in four primary waste stabilization ponds in central Mexico. Water Res.; 38,
111–127.
[30] Peña M. R. (2002). Advanced primary treatment of domestic wastewater in tropical countries:
development of high-rate anaerobic ponds. Ph.D thesis. School of Civil Engineering, University of Leeds.
Leeds, England.
[31] Pender S., Toomey M., Carton M., Eardly D., Patching J. W., Colleran E., O’Flaherty V. (2004). Long-term
effects of operating temperature and sulphate addition on the methanogenic community structure of
anaerobic hybrid reactors. Water Research, 38, 619 – 630
[32] Picot B., Konate Y., Maiga A.H., and Girard P. (2011). Biogas production from a full scale anaerobic waste
pond in Burkina Faso. in: Proceeding 9th IWA Specialist conference on waste stabilization ponds,
Adelaide, Australia
[33] Picot B., Paing J., Sambuco J. P., Costa R. H. R., Rambaud A. (2003). Biogas production, sludge accumulation and mass balance of carbon in anaerobic ponds, Water Sci. Technol., 48(2), 243–250.
[34] Picot B., Sambuco J. P., Brouillet J. L., Riviere Y. (2005). Wastewater stabilisation ponds: Sludge accumulation, technical and financial study on desludging and sludge disposal. Case studies in France, Water Sci. Technol.; 51(12), 227–234.
[35] Sharpe R. R., and Harper L. A. (1999). Methane emissions from anaerobic swine lagoon. Atmos. Environ.,
33, 3627–3633.
[36] Show K. Y., and Lee D. J. (2008). Carbon credit and emission trading: Anaerobic wastewater treatment. Journal of the Chinese Institute of Chemical Engineers; 39, 557-562
[37] Sims A., Gajaraj S., Hu Z. (2013). Nutrient removal and greenhouse gas emissions in duckweed treatment ponds. Water research; 47, 1390-1398.
[38] Stadmark J., and Leonardson L. (2007). Greenhouse gas production in a pond sediment: Effects of temperature, nitrate, acetate and season. Science of the Total Environment; 387, 194-205.
[39] Stadmark J., and Leonardson L. (2005). Emissions of greenhouse gases from ponds constructed for nitrogen removal. Ecological Engineering, 25(5), 542-551.
[40] Toprak H. (1995). Temperature and organic loading dependency of methane and carbon dioxide emission rates of a full-scale anaerobic waste stabilization pond, Water Res. 29(1) 1111–1119.
[41] Van der Steen N. P., Ferrer A. V. M., Samarasinghe K. G. and Gijzen H. J. (2004). Quantification and comparison of methane emissions from algae and duckweed-based wastewater treatment ponds. IWA Wat. Env. Man., Series 11, 166-174.
[42] Van Lier J. B., Mahmoud N., and Zeeman G. (2008). Anaerobic wastewater treatment, in Henze M., van
Loosdrecht M. C. M, Ekama G. A., and Brdjanovic. D. (Eds.), Biological Wastewater Treatment: Principles,
Modelling and Design. Published by IWA Publishing, London, UK; 415-239
[43] von Sperling, M. and Chernicharo, C. A. L. (2005). Biological Wastewater Treatment in Warm Climate
Regions. Volume one, P. 856. Published by IWA Publishing, London, UK

Optimisation of two-stage high-rate anaerobic reactors coupled with baffled pond and wet-dry sand filters for
domestic wastewater treatment in a warm-dry climate (Ouagadougou, Burkina Faso)
PhD Thesis report Moumouni Diafarou Ali Page 121
Chapter 7
7. Conclusion and perspectives
7.1 Overall conclusion
The design, implementation and evaluation of these two-stage high-rate anaerobic reactors,
followed by a baffled pond with attached-growth or a wet-dry sand filter for domestic
wastewater treatment in the sub-Saharan African, warm, dry climate of Ouagadougou were
conducted and optimized. Based on the results obtained in this study, the two combinations
have revealed an efficient and attractive alternative to treat domestic wastewater in West
Africa, under a Sahelian climate. Great variability was observed in the effluent
concentrations and in the removal efficiencies, considering all of the analysed treatment
units. It was discovered that high pathogen removal efficiencies were achieved in both
treatment options. The anaerobic reactors, followed by the sand filter, achieved a high
nitrification rate, while the same reactors followed by the Baffled Pond with attached
growth revealed better efficiency in removing ammonia nitrogen and E. coli. Furthermore,
no E.coli were ever detected in effluent of the Baffled Pond, nor did clogging occur in the
Sand Filter, during the entire study.
A detailed investigation was later carried out comparing the Baffled Pond (BP) with a control
pond (CP) to understand this non-detection (< 1 per 100 ml) of E. coli in the effluent of the
Baffled Pond. Among other things, this work showed the benefit of releasing effluent from
the top layer of the pond, since E. coli concentrations were lower near the surface of each of
the four compartments of the BP, with an undetectable level in the last compartment down
to a depth of 0.60 m.
The actual mean hydraulic retention times for the BP and the CP were 4.1 and 3.2 days
respectively. This implies that by introducing three vertical baffles in a pond the mean
retention time was increased by approximately 22%. Therefore, these findings show that
there is significant potential for size reduction and cost optimization to be achieved by the
incorporation of properly designed baffles in ponds in tropical climates. Moreover, it was
found that the Baffled Pond’s volume was used more efficiently for wastewater treatment
than the unbaffled pond, since more than half of the latter’s volume was considered ‘dead’
or inactive. This tracer experiment showed that the outcome of the fluid flow pattern of
these ponds can be fairly approximated as resulting of one and two mixed reactors in series
with high dispersion for the Baffled and Control Ponds respectively. Consequently, both the
Dispersed and Mixed-Reactors-in-Series Models are more appropriate for predicting the
performance of the Baffled Pond. Because of the high tracer recovery from both ponds, one
can conclude that loss of water through seepage is negligible and that sodium chloride can
be considered as an inexpensive and conservative tracer.
The efficiency of removing E. coli was significantly different between the BP and the CP. This
shows that the baffles with attached biofilm played an important role in the removal of E.

Optimisation of two-stage high-rate anaerobic reactors coupled with baffled pond and wet-dry sand filters for
domestic wastewater treatment in a warm-dry climate (Ouagadougou, Burkina Faso)
PhD Thesis report Moumouni Diafarou Ali Page 122
coli. In addition to the effluent being released from the top of the Baffled Pond,
sedimentation and the synergetic effects of physical, chemical and environmental factors
were responsible for the inactivation of E. coli in this system.
Another important aspect revealed by this research was the fact that the introduction of
baffles with affixed plastic bottle caps in a pond can tremendously improve the ecology of
algae, zooplankton, and other microscopic organisms, thus enhancing sanitation. Indeed,
the results have shown dense and diverse biodiversity on both the attached media and in
the water column of the Baffled Pond. The biofilm was thick and green on the upper parts of
both sides of the baffles and the associated plastic caps.
Three major groups of diverse zooplankton were found in the water column at depths of 15-
90 cm: Cladocera, Copepoda and Rotifers. The last group was dominant, with 14 identified
species, which are attracted to a wide spectrum of natural food items. The microbial
community was sampled for E. coli, fastidious bacteria, non-fastidious bacteria,
enterobacteria, and fungi in the water column of the Baffled Pond. Strong correlations
between certain groups of the bacteria and the density of suspended solids seem to
correspond to the adsorption phenomenon of certain bacteria by suspended matter, as
described in the literature. A Canonical Correspondence Analysis showed that the activity of
algae, fungi and different types of bacteria varied considerably from one part of the Baffled
Pond to another, probably in accordance with the variation of abiotic parameters, such as
pH, dissolved oxygen, electrical conductivity, and temperature. In addition, the very good
negative correlation between Group 1 and Group 2, confirms the predation relationship of
the zooplankton at one side and the bacteria and algae on the other hand. As a result, the
parasitic symbiosis distributions of phytoplankton and zooplankton have shown that the
baffles had an effect on water quality which in turn has affected the ecology of the baffled
pond. A Principal Components Analysis showed that the dense and abundant zooplankton
community also varied considerably among the different zones of the pond and may play an
important role in the control of the bacterial and algal populations found there.
Last but not least, an investigation of the potential of recovering biogas from the two-stage
high-rate anaerobic reactors treating domestic wastewater under Sahelian climate revealed
a high potential of producing this energetic resource. Over 9 liters per meter square per day
of biogas were produced per 18 liters per gram of VSS removed, with a good methane
content of 54%. Biogas would be a viable energy source in Sahelian countries, considering
their advantageous climate. Biogas production rates were observed to closely vary with the
temperature of the water inside the reactors. More importantly, very low sludge yields were
recorded in both anaerobic reactors (0.0006 and 0.0002 m3 per capita per year) and in the
Baffled Pond (0.0014 m3per capita per year). This low production of sludge could be due to
the high biodegradability of the local domestic wastewater, combined with the prevailing
warm, dry climate. Therefore, the low sludge accumulation rates from this pilot plant,
combined with an efficient biogas reuse would be an attractive option for domestic

Optimisation of two-stage high-rate anaerobic reactors coupled with baffled pond and wet-dry sand filters for
domestic wastewater treatment in a warm-dry climate (Ouagadougou, Burkina Faso)
PhD Thesis report Moumouni Diafarou Ali Page 123
wastewater treatment in the countries of the Sahel Region of Africa, especial since sludge
handing would be minimized and can be done at low cost, taking into account the prevailing
financial constraints.
Based on the outcome of this research, it was concluded that, both treatment options could
be applied as alternative, low-cost wastewater treatment technologies for African cities and
it is recommendable to use the effluent for restricted aquaculture and/or irrigation of peri-
urban agriculture.
7.2 A prospectus for future research
In order to contribute to the consolidation and dissemination of these alternatives, low-cost
two-stage high-rate anaerobic reactors, followed by a baffled pond with attached-growth or
a wet-dry sand filter, for domestic wastewater treatment in sub-Saharan African cities merit
further research into the resource recovery that may be applied to generate additional
values for their promotion.
Recognizing the sensitive local perceptions towards the use of sanitation by-products due to
existing cultural and religious beliefs, thorough evaluations of the users’ perceptions and
acceptability should be included in any further full-scale development of the technology,
together with active campaigns of education and consciousness-raising. Although, it may
not be easily acceptable within the local cultures, the effluent of this Baffled Pond could be
used in aquaculture, given the abundant presence of highly nutritious food items for fish,
including a great diversity of algae and zooplankton. Consequently, in order to contribute to
the alleviation of hunger in low-income urban neighborhoods, further investigation for the
use of the baffled pond effluent in aquaculture should be an attractive area of research.
Another great challenge of developing countries, especially in West Africa, is the
development of affordable and renewable sources of energy. Due to increased energy
consumption and rising prices, these alternative technologies are all the more important.
Biogas production is especially convenient in hot climates, where high temperatures
throughout the year contribute to efficient microbial processes. Nonetheless, before this is
developed on a large scale, an efficient setup for biogas collection and treatment should be
designed and implemented with these anaerobic reactors.
Even though these alternative technologies seem to be very profitable and low-cost, cost
benefit analysis with a user-friendly prototype should be carried out before investments are
made in such a venture.
By doing so, undoubtedly, a great achievement to the consolidation and dissemination of
this technology for the treatment of domestic wastewater sub-Saharan Africa, and thus
contribute to controlling the environmental challenges, such as deforestation, poor
sanitation and disease.
Related Documents