Arabian Journal for Science and Engineering https://doi.org/10.1007/s13369-022-07174-w RESEARCH ARTICLE-MECHANICAL ENGINEERING Optimisation of Preventive Maintenance Regime Based on Failure Mode System Modelling Considering Reliability Theyab O. Alamri 1 · John P. T. Mo 1 Received: 11 April 2022 / Accepted: 31 July 2022 © The Author(s) 2022 Abstract Today, the ability to maintain a continuous complex system operation is viewed as a key attribute for ensuring uninterrupted revenue contribution and the survival of a business. Many industrial organisations have come to understand that by having an effective plan of maintenance, the efficiency and reliability of a system can be improved, while costs can be minimised and revenue-generating production can continue. The novelty of this paper is based on using failure modes and effects analysis (FMEA) to develop a holistic preventive maintenance schedule for a complete system. A system can be modelled as a series and parallel arrangement of subsystems and components, and failure of different components of the system can be determined from their life expectancy. The objective is to ensure continuity of production output while maintaining a high level of system reliability and minimising the total maintenance costs. The reliability of a complete system is analysed using the Weibull failure-time distribution. By using the exhaustive search optimisation method, the maintenance cost is minimised by determining the optimal replacement interval for each FMEA block, subject to system reliability. Based on the results obtained from a case study, it is shown that the approach in this paper can ensure the continuity of production output during maintenance activities, reduce system maintenance costs, and achieve maximum system reliability. This holistic approach can be applied to any form of complex system, and at every step of the process. Keywords Preventive maintenance schedule · Reliability analysis · Failure modes and effects analysis (FMEA) · Continuity of system output · Partially failure modes · Maintenance optimisation 1 Introduction Maintaining complex systems has become more complicated over the past few decades. This is because systems are made up of many components that are interdependent. Each com- ponent of the system is important to its optimal function. A complex system may cease to function when a compo- nent is removed for maintenance. This can result in partial or complete failure. The failure of a component in a complex system, however, is expensive because of system downtime and the unplanned shutdown of other components, as well as the expense of urgently replacing it. It is possible to reduce the number of failures and increase the availability of complex systems by applying a good preventive maintenance (PM) scheme. For a system to run effectively, reliability must also B Theyab O. Alamri [email protected] 1 School of Engineering, RMIT University, Bundoora, VIC, Australia be considered, as it determines the system’s availability and therefore impacts the continuity and safety of the process. Many scholars have studied maintenance optimisation problems and employed various approaches to determine the best PM schedule. However, the results were generally not ideal [1]. PM schedules are typically designed by engineers based on manufacturer recommendations and managers’ experience [2]. From a conceptual perspective, component replacement should be delayed for as long as possible to realise the maximum benefit of the component. However, due to aging components and excessive wear, operation poses a high risk of unexpected failure [3]. Therefore, the operation and requirements of a system should be considered when planning preventive maintenance to ensure the continuity of its outputs. This paper explores the use of failure modes to design preventive maintenance schedules as a maintenance service strategy for complex engineering systems. A system can be modelled as a series of subsystems and components such that failure of different components of the system can be 123

Welcome message from author
This document is posted to help you gain knowledge. Please leave a comment to let me know what you think about it! Share it to your friends and learn new things together.
Transcript

Arabian Journal for Science and Engineeringhttps://doi.org/10.1007/s13369-022-07174-w
RESEARCH ART ICLE -MECHANICAL ENGINEER ING
Optimisation of Preventive Maintenance Regime Based on FailureMode SystemModelling Considering Reliability
Theyab O. Alamri1 · John P. T. Mo1
Received: 11 April 2022 / Accepted: 31 July 2022© The Author(s) 2022
AbstractToday, the ability to maintain a continuous complex system operation is viewed as a key attribute for ensuring uninterruptedrevenue contribution and the survival of a business. Many industrial organisations have come to understand that by having aneffective plan of maintenance, the efficiency and reliability of a system can be improved, while costs can be minimised andrevenue-generating production can continue. The novelty of this paper is based on using failure modes and effects analysis(FMEA) to develop a holistic preventive maintenance schedule for a complete system. A system can be modelled as a seriesand parallel arrangement of subsystems and components, and failure of different components of the system can be determinedfrom their life expectancy. The objective is to ensure continuity of production output while maintaining a high level ofsystem reliability and minimising the total maintenance costs. The reliability of a complete system is analysed using theWeibull failure-time distribution. By using the exhaustive search optimisation method, the maintenance cost is minimisedby determining the optimal replacement interval for each FMEA block, subject to system reliability. Based on the resultsobtained from a case study, it is shown that the approach in this paper can ensure the continuity of production output duringmaintenance activities, reduce system maintenance costs, and achieve maximum system reliability. This holistic approachcan be applied to any form of complex system, and at every step of the process.
Keywords Preventive maintenance schedule · Reliability analysis · Failure modes and effects analysis (FMEA) · Continuityof system output · Partially failure modes · Maintenance optimisation
1 Introduction
Maintaining complex systems has becomemore complicatedover the past few decades. This is because systems are madeup of many components that are interdependent. Each com-ponent of the system is important to its optimal function.A complex system may cease to function when a compo-nent is removed for maintenance. This can result in partial orcomplete failure. The failure of a component in a complexsystem, however, is expensive because of system downtimeand the unplanned shutdown of other components, as well asthe expense of urgently replacing it. It is possible to reduce thenumber of failures and increase the availability of complexsystems by applying a good preventive maintenance (PM)scheme. For a system to run effectively, reliability must also
B Theyab O. [email protected]
1 School of Engineering, RMIT University, Bundoora, VIC,Australia
be considered, as it determines the system’s availability andtherefore impacts the continuity and safety of the process.
Many scholars have studied maintenance optimisationproblems and employed various approaches to determine thebest PM schedule. However, the results were generally notideal [1]. PM schedules are typically designed by engineersbased on manufacturer recommendations and managers’experience [2]. From a conceptual perspective, componentreplacement should be delayed for as long as possible torealise themaximumbenefit of the component. However, dueto aging components and excessive wear, operation poses ahigh risk of unexpected failure [3]. Therefore, the operationand requirements of a system should be considered whenplanning preventive maintenance to ensure the continuity ofits outputs.
This paper explores the use of failure modes to designpreventive maintenance schedules as a maintenance servicestrategy for complex engineering systems. A system can bemodelled as a series of subsystems and components suchthat failure of different components of the system can be
123
Arabian Journal for Science and Engineering
determined from their life expectancy. Not all failures willcause stoppage of production. By analysing failure modesthat cause only partial system failures, production can besustained during preventive maintenance. Using the fail-ure mode model and corresponding data on the analysis ofcomponent reliability by Weibull distribution, a preventivemaintenance regime can not only improve system reliabil-ity and minimise cost of replacement components, but alsomaintain the continuity of the system’s outputs. This holisticapproach can be applied to any form of complex system andat every step of the process.
The organisation of the paper is as follows. Section 2 pro-vides a review of literature relevant to this research. Section 3represents notations and abbreviations. Section 4 describessystem reliability. The preventive maintenance strategy isdiscussed in Sect. 5. Section 6 introduces a case study to illus-trate the proposedFMEAblock replacement strategy.Resultsand discussion are in Sect. 7. Section 8 explains managerialimplications. In the last section, we discuss the conclusionsdrawn from this study.
2 Literature Review
The continuity of production outputs has always been iden-tified as a major problem in the manufacturing systems. Thefocus of this paper is on the continuity of complex productionsystem outputs that have a high level of reliability. The com-plex system includes a variety of components in series andparallel configuration. A minor failure in any one of thesecomponents can have a partial impact on the performanceof the entire system since they work continuously. In orderfor a whole system to be available, components’ safety andreliability are most important. Therefore, for any industrialsystem to meet its objectives, it is essential to maintain con-tinuity of its production systems.
Maintaining the continuity of production outcomes is theprimary objective for preventive maintenance. To examinewhat methodologies can be used in maintenance schedulingand how they are used, this literature review will focus ontwo areas: (a) preventive maintenance and systems reliabilitydriven by policies and (b) preventive maintenance with focuson potential failure modes.
2.1 Scheduling of Preventive Maintenance
A maintenance optimisation method is one that determinesan efficient maintenance schedule. This method balancesmaintenance costs with the risks associated with unplannedmaintenance [4]. A preventive maintenance approach thatfocuses on understanding the nature of failure modes andthe work of complex systems during the planning phase canguarantee the continuity of production outputs. In addition
to reducing the number of failures, and improving reliability,maintenance can substantially reduce costs [5].
An optimal maintenance policy is proposed for setsof interdependent components in multi-component mainte-nance models [6]. Economic dependence is a characteristicof continuous operating systems such as production lines[7]. Single shutdowns of multi-components system are typi-cally much more expensive than component replacements. Itis possible to realise significant savings when maintenancepolicies are implemented properly. However, the failure ofa single component does not always cause a full systemshutdown. In some cases of failure, parts of the system cancontinue to function in a reduced capacity [8].
2.1.1 Scheduling for Continuity
Complex production systems need to be run continuouslyand have minimal periods of downtime [9–11]. To ensure thecontinuity output of a system, its reliability and requirementsshouldbe consideredwhenplanningpreventivemaintenance.Essentially, reliability is the probability of all the systemcomponents functioning correctly at all times. System relia-bility is an important consideration in complex engineeringapplications with multiple components or multiple failuremechanisms [12]. The performance of the overall system isinfluenced by each component in some way. In the event ofa failure of any system component, the overall performanceof the system will be affected partially, or the system will beshut down entirely. To achieve adequate reliability levels fora complex system, it is essential to consider the preventivemaintenance intervals for components [13].
The reliability of components needs to be estimated formaintenance optimisation. Several published papers havefocused on group preventive maintenance strategies tai-lored to the reliability of multi-component systems; how-ever, maintenance activities such as repairs or replacementsrequire the whole system to be shut down. The researchershave chosen Weibull distribution for describing failure rates.For example, by using three models, Tam et al. [14] deter-mined the optimal maintenance intervals for multi-identicalcomponent systems. Under regular downtime conditions,maintenance can be performed given a minimum accept-able level of reliability and at a minimum total cost. In thisresearch, cost and reliability are considered simultaneouslyfor multi-component series systems. In complex systems,Hou et al. [15] presented the relationship between componentreliability and system performance. A model for determin-ing the optimal timing and cost of preventive maintenancewas developed for series and parallel systems. A preven-tive, corrective, and opportunistic maintenance approach hasbeen proposed by [16] to address multi-identical compo-nents with high production losses and economic dependence.
123
Arabian Journal for Science and Engineering
A conditional information-based search method was pro-posed concerning reliability analysis for components. In theauthors’ study, however,whenone component fails, the entiresystem,which ismadeupof several components connected inseries, fails. Another study based on series–parallel systemsand their reliability [17] developed a preventive maintenancedecision model that evaluated the restriction of system reli-ability on maintenance considerations. For multi-identicalcomponent systems subject to multiple dependent and com-peting failure processes, Song et al. [18] designed a reliabilitymodel and maintenance policy for an identical-componentsystem. A fixed inspection interval and an age replacementpolicy were both considered in the research. During theirstudy, the system failed when a minimum of one paral-lel subsystem failed. In another study for the optimisationof multi-component maintenance strategies, Guo et al. [19]designed a numerical analysis method. Each different com-ponent was estimated to have a different maintenance time,cost, and failure rate. The authors considered a series—parallel structure for a system with only four components.Under different system reliability conditions, the cost rateand availability of the maintenance system are optimised.Moreover, by using statistical analysis, Fallahnezhad et al.[20] presented a method for identifying the best preven-tive maintenance strategy for parallel, series, and single-itemreplacement systems. A balance between total cost and reli-ability is used to determine the values of decision variables.Their system is based on a specific number of equipmentitems, and as they deteriorate in terms of their function,the system will fail. For multi-component systems withserially connected subsystems that are subject to reliabil-ity requirements, Shi et al. [21] developed a condition-basedmaintenance decision framework. The authors assumed thatthe maintenance process needed to be performed by shuttingdown the system during the maintenance of any identicalcomponent over a finite planning horizon to minimise theoverall maintenance cost while ensuring the reliability ofthe system complies with the predefined requirement. In amulti-level approach incorporating structural and economicdependencies, Dinh et al. [22] proposed opportunistic pre-dictive maintenance for multi-identical component systems.The replacement of components can be opportunistic if theirpredicted reliability dips below the threshold for opportunis-tic maintenance. The system can be caused to shut down bya component failure or a preventive maintenance procedure,as all of its components are integrated in hierarchical series.For production system availability, an optimisation modelbased on a preventive maintenance policy was presented by[23] for flexible scheduling of a flow-shop in a series–parallelproduction system of disposable appliances.
Some of the literature considered a reliability-analysis-basedmaintenance policy formulti-non-identical component
systems. For instance, Shen et al. [24] dealt with the relia-bility of a multi-non-identical component system involvingcomponents that are subjected to continuous degradationprocesses and categorised shocks. Based on their recur-sive analysis, the authors developed a simulation method toapproximate the failure time of k-out-of-n systems. If at leastk components fail, the system fails. Using reliability analy-sis,Martinod et al. [25] developed an optimisation strategy tooptimise the cost of preventative and corrective maintenancefor complex multi-component systems. The authors studiedcomplex systems based on non-identical components, wherethe failure of any one component would affect the perfor-mance of the system. Recently, Kamel et al. [26] presenteda model for maintenance that minimises total maintenancecosts for series–parallel systems consisting of nonidenticalcomponents under the consideration of reliability constraints.Based on the grouping maintenance approach, Vu et al. [27]developed amethod formanaging systems composed ofmul-tiple non-identical components. The method can be used toconsider a variety ofmaintenanceopportunitieswhenmakinga decision about maintenance. In their research, they pre-sented the reliability block diagram of a power plant systemformed from six main components connected in a redundantconfiguration. The authors emphasised that the system mustbe shut down in order to maintain critical components in theproposedmodels. In order tominimisemaintenance costs fora series of multi-component systems, Wang et al. [28] devel-oped opportunistic maintenance models for each componentbased on the optimal reliability threshold. The replacementof the component can only be implemented when the compo-nent’s reliability meets the PM reliability threshold. Failuredistributions between the components obey a two-parameterWeibull distribution and the failure of any component in theseries multi-nonidentical component system leads to systemfailure.
2.1.2 Observation of Preventive Maintenance SchedulingApproaches
A variety of scheduling approaches have been stated inthe previously mentioned studies for achieving the spe-cific target of system performance. When a system fails,most approaches do not consider the underlying causes. Theeffect of failures, e.g. the severity of the machine faults wasregarded as trivial, and able to be resolved with ‘normal’maintenance schemes. When complex engineering systemsare involved, this assumption is not always true.
2.2 Failure Analysis
Among the best processes used for analysing potential fail-ures and system performance is failure modes and effectsanalysis (FMEA). It is used at the design stage to identify
123
Arabian Journal for Science and Engineering
potential failure modes during the development process [29].As a method, FMEA allows for identifying and analysing allthe faults in a system and evaluating their effect on the sys-tem’s reliability.
2.2.1 FMEA in Maintenance
Identification of potential failure modes is important duringthe analysis process. Failure modes can have various effectson a system, however not all will lead to a complete sys-tem failure. Whether a failure mode produces one or morefailures depends on the configuration of the system. There-fore, to identify risks associated with a potential failure modeand understand what happens to a system when a failuremode occurs, identifying the effects of failure modes andunderstanding dependency maps between components areimportant steps in the FMEA process. In this way, preventivemaintenance of components can be planned more effectivelyto ensure that the system does not have to shut down com-pletely during maintenance. The literature review shows thatmost studies used the development of the FMEA concept tosupport planning and provide recommendations for mainte-nance actions in accordance with the risk priority number(RPN), which is a fundamental component of any FMEA.
For example, using a reliability model to test the reliabil-ity of PM planning, Cicek et al. [30] proposed a flexibilityinterval between maintenance interventions based on fail-ure analysis. To attain the highest safety standards at thelowest cost, the authors analysed failures and accidents.Feedback, brainstorming, and expert judgement were usedin the FMEA to generate PM plans that increased systemreliability. Puthillath et al. [31] evaluated a preventive main-tenance schedule that would reduce downtime and improveperformance using the FMEA method. Based on reliabilityinformation for aircraft indicators, Guo et al. [32] improvedpreventive maintenance intervals through the optimisation ofthe long-term cost of operation. FMEA reports from two sup-pliers were used to identify the major failure modes in twoapplications of the indicator. Saleem et al. [33] employed theFMEAmethod to identify the causes of failures in tyre-curingpresses to increase efficiency by implementing the priorityrisk number RPN, and reduce maintenance and downtimecosts. Moreover, Piechowski et al. [34] used the FMEAmethod to analyse failures, scheduling, and planning pro-cesses. According to the concept of sustainable production,they evaluated failure based on different perspectives, suchas operator safety and environmental impact.
In other recent studies, the FMEA method has also beenused to identify failure types and to recommend preventa-tive maintenance of some components of a machine so thatthey can function as expected and minimise the impact offailures [35]. Using the FMEA approach, Rahmania et al.[36] reduced potential failure opportunities, thus enabling
resources to be directed to components withmultiple or morecritical failures. Sudadiyo et al. [37] proposed a classificationmethod for the first group of centrifugal pump subcompo-nents using FMEA to determine maintenance level criteria.As part of a preventive maintenance strategy, Palei et al.[38] analysed failure-mode effects with real-world opera-tional data. At the earliest mean time to failure (MTTF)in their study, reliability-centred maintenance was imple-mented on a cluster of critical-failure components. In anattempt to evaluate the failure potential of aircraft wings,Gholizadeh et al. [39] proposed an analysis based on failuremodes and failure analysis in criticality. An optimal designcan be achievedwhen reliability,maintenance, and repair fac-tors are considered in a risk assessment model. A method forpreventing unplanned downtime incidents was described by[40]. Using FMEA, they made maintenance schedules thatreduced unexpected downtime by predicting the conditionsof each component in the production line. The system takes abreak if one of its components or parts fails or is undergoingmaintenance. Moreover, a maintenance planning and pro-duction scheduling tool was developed by [41] using FMEAanalysis. In this study, amachinewas consideredwithmatch-ing components, however, if one component failed, the entiremachine might also fail, therefore halting production.
2.2.2 Different Structures in Maintenance
For system reliability analysis, there are different structuresavailable in the literature that can be used to analyse reliabil-ity and maintenance, for example, a fault tree structure. It isused for analysing failures caused by various factors basedon their representation in the form of a tree [42]. The faulttree structure is used to measure a system’s reliability, wherea top-down approach is used to identify the root causes of anysystem failure [43–45]. Fault Maintenance Trees (FMTs) arediscussed in reference [46, 47] as structures that allow man-agers to manage total maintenance costs and reliability whilemaintaining the availability of a system. While the fault treeis commonly used for the analysis of systems failuremodes, itis a complicated process and the data flow is not represented.
Another structure to assess the reliability of continuoussystems under fatigue and corrosion failure conditions [48]used structural health monitoring data. In their study, ABayesian inference method was applied to determine thestructural reliability. The concept of graph structure was usedby [49] to develop new models and algorithms for assessingthe reliability of a system composed of multiple components.By using the Hasse diagram, these developments exploit agraphic representation of the order relation between the statesof the system components. Despite using graphical represen-tations of functional requirements, this approach does not usethem for safety analysis because they are not detailed.
123
Arabian Journal for Science and Engineering
Although all these methods are a good, readily availablestructure to evaluate the reliability and maintenance of com-plex systems, the continuity of system outputs is not takeninto account. Thus, to refine the approach that has been pre-viously proposed, this paper uses the FMEA structure.
2.2.3 The Role of FMEA in Maintenance
The FMEA method for failure analysis has been used in thepreviously mentioned studies. However, the studies have notused the FMEA block-based PM concept to maintain thecontinuity of the system outputs. Furthermore, the procedureused in the system analysis is not effective for understandinghow the system works, or the impact of failure on the wholesystem. For example, the work safety risk analysis is carriedout and recommendations of ideal maintenance actions to betaken are detailed in a report to control the risks identifiedduring the failure process observation in the production sys-tem, which is completely different to our approach in thispaper. In other words, they did not consider the FMEA blockconcept to keep the system’s output continuous during main-tenance activities. This concept is to model and identify thecomponents that have the same failure effect and then groupthem into blocks based on failure modes and the impact ofthese failure modes on the rest of the components. Throughthis technique, we can avoid the replacement of unnecessarycomponents, which may affect the other components in thesystem, causing production system stoppages, lost produc-tion costs, and high total maintenance costs.
Given the above discussions, an interesting avenue for thecurrent study is to maintain production outputs even partiallyduring maintenance activities with a high level of reliability.Focusing on failure mode modelling of the production sys-tem, Alamri et al. [50] have proposed a method to determinethe preventive replacement intervals using the meantime-to-failure values for groups of components as blocks in thecomplete system to prevent frequent breakdown failures.Based on the FMEAblock concept, the proposedmethodwasshown to arrive at a satisfactory solution where continuousproduction outputs are maintained and the system mainte-nance costs are optimised. This is achieved by exponentialfailure distribution, which also enables further investigationswith more reliability-oriented distribution functions insteadof the exponential failure function.
In this paper, we propose failure-modes-based preventivemaintenance scheduling using theFMEAmethod. The objec-tive is to maintain continuity of the complete productionsystem while optimising maintenance costs and achievinga maximum level of system reliability.
The novelty and contributions of this work can be sum-marised as follows:
1. Developing a holistic preventive maintenance scheduleusing FMEA for a complete complex system.
2. Using the FMEA modelling, it is then possible todetermine, for the complete complex system, multi-ple nonidentical series–parallel component relationshipsgoverning production capacity in the case of componentfailure (FMEA block concept).
3. With respect to the constraint of reliability, this researchwork analyses the reliability of a complete complex sys-tem consisting of multi-nonidentical components usingWeibull distribution.
4. Unlike the above literature review, we use a groupreplacement strategy in the form of matrices to treatthe components separately and then we have to integratethem according to the FMEA block.
5. The results are validated from an illustrative example ofa real case.
3 Notations and Abbreviations
Before giving the description of our strategy, we introducethe following notations and abbreviations that will be usedthroughout the paper.
CM Cost of a failure replacementPM Cost of a preventive replacementβi Weibull shape parameter for component iηi Weibull scale parameter for component iT Preventive maintenance PM intervalT x Optimum value of TS Spare partsRi (t) Reliability function of component iFi (t) Cumulative distribution function of component iDTC Block downtimeLC Labour cost at CMPLs Cost of lost productionRsei (T ) Reliability function of the i components in series
configuration at TRpai (T ) Reliability function of the i components in parallel
configuration at TRBz (T ) Reliability function of the z FMEA BlocksRsys(T ) System reliabilityPN Number of laboursPRtime Required time to replace components at PMPC Person cost per hour for PMQ Affected components by failureSH Shutdown cost of rest componentsPLr Lost production for qth componentsCRtime Required time to replace components at failureTcost(T ) Total maintenance cost of FMEA BlockAcostz Annual total maintenance cost of FMEA Block
123
Arabian Journal for Science and Engineering
f Total number of PM during the planning period tT Scost Total maintenance cost of the system
4 System Reliability
In order to maintain the continuity of production system out-puts, the analysis and improvement of the entire system’sreliability should be taken into account. The reliability ofa system is determined by how probable it is to perform aneeded function under a given set of conditions during agiven time period, t. By choosing the right parameters, theWeibull distribution can provide a great deal of flexibility formodelling various types of failure rate behaviours [51]. In thisstudy, the reliability function is determined by the Weibullanalysis. Based on Eq. (1), the reliability of components insystem is determined as:
Ri (t) � exp
[−
(t
ηi
)βi]
(1)
The shape parameter βi (aging property) plays a key role indetermining what strategies should be used for part replace-ment and maintenance in addition to modelling differentsituations. Let t be the lifetime of each i component, wheret is a Weibull distribution with the shape parameter, βi , andthe scale parameter, ηi .
The reliability function of the i components in series con-figuration is considered, which can fail at the failure of anyone of the components. At the interval of preventive mainte-nance, the reliability can be calculated as follows:
Rsei (T ) � e−
[(Tη1
)β1+(
Tη2
)β2+···,
(Tηn
)βn]
(2)
where i(i � 1, . . . , w), w represents the number of seriesarrangements.
In this research, at least one series of components mustsucceed in a parallel arrangement to ensure the block suc-cessfully works. Thus, the reliability at T for componentsconnected in parallel connection is calculated as:
Rpai (T ) � [1 − (
1 − Rse1 (T ))(1 − Rse2 (T )
)(1 − Rsew (T )
)](3)
where i(i � 1, . . . , v), v represents the number of parallelconfigurations.
In order to analyse the effect of PM interval of the FMEAblock on the reliability, Eqs. (2) and (3) can be combined intoEq. (4), where RBz (T ) corresponds to the reliability functionfor the block whether in series, or series–parallel arrange-ment. Therefore, if the block only consists of one type of
configuration, for example series, in this case the Rpai (T ) isequal to 1. This means only the Rsei (T ) will be calculated.
RBz (T ) � [Rsei (T )
]Rpa1(T )Rpa2(T ) . . . , Rpav (T ) (4)
where z � 1, 2 . . . , z, represents the number of blocks.A component’s failure probability is defined by the cumu-
lative distribution function for a Weibull distribution. In thiscase, the reliability at replacement time can be evaluated bysubtracting the probability of failure from 1 and given by:
Fi (t) � 1 − Ri (t) (5)
Therefore, the system reliability Rsys(T ) can be defined asEq. (6).
Rsys(T ) � 1 − (1 − RB1(T ))(1 − RB2(T )) . . . , (1 − RBz(T )) (6)
The above equation is for blocks in parallel to determinethe reliability of the whole system. Assuming the minimumallowable reliability value for system is RR, the reliabilityconstraint of the optimisation model is
Rsys(T ) ≥ RR (7)
5 Preventive Maintenance SchedulingOptimisation
In the previous section, we examined the concept of reli-ability for a complete system. The aim of this section isto establish a preventive maintenance schedule, which willhelp optimise the maintenance costs while meeting the reli-ability requirements. The maintenance scheduling problemconsists in definingwhen to stop the FMEAblock for preven-tive replacement while maintaining system continuity. For acomplete system consisting of N number of non-identicalcomponents the system will not stop completely if any ofthese components is under maintenance or fails. The replace-ment of all components is applied simultaneously when thepreventive maintenance of a group of components (FMEAblock) reaches its optimal interval T x . This is based onunderstanding a potential failure mode of system compo-nents. When a component has a failure, it might affect theother components in the same production line system. Theinformation will be provided in FMEA models that describecomponents and their configurations. In this way, componentmaintenance can be planned more effectively.
123
Arabian Journal for Science and Engineering
5.1 General Assumptions
It is important to simplify the system because the systemcomponents are complex and there are many variables.
Assumptions
– Replacement maintenance does not stop the entire produc-tion system.
– A Weibull distribution is assumed for production systemcomponents.
– Planned maintenance costs occur when a group of compo-nents are replaced at the optimal time, and the reliabilityof such replacement is R%.
– The time measured is in hours, and all system componentsare replaced preventively in groups at an optimal time.
– Any component is new at the start (t � 0).– After each replacement, each component in the systemwillbe as good as new.
5.2 Total Maintenance Cost
The purpose of this section is to develop a multi-mode math-ematical model in the form of matrices for calculating thecost of maintaining a production system using a group pre-ventivemaintenance schedule.Maintenance costs are dividedinto many categories. The following sub-sections provide anexplanation of the constituent maintenance costs.
5.2.1 Mathematical Model
The general block replacement strategies for a single com-ponent and identical components have been widely detailedin literature [52]. The model assumes that replacement ofcomponents will take place at regular intervals of time withfailure replacements performed as necessary. The componentbecomes as good as new after each replacement. Whenevera failure occurs during a cycle, it is immediately replaced.The goal is to minimise the total replacement cost per unitof time by optimising the interval between the replacements.With system complexity, the replacement policy for a singlecomponent is insufficient to support complex systems main-tenance. In this research, the mathematical model is used as agroup replacement strategy. The cost of replacing a group ofnon-identical components under preventive replacement con-ditions is assumed to be lower than replacement costs underfailure conditions. The matrix model considers an optimalintervalwhichminimises the average cost rate and guaranteesreliability by controlling the failure rate to a certain extentwithin acceptable limits. By considering the above two goals,we aim to calculate the replacement for the FMEA blocksbased on system failure modes, where T x is the optimal time
interval between group replacements in preventive mainte-nance events.
In this model, preventive replacement means that compo-nents in one FMEA block are replaced simultaneously at theend of each maintenance cycle length T . Thus, the expectedreplacement cost is given by:
Tcost � [PM + (F(T ).CM)]1
T, T > 0 (8)
5.2.2 Model Analysis
The optimal preventive maintenance interval T x is reachedwhen the breakdown costs are more costly than the costfor planned replacement for all group components with anincreasing failure rate. In order to achieve the most economicbalance between replacement costs and failure costs, the opti-mal preventive maintenance interval is determined.
A preventive maintenance cost is computed by using thefirst expression PM during the interval T , so that compo-nents are returned to a good-as-new state. Downtime costsof PM are incurred when components need to be replaced asa preventative measure. It includes the number of labourersneeded PN, cost, and a required time to replace componentsPRtime. Thus, the matrix can be represented as follows:
PM � PC · PN · PRtime (9)
where PC denotes person cost per hour and is defined asa matrix of column n × 1. PN and PRtime are defined as aconstant value.
For the second expression, F(T ) represents the expectedfailure time during interval (0, T ) at the assumption ofWeibull distribution, and can be given by diagonal matrix:
F(T ) � diag
⎡⎢⎢⎢⎢⎢⎢⎢⎣
1 − e−
(Tη1
)β1
0 . . . 0
0 1 − e
(Tη2
)β2
. . . 0...
.... . .
0 0 1 − e
(Tηn
)βn
⎤⎥⎥⎥⎥⎥⎥⎥⎦(10)
CM is the cost of a failure replacement including spareparts, labour cost, downtime cost and shutdown cost, andis expressed as Eq. (11):
CM � (S + LC + DTC + SH) (11)
Themaintenancemodel is based on the assumption that spareparts are available at all times. In order to define the spareparts variable, we must acknowledge that spare parts have
123
Arabian Journal for Science and Engineering
various costs, and that storage and delivery are not additionalcosts. Thus, S as n × 1 column matrix can be represented asfollows:
S �
⎡⎢⎢⎢⎢⎢⎢⎣
s1s2s3...sn
⎤⎥⎥⎥⎥⎥⎥⎦
(12)
System components fail unexpectedly after they begin oper-ating at T > 0. A component must be replaced when it fails.The failure will have a significant impact on other compo-nents in the same line. When a failure occurs, downtime isshown asDTC, including replacement time, labour cost LC,and cost of lost production PLs (n × 1). Calculating the costof labour and downtime can be done by using the followingformulas:
LC � P · C · CRtime (13)
where C is the hourly cost of a person (constant) and P is thenumber of workers in (n × 1) column matrix. Then,
DTC �
⎛⎜⎜⎜⎜⎜⎜⎝
⎡⎢⎢⎢⎢⎢⎢⎣
PLs1PLs2PLs3...
PLsn
⎤⎥⎥⎥⎥⎥⎥⎦
.CRtime
⎞⎟⎟⎟⎟⎟⎟⎠
+ LC (14)
In some cases, the shutdownmay affect some system compo-nents due to their dependency.Whenever one component in aseries configuration fails, for example, all other componentsin the same arrangement are shut down.
In this model the Q matrix components are those that areaffected by the failure of another component. Componentsare defined by the rows of the matrix. For example, row-1is component A, row-2 is component B, and so on. Thesecolumns represent the influence one component’s failure hason the other components in the system. It takes the value1 if the failure of one component affects the functioning ofanother, otherwise it takes the value 0 and can be obtainedas:
Q � w(i)(q) (15)
Since all components of the matrixw are unaffected by theirown failure, all the diagonal elements are zero. If ith compo-nent failure affects qth component, the matrix elements willcontain value 1, otherwise the matrix elements will contain
value 0. Thus:
PLr � Q · PLs (16)
where the sum of lost production for qth component is rep-resented by PLr per hour, and SH denotes the shutdowncost of rest components. Once PLr is computed, SH can becalculated as:
SH �
⎡⎢⎢⎢⎢⎢⎢⎣
PLr1PLr2PLr3...
PLrn
⎤⎥⎥⎥⎥⎥⎥⎦
.CRtime (17)
Therefore, maintenance costs are evaluated for each FMEAblock, and all costs are given inAUD.Based on the configura-tion of the production system and the previously formulatedequations, the optimisationmatrixmodel with the total main-tenance costs can be presented as:
minTcost (T )
� [PC ∗ PN∗Rtime + [F (T ) (S + LC + DTC + SH)]]
∗ 1
T(18)
(18)
To find the optimal maintenance time, it is necessary to min-imise the expected cost per time unit.
Identify: T x .minimising: Tcost(T ).subject to: Rsys(T ) ≥ RR.According to the two equations for maintenance cost and
system reliability, there is an optimal maintenance replace-ment interval, T x , that meets the objective of preventivemaintenance subject to reliability. The total cost of the sys-tem is calculated by adding up all the cost components, andthe overall reliability is determined by the reliability of indi-vidual blocks.
5.2.3 Exhaustive Search Optimisation Method
Tcost(T ) is a function of a single variable T , therefore thealgorithm following the exhaustive search method has beendeveloped to determine an optimal preventive maintenanceinterval for each FMEA block. This method searches theentire design space and the minimum value of objectivefunction obtained among these evaluations is declared as theminimum of the function [53]. In a degradation case whenβ > 1, the preventive term decreases while the correctiveterm increases. This results in a convex cost function. Anillustration of the procedures appears in Fig. 1. Details aredescribed below.
123

Arabian Journal for Science and Engineering
Fig. 1 Flowchart for the optimisation procedures
Step 1 Give the preventive replacement cost PC, PN andPRtime as well as the breakdown replacement cost S, P, C,CRtime,Q, and PLs for every component in system. Allocatethe η and β parameters of the Weibull distribution for eachcomponent.
Step 2 Determine FMEA block z. In this step we definethe FMEA block to be examined in the simulation model.
Step 3 Calculate the expected total cost Tcost(T ).Based on the FMEA block, Eq. (18) is applied to calculatethe total PM cost for components. At this point, the iterationprocess is used to optimise the time for a block by comput-ing the total cost of several different preventive maintenanceschedules at every time value during the specific period timet. Then, the maintenance interval of the block of componentsis optimised based on the sum of maintenance cost.
Step 4 Determine the configuration type of block z,whether series or parallel, or both.
Step 5 Calculate overall system reliability Rsys(T ) fromEq. (6). In this step, reliability is calculated based on indi-vidual FMEA blocks. It depends on the arrangement of thecomponents in the production line, for example, series orseries parallel.
Step 6 Determine an optimal interval T x .Step 7 Find the annual totalmaintenance cost for the block.
Where T x is the optimal maintenance interval, let f be thetotal number of preventive replacements during the planning
period t, which can be obtained as following:
f � t
T x, an integer (19)
Thus, the annual totalmaintenance cost for eachFMEAblockis:
Acostz � Tcost(T ) ∗ f (20)
Step 8 Update z � z + 1 and repeat steps (2)–(9) until z �Z .
Step 9 Calculate the total maintenance cost of system.Using Eq. (23), the total maintenance cost of the system iscalculated based on the sum of annual maintenance costs fornumber of blocks z as follows:
T Scost �z∑
i�1
Acostz (21)
6 Case Study
This article illustrates the proposed method by examining areal case of a production line system. The production systemconsists of ten production lines. Each line contains a set ofmachines and straws that are linked in series with powerconverters and shrink units.
The entire production system operates in a series and par-allel arrangement. All parts of the system should be runningto sustain its necessary operation, but the failure of any ofthe system’s components will not cause the entire system tofail.
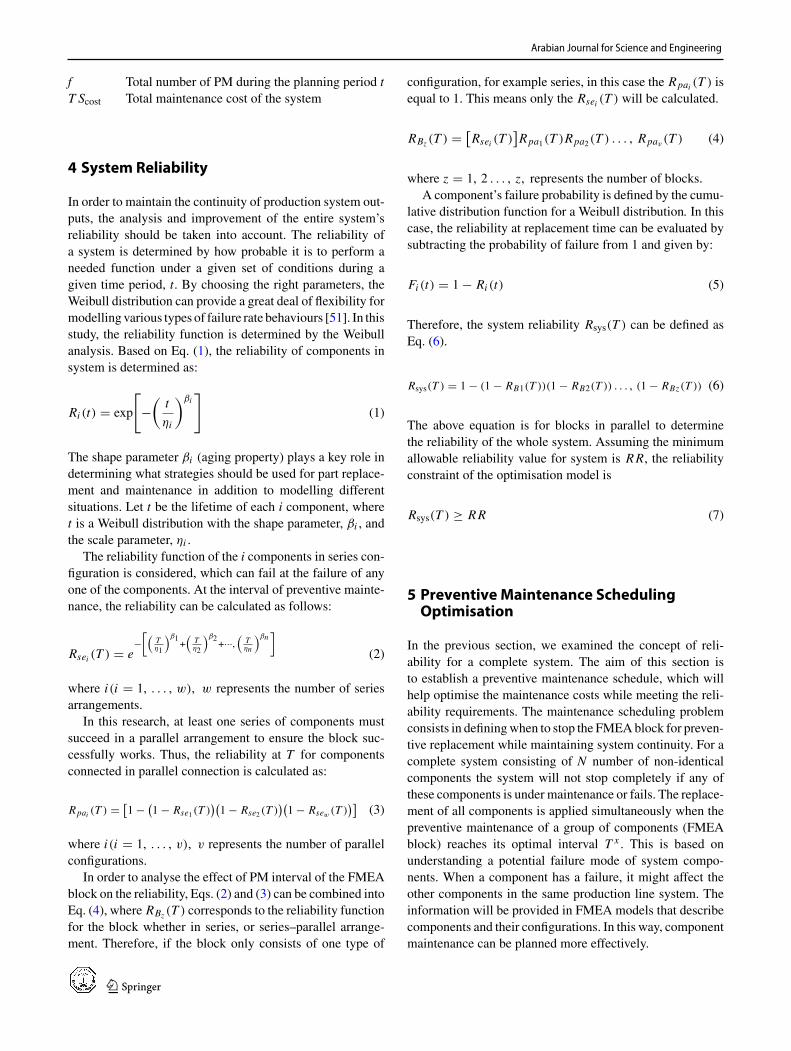
To capture the FMEA models of the production system,we used Maintenance Aware Design environment (MADe)software, which is an engineering decision support tool thatproduces a system model composed of functions, modules,components, and their interactions. In particular, the mainbenefit of this software lies in its ability to produce a detailedfunctional model of the system that can be used to investigatefailure propagation [54]. The components of the produc-tion system are modelled using blocks, and any functionalconnections between them are represented using the linesbetween the blocks. The purpose of this description is toassess the impact of a functional failure using functions andflows in a functional model. The functions of each compo-nent, as well as its connections to other model elements,are used to detect causal relationships and propagate failureconsequences throughout the model. As a result, potentialfailure modes can be identified, and their failure effects aredocumented. The red, green, and blue connections represent
123

Arabian Journal for Science and Engineering
Fig. 2 Production system FMEA model captured in MADe
functional connections between system components, as seenin Fig. 2.
This research examines a production system that consistsof 40 components. It is composed of ten subsystems, num-bered 1–10. Each machine in the production line containsa series of two components; see Fig. 3. If any componentstops, whether for maintenance or failure, the machine willstop immediately, and thus the production line will stop. Inthe production line, the remaining components complementeach other.
6.1 System Data
In this case study, the reliability requirement for the systemis set at RR% � 99%. A component’s characteristic life canbe enhanced significantly with planned maintenance. The
system blocks B1, B2, B3, B4 and B5 were organised basedon characteristic life values; see Fig. 4.
Table 1 presents the data of spare parts cost (in AUD)and β on the system components example, which have beenused for this analysis. Maintenance activities and downtimeare included in the total cost of simultaneous preventivemaintenance actions of FMEA blocks. Maintenance costsinclude the cost of spare parts and labours. At the time ofthe planned maintenance execution, it is assumed that therewill be enough maintenance workers available. Based on theassumption that labour costs $500, the total cost of preventivereplacement is determined (3 people, 1 h each). For purposesof calculating the corrective maintenance cost, labour costsare assumed to be $500 (5 workers—5 h each—25 h total).The lost production cost is also assumed to be $900.
123

Arabian Journal for Science and Engineering
Fig. 3 Machines 1–10elements—FMEA modelcaptured in MADe
The algorithmmethod described in Sect. 5.2.2 can be usedto compute the total maintenance cost. To implement theproposed mathematical model for obtaining the optimal PMschedule, MATLAB software was used to simulate the costmodel and optimise the replacement time for a group of com-ponents.
7 Results and Discussion
Once the production line system is modelled in MADe, afunctional block diagram is used to specify the function andfailure mode for each component. As a result of failure anal-ysis, a propagation analysis is performed on the modelledsystem, and over time each component is assessed for itstransient response to failure potential that can arise duringthe production system. Afterwards, they are sorted by theircriticality. The failure propagation indicates how many com-ponents of the production system are affected, whether bypartial or complete failures.
7.1 Complete Failure of the System
Failure propagation is simulated in this system to determinethe negative effects that failure has on a given system. Injec-tion of low or high responses by a single component canpropagate failure throughout the entire system (see Fig. 5).Therefore, this will provide enough picture of how thissystemworks and how it will fail. Based on FMEA, the com-ponents that fail together are identified in blocks. Each blockdescribes how a failure due to one component affects theother components in the same arrangement.
7.2 Partial Failure of the System (FMEA Block 1)
The approach presented in this section simulates the partialfailure propagation to assess how failure modes will affectthe system. FMEA block 1 contains components that work
together in series arrangement, and any failure of one com-ponent leads to the line of Machine 1 to stop completely.Because of this, it is not reasonable to shut down all of block1 to replace just one component and then restart it. In thiscase, the maintenance replacement for the group of compo-nents is applied. This implies that when maintenance begins,the other machines in the system will continue to function.
It can be seen from the FMEA model (Fig. 6) that fail-ure of Power Converter A negatively impacts only block 1.As the simulation model is run, the numbers in the modelshow where the fault began and where it ended in the definedsequence. Therefore, the system still contains some workingcomponents so that means it can continue to function.
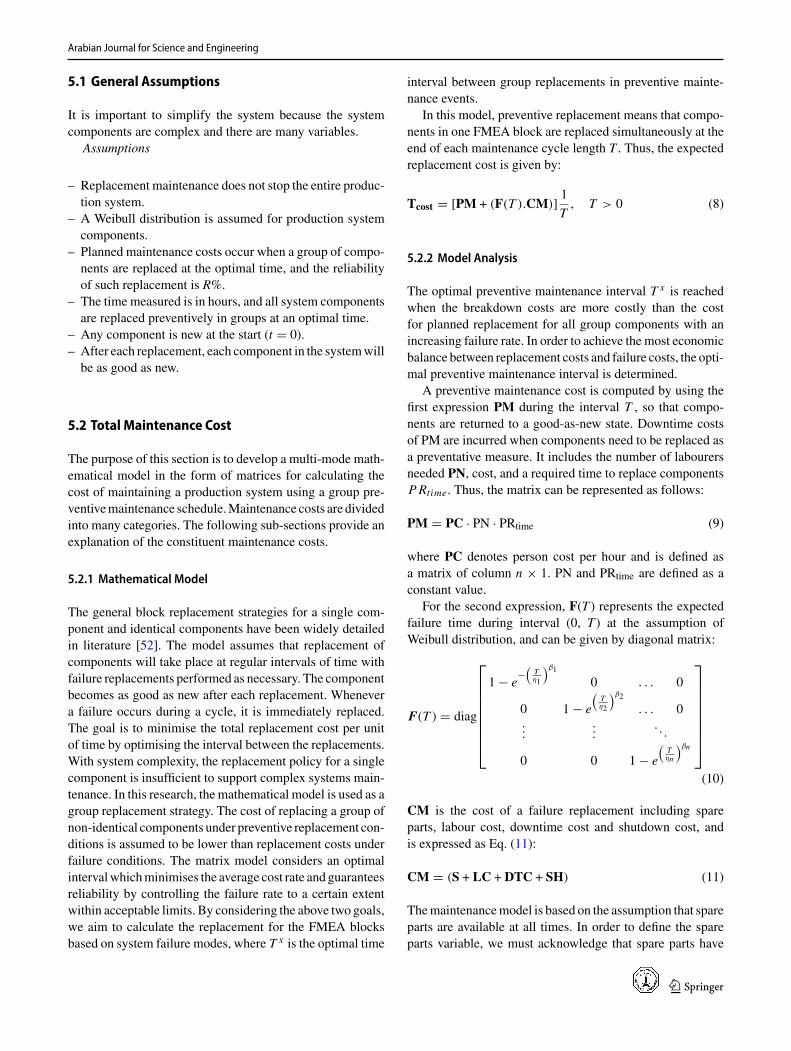
7.2.1 Block 1: Optimal PM Schedule
By minimising the total expected replacement cost per unitof time, the optimal preventive replacements interval is deter-mined usingEq. (19). In Fig. 7 the curve graphs illustrate howPM and reliability have changed over time. The rate of costdecreases as time increases until the minimum cost of $18.20per hour at T x � 619 hwith reliability of 90%, where the ratethen increases again. Preventive replacement occurs for thisgroup of components every 688 h during the given periodof 2000 h (one year), which means that the components arereplaced twice. Thus, by using Eq. (21) the Acost is $54.59.The reliability of this block starts to drop significantly afteroptimal time. This means that replacing the components as agroup once at the specified optimum time will contribute tomaintaining the reliability of the block at an acceptably highlevel.
7.3 Partial Failure of the System (FMEA Block 2)
The failure of the first or last components, in contrast, willstop the block2 line completely, as they are arranged in series.In this block, Power Converter B and Shrink Unit B are con-sidered more critical compared to the other components inthe middle, because they can affect other components in the
123

Arabian Journal for Science and Engineering
Fig. 4 Characteristic life ofcomponents of the productionsystem
24832900
25982833
2490
30442578
29242989
2687
307125982632
23332730
2400
28982566
2701
30012558
2342
20002457
22212390
2641
28782277
30082659
2750
31542658
2301
23101787
26542199
2450
0 500 1000 1500 2000 2500 3000 3500
Shrink Unit EPower Converter E
Straw Unit V 10Servo-motor MZ 10
Jaw Unit MZ 10
Shrink Unit DPower Converter D
Straw Unit V 9Servo-motor MZ 9
Jaw Unit MZ 9
Straw Unit 8Servo-motor MZ 8
Jaw Unit MZ 8
Straw Unit 7Servo-motor MZ 7
Jaw Unit MZ 7
Straw MD 6Servo-motor MD 6
Jaw Unit MD 6
Straw Unit 5Servo-motor MD 5
Jaw Unit MD 5
Power Converter CShrink Unit CStraw Unit 4
Servo-motor MD 4Jaw Unit MD 4
Shrink Unit BPower Converter B
Straw Unit 3Servo-motor MK 3
Jaw Unit MK 3
Straw Unit 2Servo-motor MK 2
Jaw Unit MK 2
Power Converter AShrink Unit AStraw Unit 1
Servo-motor MK 1Jaw Unit MK 1
Time (hrs)
Characteris�c Life of Components
Machine 7
Machine 9
Machine 10
Machine 8
Machine 5
Machine 4
Machine 3
Machine 2
Machine 1
Machine 6
123

Arabian Journal for Science and Engineering
Table 1 Shape parameter ofsystem components Components S β Components S β
Jaw Unit MK 2 $934 2.16 Straw Unit 4 $857 2.08
Servo-motor MK 2 $1008 2.17 Jaw Unit MD 5 $809 2.11
Jaw Unit MK 1 $949 2.9 Straw Unit 1 $600 3.19
Jaw Unit MK 3 $1024 2.05 Straw Unit 5 $795 2.02
Servo-motor MK 3 $995 2.12 Power Converter C $1599 2.24
Straw Unit 3 $863 2.01 Shrink Unit C $1198 2.19
Power Converter B $1411 2.32 Jaw Unit MZ 7 $982 2
Shrink Unit B $1244 2.28 Servo-motor MZ 7 $1201 1.81
Jaw Unit MD 6 $867 1.9 Straw Unit 7 $792 1.9
Servo-motor MD 6 $1090 2.13 Jaw Unit MZ 8 $1113 2.07
Power Converter D $1644 2.11 Servo-motor MK 1 $1146 3.33
Shrink Unit D $1108 2.17 Straw Unit 8 $874 2.11
Straw Unit 6 $907 2.04 Jaw Unit MZ 9 $884 2.19
Jaw Unit MD 4 $725 2.1 Servo-motor MZ 9 $1000 1.78
Servo-motor MD 4 $1064 1.97 Straw Unit-V 9 $991 1.84
Shrink Unit A $1067 2.98 Shrink Unit E $1208 3.22
Servo-motor MZ 8 $1198 1.99 Power Converter E $1318 3.28
Straw Unit 2 $1107 1.83 Jaw Unit MZ10 $1057 2.89
Power Converter A $1321 2.95 Servo-motor MZ10 $1156 2.97
Servo-motor MD 5 $1121 2 Straw Unit-V 10 $989 2.92
event of scheduled preventive maintenance stops or a suddenfailure (see Fig. 8). If Power Converter B fails, the failurewill affect the other components in the same arrangement,for example Machines 2 and 3. This means that the systemwill not stop working completely, and therefore the effect offailure on the system will be partial.
7.3.1 Block 2: Optimal PM Schedule
By using Eq. (19), Fig. 9 illustrates the optimum replacementtime for block 2 components at T x � 608 h with minimumcost of $37.77 per hour. Based on T x , the reliability of thisblock is 91.2%. Preventive replacement occurs for this groupof components every 608 h during the given period of 2000 h(one year), which means that the components are replacedtwice. Thus, by using Eq. (21) the Acost is $113.31. After theoptimal time, the reliability of this block starts to decline sig-nificantly. Therefore, replacing all components in this blockat the specified optimum time will increase the block’s reli-ability.
7.4 Partial Failure of the System (FMEA Block 3)
Another failure mode that shows the partial impact of failureon the system is when failure occurs at Shrink Unit C orPower Converter C. The work of block 3 is very similar tothe previous block, but with a different number of machines,
as one line in block 3 runs simultaneously with three otherlines (see Fig. 10). In this case, the whole configuration ofthe line such as Machines 4, 5 and 6 will stop working. Thus,there is no significant impact on the block itself if any ofthe components in the middle fail, as there is still a highlevel of reliability. However, the failure of a component likePower Converter C or Shrink Unit C would stop the blockfrom functioning completely. Thus, the replacement of allcomponents is carried out at the same time.
7.4.1 Block 3: Optimal PM Schedule
Based on FMEA block 3, it can be seen that stopping to carryout maintenance will not affect the rest of the components inthe system, so it will not affect the overall system’s opera-tion. It will continue to operate, and the outcome will not beaffected by the reduction in operational capacity. Figure 11shows a rapid decline in the cost rate at the beginning. Atthis point, it has reached the minimum cost value of $59.29per hour at the optimal interval of T x � 542 h. As timepasses, cost values gradually increase and approach a certainnumber. The annual cost for this block is $177.87, while thereliability based on T x is 91.2%.
123

Arabian Journal for Science and Engineering
Fig. 5 Production system FMEA model simulated with complete faults captured in MADe
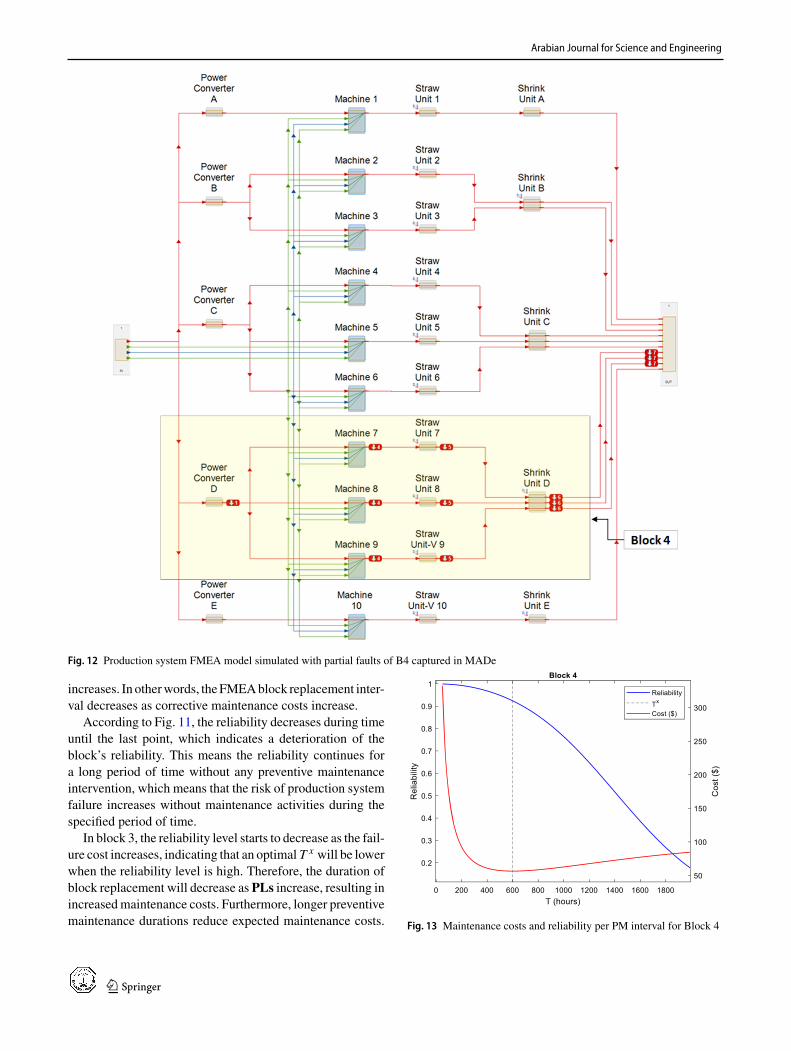
7.5 Partial Failure of the System (FMEA Block 4)
In Fig. 12, block 4 has no differences from block 3 in howit is designed or in how it responds to the failure of one ofits components. The failure effect of component Power Con-verter D will affect the rest machines in the same block suchas 7, 8 and 9. Depending on their location on the productionline, we can see this effect extends to the rest of all compo-nents. When any component fails, however, such as PowerConverter D or Shrink Unit D, the only block 4 will stopcompletely, and the system won’t be affected.
7.5.1 Block 4: Optimal PM Schedule
Based on the reliability in this block, it is reasonable toreplace the components as a group simultaneously. In this
case, the othermachineswill continueworkingbut the systemcapacity will be lower than before. The tendency in Fig. 13 isthe same as Fig. 11, with the minimum cost value of $56.53per hour and with reliability of 92.4% at optimal T x � 901 h.The replacement of this block takes place twice annually ata cost of $169.58.
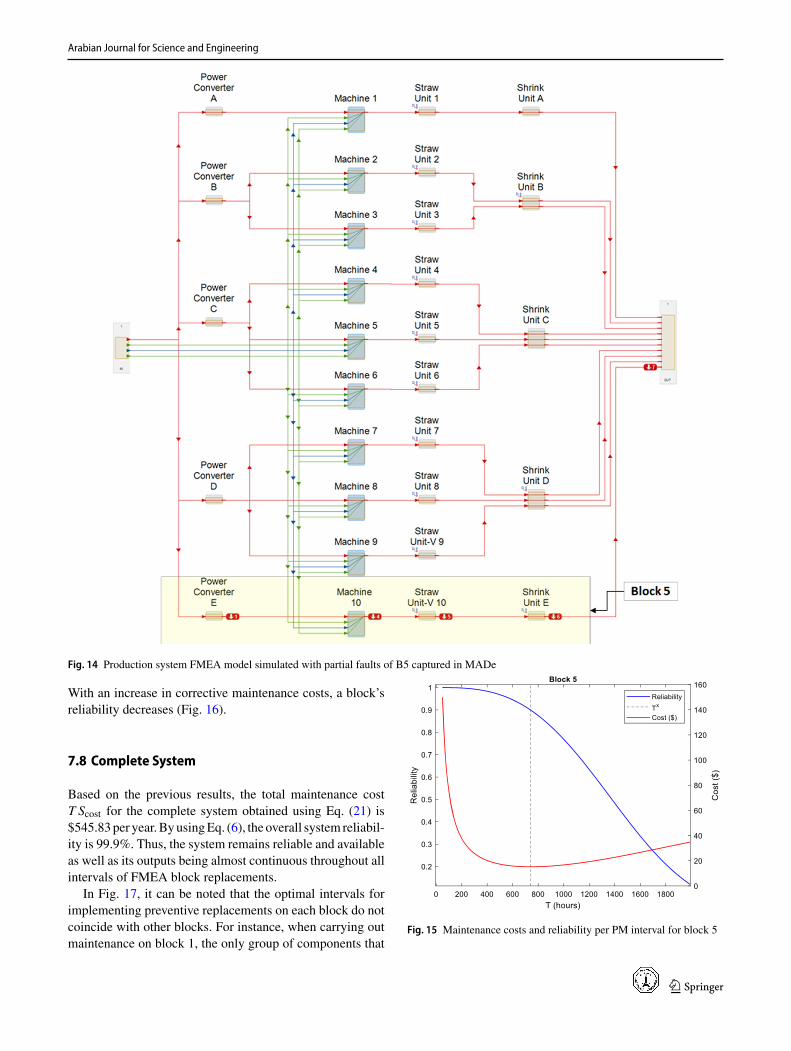
7.6 Partial Failure of the System (FMEA Block 5)
The components in this block are all critical components, asthe failure of any of them will result in the complete shut-down of the block. The failure of this block does not affectthe operation of the system, which operates in parallel (seeFig. 14). As part of the FMEA model, we understand howthese components will function together and how they arecoupled to facilitate maintenance planning. For example, if
123
Arabian Journal for Science and Engineering
Fig. 6 Production system FMEA model simulated with partial faults of B1 captured in MADe
Fig. 7 Maintenance costs and reliability per PM interval for block 1
Straw Unit-V10 fails, Machine 10 will stop running since itworks in one line. However, the other machines in the sys-temwill not be affected. In this situation, the systemwill losesome of its capacity.
7.6.1 Block 5: Optimal PM Schedule
In Fig. 15, the optimal time for a replacement of group ofcomponents in this block is 740 h with minimum cost of$15.24 per hour, while at the same time the reliability is90%. According to this optimal time and period of operationt � 2000, the annual cost is $30.48, assuming replacementoccurs twice a year.
123

Arabian Journal for Science and Engineering
Fig. 8 Production system FMEA model simulated with partial faults of B2 captured in MADe
Fig. 9 Maintenance costs and reliability per PM interval for block 2
7.7 Sensitivity Analysis
From previous Figs. 7, 9, 11, 13 and 15 we can see that thereis a significant difference between preventive maintenancecosts compared with corrective maintenance costs when nomaintenance is performed at T x as they are impacted bythe downtime cost and shutdown of other components in thesame line. For example, the event of failure in the groups ofcomponents that operate in series, such as blocks 1 and 5,willresult in the shutting down of other components, thereby rais-ing the cost of failure. While the situation is totally differentfrom those which operate in series but have internal parallelstructures, such as blocks 2, 3 and 4, where the impact islimited because the failure of one component, for example,Straw Unit 7, only affects those within the same group andthus the cost of the failure is low. However, if the failure
123

Arabian Journal for Science and Engineering
Fig. 10 Production system FMEA model simulated with partial faults of B3 captured in MADe
occurs on one of the critical components such as the PowerConverter or Shrink Unit, the cost of shutdown will be muchgreater due to the number of components that will be affectedin the same block.
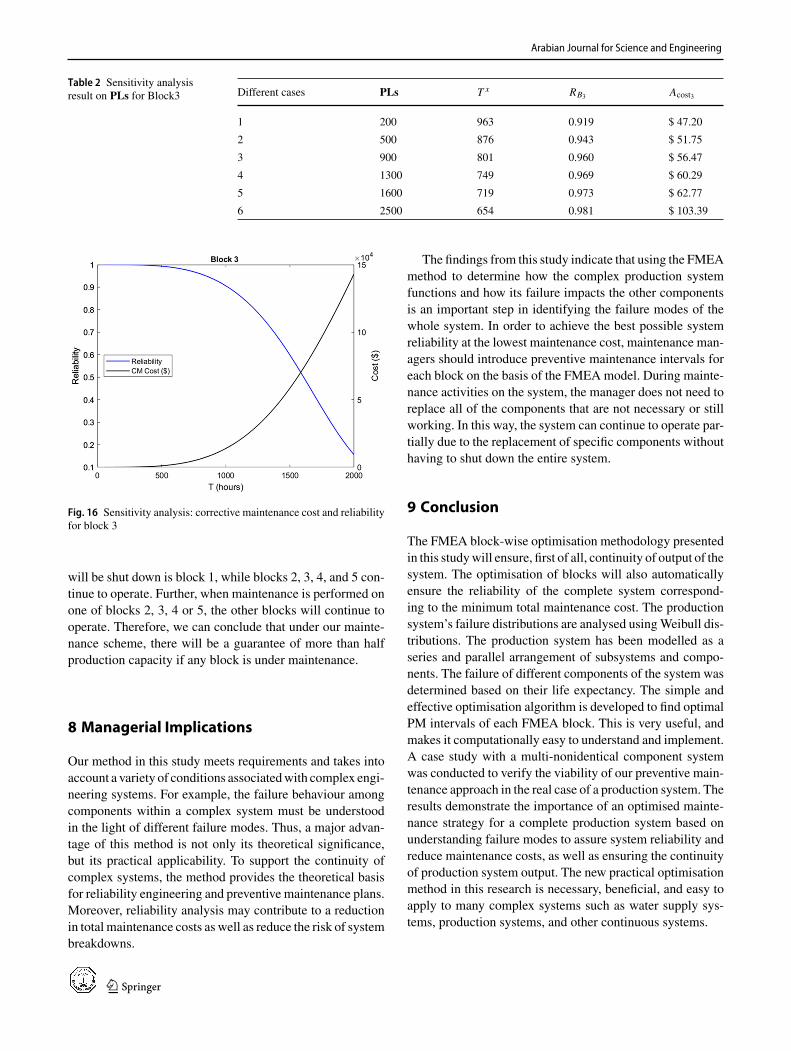
Sensitivity analysis is conducted to see the sensitivity ofthe optimal results to the change of parameter values. Theanalysis was carried out for the production lost cost PLs ofblock 3. Based on different PLs values from $200 to $2500,the optimal FMEA block replacement interval T x , reliabilityand expected cost are presented in Table 2. With an increasein PLs from $200 to $2500, both cost and reliability increase,but the optimal replacement interval decreases. This is rea-sonable since a breakdown cost depends on the expectednumber of failures, which highly depends on the mainte-nance period. That means the solution conforms to the actualinterval in that T x is increasing as the expected failure time
Fig. 11 Maintenance costs and reliability per PM interval for block 3
123
Arabian Journal for Science and Engineering
Fig. 12 Production system FMEA model simulated with partial faults of B4 captured in MADe
increases. In otherwords, theFMEAblock replacement inter-val decreases as corrective maintenance costs increase.
According to Fig. 11, the reliability decreases during timeuntil the last point, which indicates a deterioration of theblock’s reliability. This means the reliability continues fora long period of time without any preventive maintenanceintervention, which means that the risk of production systemfailure increases without maintenance activities during thespecified period of time.
In block 3, the reliability level starts to decrease as the fail-ure cost increases, indicating that an optimal T x will be lowerwhen the reliability level is high. Therefore, the duration ofblock replacement will decrease as PLs increase, resulting inincreasedmaintenance costs. Furthermore, longer preventivemaintenance durations reduce expected maintenance costs. Fig. 13 Maintenance costs and reliability per PM interval for Block 4
123
Arabian Journal for Science and Engineering
Fig. 14 Production system FMEA model simulated with partial faults of B5 captured in MADe
With an increase in corrective maintenance costs, a block’sreliability decreases (Fig. 16).
7.8 Complete System
Based on the previous results, the total maintenance costT Scost for the complete system obtained using Eq. (21) is$545.83per year.ByusingEq. (6), the overall system reliabil-ity is 99.9%. Thus, the system remains reliable and availableas well as its outputs being almost continuous throughout allintervals of FMEA block replacements.
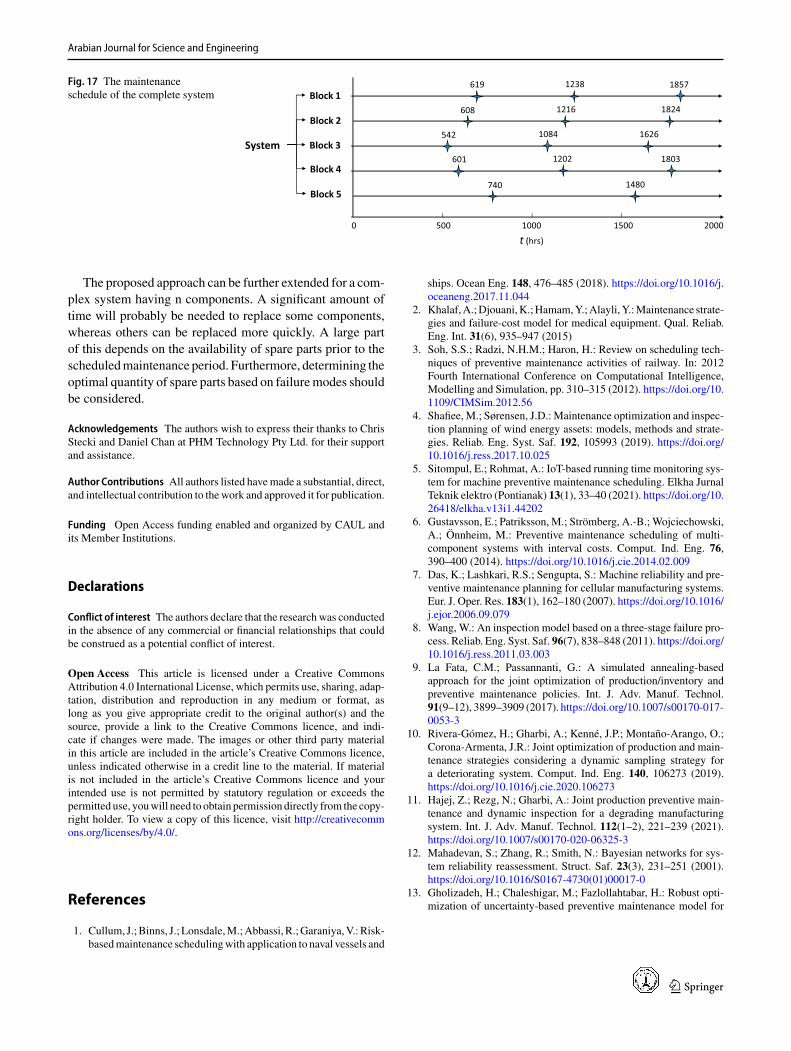
In Fig. 17, it can be noted that the optimal intervals forimplementing preventive replacements on each block do notcoincide with other blocks. For instance, when carrying outmaintenance on block 1, the only group of components that
Fig. 15 Maintenance costs and reliability per PM interval for block 5
123
Arabian Journal for Science and Engineering
Table 2 Sensitivity analysisresult on PLs for Block3 Different cases PLs T x RB3 Acost3
1 200 963 0.919 $ 47.20
2 500 876 0.943 $ 51.75
3 900 801 0.960 $ 56.47
4 1300 749 0.969 $ 60.29
5 1600 719 0.973 $ 62.77
6 2500 654 0.981 $ 103.39
Fig. 16 Sensitivity analysis: corrective maintenance cost and reliabilityfor block 3
will be shut down is block 1, while blocks 2, 3, 4, and 5 con-tinue to operate. Further, when maintenance is performed onone of blocks 2, 3, 4 or 5, the other blocks will continue tooperate. Therefore, we can conclude that under our mainte-nance scheme, there will be a guarantee of more than halfproduction capacity if any block is under maintenance.
8 Managerial Implications
Our method in this study meets requirements and takes intoaccount a variety of conditions associatedwith complex engi-neering systems. For example, the failure behaviour amongcomponents within a complex system must be understoodin the light of different failure modes. Thus, a major advan-tage of this method is not only its theoretical significance,but its practical applicability. To support the continuity ofcomplex systems, the method provides the theoretical basisfor reliability engineering and preventive maintenance plans.Moreover, reliability analysis may contribute to a reductionin total maintenance costs as well as reduce the risk of systembreakdowns.
The findings from this study indicate that using the FMEAmethod to determine how the complex production systemfunctions and how its failure impacts the other componentsis an important step in identifying the failure modes of thewhole system. In order to achieve the best possible systemreliability at the lowest maintenance cost, maintenance man-agers should introduce preventive maintenance intervals foreach block on the basis of the FMEAmodel. During mainte-nance activities on the system, the manager does not need toreplace all of the components that are not necessary or stillworking. In this way, the system can continue to operate par-tially due to the replacement of specific components withouthaving to shut down the entire system.
9 Conclusion
The FMEA block-wise optimisation methodology presentedin this studywill ensure, first of all, continuity of output of thesystem. The optimisation of blocks will also automaticallyensure the reliability of the complete system correspond-ing to the minimum total maintenance cost. The productionsystem’s failure distributions are analysed usingWeibull dis-tributions. The production system has been modelled as aseries and parallel arrangement of subsystems and compo-nents. The failure of different components of the system wasdetermined based on their life expectancy. The simple andeffective optimisation algorithm is developed to find optimalPM intervals of each FMEA block. This is very useful, andmakes it computationally easy to understand and implement.A case study with a multi-nonidentical component systemwas conducted to verify the viability of our preventive main-tenance approach in the real case of a production system. Theresults demonstrate the importance of an optimised mainte-nance strategy for a complete production system based onunderstanding failure modes to assure system reliability andreduce maintenance costs, as well as ensuring the continuityof production system output. The new practical optimisationmethod in this research is necessary, beneficial, and easy toapply to many complex systems such as water supply sys-tems, production systems, and other continuous systems.
123
Arabian Journal for Science and Engineering
Fig. 17 The maintenanceschedule of the complete system
0 500 1000 1500 2000
619
t (hrs)
Block 1
Block 2608
Block 3
Block 4
Block 5
542
601
740
1238
1626
1803
1824
1480
System
1857
1216
1084
1202
The proposed approach can be further extended for a com-plex system having n components. A significant amount oftime will probably be needed to replace some components,whereas others can be replaced more quickly. A large partof this depends on the availability of spare parts prior to thescheduledmaintenance period. Furthermore, determining theoptimal quantity of spare parts based on failuremodes shouldbe considered.
Acknowledgements The authors wish to express their thanks to ChrisStecki and Daniel Chan at PHM Technology Pty Ltd. for their supportand assistance.
Author Contributions All authors listed havemade a substantial, direct,and intellectual contribution to thework and approved it for publication.
Funding Open Access funding enabled and organized by CAUL andits Member Institutions.
Declarations
Conflict of interest The authors declare that the researchwas conductedin the absence of any commercial or financial relationships that couldbe construed as a potential conflict of interest.
Open Access This article is licensed under a Creative CommonsAttribution 4.0 International License, which permits use, sharing, adap-tation, distribution and reproduction in any medium or format, aslong as you give appropriate credit to the original author(s) and thesource, provide a link to the Creative Commons licence, and indi-cate if changes were made. The images or other third party materialin this article are included in the article’s Creative Commons licence,unless indicated otherwise in a credit line to the material. If materialis not included in the article’s Creative Commons licence and yourintended use is not permitted by statutory regulation or exceeds thepermitted use, youwill need to obtain permission directly from the copy-right holder. To view a copy of this licence, visit http://creativecommons.org/licenses/by/4.0/.
References
1. Cullum, J.;Binns, J.; Lonsdale,M.;Abbassi,R.;Garaniya,V.:Risk-basedmaintenance schedulingwith application to naval vessels and
ships. Ocean Eng. 148, 476–485 (2018). https://doi.org/10.1016/j.oceaneng.2017.11.044
2. Khalaf,A.;Djouani,K.;Hamam,Y.;Alayli,Y.:Maintenance strate-gies and failure-cost model for medical equipment. Qual. Reliab.Eng. Int. 31(6), 935–947 (2015)
3. Soh, S.S.; Radzi, N.H.M.; Haron, H.: Review on scheduling tech-niques of preventive maintenance activities of railway. In: 2012Fourth International Conference on Computational Intelligence,Modelling and Simulation, pp. 310–315 (2012). https://doi.org/10.1109/CIMSim.2012.56
4. Shafiee, M.; Sørensen, J.D.: Maintenance optimization and inspec-tion planning of wind energy assets: models, methods and strate-gies. Reliab. Eng. Syst. Saf. 192, 105993 (2019). https://doi.org/10.1016/j.ress.2017.10.025
5. Sitompul, E.; Rohmat, A.: IoT-based running time monitoring sys-tem for machine preventive maintenance scheduling. Elkha JurnalTeknik elektro (Pontianak) 13(1), 33–40 (2021). https://doi.org/10.26418/elkha.v13i1.44202
6. Gustavsson, E.; Patriksson, M.; Strömberg, A.-B.; Wojciechowski,A.; Önnheim, M.: Preventive maintenance scheduling of multi-component systems with interval costs. Comput. Ind. Eng. 76,390–400 (2014). https://doi.org/10.1016/j.cie.2014.02.009
7. Das, K.; Lashkari, R.S.; Sengupta, S.: Machine reliability and pre-ventive maintenance planning for cellular manufacturing systems.Eur. J. Oper. Res. 183(1), 162–180 (2007). https://doi.org/10.1016/j.ejor.2006.09.079
8. Wang, W.: An inspection model based on a three-stage failure pro-cess. Reliab. Eng. Syst. Saf. 96(7), 838–848 (2011). https://doi.org/10.1016/j.ress.2011.03.003
9. La Fata, C.M.; Passannanti, G.: A simulated annealing-basedapproach for the joint optimization of production/inventory andpreventive maintenance policies. Int. J. Adv. Manuf. Technol.91(9–12), 3899–3909 (2017). https://doi.org/10.1007/s00170-017-0053-3
10. Rivera-Gómez, H.; Gharbi, A.; Kenné, J.P.; Montaño-Arango, O.;Corona-Armenta, J.R.: Joint optimization of production and main-tenance strategies considering a dynamic sampling strategy fora deteriorating system. Comput. Ind. Eng. 140, 106273 (2019).https://doi.org/10.1016/j.cie.2020.106273
11. Hajej, Z.; Rezg, N.; Gharbi, A.: Joint production preventive main-tenance and dynamic inspection for a degrading manufacturingsystem. Int. J. Adv. Manuf. Technol. 112(1–2), 221–239 (2021).https://doi.org/10.1007/s00170-020-06325-3
12. Mahadevan, S.; Zhang, R.; Smith, N.: Bayesian networks for sys-tem reliability reassessment. Struct. Saf. 23(3), 231–251 (2001).https://doi.org/10.1016/S0167-4730(01)00017-0
13. Gholizadeh, H.; Chaleshigar, M.; Fazlollahtabar, H.: Robust opti-mization of uncertainty-based preventive maintenance model for
123
Arabian Journal for Science and Engineering
scheduling series—parallel production systems (real case: dispos-able appliances production). ISA Trans. (2021). https://doi.org/10.1016/j.isatra.2021.11.041
14. Tam, A.S.B.; Chan, W.M.; Price, J.W.H.: Optimal maintenanceintervals for a multi-component system. Prod. Plan. Control 17(8),769–779 (2006). https://doi.org/10.1080/09537280600834452
15. Hou, W.R.; Jiang, Z.H.; Jin, Y.L.: Reliability-based opportunisticpreventive maintenance model of multi units serial parallel system.J. Shanghai Jiaotong Univ. (Chin. Ed.) 43(4), 658–662 (2009)
16. Laggoune, R.; Chateauneuf, A.; Aissani, D.: Opportunistic policyfor optimal preventivemaintenance of amulti-component system incontinuous operating units. Comput.Chem.Eng. 33(9), 1499–1510(2009). https://doi.org/10.1016/j.compchemeng.2009.03.003
17. Peng,W.; Huang, H.Z.; Zhang, X.; Liu, Y.; Li, Y.: Reliability basedoptimal preventive maintenance policy of series-parallel systems.Eksploatacja i Niezawodnosc 42(2), 4–7 (2009)
18. Song, S.; Coit, D.W.; Feng, Q.; Peng, H.: Reliability analysis formulti-component systems subject to multiple dependent compet-ing failure processes. IEEE Trans. Reliab. 63(1), 331–345 (2014).https://doi.org/10.1109/TR.2014.2299693
19. Guo, S.; Sun, Y.; Zhao, G.; Chen, Z.: Optimization of mainte-nance strategy for multi-component system subject to degradationprocess. In: 2016 Prognostics and System Health ManagementConference (PHM-Chengdu) IEEE, pp. 1–6 (2016). https://doi.org/10.1109/PHM.2016.7819854
20. Fallahnezhad, M.S.; Najafian, E.: A model of preventive main-tenance for parallel, series, and single-item replacement systemsbased on statistical analysis. Commun. Stat. Simul. Comput.46(7), 5846–5859 (2017). https://doi.org/10.1080/03610918.2016.1183781
21. Shi,Y.; Zhu,W.;Xiang,Y.; Feng,Q.: Condition-basedmaintenanceoptimization for multi-component systems subject to a system reli-ability requirement. Reliab. Eng. Syst. Saf. 202, 107042 (2020).https://doi.org/10.1016/j.ress.2020.107042
22. Dinh, D.-H.; Do, P.; Iung, B.: Multi-level opportunistic predictivemaintenance for multi-component systems with economic depen-dence and assembly/disassembly impacts. Reliab. Eng. Syst. Saf.217, 108055 (2022). https://doi.org/10.1016/j.ress.2021.108055
23. Gholizadeh, H.; Fazlollahtabar, H.; Fathollahi-Fard, A.M.;Dulebenets, M.A.: Preventive maintenance for the flexible flow-shop scheduling under uncertainty: a waste-to-energy system.Environ. Sci. Pollut. Res. (2021). https://doi.org/10.1007/s11356-021-16234-x
24. Shen, J.; Elwany, A.; Cui, L.: Reliability analysis for multi-component systems with degradation interaction and categorizedshocks. Appl. Math. Model. 56, 487–500 (2018). https://doi.org/10.1016/j.apm.2017.12.001
25. Martinod, R.M.; Bistorin, O.; Castañeda, L.F.; Rezg, N.: Mainte-nance policy optimisation for multi-component systems consider-ing degradation of components and imperfect maintenance actions.Comput. Ind. Eng. 124, 100–112 (2018). https://doi.org/10.1016/j.cie.2018.07.019
26. Kamel, G.; FahmyAly, M.; Mohib, A.; Afefy, I.H.: Optimizationof amultilevel integrated preventivemaintenance schedulingmath-ematical model using genetic algorithm. Int. J. Manag. Sci. Eng.Manag. 15(4), 247–257 (2020). https://doi.org/10.1080/17509653.2020.1726834
27. Vu, H.C.; Do, P.; Fouladirad, M.; Grall, A.: Dynamic opportunis-tic maintenance planning for multi-component redundant systemswith various types of opportunities. Reliab. Eng. Syst. Saf. 198,106854 (2020). https://doi.org/10.1016/j.ress.2020.106854
28. Wang, R.; Cheng, Z.; Dong, E.; Guo, C.; Rong, L.: Reliability-based opportunistic maintenance modeling for multi-componentsystems with economic dependence under base warranty. Dis-creteDyn.Nat. Soc. 52, 1–16 (2021). https://doi.org/10.1155/2021/5541902
29. Mo, J.P.T.; Chan, D.: Reliability based maintenance planning ofwind turbine using bond graph. Univers. J. Mech. Eng. 5(4),103–112 (2017). https://doi.org/10.13189/ujme.2017.050401
30. Cicek, K.; Turan, H.H.; Topcu, Y.I.; Searslan, M.N.: Risk-basedpreventive maintenance planning using failure mode and effectanalysis (FMEA) for marine engine systems. In: 2010 SecondInternational Conference on Engineering SystemManagement andApplications, IEEE, pp. 1–6 (2010)
31. Puthillath, B.; Sasikumar, R.: Selection of maintenance strategyusing failure mode effect and criticality analysis. Int. J. Eng. Innov.Technol. IJEIT 1(6), 73–79 (2012)
32. Guo, J.; Li, Z.; Wolf, J.: Reliability centered preventive mainte-nance optimization for aircraft indicators. In: Proceedings of theAnnual Reliability and Maintainability Symposium, vol. 2016,pp.1–6 (2016). https://doi.org/10.1109/RAMS.2016.7448068
33. Saleem, F.; Nisar, S.; Khan,M.A.; Khan, S.Z.; Sheikh,M.A.: Over-all equipment effectiveness of tyre curing press: a case study. J.Qual. Maint. Eng. 23(1), 39–56 (2017). https://doi.org/10.1108/JQME-06-2015-0021
34. Piechowski, M.; Szafer, P.; Wyczolkowski, R.; Gladysiak, V.: Con-cept of the FMEA method-based model supporting proactive andpreventive maintenance activities. IOP Conf. Ser. Mater. Sci. Eng.400(6), 62023 (2018)
35. Islam, S.S.; Lestari, T.; Fitriani, A.;Wardani, D.A.: The implemen-tation of preventivemaintenance usingmachine damage analysis: acase study of power plant machine. IOP Conf. Ser. Mater. Sci. Eng.885(1), 12030 (2020). https://doi.org/10.1088/1757-899X/885/1/012030
36. Rahmania, W.S.; Prasetya, H.E.G.; Sholihah, F.H.: Maintenanceanalysis of boiler feed pump turbine using failure mode effectanalysis (FMEA)methods. In: 2020 International Electronics Sym-posium (IES), 29–30 September, Sarubaya, Indonesia, pp. 54–59(2020)
37. Sudadiyo, S.; Santa, S.A.; Subekti, M.; Sunaryo, G.R.; Busono,P.: FMEA for maintenance criterion at RSG-GAS reactor imple-mented on JE01-AP01 primary pump.Kerntechnik 85(3), 153–160(2020)
38. Palei, S.K.; Das, S.; Chatterjee, S.: Reliability-centered main-tenance of rapier dragline for optimizing replacement intervalof dragline components. Min. Metall. Explor. 37(4), 1121–1136(2020). https://doi.org/10.1007/s42461-020-00226-5
39. Gholizadeh, H.; Javadian, N.; Fazlollahtabar, H.: An integratedfuzzy-genetic failure mode and effect analysis for aircraft wingreliability. Soft. Comput. 24(17), 13401–13412 (2020). https://doi.org/10.1007/s00500-020-04757-3
40. Ramere, M.D.; Laseinde, O.T.: Optimization of condition-basedmaintenance strategy prediction for aging automotive industrialequipment using FMEA. Procedia Comput. Sci. 180, 229–238(2021). https://doi.org/10.1016/j.procs.2021.01.160
41. Paprocka, I.: The model of maintenance planning and produc-tion scheduling for maximising robustness. Int. J. Prod. Res.57(14), 4480–4501 (2019). https://doi.org/10.1080/00207543.2018.1492752
42. Talebberrouane, M.; Khan, F.; Lounis, Z.: Availability analysis ofsafety critical systems using advanced fault tree and stochastic Petrinet formalisms. J. Loss Prev. Process Ind. 44, 193–203 (2016)
43. Ammar, M.; Hoque, K.A.; Mohamed, O.A.: Formal analysis offault tree using probabilistic model checking: a solar array casestudy. In: 2016 Annual IEEE Systems Conference (SysCon),pp. 1–6. IEEE (2016)
44. Li, Z.F.; Ren, Y.; Liu, L.L.; Wang, Z.L.: Parallel algorithm forfinding modules of large-scale coherent fault trees. Microelectron.Reliab. 55(9–10), 1400–1403 (2015)
45. Ruijters, E.; Stoelinga,M.: Fault tree analysis: a survey of the state-of-the-art in modeling, analysis and tools. Comput. Sci. Rev. 15,29–62 (2015)
123

Arabian Journal for Science and Engineering
46. Cauchi, N.; Hoque, K.A.; Stoelinga,M.; Abate, A.:Maintenance ofsmart buildings using fault trees. ACM Trans. Sens. Netw. TOSN14(3–4), 1–25 (2018)
47. Ruijters, E.; Guck, D.; Drolenga, P.; Stoelinga, M.: Fault mainte-nance trees: reliability centered maintenance via statistical modelchecking. In: 2016 Annual Reliability andMaintainability Sympo-sium (RAMS), pp. 1–6. IEEE (2016)
48. Sadeghian, M.: The reliability assessment of a ship structure undercorrosion and fatigue, using structural health monitoring. Int JEng 35(09), 1765–1778 (2022). https://doi.org/10.5829/ije.2022.35.09c.13
49. Brînzei, N.; Aubry, J.F.: Graphs models and algorithms for reliabil-ity assessment of coherent and non-Coherent systems. Proc. Inst.Mech. Eng. O J. Risk Reliab. 232(2), 201–215 (2018). https://doi.org/10.1177/1748006X17744381
50. Alamri, T.O.; Mo, J.P.T.: Failure mode structured preventive main-tenance scheduling with changing failure rates in industry 4.0environment. Front. Manuf. Technol. 2, 828986 (2022). https://doi.org/10.3389/fmtec.2022.828986
51. Rausand, M.; Høyland, A.: System Reliability Theory: Models,Statistical Methods, and Applications, 2nd edn. Wiley, Hoboken(2004)
52. Jardine, A.K.; Tsang, A.H.: Maintenance, replacement, and relia-bility; theory and applications, 2ed edn. Ringgold, Inc, CRC Press,Portland. Reference & Research Book News, 2013-08-01, vol.28(4). ISSN: 0887-3763 (2013)
53. Nievergelt, J.: Exhaustive search, combinatorial optimization andenumeration: exploring the potential of raw computing power. In:Lecture Notes in Computer Science (including Subseries LectureNotes in Artificial Intelligence and Lecture Notes in Bioinformat-ics) (pp. 18–35). Springer, Berlin (2000). https://doi.org/10.1007/3-540-44411-4_2
54. Hess, A.; Stecki, J.S.; Rudov-Clark, S.D.: The maintenance awaredesign environment: development of an aerospace PHM softwaretool. Proc. PHM08 16, 17 (2008)
123
Related Documents