Optimal Management of a Potential Invader: The Case of Zebra Mussels in Florida Donna J. Lee, Damian C. Adams, and Frederick Rossi Dominant users of Lake Okeechobee water resources are agricultural producers and recreational anglers These uses will be directly affected, should the lake become infested with zebra mussels. We employ a probabilistic bioeconomic simulation model to estimate the potential impact of zebra mussels on consumptive water uses, recreational angling, and wetland ecosystem services under alternative public management scenarios. Without public management, the expected net economic impact from zebra mussels is 2$244.1 million over 20 years. Public investment in prevention and eradication will yield a net expected gain of +$188.7 million, a superior strategy to either prevention or eradication alone. Key Words: cost transfer, fishing, invasive species, probability transition matrix, surface water, wetlands JEL Classifications: C63, Q25, Q52, Q57, Q58 Zebra mussels (Dreissena polymorpha) are a small freshwater species native to southeast- ern Europe. In suitable water, zebra mussels become successful invaders. Mature females can produce up to 1 million eggs per year (USACE). The zebra mussel most likely crossed the Atlantic Ocean as larvae on a transatlantic ship (Griffiths et al.; Hebert, Muncaster, and Mackie; Thorp, Alexander, and Cobbs) and disembarked into the Great Lakes. The mussels multiplied rapidly and began spreading. Today, populations are found in 24 states, as shown in the map in Figure 1 (USGS 2007). The problem with zebra mussels is that they colonize on any submerged surface, including boat hulls, navigational buoys, bridge abutments, and water intake pipes. Their dense mats will accelerate the rate of corrosion, sink navigational buoys with their weight, and obstruct water flow in pipes. United States’ expenditure for the upkeep required to maintain boat bottoms, docks pilings, locks, gates, and pipes is estimated to be $60 million per year (USGAO). Because zebra mussels are spreading, damages are expected to rise. Future damages are estimated to be between $3.1 and $5 billion for the period 2002 to 2011 (USGAO; USGS 2000). Zebra mussels compete with native flora and fauna for food and space, alter the composition of the water column, and trans- form lake bottoms. They will biofoul rocks, logs, submerged plants, and the shells of other mussels. In the United States, more than half Donna J. Lee is a senior economist with Entrix, Inc. Previously, she was an associate professor in the Institute of Food and Agricultural Sciences, College of Agriculture and Life Sciences, Department of Food and Resource Economics at the University of Florida. Damian C. Adams is assistant professor of natural resource and environmental economics at Oklahoma State University. Previously, he was employed as a lecturer in the Institute of Food and Agricultural Sciences, College of Agriculture and Life Sciences, Department of Food and Resource Economics at the University of Florida. Frederick Rossi is a postdoctoral researcher in the Institute of Food and Agricultural Sciences, College of Agricultural and Life Sciences, School of Forest and Resource Con- servation at the University of Florida. Journal of Agricultural and Applied Economics, 39(October 2007):69–81 # 2007 Southern Agricultural Economics Association

Welcome message from author
This document is posted to help you gain knowledge. Please leave a comment to let me know what you think about it! Share it to your friends and learn new things together.
Transcript

Optimal Management of a Potential Invader:
The Case of Zebra Mussels in Florida
Donna J. Lee, Damian C. Adams, and Frederick Rossi
Dominant users of Lake Okeechobee water resources are agricultural producers and
recreational anglers These uses will be directly affected, should the lake become infested
with zebra mussels. We employ a probabilistic bioeconomic simulation model to estimate
the potential impact of zebra mussels on consumptive water uses, recreational angling, and
wetland ecosystem services under alternative public management scenarios. Without public
management, the expected net economic impact from zebra mussels is 2$244.1 million over
20 years. Public investment in prevention and eradication will yield a net expected gain of
+$188.7 million, a superior strategy to either prevention or eradication alone.
Key Words: cost transfer, fishing, invasive species, probability transition matrix, surface
water, wetlands
JEL Classifications: C63, Q25, Q52, Q57, Q58
Zebra mussels (Dreissena polymorpha) are
a small freshwater species native to southeast-
ern Europe. In suitable water, zebra mussels
become successful invaders. Mature females
can produce up to 1 million eggs per year
(USACE). The zebra mussel most likely
crossed the Atlantic Ocean as larvae on
a transatlantic ship (Griffiths et al.; Hebert,
Muncaster, and Mackie; Thorp, Alexander,
and Cobbs) and disembarked into the Great
Lakes. The mussels multiplied rapidly and
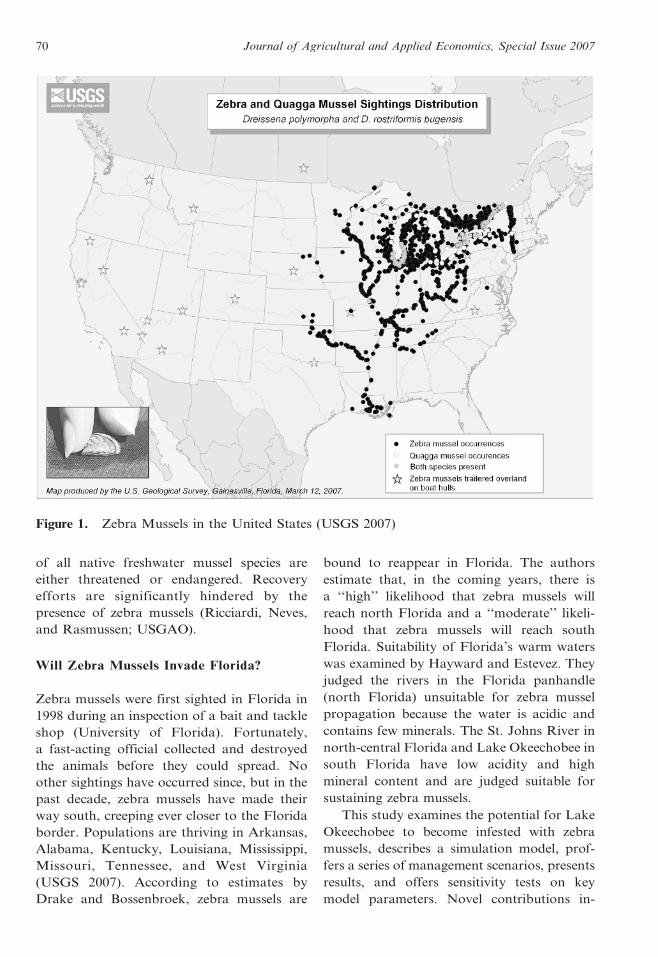
began spreading. Today, populations are
found in 24 states, as shown in the map in
Figure 1 (USGS 2007).
The problem with zebra mussels is that
they colonize on any submerged surface,
including boat hulls, navigational buoys,
bridge abutments, and water intake pipes.
Their dense mats will accelerate the rate of
corrosion, sink navigational buoys with their
weight, and obstruct water flow in pipes.
United States’ expenditure for the upkeep
required to maintain boat bottoms, docks
pilings, locks, gates, and pipes is estimated to
be $60 million per year (USGAO). Because
zebra mussels are spreading, damages are
expected to rise. Future damages are estimated
to be between $3.1 and $5 billion for the
period 2002 to 2011 (USGAO; USGS 2000).
Zebra mussels compete with native flora
and fauna for food and space, alter the
composition of the water column, and trans-
form lake bottoms. They will biofoul rocks,
logs, submerged plants, and the shells of other
mussels. In the United States, more than half
Donna J. Lee is a senior economist with Entrix, Inc.
Previously, she was an associate professor in the
Institute of Food and Agricultural Sciences, College
of Agriculture and Life Sciences, Department of Food
and Resource Economics at the University of Florida.
Damian C. Adams is assistant professor of natural
resource and environmental economics at Oklahoma
State University. Previously, he was employed as
a lecturer in the Institute of Food and Agricultural
Sciences, College of Agriculture and Life Sciences,
Department of Food and Resource Economics at the
University of Florida. Frederick Rossi is
a postdoctoral researcher in the Institute of Food
and Agricultural Sciences, College of Agricultural and
Life Sciences, School of Forest and Resource Con-
servation at the University of Florida.
Journal of Agricultural and Applied Economics, 39(October 2007):69–81# 2007 Southern Agricultural Economics Association
of all native freshwater mussel species are
either threatened or endangered. Recovery
efforts are significantly hindered by the
presence of zebra mussels (Ricciardi, Neves,
and Rasmussen; USGAO).
Will Zebra Mussels Invade Florida?
Zebra mussels were first sighted in Florida in
1998 during an inspection of a bait and tackle
shop (University of Florida). Fortunately,
a fast-acting official collected and destroyed
the animals before they could spread. No
other sightings have occurred since, but in the
past decade, zebra mussels have made their
way south, creeping ever closer to the Florida
border. Populations are thriving in Arkansas,
Alabama, Kentucky, Louisiana, Mississippi,
Missouri, Tennessee, and West Virginia
(USGS 2007). According to estimates by
Drake and Bossenbroek, zebra mussels are
bound to reappear in Florida. The authors
estimate that, in the coming years, there is
a ‘‘high’’ likelihood that zebra mussels will
reach north Florida and a ‘‘moderate’’ likeli-
hood that zebra mussels will reach south
Florida. Suitability of Florida’s warm waters
was examined by Hayward and Estevez. They
judged the rivers in the Florida panhandle
(north Florida) unsuitable for zebra mussel
propagation because the water is acidic and
contains few minerals. The St. Johns River in
north-central Florida and Lake Okeechobee in
south Florida have low acidity and high
mineral content and are judged suitable for
sustaining zebra mussels.
This study examines the potential for Lake
Okeechobee to become infested with zebra
mussels, describes a simulation model, prof-
fers a series of management scenarios, presents
results, and offers sensitivity tests on key
model parameters. Novel contributions in-
Figure 1. Zebra Mussels in the United States (USGS 2007)
70 Journal of Agricultural and Applied Economics, Special Issue 2007
clude the quantification of potential future
damages from zebra mussels, economic trade-
offs between public management expenditures
and public and private gains, and comparisons
of management alternatives with respect to
prevention and eradication.
Lake Okeechobee
Lake Okeechobee is an important commercial
shipping route, a valuable source of freshwa-
ter, a major recreational resource, and, at
448,000 acres, the second largest lake entirely
within the United States (FDEP). Five coun-
ties around the lake pump water for irrigation,
industry, and household uses. Affected ser-
vices from an infestation of zebra mussels
would include water supply, water recreation,
and wetland ecosystem services.
The Lake Okeechobee waterway is pres-
ently free of zebra mussels, and the nearest
populations are 750 mi. away. Most likely,
zebra mussels will make the journey by
clinging to the stems of aquatic weeds
entwined in a boat propeller or snagged on
a trailer. Although the possibility may seem
remote, it is worth noting that zebra mussels
can survive for several days out of water. In
the Great Lakes region, aquatic weeds covered
with live zebra mussels were observed on one
of every 275 boats in parking lots while
owners were preparing to launch into unin-
fested lakes (Johnson and Carlton).
Lake Okeechobee is a popular destination
for local and out-of-state sport fishers and
recreational boaters and is host to several
major fishing tournaments each year. Out-of-
state boaters and returning Florida boaters are
likely vectors for transporting zebra mussels to
Lake Okeechobee.
Zebra Mussel Model
In a previous study, Leung et al. used stochastic
dynamic programming to model the probability
of a zebra mussel invasion as a decreasing
function of prevention effort. Zebra mussel
growth was captured with a logistic function.
Damages were expressed in terms of lost
productivity due to reduced water flow. The
optimal solution was to reduce the probability
of arrival by 10% with prevention measures.
Finnoff et al. applied a stochastic dynamic
programming model following Leung et al. to
examine the economics of preventing zebra
mussel damages in a Midwest lake. They
questioned the importance of including feed-
back links and the conditions under which
omission would make a difference. One in-
teresting finding was that overinvestment or
underinvestment in control could result, de-
pending on how the public manager believes the
private entity will respond to the invasion. To
compare management alternatives for eradicat-
ing the oyster drill (Ocinebrellus inornatus), an
invasive marine mollusk, Buhle, Margolis, and
Ruesink employed a Markov approach. The
authors specified a 2 3 2 transition matrix to
capture two of the animals’ three life stages
and ascertained that control efforts targeting
the adult animals would be more cost-effective
than control efforts targeting the bright egg
masses.
For Lake Okeechobee, we assume there is
a real threat of zebra mussel introduction.
Once introduced, the small critters are unlikely
to be noticed until dense mats are formed or
piles of razor-sharp mussel shells wash up
onshore. By the time they are detected, the
economic and environmental damage will
already be significant. To characterize this
system, we use a stylized model comprising the
following four ‘‘states of nature’’: (1) none, (2)
introduced, (3) propagating, and (4) critical
mass. The probability that the lake will be in
any of the four states at time t in the future is
sit. At present, there are no zebra mussels;
thus, s1t50 5 1, and it follows that s2t50 5
s3t50 5 s4t50 5 0. An additional description of
the variable sit appears in Table 1.
The sit state probabilities are brought
together to form the elements of vector
variable St:
ð1Þ St~
s1
s2
s3
s4
26664
37775
t
where 0 ƒ sit ƒ1 andX4
i~1
sit ~1:
Lee, Adams, and Rossi: Zebra Mussels in Florida 71

At present, the lake has no zebra mussels; thus,
at t 5 0,
ð2Þ S0 ~
1
0
0
0
26664
37775
t~0
:
To derive future state values St+1, we define
the transition probability aij, which represents
the probability of changing to state i from
state j in a single time period. In matrix form,
aij comprises the elements of A0, the 4 3 4
matrix of transition probabilities under a nat-
ural progression of zebra mussels:
ð3Þ A0 ~
a11 a12 a13 a14
a21 a22 a23 a24
a31 a32 a33 a34
a41 a42 a43 a44
26664
37775:
St+1 is defined as the product of A0 and St
from Equations (3) and (1):
ð4Þ Stz1 ~ A0St:
Each element of St+1 can be obtained:
ð5Þ si,tz1 ~ ai1s1t z ai2s2t z ai3s3t z ai4s4t
for i ~ 1 ::: 4:
Because the natural progression of zebra
mussels may be undesirable, prevention mea-
sures are available to reduce the probability of
introduction and propagation. Letting f1
measure the effectiveness of a prevention pro-
gram, the transition probability matrix Ap with
a prevention program in place is expressed by
ð6Þ Ap ~
a11 { a21f1 a12 a13 a14
a21(1 { f1) a22 a23 a24
a31 a32 a33 a34
a41 a42 a43 a44
26664
37775:
Propagation can be thwarted with early
eradication, which is defined as the action
required to destroy all zebra mussels as soon as
they are detected. With monitoring as a com-
ponent of the prevention program, we assume
early eradication takes place in state 3 before
the zebra mussels can cause significant damage
or loss. The transition probability matrix Am is
represented by
ð7Þ Am ~
a11 { a21f1 1 1 1
a21(1 { f1) a22 a23 a24
a31 0 a33 a34
a41 a42 0 0
26664
37775:
Without a prevention program in place, we
assume that there would be no monitoring and
that therefore zebra mussels would be detected
with the onset of economic damages, i.e., in
state 4. Late eradication is defined to be the
measures taken to destroy all zebra mussels in
Lake Okeechobee after reaching state 4. The
transition probability matrix Ar is expressed by
ð8Þ Ar ~
a11 1 1 1
a21 a22 a23 a24
a31 0 a33 a34
a41 a42 0 0
26664
37775:
Posteradication, we assume the treated lake
would be free of zebra mussels for a period of n
years, during which time the transition prob-
ability matrix becomes
ð9Þ An ~
1 0 0 0
0 1 0 0
0 0 1 0
0 0 0 1
26664
37775:
With prevention, the zebra mussel state
equation when there are no zebra mussels
Table 1. Description of Zebra Mussel States in Lake Okeechobee
i
Probability of State i at
Time t Description of State i
Economic and Ecosystem
Damages?
1 s1t No zebra mussels No
2 s2t Zebra mussels recently introduced No
3 s3t Zebra mussels propagating No
4 s4t Zebra mussels at critical mass Yes
72 Journal of Agricultural and Applied Economics, Special Issue 2007

(state 1) and after they are introduced (state 2)
is defined as
ð10Þ St ~ ApSt{1:
We assume zebra mussels will be detected after
they begin propagating (state 3). In this state,
prevention would no longer be practical; thus,
prevention measures would be halted after
state 3. While zebra mussels are propagating
(state 3) and when they reach critical mass
(state 4), the transition matrix is A0, and the
state equation reverts to Equation (4).
With prevention and early eradication,
the state equation while there are no zebra
mussels and after they are introduced and
propagating is
ð11Þ St ~ AmSt{1:
With late eradication, the state equation while
there are no zebra mussels and after they have
been introduced, are propagating, and have
reached critical mass is
ð12Þ St ~ ArSt{1:
For the remainder of the planning horizon,
after early eradication and after late eradica-
tion, the state equation is
ð13Þ St ~ AnSt{1:
Economic comparison of the management
choices requires estimates of the expected
benefits and costs. For this problem, the
management choice variable X is a (4 3 4)
vector composed of the elements xp and xr.
ð14Þ X ~
xp xp 0 0
0 0 0 0
0 0 xpxr 0
0 0 0 xr
26664
37775
The decision to invest in prevention is given
by xp 5 1 and xr 5 0. The decision to invest in
prevention and early eradication is given by xp
5 1 and xr 5 1. The decision to invest in late
eradication is given by xp 5 0 and xr 5 1. The
four management alternatives are shown in
Table 2.
Combining the two management choices
yields a vector of four management alternatives:
ð15Þ u(X ) ~
(1 { xp)(1 { xr)
xp(1 { xr)
(1 { xp)xr
xpxr
26664
37775
The unit costs of implementing the manage-
ment choices xp and xr are cp and cr, which
comprise the (2 3 1) management cost
vector q.
ð16Þ q ~
cp
0
cr
cr
26664
37775
The cost of management Ct at time t is the
product of unit cost q, management choice X,
and zebra mussel state St from Equations (16),
(14), and (1):
ð17Þ Ct ~ q0XSt:
Economic damage from zebra mussel infesta-
tion is d, an X-dependent variable of increased
maintenance expenditure by consumptive wa-
Table 2. Four Management Alternatives
xp 5 0 xp 5 1
xr 5 0 I II
Do nothing (status quo) Invest in prevention (prevention)
xr 5 1 III IV
Eradicate when zebra mussels become
problematic (late eradication)
Invest in prevention and eradicate before
zebra mussels become problematic
(prevention and early eradication)
Lee, Adams, and Rossi: Zebra Mussels in Florida 73

ter users in Lake Okeechobee. Ecosystem
service loss with zebra mussel infestation e
includes diminished wetland functions, loss in
wildlife habitat, and reduced aquatic food
supply in state 4. The benefit from zebra
mussel infestation b is the added value to
recreational and sport fishers from improved
water clarity and increased catch rates due to
zebra mussel filter feeding. In this model, cost,
damage, and loss are expressed as negative
values, and benefit is expressed as a positive
value. The objective is to choose a manage-
ment strategy X that maximizes Z, the present
value of total expected cost, damage, loss, and
benefit with the threat of zebra mussel in-
festation. The objective is to
ð18Þ max Z ~XT
t~0
(1 z r){t q’X Stð
z (e0 z b0)St z u(X )0d(X )0 StÞ,
subject to Equations (1) through (17). In
Equation (18), r is the annual discount rate,
and T is the number of years in the planning
horizon.
Empirical Model Parameters
Transition Probabilities
Recreational and sport boats are the primary
vector for transporting zebra mussels from
infested lakes to Lake Okeechobee. We
examined data from three national tourna-
ments on Lake Okeechobee during 2006–2007
(Carson; Eads) and observed that half of the
926 anglers were from states with zebra
mussel–infested waters. The potential for
trailered boats to vector zebra mussels was
shown by Bossenbroek, Kraft, and Nekola.
They estimated that trailered boats in the
Great Lakes area could convey enough live
zebra mussels to colonize an uninfested body
of water in a nearby state with a probability of
between 1.18 3 1025 and 4.11 3 1025. We used
an intermediate probability of 3.78 3 1025 per
boat, multiplied by 926 boats per year, to
obtain an annual probability of zebra mussel
introduction of 3.5% per year (a21 5 0.035).
Upon introduction to Lake Okeechobee,
zebra mussels would prosper, according to
Hayward and Estevez. The scientists comput-
ed habitat suitability indices (HSI) of 0.83 and
0.91 for open water and shallow water
containing dense aquatic plants. Given the
high HSI values for Lake Okeechobee and the
large expanse of suitable habitat, we assumed
introduced zebra mussels would become es-
tablished and propagate until critical mass was
reached with a probability of 100% (a32 5 a43
5 a44 5 1.0).
Time to reach carrying capacity according
to Borcherding and Sturm; Burlakova, Kar-
atayev, and Padilla; Lauer and Spacie; Nalepa
et al.; and Strayer et al. is 2–3 years after
detection. For our model, we assume zebra
mussels will grow to produce dense mats
sufficient to cause damages 2 years after
introduction; thus, the time lag between states
2 and 3 and between states 3 and 4 is 1 year.
Private Economic Damage
In the Great Lakes area, both O’Neill and
Deng estimated the annual expenditure for
chemical, mechanical, and thermal mainte-
nance. For a zebra mussel infestation in Lake
Okeechobee, we assume water users would
employ mechanical and thermal means to
clear clogged intake pipes and spend $4.90 per
million gallons pumped, as reported by Deng.
Mean water withdrawal from Lake Okeecho-
bee is 562,589 million gallons per year (USGS
2006). Multiplying annual water use by
average unit expenditure, we arrived at
economic damage of $2.76 million per year
to consumptive water users (d2 5 2.76). As
most pipes in the Great Lake region are
pretreated with antifouling paint, we apply
this damage estimate to treated pipes.
Antifouling paint helps reduce mainte-
nance expenditures by inhibiting zebra mussel
colonization. In the Columbia River Basin,
water users applied antifouling paint to in-
terior pipe surfaces at a cost of $25.56 per ft2
(Phillips, Darland, and Systsma). According
to Adams, the average interior surface area of
intake pipes drawing from Lake Okeechobee
is 300.58 ft2, and there are 504 major water
74 Journal of Agricultural and Applied Economics, Special Issue 2007

users on the lake. Total intake pipe surface
area is estimated to be 151,492 ft2, which
would cost $3.87 million to treat with anti-
fouling paint. Assuming the paint treatment
lasts 10 years, annualized mitigation damage
is $0.387 million (d3 5 0.387).
We assume antifouling paint treatment
saves water users about 22% in maintenance
expenditures. Thus, without treatment, Lake
Okeechobee consumptive water users would
pay $5.98 per million gallons per year pumped
to maintain pipes. Annual damage to un-
treated pipes is $3.37 million (d1 5 3.37).
Public Ecosystem Service Loss
Surrounding Lake Okeechobee are 29,000
acres of Audubon Society wetlands and
31,000 acres of unnamed wetlands for a total
of 60,000 acres of wetlands. Costanza et al.
estimated the value of wetland services to be
$1,083 per acre per year. Multiplying $1,083
by 60,000 acres yields a wetland damage
estimate of $64.98 million per year (e 5 64.98).
Private Economic Benefit
Between 1983 and 2002, anglers spent an
average of 1,575,340 hours on Lake Okeecho-
bee each year (FFWCC). The Florida Fish
and Wildlife Conservation Commission re-
ported an average spending of $20.65 per hour
in 2002 (FFWCC). Using total expenditures to
estimate the recreational value of freshwater
fishing, we multiplied hours fished by value
per hour to obtain a total recreational value of
$32.5 million per year. Assuming an increase
in water clarity attributable to zebra mussels
would yield a 1% increase in fishing hours.
The benefit from zebra mussels is $0.325
million per year in state 4 (b 5 0.325).
Management Cost
A plan to monitor and prevent zebra mussels
from entering Lake Okeechobee was proposed
in 2003 (USACE). The plan included inspect-
ing underwater structures, sampling waterway
sediments, and distributing education alert
materials to boaters, lake homeowners, and
businesses. The cost of implementing the
proposed plan is $152,800 per year (cp 5
0.1528).
In 2006, an infestation of zebra mussels
prompted the Virginia Department of Game
and Inland Fisheries to pour 174,000 gallons
of potassium chloride into Millbrook Quarry.
At 100 ppm, the concentration was double the
amount needed to kill zebra mussels but low
enough to avoid harming humans or fish. The
single treatment is expected to protect the
quarry from zebra mussel infestation for
33 years. The cost for chemicals and labor
was $365,000 (VDGIF). A similar treatment
for Lake Okeechobee would require 628.6
million gallons of potassium chloride at a cost
of $1.320 billion. This cost annualized over
33 years is $55.03 million (cr 5 55.03).
A summary of the parameter values used in
the Zebra Mussel Model appears in Table 3.
Four Management Scenarios
With management I (do nothing), public
management costs are zero. Private water
users become aware of zebra mussels when
they incur damages d1 in the first year of state
4. In the second year, they will apply
antifouling paint, thereby incurring damages
d2 and d3 in subsequent years. Public ecosys-
tem loss is e for every year the system is in
state 4. Public recreation benefit is b for every
year the system is in state 4.
With management II (prevention), public
management cost is cp when the system is in
states 1 and 2 and zero in states 3 and 4.
Private damage is d3 during the first year that
the system is in state 3 and d2 and d3 while in
state 4. Public ecosystem loss is e for every
year the system is in state 4. Public recreation
benefit is b for every year the system is in
state 4.
With management III (late eradication),
public management cost is cr after the system
reaches state 4. Private water users become
aware of zebra mussels when they incur
damages d1 during the first year in state 4. In
subsequent years, private damages drop to
zero because the zebra mussels are eradicated.
Public ecosystem loss is e for 1 year while the
Lee, Adams, and Rossi: Zebra Mussels in Florida 75

system is in state 4. Public recreation benefit is
b for 1 year while the system is in state 4.
With management IV (prevention and
early eradication), public management cost is
cp while the system is in states 1 and 2, cr when
the system is in state 3, and zero otherwise.
Private damage is zero. Public ecosystem loss
and public recreation benefit are zero, as the
system never reaches state 4.
The empirical zebra mussel model was run
on GAMS software (GAMS). In the following
section, results from the simulation model are
presented and discussed. Breakpoint values
are provided to show the sensitivity of the
results to the model parameter values.
Results
The least costly strategy is management I, in
which nothing is done to prevent zebra
mussels from entering Lake Okeechobee, and
nothing is done to arrest propagation after
they arrive. Over 20 years, management cost is
$0. The present value of expected ecosystem
damages in terms of lost wetland functions is
2$219.5 million. Private water users sustain
2$25.7 million in expected damages from
increased maintenance expenditures, and rec-
reational anglers will gain +$1.1 million in
expected fishing benefits. The net present
value of ‘‘do nothing’’ is 2$244.1 million.
The next least costly strategy is manage-
ment II, in which prevention measures are
implemented. Because prevention is only 75%
effective, if zebra mussels arrive, we assume
that prevention measures would be halted and
that no further action would be taken to
manage the growing mussel population. Over
20 years, the present value of expected public
expenditure on prevention is 2$2.5 million.
The present value of expected ecosystem
damages in terms of lost wetland functions
is 2$62.4 million. Private water users will
endure 2$7.2 million in expected damages due
to increased maintenance and mitigation
expenditures. Recreational anglers will enjoy
+$0.3 million in expected fishing benefits. The
net present value of managing the threat of
zebra mussel with prevention is 2$71.8
million, a gain of +$172.2 million over doing
nothing.
The most costly strategy is management
III, in which zebra mussels are eradicated
from Lake Okeechobee after they begin
causing damage. Over 20 years, the present
value of expected public expenditure on
Table 3. Zebra Mussel Model Parameter Values
Symbol Definition Model Value
a11 Probability of zebra mussel not being introduced to Lake Okeechobee 0.965
a21 Probability of zebra mussel being accidentally introduced to Lake
Okeechobee
0.035
a32 Probability of zebra mussel moving from state 2 to state 3 1
a43 Probability of zebra mussel moving from state 3 to state 4 1
a44 Probability of zebra mussel remaining at state 4 1
All other aij 0
b Economic benefits from zebra mussel $0.325 mil
cp Cost of arrival prevention and monitoring (per year) $0.1528 mil
cr Cost of eradication (annualized) $55.03 mil
d1 Private economic damages without mitigation expenditures (per year) $3.37 mil
d2 Private economic damages with mitigation expenditures (per year) $2.76 mil
d3 Private mitigation expenditures (annualized) $0.387 mil
e Value of wetland services lost with zebra mussels in state 4 (per year) $64.98 mil
fp Effectiveness of prevention measures 0.75
fr Effectiveness of eradication measures 1.00
r Discount rate 0.02
t Year 0, . . . , 19
T Planning horizon 20 years
76 Journal of Agricultural and Applied Economics, Special Issue 2007
eradication is 2$185.9 million. The present
value of expected ecosystem damage in terms
of lost wetland functions is 2$23.8 million.
Private water users will absorb expected
damages of 2$1.2 million, and recreational
fishers will gain +$0.12 million in expected
fishing benefits. The net present value of late
eradication is 2$210.8 million, a gain of
+$33.3 million compared to doing nothing.
The strategy with the smallest public
ecosystem loss, the least private economic
damage, and the highest expected net present
value is management IV, in which both
prevention and eradication measures are used
to mitigate infestation and resulting damages.
Over 20 years, the present value of expected
public expenditure on prevention and early
eradication is 2$55.4 million. Expected loss in
ecosystem functions, damage to private con-
sumptive use, and gain to recreational anglers
is $0. The net present value from prevention
and early eradication is 2$55.4, a gain of
+$188.7 million compared to doing nothing.
Among the four alternatives, the optimal
strategy based on the net present value of
expected costs, damages, losses, and benefits
over the 20-year planning horizon as defined
in Equation (17) is Management I—Prevention
and Early Eradication. A summary of the
simulation model results appears Table 4.
Discussion
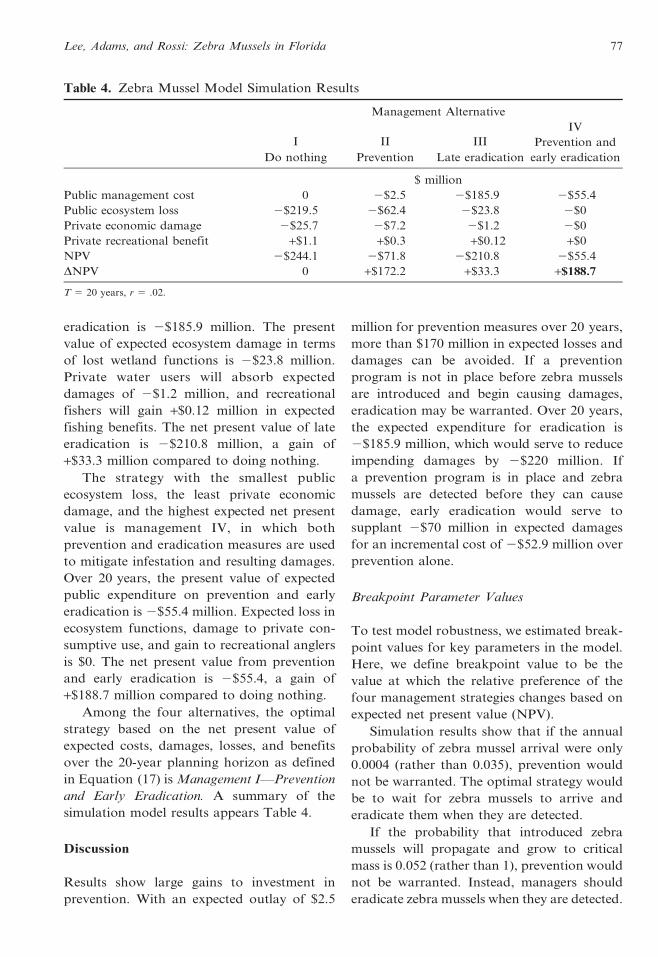
Results show large gains to investment in
prevention. With an expected outlay of $2.5
million for prevention measures over 20 years,
more than $170 million in expected losses and
damages can be avoided. If a prevention
program is not in place before zebra mussels
are introduced and begin causing damages,
eradication may be warranted. Over 20 years,
the expected expenditure for eradication is
2$185.9 million, which would serve to reduce
impending damages by 2$220 million. If
a prevention program is in place and zebra
mussels are detected before they can cause
damage, early eradication would serve to
supplant 2$70 million in expected damages
for an incremental cost of 2$52.9 million over
prevention alone.
Breakpoint Parameter Values
To test model robustness, we estimated break-
point values for key parameters in the model.
Here, we define breakpoint value to be the
value at which the relative preference of the
four management strategies changes based on
expected net present value (NPV).
Simulation results show that if the annual
probability of zebra mussel arrival were only
0.0004 (rather than 0.035), prevention would
not be warranted. The optimal strategy would
be to wait for zebra mussels to arrive and
eradicate them when they are detected.
If the probability that introduced zebra
mussels will propagate and grow to critical
mass is 0.052 (rather than 1), prevention would
not be warranted. Instead, managers should
eradicate zebra mussels when they are detected.
Table 4. Zebra Mussel Model Simulation Results
Management Alternative
I II III
IV
Do nothing Prevention Late eradication
Prevention and
early eradication
$ million
Public management cost 0 2$2.5 2$185.9 2$55.4
Public ecosystem loss 2$219.5 2$62.4 2$23.8 2$0
Private economic damage 2$25.7 2$7.2 2$1.2 2$0
Private recreational benefit +$1.1 +$0.3 +$0.12 +$0
NPV 2$244.1 2$71.8 2$210.8 2$55.4
DNPV 0 +$172.2 +$33.3 +$188.7
T 5 20 years, r 5 .02.
Lee, Adams, and Rossi: Zebra Mussels in Florida 77
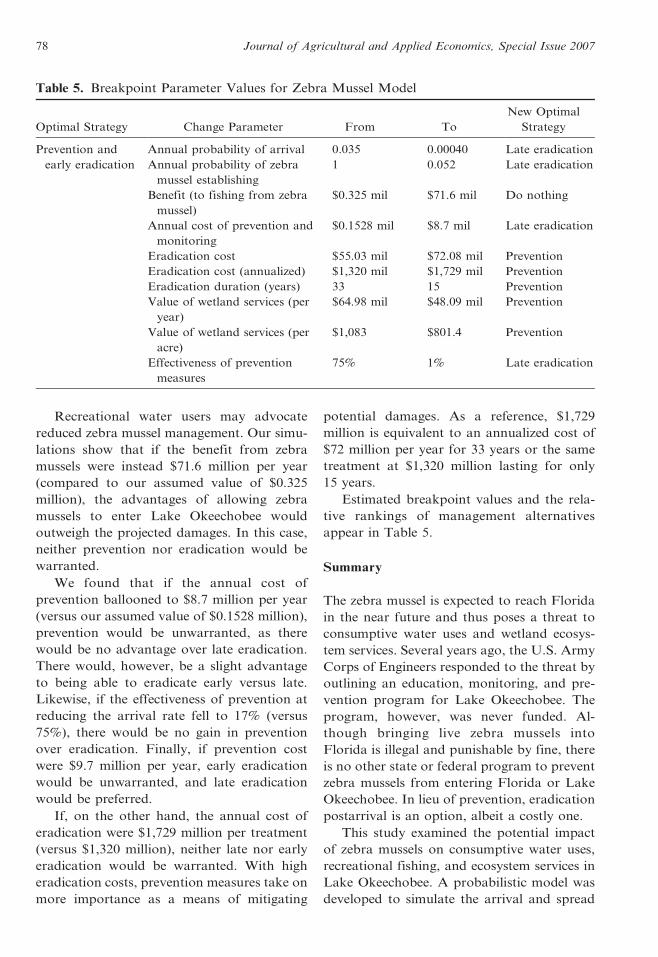
Recreational water users may advocate
reduced zebra mussel management. Our simu-
lations show that if the benefit from zebra
mussels were instead $71.6 million per year
(compared to our assumed value of $0.325
million), the advantages of allowing zebra
mussels to enter Lake Okeechobee would
outweigh the projected damages. In this case,
neither prevention nor eradication would be
warranted.
We found that if the annual cost of
prevention ballooned to $8.7 million per year
(versus our assumed value of $0.1528 million),
prevention would be unwarranted, as there
would be no advantage over late eradication.
There would, however, be a slight advantage
to being able to eradicate early versus late.
Likewise, if the effectiveness of prevention at
reducing the arrival rate fell to 17% (versus
75%), there would be no gain in prevention
over eradication. Finally, if prevention cost
were $9.7 million per year, early eradication
would be unwarranted, and late eradication
would be preferred.
If, on the other hand, the annual cost of
eradication were $1,729 million per treatment
(versus $1,320 million), neither late nor early
eradication would be warranted. With high
eradication costs, prevention measures take on
more importance as a means of mitigating
potential damages. As a reference, $1,729
million is equivalent to an annualized cost of
$72 million per year for 33 years or the same
treatment at $1,320 million lasting for only
15 years.
Estimated breakpoint values and the rela-
tive rankings of management alternatives
appear in Table 5.
Summary
The zebra mussel is expected to reach Florida
in the near future and thus poses a threat to
consumptive water uses and wetland ecosys-
tem services. Several years ago, the U.S. Army
Corps of Engineers responded to the threat by
outlining an education, monitoring, and pre-
vention program for Lake Okeechobee. The
program, however, was never funded. Al-
though bringing live zebra mussels into
Florida is illegal and punishable by fine, there
is no other state or federal program to prevent
zebra mussels from entering Florida or Lake
Okeechobee. In lieu of prevention, eradication
postarrival is an option, albeit a costly one.
This study examined the potential impact
of zebra mussels on consumptive water uses,
recreational fishing, and ecosystem services in
Lake Okeechobee. A probabilistic model was
developed to simulate the arrival and spread
Table 5. Breakpoint Parameter Values for Zebra Mussel Model
Optimal Strategy Change Parameter From To
New Optimal
Strategy
Prevention and
early eradication
Annual probability of arrival 0.035 0.00040 Late eradication
Annual probability of zebra
mussel establishing
1 0.052 Late eradication
Benefit (to fishing from zebra
mussel)
$0.325 mil $71.6 mil Do nothing
Annual cost of prevention and
monitoring
$0.1528 mil $8.7 mil Late eradication
Eradication cost $55.03 mil $72.08 mil Prevention
Eradication cost (annualized) $1,320 mil $1,729 mil Prevention
Eradication duration (years) 33 15 Prevention
Value of wetland services (per
year)
$64.98 mil $48.09 mil Prevention
Value of wetland services (per
acre)
$1,083 $801.4 Prevention
Effectiveness of prevention
measures
75% 1% Late eradication
78 Journal of Agricultural and Applied Economics, Special Issue 2007

of zebra mussels and to assess the cost-
effectiveness of alternate management strate-
gies. Results indicate that both prevention and
eradication of zebra mussels are economically
justified for Lake Okeechobee.
These findings are based on the data we used
to parameterize the model. Although we used
the best data available to the study, some
questions undoubtedly remain. To tackle these
questions head-on and advance the dialog on
this topic, we conducted a series of sensitivity
tests around key model parameters. Specifical-
ly, we tested the probability that zebra mussels
would arrive in Lake Okeechobee and the
likelihood that they would survive and re-
produce in this new environment. We also
tested our assumptions on the effectiveness of
a prevention program that would cost only
$152,800 per year and brought into question the
cost of a prevention program that boasted 75%
effectiveness. Because documented eradications
of invasive mollusks are few, we reexamined our
assumptions regarding how much this action
might cost, presuming eradication was techni-
cally feasible and environmentally desirable.
The battery of sensitivity tests was presented
in the form of breakpoint values (i.e., border-
line values of the tested parameters that would
cause a change in the relative ranking of the
preferred alternatives). Under the baseline
model parameters, prevention with early erad-
ication was most preferred, that is, offered the
highest expected net present value. Next pre-
ferred was prevention alone, followed by late
eradication, followed by the status quo, which
is to do nothing. Our sensitivity tests showed
that the cost-effectiveness of prevention is fairly
robust over a wide range of model assump-
tions. For example, probability of arrival, habit
suitability, and prevention effectiveness would
have to be many times smaller or the cost of
prevention would have to be many times larger
to rule out prevention as a worthwhile public
investment. In contrast, a mere 30% increase in
the cost of eradication would cause this
management activity to be ruled out on the
basis of cost-effectiveness. Likewise, it would
take only a 26% reduction in projected wetland
losses due to zebra mussels to conclude that
eradication might not be worthwhile.
To evaluate the eradication of zebra mus-
sels from Lake Okeechobee, we used case
studies from other locations to infer treatment
procedures, chemical dosages, and overall cost.
Better information will be required before
managers will embark on a venture of this
magnitude. Fortunately, the decision to erad-
icate can be postponed until zebra mussels
have arrived, at which time we hope that more
will be known. Because of the likely arrival of
zebra mussels, their potential to induce eco-
nomic and environmental damage, and the
uncertainty regarding the technical feasibility
and cost-effectiveness of eradication, this study
provides empirical evidence for prevention as
a sensible management option that is econom-
ically justified. Although additional scientific
study could lend better data to improve the
precision of our model estimates, the threat of
zebra mussels will loom large until an effective
prevention program is in place.
[Received March 2007; Accepted June 2007.]
References
Adams, D.C. ‘‘Economics and Law of Invasive
Species Management in Florida.’’ Ph.D. disser-
tation. University of Florida, May 2007.
Borcherding, J., and W. Sturm. ‘‘The Seasonal
Succession of Macroinvertebrates, in Particular
the Zebra Mussel (Dreissena polymorpha) in the
River Rhine and Two Neighboring Gravel-Pit
Lakes Monitored Using Artificial Substrates.’’
International Review of Hydrobiology 87(2002):
165–81.
Bossenbroek, J.M., C.E. Kraft, and J.C. Nekola.
‘‘Prediction of Long-Distance Dispersal Using
Gravity Models: Zebra Mussel Invasion of Inland
Lakes.’’ Ecological Applications 11,6(2001):
1778–88.
Buhle, E.R., M. Margolis, and J.L. Ruesink. Bang
for Buck: Cost-Effective Control of Invasive
Species with Different Life Histories. Ecological
Economics 52(2005):355–66.
Burlakova, L.E., A.Y. Karatayev, and D.K.
Padilla. ‘‘Changes in the Distribution and Abun-
dance of Dreissena polymorpha Within Lakes
Through Time.’’ Hydrobiologia 571(2006):
133–46.
Carson, R. Personal Communication. FLW Out-
doors, February 2007.
Costanza, R., R. d’Arge, R. deGroot, S. Farber, M.
Grasso, B. Hannon, K. Limburg, S. Naeem,
Lee, Adams, and Rossi: Zebra Mussels in Florida 79

R.V. O’Neill, J. Paruelo, R.G. Raskin, P.
Sutton, and M. Van Den Belt. ‘‘The Value of
the World’s Ecosystem Services and Natural
Capital.’’ Nature 387(1997):253–60.
Deng, Y. ‘‘Present and Expected Economic Costs
of Zebra Mussel Damages to Water Users with
Great Lakes Intakes.’’ Ph.D. dissertation. The
Ohio State University, August 1996.
Drake, J.M., and J.M. Bossenbroek. ‘‘The Potential
Distribution of Zebra Mussels in the United
States.’’ BioScience 54,10(2004):931–41.
Eads, B. Personal Communication. Fishers of Men
Tournament, February 2007.
FDEP (Florida Department of Environmental
Protection), Division of Water Resource Man-
agement. ‘‘Basin Status Report—Lake Okee-
chobee.’’ November 2001.
FFWCC (Florida Fish and Wildlife Conserva-
tion Commission), Internet site: http://www.
floridafisheries.com/ramps/ (Accessed August
3, 2003).
Finnoff, D., J.F. Shogren, B. Leung, and D. Lodge.
‘‘The Importance of Bioeconomic Feedback in
Invasive Species Management,’’ Ecological Eco-
nomics 52(2005):367–81.
GAMS Development Corporation. Software.
Washington, DC: GAMS, 1998.
Griffiths, R.W., D.W. Schloesser, J.H. Leach, and
W.P. Kovalak. ‘‘Distribution and Dispersal of
the Zebra Mussel (Dreissena polymorpha) in the
Great Lakes Region.’’ Canadian Journal of
Fisheries and Aquatic Sciences 48(1991):1381–8.
Hayward, D., and E.D. Estevez. ‘‘Suitability of
Florida Waters to Invasion by the Zebra Mussel
(Dreissena polymorpha).’’ Mote Marine Labo-
ratory Technical Report No. 495, 1997.
Hebert, P.D.N., B.W. Muncaster, and G.L. Mack-
ie. ‘‘Ecological and Genetic Studies in Dreissena
polymorpha (Pallas): A New Mollusk in the
Great Lakes.’’ Canadian Journal of Fisheries
and Aquatic Sciences 46(1989):1587–91.
Johnson, L.E., and J.T. Carlton. ‘‘Post-Establish-
ment Spread in Large-Scale Invasions: Dispersal
Mechanisms of the Zebra Mussel Dreissena
polymorpha.’’ Ecology 77,6(1996):1686–90.
Lauer, T.E., and A. Spacie. ‘‘Space as a Limiting
Resource in Freshwater Systems: Competition
Between Zebra Mussels (Dreissena polymorpha)
and Freshwater Sponges (Porifera).’’ Hydrobio-
logia 517(2004):137–45.
Leung, B., D.M. Lodge, D. Finnoff, J.F. Shogren,
M.A. Lewis, and G. Lamberti. ‘‘An Ounce of
Prevention or a Pound of Cure: Bioeconomic
Risk Analysis of Invasive Species.’’ Proceeding of
the Royal Society Biological Studies 269(2002):
2407–13.
Nalepa, T.F., J.A. Wojcik, D.L. Fanslow, and G.A.
Lang. ‘‘Initial Colonization of the Zebra Mussel
(Dreissena polymorpha) in Saginaw Bay, Lake
Huron: Population Recruitment, Density, and
Size Structure.’’ Journal of Great Lakes Re-
search 21,4(1995):417–34.
O’Neill, C.R., Jr. ‘‘Economic Impact of Zebra
Mussels—Results of the 1995 National
Zebra Mussel Information Clearinghouse
Study.’’ Great Lakes Research Review 3(1997):
35–42.
Phillips, S., T. Darland, and M. Systsma. ‘‘Potential
Economic Impacts of Zebra Mussels on the
Hydropower Facilities in the Columbia River
Basin.’’ Pacific States Marine Fisheries Com-
mission Report, 2005.
Riccciardi, A., R.J. Neves, and J.B. Rasmussen.
‘‘Impending Extinctions of North American
Freshwater Mussels (Unionoida) Following the
Zebra Mussel (Dreissena polymorpha) Inva-
sion.’’ Journal of Animal Ecology 67(1998):
613–9.
Strayer, D.L., J. Powell, P. Ambrose, L.C. Smith,
M.L. Pace, and D.T. Fischer. ‘‘Arrival, Spread,
and Early Dynamics of a Zebra Mussel
(Dreissena polymorpha) Population in the
Hudson River Estuary.’’ Canadian Journal of
Fisheries and Aquatic Sciences 53(1996):
1143–9.
Thorp, J.H., J.E. Alexander, and G.A. Cobbs.
‘‘Coping with Warmer, Large Rivers: A
Field Experiment on Potential Range Expan-
sion of Northern Quagga Mussels (Dreissena
bugensis).’’ Freshwater Biology 47(2002):1779–
90.
University of Florida. Discovery of Invasive Zebra
Mussels Prompts Warnings from State Officials
University of Florida News, Internet site: //
http.news.ufl.edu/1998/10/07/zebra–2/ (Ac-
cessed June 20, 2007).
USACE (U.S. Army Corps of Engineers). Okee-
chobee Waterway Zebra Mussel Monitoring
Plan. Internet site: www.saj.usace.army.mil
(Accessed October 12, 2005).
USGAO (U.S. General Accounting Office). ‘‘In-
vasive Species Clearer Focus and Greater Com-
mitment Needed to Effectively Manage the
Problems.’’ Report to Executive Agency Officials,
GAO-03-1, October 2001.
USGS (U.S. Geological Survey). ‘‘Zebra Mussels
Cause Economic and Ecological Problems in
the Great Lakes.’’ GLSC USGS Fact Sheet
2000–6, created August 15, 2000.
———. USGS Real-Time Water Data for Florida.
Internet site: http://waterdata.usgs.gov/fl/nwis/
rt (Accessed October 10, 2006).
80 Journal of Agricultural and Applied Economics, Special Issue 2007

———. 2007. Non-Indigenous Aquatic Species
Database. Internet site: http://nas.er.usgs.gov/
taxgroup/mollusks/zebramussel/ (Accessed June
15, 2007).
VDGIF (Virginia Department of Game and Inland
Fisheries). Millbrook Quarry Zebra Mussel
Eradication. Internet site: http://www.dgif.state.
va.us/zebramussels/ (Accessed February 5, 2007).
Lee, Adams, and Rossi: Zebra Mussels in Florida 81
Related Documents