Optimal location, technology and capacity planning of biogas production and utilization plants Damiana Chinese, Piera Patrizio, Gioacchino Nardin DIEGM – Department of Electrical, Mechanical and Management Engineering, University of Udine Via delle Scienze 206 – 33100 Udine Abstract: In December 2013, the Italian Ministry for Economic Development finally started the long-awaited incentive program for biomethane grid injection and biomethane for transportation, which opens up new opportunities for alternative applications of biogas which are expected to bring additional environmental benefits. Because of the wider range of feasible options and of the increased complexity of incentive structures, identifying most suitable alternatives becomes more and more difficult for entrepreneurs and local authorities. Biomass feedstock is a scarce resource and the profitability, environmental and social impact of biogas projects are affected by decisions on technology, location and capacity, which are interdependent. The aim of this paper is to explore the mutual links between such decisions, and their impact on sustainability indicators at the light of Italian energy policies. Mixed integer linear programming is used to develop a biomass supply chain model to deal with strategic planning issues of biogas supply chains. The model is applied to a case study of a local community including 15 municipalities in Friuli Venezia Giulia, where a number of breeding, cropping and greenhouse farms could be involved in a joint biogas project or in the development of multiple, small scale initiatives. While bioenergy supply chain modelling has become a thriving research field with hundreds of contributions in international literature, studies are currently focused on solid biomass for electricity or for liquid biofuel production. In both cases, the adoption of optimization approaches is justified by the low energy density of biomass inputs. On the other hand, only a couple of models have been devised for and applied to biogas supply chains and, to the best of our knowledge, none of them considers the opportunities, costs and logistics issues of injecting gas into grids and of making it available as a vehicle fuel in CNG refueling stations. Keywords: Bioenergy supply chain, biogas, optimization modeling. 1.Introduction Because of the emphasis placed by international policy makers on bioenergy and biofuels as a means to reduce greenhouse gas emissions and because of the multiplicity of decisions required to structure new, bio-based energy systems, biomass supply chain design has become a crucial research field in the last decade. In the last few years, no less than six review papers on biomass-to-energy and biofuel supply chain optimization have been published in leading journals (An et al., 2011, Gold and Seuring 2011, Sharma et al., 2013, Mafakheri and Nasiri, 2014, De Meyer et al., 2014 and Yue et al., in press), each listing at least eighty references, mostly dealing with mathematical modelling efforts to support supply chain analysis and optimization. The outcomes of these reviews show good agreement on following facts: - Mixed Integer Linear Programming is the most widely used methodology (Sharma et al., 2013, An et al., 2011, De Meyer et al., 2014), especially for decisions on location (Mafakheri, Nasiri, 2014), technology selection, capital and investment, production planning, and inventory management. While its limitations in terms of computational effort and determinism are recognized, its flexibility and capability of capturing global optima, coherently with bottom-up engineering optimization modelling assumptions, are probably the main reasons for the success of MILP in this field. - In the light of the policy and regulatory issues, there is still very limited research on the assessment of the impact and supporting policy choices on the capital and operational performance of biomass supply chain (Mafakheri, Nasiri, 2014); - Most research is focused on ligno-cellulosic biomass from forestry or energy crops, which can be used for heat and power production or for liquid biofuel production in second generation biorefineries. While the anaerobic digestion path is considered in the review framework of some authors (Sharma et al., 2014), none of the reference they examine deals with biogas supply chains. While this may depend on the niche position of biogas compared with other biomass exploitation options, e.g. those including combustion, the practical interest for biogas application is rapidly growing, mainly because significant environmental benefits (e.g. GHG emission reduction) have been demonstrated by several LCA studies (Thyø and Wenzel, 2007, Poeschl et al., 2012, Caponio et al., 2013) and because of the high versatility of this fuel, which may be used as transport fuel as well as for heat and power generation. Although biogas technology allows the exploitation of substrates, such as manure and organic waste, available at

Welcome message from author
This document is posted to help you gain knowledge. Please leave a comment to let me know what you think about it! Share it to your friends and learn new things together.
Transcript
Optimal location, technology and capacity planning of biogas production and utilization plants
Damiana Chinese, Piera Patrizio, Gioacchino Nardin
DIEGM – Department of Electrical, Mechanical and Management Engineering, University of Udine Via delle Scienze 206 – 33100 Udine
Abstract: In December 2013, the Italian Ministry for Economic Development finally started the long-awaited incentive program for biomethane grid injection and biomethane for transportation, which opens up new opportunities for alternative applications of biogas which are expected to bring additional environmental benefits. Because of the wider range of feasible options and of the increased complexity of incentive structures, identifying most suitable alternatives becomes more and more difficult for entrepreneurs and local authorities. Biomass feedstock is a scarce resource and the profitability, environmental and social impact of biogas projects are affected by decisions on technology, location and capacity, which are interdependent. The aim of this paper is to explore the mutual links between such decisions, and their impact on sustainability indicators at the light of Italian energy policies. Mixed integer linear programming is used to develop a biomass supply chain model to deal with strategic planning issues of biogas supply chains. The model is applied to a case study of a local community including 15 municipalities in Friuli Venezia Giulia, where a number of breeding, cropping and greenhouse farms could be involved in a joint biogas project or in the development of multiple, small scale initiatives. While bioenergy supply chain modelling has become a thriving research field with hundreds of contributions in international literature, studies are currently focused on solid biomass for electricity or for liquid biofuel production. In both cases, the adoption of optimization approaches is justified by the low energy density of biomass inputs. On the other hand, only a couple of models have been devised for and applied to biogas supply chains and, to the best of our knowledge, none of them considers the opportunities, costs and logistics issues of injecting gas into grids and of making it available as a vehicle fuel in CNG refueling stations.
Keywords: Bioenergy supply chain, biogas, optimization modeling.
1.Introduction
Because of the emphasis placed by international policy makers on bioenergy and biofuels as a means to reduce greenhouse gas emissions and because of the multiplicity of decisions required to structure new, bio-based energy systems, biomass supply chain design has become a crucial research field in the last decade. In the last few years, no less than six review papers on biomass-to-energy and biofuel supply chain optimization have been published in leading journals (An et al., 2011, Gold and Seuring 2011, Sharma et al., 2013, Mafakheri and Nasiri, 2014, De Meyer et al., 2014 and Yue et al., in press), each listing at least eighty references, mostly dealing with mathematical modelling efforts to support supply chain analysis and optimization.
The outcomes of these reviews show good agreement on following facts:
- Mixed Integer Linear Programming is the most widely used methodology (Sharma et al., 2013, An et al., 2011, De Meyer et al., 2014), especially for decisions on location (Mafakheri, Nasiri, 2014), technology selection, capital and investment, production planning, and inventory management. While its limitations in terms of computational effort and determinism are recognized, its flexibility and capability of capturing global optima, coherently with bottom-up engineering optimization
modelling assumptions, are probably the main reasons for the success of MILP in this field.
- In the light of the policy and regulatory issues, there is still very limited research on the assessment of the impact and supporting policy choices on the capital and operational performance of biomass supply chain (Mafakheri, Nasiri, 2014);
- Most research is focused on ligno-cellulosic biomass from forestry or energy crops, which can be used for heat and power production or for liquid biofuel production in second generation biorefineries. While the anaerobic digestion path is considered in the review framework of some authors (Sharma et al., 2014), none of the reference they examine deals with biogas supply chains.
While this may depend on the niche position of biogas compared with other biomass exploitation options, e.g. those including combustion, the practical interest for biogas application is rapidly growing, mainly because significant environmental benefits (e.g. GHG emission reduction) have been demonstrated by several LCA
studies (Thyøand Wenzel, 2007, Poeschl et al., 2012, Caponio et al., 2013) and because of the high versatility of this fuel, which may be used as transport fuel as well as for heat and power generation.
Although biogas technology allows the exploitation of substrates, such as manure and organic waste, available at

little or no cost because of their few alternative utilization areas, its engineering economics and financial viability depends on incentives largely (Gebrezgabher et al., 2010) and should be therefore carefully investigated. Actually, in the field of biogas, traditional engineering economics approaches are mainly used, e.g. to simulate the operation of single, exemplary plants (Tahlegani, Kia, 2005, Gebrezgabher et al., 2010) and to determine the optimal plant size (Walla and Schneeberger, 2008, Gan and Smith, 2011) or the optimal timeliness for crops harvesting (Gunnarsson et al., 2008, Capponi et al., 2011) by repeated simulation and sensitivity analysis on continuous variables. When researching literature on biogas supply chains, optimization is more often meant to improve the performance of individual plants (Kana et al., 2012, Thorin et al., 2012) or sections of supply chains (Bekkering et al., 2010), rather than to analyse or design supply chains as a whole. Only recently, some model based approaches for analysing biogas supply chains as systems have been introduced. Few of them (Delzeit et al. 2012, Sorda et al., 2013) are spatially explicit, i.e. they associate the location of actually available biomass and of potential plants with nodes on a map rather than considering the supply radius of land circles around hypothetical plants as a determinant of logistics costs.
The models mentioned consider only combined heat and power generation as biogas exploitation option, which has been mainly supported by bioenergy promotion schemes in Italy, Germany and other countries until now with the aim of meeting national targets for electricity generation from RESs according to the EU Directive 2009/28/CE. However, the growing interest for other uses of biogas, such as upgrading for injection in natural gas grids to satisfy domestic heating requirements or for compression and sale in refuelling stations to feed CNG vehicles, is demonstrated by recent studies (Caponio et al., 2013, Börjesson and Ahlgren, 2012), adopting traditional engineering economics or energy systems modelling approaches.
The aim of this paper is to develop a biogas supply chain model which accounts for alternative uses of biogas while taking a supply chain oriented, spatially explicit approach. The goal is to identify the optimal location where new biogas plants should be installed and the most profitable technology and capacity options, thereby determining the optimal feedstock mix to be supplied to the plant and designing the structure of the required direct and reverse supply chains. For this purpose, a mixed integer programming model is developed from the perspective of a local authority which plans that future biogas ventures should be approved and built which maximize wealth generation for the whole territory, an objective that gets along with satisfactory profitability for each venture. We focus on agricultural biogas projects and for the case study, the technology options and the economic context described in section 2, which include the long-awaited incentive program for biomethane grid injection and biomethane for transportation finally approved by the Italian Ministry for Economic Development in December
2013, we develop the model whose main features are described in section 3. Results are discussed in section 4, while in section 5 conclusions on prospects for agricultural biogas plants under the new Italian incentive schemes are drawn.
2. Case study and system boundaries
The case study analyzed concerns 15 municipalities located in the hill country of Friuli Venezia Giulia Region. More than 40 years ago, the municipalities formed a consortium to develop joint services and to share knowledge and resources. Breeding and farming play a leading role in the economics of the area, being linked also to a well-developed food industry transforming meat (San Daniele) and dairy products (Montasio). As a consequence, potentials for biogas generation from agricultural byproducts are high, especially considering codigestion options and the use of energy crops as possible substrates. Especially maize is a leading crop in the region of concern: approximately 60% of the arable agricultural area, which corresponds to about 9000 hectars, is yearly sown with maize, with silage being extensively used as fodder. In many countries (see e.g. Delzeit, 2012) as well as in Italy (Carrosio, 2013), maize silage was also a preferred feedstock for agricultural biogas plants because of its high yield. With rising food prices and resulting discussions on competition of land for energy or food production (Popp et al., 2014), the use of maize for biogas generation is increasingly criticized also because of its limited contribution to GHG emission reduction (Boulamanti et al., 2013). Also in Italy support for biogas power plants using food crops as feedstock was cut down with the incentive mechanism introduced in 2012 (Decree of the Italian Minister of Economic Development 6 July 2012). The long-awaited incentive program for biomethane grid injection and biomethane for transportation started in December 2013, the Italian Ministry for Economic Development finally also introduces different incentive levels depending on plant capacity and feedstock mix. Because of the wider range of feasible options and of the increased complexity of incentive structures, identifying most suitable alternatives becomes more and more difficult for entrepreneurs and local authorities. The consortium is confronted with the economic objectives of enabling a profitable operation of farming and food industry and maximizing wealth creation in the area through efficient bioenergy ventures, as well as with environmental concerns, especially about meeting the requirements of directive 91/676/EC (Nitrates directive), and with social acceptance of agricultural biogas plants. The consortium aims at forecasting the possible evolution of biogas production and exploitation in its territory and at identifying the best location, technology and capacity options for future plants. As a first step toward this goal, options maximizing economic profits, i.e. NPVs, at community level under the current bioenergy and biomethane support schemes are investigated here.
2.1 System Boundaries
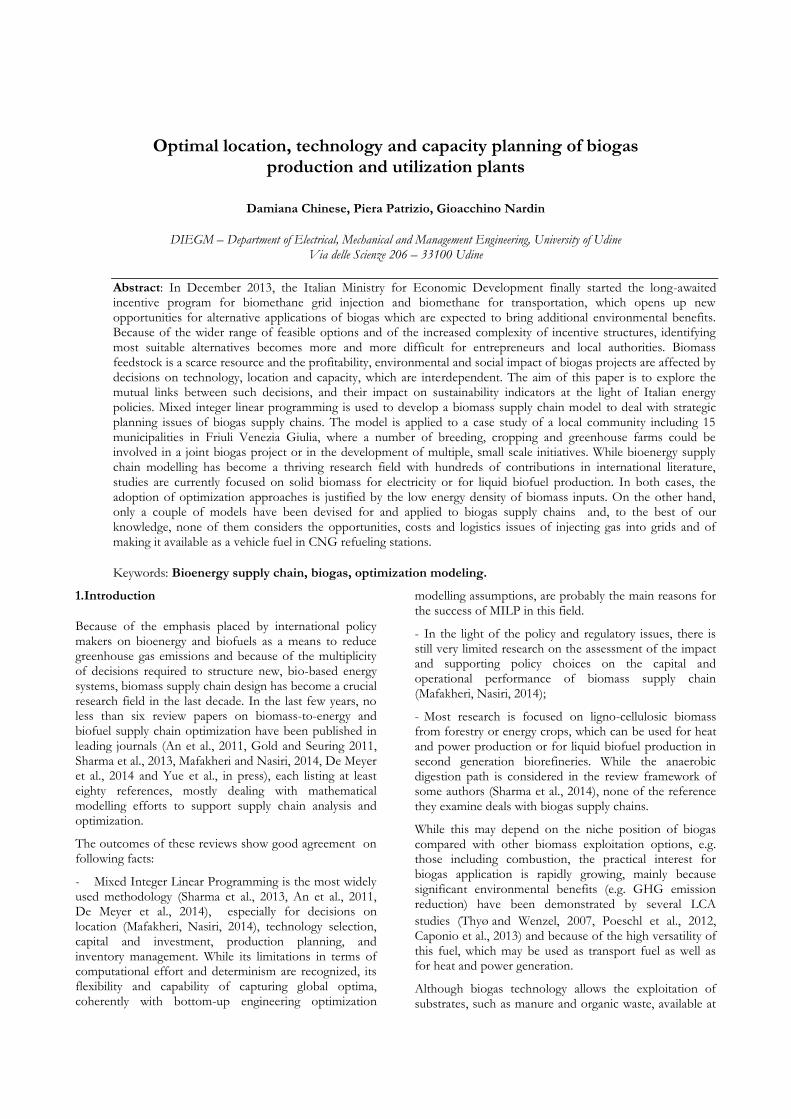
Figure 1 shows the boundaries of the system modeled in this research, i.e. the inputs and outputs considered as well as relevant activities and constraints, as discussed in paragraphs 2.2, 2.3 and 2.5, and the technology options analysed in paragraphs 2.4 from a technical and economical viewpoint.
Figure 1 System boundaries
2.2 Inputs considered and biogas potential
Given the dominance of breeding farms in the area, animal manures from main kinds of breeding, that is cattle, swine and chicken manure is considered. Both liquid and solid manure is evaluated as potential feedstock. Biogas production levels depend on so called volatile substance contained in substrates and on the biogas yield of volatile substance within each substrate kind.
Because of the leading position of maize among local crops it is considered as energy crop for codigestion. a yield of 60 t/ha is assumed for maize silage, based on data from local farmers. It is assumed that 10% of the total agricultural area currently sown with maize can be converted to maize silage for biogas production.
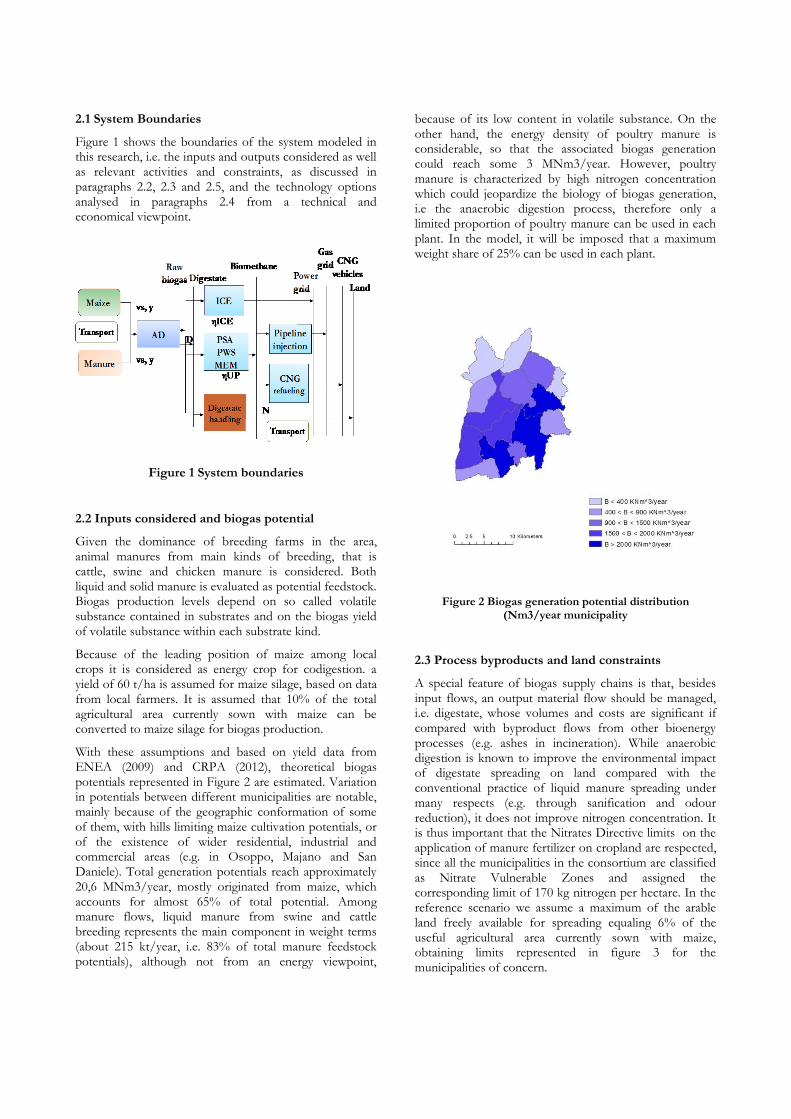
With these assumptions and based on yield data from ENEA (2009) and CRPA (2012), theoretical biogas potentials represented in Figure 2 are estimated. Variation in potentials between different municipalities are notable, mainly because of the geographic conformation of some of them, with hills limiting maize cultivation potentials, or of the existence of wider residential, industrial and commercial areas (e.g. in Osoppo, Majano and San Daniele). Total generation potentials reach approximately 20,6 MNm3/year, mostly originated from maize, which accounts for almost 65% of total potential. Among manure flows, liquid manure from swine and cattle breeding represents the main component in weight terms (about 215 kt/year, i.e. 83% of total manure feedstock potentials), although not from an energy viewpoint,
because of its low content in volatile substance. On the other hand, the energy density of poultry manure is considerable, so that the associated biogas generation could reach some 3 MNm3/year. However, poultry manure is characterized by high nitrogen concentration which could jeopardize the biology of biogas generation, i.e the anaerobic digestion process, therefore only a limited proportion of poultry manure can be used in each plant. In the model, it will be imposed that a maximum weight share of 25% can be used in each plant.
Figure 2 Biogas generation potential distribution (Nm3/year municipality
2.3 Process byproducts and land constraints
A special feature of biogas supply chains is that, besides input flows, an output material flow should be managed, i.e. digestate, whose volumes and costs are significant if compared with byproduct flows from other bioenergy processes (e.g. ashes in incineration). While anaerobic digestion is known to improve the environmental impact of digestate spreading on land compared with the conventional practice of liquid manure spreading under many respects (e.g. through sanification and odour reduction), it does not improve nitrogen concentration. It is thus important that the Nitrates Directive limits on the application of manure fertilizer on cropland are respected, since all the municipalities in the consortium are classified as Nitrate Vulnerable Zones and assigned the corresponding limit of 170 kg nitrogen per hectare. In the reference scenario we assume a maximum of the arable land freely available for spreading equaling 6% of the useful agricultural area currently sown with maize, obtaining limits represented in figure 3 for the municipalities of concern.

Figure 3 Limits on nitrate contents for digestate spreading (t/year municipality)
2.4 Technology options, costs and revenues
With regard to technology selection, many system configurations are possible in both biochemical processes and technologies (see, e.g., Weiland, 2010) and in biogas utilization processes (see, e.g., Pöschl et al., 2010), leading to different efficiencies. As to the core biological process, that is anaerobic digestion, a continuous mesophilic digestion process is assumed in this studies, as it is adopted in most Italian biogas plants because of its lower internal heating requirements and of the stability of the process parameters (CRPA, 2008). Yields considered in estimating potentials represented in Figure 1 correspond to this process and account for its internal losses and energy requirements. As to digestate management only conventional digestate disposal practices are considered, i.e. storage in tanks and application of untreated digestate on agricultural land, and corresponding capital costs are included in anaerobic digestion plant costs.
Internal combustion engines (ICEs) are the most common option for power generation. Their efficiency grows with size, while specific costs per kW decrease. Within the boundaries of the system of concern, we focus on power generation only and do not consider possible external uses of heat, e.g. through district heating, which were rarely exploited in Italy until now (Carrosio, 2013). Several technologies are available for biogas upgrading to biomethane meeting standards for use in vehicles or injection in municipal grids and they have been extensively reviewed e.g. by Vienna University of Technology (2012) and by Caponio (2013). The most commonly adopted, i.e. pressure swing adsorption (PSA), pressurised water scrubbing (PWS) and membrane technology (MEM) have been considered here. Economic and efficiency values assumed for these technologies are derived from Vienna University of Technology (2012). The same source has also been used to determine costs of grid injection
stations, which include compression, pipe connections, odorisation and adjustment of low heating value by propane addition. For refueling stations we built upon results of previous research (Chinese et al., 2013) about optimal location and capacity planning of CNG refueling station in Friuli Venezia Giulia Region. For all conversion technologies, linearized capital cost models are introduced including a fixed slope and a size independent intercept to account for decreasing specific investment costs.
As to revenues, the structure of incentives is different for depending on utilization paths. For power generation, stepped feed-in-tariffs have been introduced by the (Decree of the Italian Minister of Economic Development 6 July 2012), which are also differentiated depending on substrate mix: if more than 70% in weight of anaerobic digestion inputs comes from animal byproducts, including manure, plants are eligible for augmented feed-in-tariffs or premiums. A similar mechanism is introduced to support biomethane injection, where however three feedstock mix classes are introduced (i.e. below 50% in weight, above 50% in weight and 100% byproduct mix). The incentive mechanism for biomethane injection is also size dependent. For biomethane as a vehicle fuel, a tradable certificate (CIC) mechanism is introduced as for other biofuels, which is based on the quota obligation for fossil fuel traders in the transport sector.
Power feed in tariff [€/MWh]
Natural gas injection equivalent tariff
[€/Nm3]
Number of tradable
certificates for CNG
Size class upper limit
(Kw)
Feedstock
%
Size class uppe
r limit
(Sm3
/h)
Feedstock
%
Feedstock
%
<
70
>
70
<
50
>
50
100 <
70
>
70
100
300 180 236 250 59.89
59.89 75.578
1.342
1.742 2.342
600 160 206 500 28.52
59.89 75.578
1000 140 178 1000 28.52
57.04 71.3
5000 104 125 <1000
28.52
54.18 67.022
Table 1 Revenues from incentives and sales for alternative utilization paths
The certificate size is assumed to be equivalent to 1166 Nm3, and the number of certificates depends on substrate mix with three classes (below 70% in weight, above 70% in weight and 100% byproducts). As the market for biogas certificates has not been started, values estimates are

highly uncertain and based on results in completely different markets. A conservative value of 90 €/CIC is assumed as reference value. Additional incentives, in the form of additional certificates, are introduced to support the construction of new refueling station. The values reported in table 1 correspond to that scenario, since at the moment no refueling station exists in the area of concern. To calculate revenues from CNG sales a reference value of 0.98 €/kg is assumed.
2.5 Demand modelling
Power from biogas enjoys priority dispatch benefits and is thus assumed to be completely absorbed by the power grid, independently of local demand. For natural gas, injection in local distribution grids, which exist in each municipality of the consortium, is the preferred choice, although the promotion schemes also considers dispatching and bilateral agreements with remote vendors as feasible options. Historical natural gas demand for the municipalities was available from previous internal studies from the consortium and is reported in Table 2. Estimating demand of CNG for transport is a more complex task. CNG is a niche market and demand in the area is particularly low due to lacking refueling stations; however, if a station is built it is able to attract also customers from farther municipalities. We built upon previous research (Chinese et al., 2013) on feasibility of new stations in Friuli Venezia Giulia using the simulation model developed in that region to calculate the demand associated with a single station built within the consortium. As shown in table 2, this demand varies depending on where the station is located not only because population and number of vehicles are locally different, but also due to the different attractiveness toward potential customers from farther municipalities outside the consortium.
Table 2 Natural gas demand for heating and vehicles
3. Model development and implementation
The main model has been originally developed for power station siting and is described in detail elsewhere (Chinese et al., 2014). Its objective function maximizes the annual equivalent profit, calculated as difference between revenues from power, CNG and biomethane sales and feed-in-tariffs or premiums, and annual equivalent systems costs, including biomass procurement and transport, digestate transport and spreading in the fields, manpower, operation and maintenance and capital costs of various plant components. Binary variables Xtech are introduced to account for size independent capital cost components if and only if a capacity S larger than 0 is assigned to technology tech according to equation 1, where b and m represent the intercept and slope of linearized cost functions.
C j= btech X tech+ mtech S tech
(1)
Special ordered sets of binary variables are introduced to model tariff classes for various utilization pathways and feedstock mixes. Energy and mass flow balances are introduced for each technology represented in Figure 1, expressing outputs as function of input flows and efficiency or yield coefficients. Binary variables associated with each technology and capacity are also used to model logical conditions, for instance imposing that at most 1 CNG station is built in the whole consortium or that at most one upgrading technology is selected in each site.
The resulting mixed integer programming model has been implemented in GAMS and solved with the commercial solver CPLEX.
4. Results and discussion
A reference scenario was defined adopting parameters presented in section 2, which were deemed as most likely values or conservative estimates.
The results for this scenario are represented in figure 4. Red circles indicate power plants and the blue star indicates an upgrading plant with a CNG refuelling station.
In the reference scenario, four power plants with a capacity of 300 kW each are installed in the municipalities of Moruzzo, Colloredo, San Daniele and Coseano. In the last municipality, also an upgrading and refuelling station is installed. Comparing suggested plant locations with potentials, constraint and demand data, it is found that three out of four plants are installed in those municipalities where both potentials and spreading limits reach highest levels, thus reducing both direct and reverse logistics costs. Only in one case (Moruzzo) the plant is located in an intermediate position between two medium-high potential areas.
2497 315
692 360
1910 434
Dignano 1125 461
Fagagna 4325 425
Flaibano 438 445
1197 287
2533 340
712 378
Osoppo 1582 297
985 337
Rive d'Arcano 916 392
San Daniele del Friuli 12730 372
San Vito di Fagagna 406 429
693 313
Municipality
Natural gas demand
for heating, domestic
and industrial
purposes
[kNm3/year]
Estimated potential
capacity of single
CNG refueling
station
[kNm3/year]
Buja
Colloredo di Monte Albano
Coseano
Forgaria nel Friuli
Majano
Moruzzo
Ragogna
Treppo Grande

Figure 4: Optimal plant location and supply areas in the reference scenario
The upgrading station in Coseano is sized to meet the requirements of the refuelling station: these are relatively small, although the selected site has the third biggest capacity in the list reported in table 2 and for this reason membrane separation technology is preferred. Injection of biomethane into the natural gas grid is never performed, which entails that in this context, under present incentive structure and estimates average natural gas price power generation, even without external use of heat, and secondly transportation uses are more profitable. To verify this and to assess the impact of uncertain market prices on optimal solution, a sensitivity analysis is performed by changing average natural gas price between 90% and 120% of current values and calculating incentives and revenues accordingly. The sale price of CNG for vehicles is proportionally modified at the same time.
Table 3: Optimal system configuration depending on natural gas market price
90% 100% 110% 120%
1500 1200 0 0
10680 8544 0 0
6050 4839 0 0
0 851 6494 6794
6050 5690 6494 6794
0 434 3663 3832
- MEM PWS PWS
0 0 3229 3407
0 434 434 425
5 4 2 2
30% 30% 38% 38%
19% 22% 27% 29%
94% 87% 99% 100%
1478 1498 3022 5466
Land saturation for digestate
spreading
NPV [k€]
Adopted upgrading technology
Biomethane for grid injection
[kNm3/year]
CNG to refuelling station
[kNm3/year]
Number of anaerobic digestors
% ECP on total feedstock
% ECP on available ECP
Natural gas price parameter
Power generation capacity [kW]
Net electricity production
[MWh/year]
Biogas for power generation
[kNm3/year]
Biogas to upgrading processes
[kNm3/year]
Total biogas production
[kNm3/year]
Total biomethane from
upgrading [kNm3/year]
Results are reported in table 4, where the 100% column summarizes the reference scenario. It can be observed that for a 10% reduction in natural gas price investing in upgrading and CNG refueling becomes a suboptimal choice: the installation of a fifth 300 kW biogas power station is preferred. A 10% increment in natural gas price leads the optimization procedure to opt for upgrading, and two PWS plants with more than 1000 kNm3/year production capacity each are installed, one partially meeting the local gas grid demand in Majano and the other in Coseano, where both grid injection and CNG refueling are performed. For an additional 10% increment, the optimization expands biomethane production and particularly injection, selecting sites with higher natural gas demand such as Fagagna and San Daniele, even though this choice results in a somewhat smaller CNG refueling station.
Table 4: Optimal system configuration depending on biofuel certificate trading values
0 50 90 300 500
1500 1500 1200 300 300
10680 10680 8544 2136 2136
6050 6050 4839 1210 1210
0 0 851 2406 2406
6050 6050 5690 3616 3616
0 0 434 1357 1357
- - MEM PWS PWS
0 0 0 923 923
0 0 434 434 434
5 5 4 2 2
30% 30% 30% 15% 15%
19% 19% 22% 6% 6%
94% 94% 87% 87% 87%
1478 1478 1498 3198 4910
Number of anaerobic digestors
% ECP on total feedstock
% ECP on available ECP
Land saturation for digestate
spreading
NPV [k€]
Biogas to upgrading processes
[kNm3/year]
Total biogas production
[kNm3/year]
Total biomethane from
upgrading [kNm3/year]
Adopted upgrading technology
Biomethane for grid injection
[kNm3/year]
CNG to refuelling station
[kNm3/year]
Biofuel Certificates value [€]
Power generation capacity [kW]
Net electricity production
[MWh/year]
Biogas for power generation
[kNm3/year]
The optimal solution is thus extremely sensitive to natural gas prices, of which both sales and incentive proceeds are a function. Also incentives in the form of tradable certificates (CIC) plays a significant role, as can be derived from the sensitivity analysis presented in Table 4 for different market values of certificates.
The reference value of 90 €/CIC is approximately a breakeven point: for smaller values no upgrading is selected. For larger values, the optimal solution is relatively stable, with a refueling station in Coseano and a 300 kW power plant in Colloredo. Rather than following

higher CNG demand by siting the plant in municipalities with lower biogas potentials and higher logistics costs, such as Dignano and Flaibano which are located at the left margin of the green supply area in Figure 4, the optimization seems to use higher revenues from CICs as a cross subsidy, investing in efficiency by constructing a larger plant, meant for grid injection also, which enables the use of the more efficient PWS upgrading technology. As unitary proceeds from CICs become high, the procedure seeks to maximize their number by changing the feedstock mix, becoming eligible for the enhanced quotas reserved to plants using only byproducts as substrates. The interdependence between output, technology, location and substrate mix decisions in biogas supply chain designs becomes thus evident under current incentive structure. In the area of concern, such decisions are also significantly affected by digestate management practices.
The impact of Nitrate Directive constraints has been tested by changing the proportion of freely available land for digestate spreading by the factors reported in the first row of table 5, correspondingly modifying municipal limit values presented in Figure 3.f the value is significantly reduced, only a single plant can be built, with the optimization trying to identify the most profitable solution under such restrictive constraints. For this purpose, manure shares are maximised to reap higher incentives, although this means that logistics and digestate management costs may become higher because the low energy density of such substrates leads to higher input and digestate volumes.
Table 5: Optimal system configuration depending on land availability for digestate spreading under Nitrates Directive
constraints
25% 50% 100% 167%
300 0 1200 900
2136 0 8544 6408
1210 0 4839 3629
0 2150 851 2597
1210 2150 5690 6226
0 1213 434 1465
- PWS MEM PWS
0 821 0 1031
0 392 434 434
1 1 4 4
8% 0% 30% 23%
1% 0% 22% 18%
87% 98% 87% 87%
561 1197 1498 1825
Land saturation for digestate
spreading
NPV [k€]
Land availability parameter
Adopted upgrading technology
Biomethane for grid injection
[kNm3/year]
CNG to refuelling station
[kNm3/year]
Number of anaerobic digestors
% ECP on total feedstock
% ECP on available ECP
Power generation capacity [kW]
Net electricity production
[MWh/year]
Biogas for power generation
[kNm3/year]
Biogas to upgrading processes
[kNm3/year]
Total biogas production
[kNm3/year]
Total biomethane from upgrading
[kNm3/year]
If more land is available for digestate spreading, its saturation rate remains stable and the additional disposal capacity is exploited by expanding biomethane production for grid injection. Since all other values have been kept constant at reference levels in this analysis, this means that the exclusion of the injection option in the reference case does not only depend on natural gas prices or incentive levels, but is also remarkably affected by digestate disposal costs and options in the area of concern. Under estimated reference values for incentives and proceeds, not only capacity but also technology decisions are deeply affected by the opportunities of efficiently managing a byproduct, that is digestate, which has the remarkable feature of having comparable logistics costs as the main process input.
Conclusions
The introduction of incentives for biogas upgrading has changed prospects for biomethane compared with previous analyses in the Italian context (Caponio et al., 2013). In the context analyzed and under the assumptions adopted in this paper, the biogas supply chain optimization model introduced switches between several biogas utilization paths, upgrading technologies and substrate mix options. The high sensitivity of optimal solutions to boundary conditions deserves further investigation, also by expanding and changing the systems boundaries, for instance by including advanced digestate treatment and denitrification options, which are associated with a well defined incentive scheme in the framework of the promotion of electricity generation from biogas. Future research is also planned to address the environmental impact of different utilization paths and technology options more in detail within the developed supply chain optimization model. In fact, the results of this research confirm the opportunity of modeling biogas and bioenergy plants mathematically with a supply chain view and with spatially explicit approaches, because of remarkable interactions between location, technology and capacity decisions and also in view of the high uncertainty of support schemes and levels that have just been started and not completely defined in the Italian context.
References
An H., Wilhelm W.E., Searcy S.W. (2011), Biofuel and petroleum-based fuel supply chain research: A literature
review. Biomass and Bioenergy, Volume 35(9), Pages 3763-3774
Bekkering J., Broekhuis A.A., Van Gemert V.J.T., Hengeveld E.J. (2010). Balancing gas supply and demand with a sustainable gas supply chain – A study based on
field data. Applied Energy, Volume 111, Pages 842- 852.
Boulamanti A.K., Maglio S.D., Giuntoli J., Agostini A., (2013). Influences of different practices in biogas
sustainability. Biomass and Bionergy, Volume 53, Pages 149-161.
Caponio G., Digiesi S., Mossa G., Mummolo G., (2013). Economic and environmental savings from biogas upgraded applications. In Proceedings of The XVIII Summer School “Francesco Turco”, Senigallia (AN), 11-13 settembre.
Capponi S., Fazio S., Barbanti L., (2011). CO2 savings affect the break-even distance of feedstock supply and
digestate placement in biogas production. Renewable
Energy, Volume 37(1), Pages 45-52.
Carrosio G., (2013). Energy production from biogas in the Italian countryside: Policies and organizational models.
Energy Policy, Volume 63, Pages 3-9.
Chinese D., Meneghetti A., Nardin G., (2004). Diffused introduction of Organic Rankine Cycle for biomass-based power generation in an industrial district: a systems
analysis. International Journal of Energy Research. Volume 28 (11), Pages 1003-1021.
Chinese D., Patrizio P., Nardin G. (2014), Effects of changes in Italian bioenergy promotion schemes for agricultural biogas projects: insights from a regional optimization model, Research Report, DIEGM, University of Udine
CRPA spa (2012). Conoscere per competere- il digestato, un utile sottoprodotto del biogas. Centro divulgazione agricola. Settembre 2012. http://www.crpa.it/media/documents/crpa_www/Pubblicazi/conoscer&competere/_conoscerexcompeter_n4.pdf
De Meyer A., Cattrysse D., Rasinmäki J., Van Orshoven J., (2014). Methods to optimise the design and management of biomass-for-bioenergy supply chains: A
review. Renewable and Sustainable Energy Reviews, Volume 31, Pages 657-670.
Delzeit R., Britz W., Holm-Müller K., (2011). Modelling regional input markets with numerous processing plants: The case of green maize for biogas production in
Germany. Environmental Modelling & Software, Volume 32, Pages 74-84.
Enea (2009), Analisi e stima quantitativa della potenzialità di produzione energetica da biomassa digeribile a livello regionale. Studio e sviluppo di un modello per unità energetiche. Report RSE/2009/182. http://www.enea.it/it/Ricerca_sviluppo/documenti/ricerca-di-sistema-elettrico/celle-a-combustibile/rse182.pdf Gan J., Smith C.T. (2011). Optimal plant size and feedstock supply radius: A modeling approach to
minimize bioenergy production costs. Biomass and
Bioenergy, Volume 35(8), Volume 3350-3359. Gebrezgabher S.A., Meuwissen M.P.M, Prins B.A.M, Oude Lansink A., (2010). Economic analysis of anaerobic digestion : A case of Green power biogas plant in The
Netherlands. NJAS – Wageningen Journal of Life
Sciences, Volume 57 (2), Pages 109-115. Gold S., Seuring S., (2011). Supply chain and logistics
issues of bio-energy production. Journal of Cleaner
Production, Volume 19 (1), Pages 32-42. Gunnarsson C., Vågström L., Hansson P-A. (2008). Logistics for forage harvest to biogas production—Timeliness, capacities and costs in a Swedish case study.
Biomass and Bioenergy, Volume 32 (12), Pages 1263-1273. Lantz M., (2012). The economic performance of combined heat and power from biogas produced from manure in Sweden – A comparison of different CHP
technologies. Applied Energy, Volume 98, Pages 502-511. Mafakheri F., Nasiri F., (2014). Modeling of biomass-to-energy supply chain operations: Applications, challenges
and research directions. Energy Policy ,Volume 67, Pages 116-126. Pantaleo A., De Gennaro B., Shah N. (2013), Assessment of optimal size of anaerobic co-digestion plants: An application to cattle farms in the province of Bari (Italy).
Renewable and Sustainable Energy Reviews, Volume 20, Pages 57–70. Popp J., Lakner Z., Rákos H., Fári M. (2014). The effect of bioenergy expansion: Food, energy, and environment.
Renewable and Sustainable Energy Reviews. Volume 32, Pages 559–578. Pöschl M., Ward S., Owende P. (2010). Evaluation of energy efficiency of various biogas production and
utilization pathways. Applied Energy, Volume 87(11), Pages 3305-3321. Pöschl M., Ward S., Owende P. (2012). Environmental impacts of biogas deployment – Part II: life cycle assessment of multiple production and utilization
pathways. Journal of Cleaner Production, Volume 24, March 2012, Pages 184-201 Sharma B, Ingalls R. G., Jones C.L., Khanchi A. (2013) Biomass supply chain design and analysis: Basis, overview, modeling, challenges, and future. Review Article.
Renewable and Sustainable Energy Reviews, Volume 24, Pages 608-627. Sorda G., Sunak Y., Madlener R., (2013). An agent-based spatial simulation to evaluate the promotion of electricity
http://www.crpa.it/media/documents/crpa_www/Pubblicazi/conoscer&competere/_conoscerexcompeter_n4.pdf

from agricultural biogas plants in Germany. Ecological
Economics, Volume 89, Pages 43-60. Thorin E., Lindmark J., Nordlander E., Odlare M., Dahlquist E., Kastensson J., Leksell N., Pettersson C-M., (2012). Performance optimization of the Växtkraft
biogas production plant. Applied Energy, Volume 97, Pages 503-508.
Walla C., Schneeberger W., (2008). The optimal size of a
biogas plant. Biomass and Bioenergy, Volume 32(6), Pages 551-557.
Weiland P., (2010). Biogas production: current state and
perspectives. Appl Microbiol Biotechnology , Volume 85, Pages 849–860.
Yue D., You F, Snyder S.W., (in press). Biomass-to-bioenergy and biofuel supply chain optimization: Overview, key issues and challenges. Computers and Chemical Engineering (2014). http://dx.doi.org/10.1016/j.compchemeng.2013.11.016

Related Documents