Optimal Institutional Mechanisms for Funding Generic Advertising: An Experimental Analysis Kent D. Messer, Todd M. Schmit, Harry M. Kaiser Cornell University Contact Information: Kent Messer, 454 Warren Hall, 607.255.4223, [email protected] Todd Schmit, 312 Warren Hall, 607.255.3015, [email protected] Harry Kaiser, 349 Warren Hall, 607.255.1598, [email protected] Selected Paper prepared for presentation at the American Agricultural Economics Association Annual Meeting, Providence, Rhode Island, July 24027, 2005 Copyright 2005 by Messer, Schmit, and Kaiser. All rights reserved. Readers may make verbatim copies of this document for non-commercial purposes by any means, provided that this copyright notice appears on all such copies. 1

Welcome message from author
This document is posted to help you gain knowledge. Please leave a comment to let me know what you think about it! Share it to your friends and learn new things together.
Transcript
Optimal Institutional Mechanisms for Funding Generic Advertising: An Experimental Analysis
Kent D. Messer, Todd M. Schmit, Harry M. Kaiser Cornell University
Contact Information: Kent Messer, 454 Warren Hall, 607.255.4223, [email protected] Todd Schmit, 312 Warren Hall, 607.255.3015, [email protected]
Harry Kaiser, 349 Warren Hall, 607.255.1598, [email protected]
Selected Paper prepared for presentation at the American Agricultural Economics Association Annual Meeting, Providence, Rhode Island, July 24027, 2005
Copyright 2005 by Messer, Schmit, and Kaiser. All rights reserved. Readers may make verbatim copies of this document for non-commercial purposes by any means, provided that this copyright notice appears on all such copies.
1
Generic advertising programs have been a popular tool used by many agricultural
commodity organizations in the United States to enhance market demand, raise prices,
and increase producer net revenue. These programs operate by assessing producers in an
industry and using the collected funds for generic (non-branded) advertising and
promotion of the commodity. Currently, there are thirteen federal programs and over
fifty state programs in existence. The majority of economic studies evaluating generic
advertising programs have found large benefits for producers relative to costs.
Funding for some commodity programs originally came from voluntary donations
from participants via a voluntary contributions mechanism (VCM). While initial
contributions for the advertising programs using a VCM were typically high, free-riding
and decreased donations eventually became a significant problem, raising questions of
equity and fairness. As a result of these concerns, essentially all VCMs were abandoned
and producers held referenda on whether to adopt mandatory assessments to fund the
advertising programs. Virtually all programs in operation today are mandatory, as all
producers are required to pay assessments based on their marketing volume.
However, some individual producers have recently challenged the
constitutionality of mandatory generic advertising programs arguing that being required
to contribute money to generic advertising programs is an infringement of their rights to
free speech. Currently, there are over 70 First Amendment challenges to generic
advertising programs being litigated. To date, there have been decisions delivered by
district and circuit courts on both sides of the issue, upholding the constitutionality of
some of the programs and ruling others unconstitutional. In their review of these
lawsuits, Crespi and Sexton conclude that court actions from parties opposed to
2
mandatory participation threaten to undermine the current system of generic advertising.
Because of these challenges, there is a need to assess whether a new institutional
arrangement that maintains the voluntary spirit of the court findings will achieve the
same goals and benefits of generic advertising.
The U.S. Supreme Court has issued opinions in two cases and will be hearing a
third case in 2005. In Glickman v. Wileman (1997), the Court ruled that the advertising
program for California peaches, plums, and nectarines does not violate the First
Amendment. The Court reasoned that generic advertising was part of a broader set of
economic regulations (i.e., a marketing order) in which producers were already
“constrained by the regulatory scheme,” and hence exempt from the First Amendment
challenge. However, in 2001, the Court ruled in U.S. v. United Foods that the mushroom
advertising program was unconstitutional since the only purpose of the program was
speech – that is, advertising. The Court cited the fact that, unlike the California peaches,
plums, and nectarines program, the mushroom program was a stand-alone program for
advertising and not part of a broader set of regulations restricting marketing autonomy.
The Court is set to hear arguments on one of the larger programs (beef), with a decision
expected in mid-2005.1 As these court battles continue, producers and commodity
programs face the question of what type of funding mechanism should replace the current
mandatory ones if (or when) they are ruled unconstitutional.
An alternative funding mechanism that could potentially yield long-term benefits
to producers is the provision point mechanism (PPM) for public goods. The PPM, which
has never been used to fund generic advertising for agricultural commodities, has two
desirable characteristics given the current legal environment: (1) it is voluntary and thus
3
would not likely be vulnerable to legal challenges based on freedom of speech, and (2) it
has been shown in both the lab and the field to reduce the incentives for free-riding and to
generate greater total contributions than the VCM does (Isaac, Schmidtz, and Walker;
Suleiman and Rapoport; Dawes et al.; Marks and Croson 1998, 1999; Rondeau, Poe,
Schulze; Rose et al.).
The PPM operates by announcing a threshold (or goal) for the fundraising
campaign and soliciting contributions to achieve this threshold. If the threshold is met or
exceeded, the contributions collected are used to fund the public good; otherwise all of
the contributions are returned and no funding is provided. In contrast, while a VCM also
frequently includes the announcement of a goal (such as with fundraising campaigns for
the United Way, National Public Radio, or religious organizations), the VCM retains
whatever is contributed regardless of whether the goal is achieved, leaving the
organization to either adjust to a lower budget level or extend the time frame of the
fundraising effort.
With the PPM, the combination of the “money-back guarantee” and the threat of
complete funding shut-down if the threshold is not achieved has been shown to increase
contributions (Rapoport and Eshed-Levy; Cadsby and Maynes). In situations of complete
information, the PPM has desirable theoretical properties with the dominant Nash
equilibrium being for each subject to cost-share, where the sum of contributions equals
the cost of the threshold (Bagnoli and Lipman). Since mandatory programs are still
constitutional for most commodities, the economic experimental laboratory provides an
ideal setting in which to explore the benefits and optimal design of a PPM in case an
alternative mechanism becomes needed.
4
Two recent studies (Krishnamurthy; Messer, Kaiser, and Schulze) provide
experimental evidence of the attractiveness of the PPM for generic commodity
advertising, showing the PPM to reduce free-riding and generate greater total
contributions relative to the VCM. Messer, Kaiser, and Schulze further demonstrate that
critical psychological and economic conditions created in the laboratory can produce
experimental results for contributing to generic advertising that closely parallel historic
results observed in the egg industry. However, Messer, Kaiser, and Schulze considered
only one PPM threshold (70%). Several key questions related to the institutional design
of a PPM need to be explored to find the combination of features and procedures that
could lead to maximum producer welfare.
The first question that arises is what impact producer referenda have on
contributions to the advertising program and, ultimately, on producer surplus. Producer
referenda are part of essentially all generic advertising programs. Referenda are often
used when the program is contemplating a change in its operation or funding structure.
However, the impacts of referenda on public good giving have not previously been given
much attention. A study by Alm, McClelland, and Schulze suggests that voting creates a
social norm that can positively affect the level of contributions to public goods. To our
knowledge no one has examined the impact of referenda on contributions and threshold
achievement in the PPM.
The second question is what is the optimal threshold for the PPM. The third
question is what combination of institutional features leads to stability of contributions to
the advertising program over time. The fourth question is the impact that effectiveness of
5
the advertising program has on producer contributions. These questions are the subject of
the research summarized in this paper.
The remainder of this paper is organized as follows. In the next section, the
experimental design is presented. This is followed by a presentation of the results,
including the application of a mixed-effects econometric model to identify the important
determinants of producer surplus and contributions to advertising over time. Finally, a
summary of the main findings and policy implications is presented.
Experimental Design
Each experimental session involved three separate parts. The first two parts were
designed to familiarize subjects with the experimental platform and to demonstrate to
subjects the benefits of the advertising program. Part A of the experiment had no
advertising program, Part B had an advertising program whose funding was mandatory,
and Part C had an advertising program whose funding was provided through a PPM with
a varying threshold. The order of these three parts mimics the possible succession of
generic advertising policies over time should mandatory programs be ruled
unconstitutional. In each experimental session, twenty subjects assumed the role of
producer.
Subjects were unaware in advance of the number of parts of the experiment. At
the beginning of each part, subjects read the instructions and then the administrator orally
described the experiment and answered all subjects’ questions. The first part of the
experiment consisted of five rounds and did not include the advertising program.
Subjects were randomly assigned to a computer that had a spreadsheet informing them of
their costs for producing up to three units of a fictitious commodity. In each round,
6

subjects submitted their offers to sell each of their three units. These offers were sent
directly to an Access database using Visual Basic for Applications. The quantity
demanded was determined after all the offers were submitted. Subsequently, the
administrator calculated the market price based on the offers and quantity demanded.
When notified by the administrator, the subjects retrieved the market price and learned
whether they had sold some or all of their units. The subjects’ spreadsheets calculated
their profit in each round.
In the experiment, demand was assumed to be perfectly price inelastic and the
administrator assumed the role of buyer in the market. For each round, stochastic
demand was determined by a subject randomly drawing a ball, with replacement, from a
bag containing labeled bingo balls numbered from forty to forty-six. The number on the
drawn ball represented the number of units demanded. A symmetric triangular
distribution was used, thereby creating price fluctuations that mimicked the price changes
observed for many agricultural commodities.
Since the objective of this research was to answer the four questions related to
producer contributions in response to varying mechanism designs, the simplifying
assumption of a perfectly inelastic demand was made to ensure that the stochastic
demand was transparent to subjects. Furthermore, this assumption helped to ensure
control over the rate of return on advertising. This assumption is plausible, as previous
estimated demand elasticities for some agricultural commodities have been quite inelastic
(e.g., fluid milk, -0.04 (Schmit and Kaiser, 2004); eggs, -0.02 to -0.17 (Brown and
Schroeder); walnuts, -0.08 (Kaiser, 2002), almonds, -0.20 (Crespi and Chacon-Cascante);
and pork, -0.20 (Reed, Levedahl, and Clark)).
7
Each subject could produce up to three units; therefore, in each round there were a
total of sixty units available. Each subjects’ costs were constant throughout the
experiment. Subjects paid the cost of producing the units only if the units were
successfully sold, a simplification that ensured that the experiment had control over the
rate of return on advertising. The subjects’ first two units cost the same, $1.00, therefore
all subjects had a strong incentive to have an increase in price. The subjects’ third unit
cost more, distributed from $1.10 to $5.06, and established the supply elasticity of 0.25.
The own price elasticity of supply of 0.25 is also in the range of estimates of the supply
elasticities for agricultural commodities (e.g., milk, 0.30 (Chavas and Klemme),2 eggs,
0.20 (Schmit and Kaiser, 2003), and beef, short-run 0.05 to long-run 0.45 (Buhr and
Kim)).
For each round, the market price was determined using a uniform price auction,
which sets the price for all units sold at the first rejected offer. The uniform price
auction, also referred to as a Vickrey or Nth-price auction, is common in experimental
settings because of its transparency, ease of administration, and incentive-compatible
characteristics, especially when the quantity demand has a stochastic component (Davis
and Holt, Shogren et al.). Once all of the sellers submitted their offers, the administrator
sorted all of the offers from lowest to highest. A ball would then be drawn to determine
the quantity of demand and the administrator would purchase all of the units needed. The
lowest offer not purchased (the first rejected offer) would determine the price for all of
the units purchased. For example, if demand was determined to be 43 then the producers
of the 43 units with the lowest offers would sell their units and receive a price equivalent
to the 44th lowest offer. In the written and verbal instructions, subjects were informed
8
that the market was competitive and therefore, submitting offers equal to their costs was
in their best interest, because they might otherwise forgo profitable trades.
Part A (no advertising) consisted of five rounds, followed by five rounds in Part B
(mandatory advertising). In Part B, all sellers were required to pay an assessment for
each unit sold and these assessments provided the funds for the advertising program that
increased demand in the subsequent round, thereby creating a one-round lag between the
cost of the advertising program and its benefits. The increase in demand was determined
by the equation
∑=
=n
iiIncrease AD
1)1( δ
where Ai is the amount of assessments collected for each subject, i = 1,…,20 and
{ }989
69
4 ,,∈δ determines the benefit-cost ratio for the advertising campaign (2:1, 4:1, and
6:1, respectively). The benefit-cost ratio was constant throughout an experimental
session. In a step that parallels the publicity provided by commodity programs about the
benefits of marketing efforts, subjects were informed prior to implementation that the
advertising program not only increased demand, but that the higher demand would also
result in higher prices and higher profits for sellers.
In reality, not all producers are notified of the true increase in demand due to
advertising. However, since independent economic evaluations are required of all federal
generic advertising programs, many farmers do read or hear about the estimated impacts
of generic advertising on demand, prices, and profits. For example, the generic dairy
advertising programs have an annual, independent economic evaluation, and the results
are widely disseminated to dairy farmers by the government, dairy checkoff program, and
popular trade magazines.
9

The assessment rate was set at $0.25 per unit sold, so that when combined with
the increase in demand, the uniform price auction, and the cost structure described above,
the rate of return to advertising could be controlled ranging from 2:1 to 6:1. These rates
of return are similar to the rates of return commonly observed with generic commodities
(table 1).3 Control of the rate of return was the most critical economic element to
simulate in the experiment, since the rate of return has been shown to have a direct effect
on subject behavior in the PPM (see for example Rondeau, Poe, and Schulze). In the
instructions, subjects were provided with estimates of the expected price that would result
from different amounts of assessment collected given the experiment’s uniform price
market, stochastic demand, and cost structure. For each round, in addition to the market
price, the administrator announced the total assessments collected and the corresponding
increase in demand.
Simulating the potential change that could result if mandatory programs are ruled
unconstitutional, Part C of the experiment replaced the mandatory program with a
voluntary PPM. It involved fifteen rounds, where subjects experienced five consecutive
rounds for each of three different PPM thresholds.4 This part also mimicked a funding
feature common to many generic advertising programs funded via a VCM: refund-by-
request. In such programs, assessments for the advertising campaign were collected at
the point of sale and producers had to make a written request to get their assessment
refunded. As shown in Messer, Kaiser, and Schulze, this refund-by-request feature leads
to increased levels of voluntary contributions in both the VCM and PPM. Thus, in our
experiments, subjects could request a refund of part or all of their assessment by
submitting a confidential one-sentence request using instant messaging to the
10
administrator (sample message: “Subject #2 requests a refund of $0.75 for Round 8,
Sincerely, John Doe.”). If a subject did not want to request a refund, no message was
required. All refund requests were granted and refunds were added to the subject’s
profits.5
To test the influence of producer referenda on contribution behavior, in one-half
of the experimental sessions, subjects were asked to submit confidential votes on whether
they would prefer the PPM with a certain threshold level or whether they would prefer no
advertising program. Referenda were held prior to the start of a series of rounds for each
PPM threshold. In the other half of the experimental sessions, subjects were not given a
choice and were simply informed that for the next series of rounds the advertising
program would be funded by the PPM with a certain threshold level.
To simulate the democratic decision-making process among producers that occurs
with generic advertising programs, subjects in the referendum sessions were given five
minutes to discuss the referendum on the PPM and strategies for making contributions to
the advertising program. For the non-referendum sessions, subjects were only permitted
to discuss strategies for making contributions to the advertising program. Such
conversations are commonly referred to as “cheap talk,” since no binding deals are
allowed and the actual decisions are confidential. Note that discussion of pricing
strategies was not allowed in any of the cheap talk conversations.
Unlike in Part B, where the advertising program was always implemented, in Part
C the advertising program was implemented only if the PPM threshold was met or
exceeded.6 The subject participation thresholds used in the experiment were 50%, 70%,
and 90%. Subjects participated in five consecutive rounds for each of the three
11
thresholds. The order of the thresholds was varied for each experimental session to
mitigate potential order effects. To understand how the PPM operated, consider the case
where the threshold was 90%. In this case, the advertising campaign would be
implemented only if at least 90% of the subjects did not request refunds.7 If three or
more of the twenty subjects in the experiment requested refunds, the advertising program
was not implemented and all twenty subjects received a refund of their assessments,
whether they initially requested a refund or not. In the case of a group refund, the round
operated identically to Part A, where there was no advertising program. In the
subsequent round, subjects were given the opportunity to reach the threshold again. If the
threshold was achieved, the advertising program was implemented and the assessments
collected determined the increase in demand for the subsequent round. After each round,
the administrator announced the total assessments possible, the total assessments
collected, the number of subjects not requesting a refund, whether the threshold was
achieved, and the corresponding increase in demand, if any.
Results
All experiments were conducted at the Laboratory for Experimental Economics and
Decision Research at Cornell University and the subjects were recruited from
undergraduate economics courses. In total there were twelve experimental sessions, each
involving twenty subjects (N=240). This section first provides aggregate descriptive
statistics of the initial eight experiments where the benefit-cost ratio of generic
advertising was calibrated at 4:1, indicating the importance of the referendum on
contributions and key trends observed with regard to the referenda and PPM thresholds.
Then, econometric models are developed to identify the combination of institutional
12

mechanisms that are both stable and maximize individual producer surplus and
contributions to the advertising program. Sensitivity analysis is subsequently conducted
with the additional experimental data to determine the impact of alternative levels of
advertising effectiveness on optimal PPM thresholds and subject contributions.
As noted earlier, Part A of the experiment did not include the advertising program
and was designed so that subjects could become familiar with the experimental platform
and the uniform price auction. Over these five rounds, the average per round producer
surplus was at its lowest level of the experiment, $31.17 (table 2). In contrast, in Part B,
where the advertising program is funded by mandatory assessments, the average producer
surplus over the five rounds increased to $95.17, the highest of the experiment.8
In Part C, subjects were faced with the decision of how much to contribute
voluntarily to the advertising program, with funding governed by three different PPM
thresholds (50%, 70%, and 90%). Under all three PPM thresholds, producer surplus was
significantly higher ($68.21, $88.96, and $75.06, respectively) than in Part A, where
there was no advertising, but lower than in Part B, where there was an advertising
program with mandatory funding (table 2).9
Table 2 also illustrates that referenda do matter with respect to producer surplus
and contributions to the advertising program. Producer surplus is significantly higher in
sessions with a referendum than in those without one.10 Recall that all sessions included
cheap-talk about contribution strategies. Cheap-talk discussions (like public discussions
among producers) tend to elicit the opinions of those individuals who are more
extroverted and more open to expressing their opinions in a public setting. In contrast, a
referendum gives every individual an opportunity to express their opinion as the results
13

of the referendum are announced to the group. This difference in producer surplus
suggests that confidential referenda provide critical feedback to subjects about the
sentiments of other members of their group toward the PPM threshold and their likely
behavior should the PPM be approved by vote. Since the votes were overwhelmingly in
favor of the PPM thresholds (at or above 95% for each threshold), the referenda appear to
have signaled a greater sense of producer support than was permitted in the cheap-talk
discussion alone. Since generic advertising programs generally enjoy broad support from
producers, this finding is particularly relevant to the institutional design of potential
voluntary generic advertising programs.
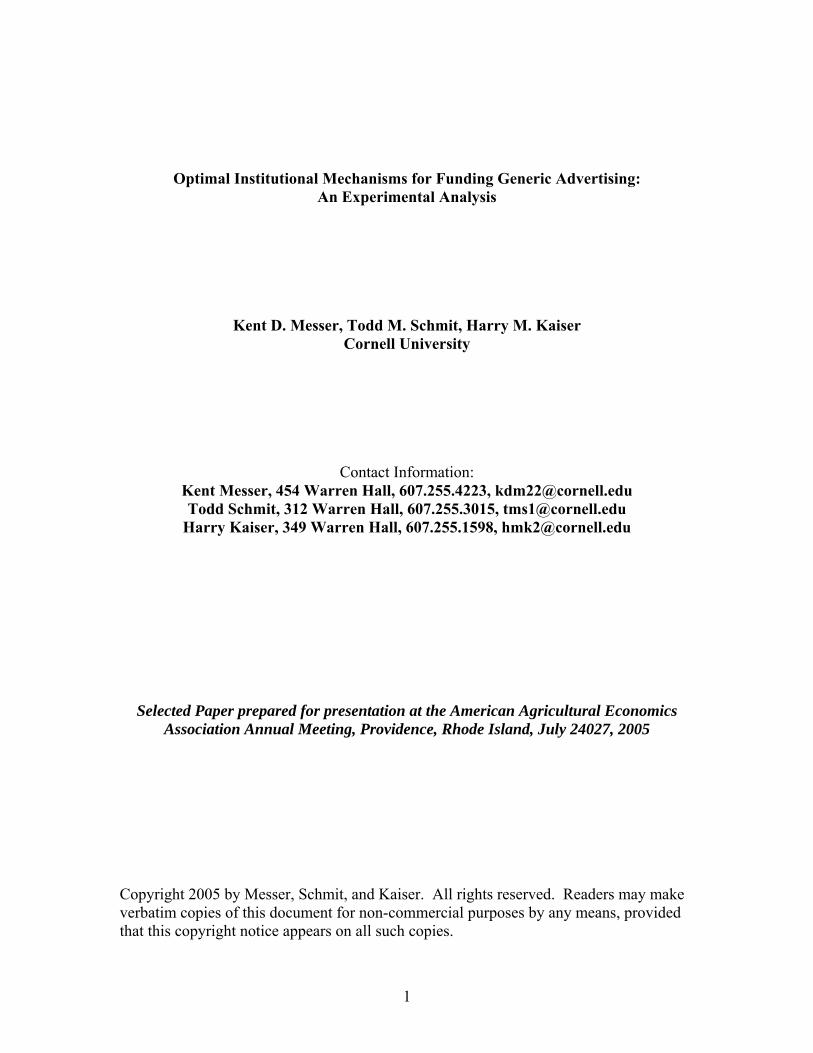
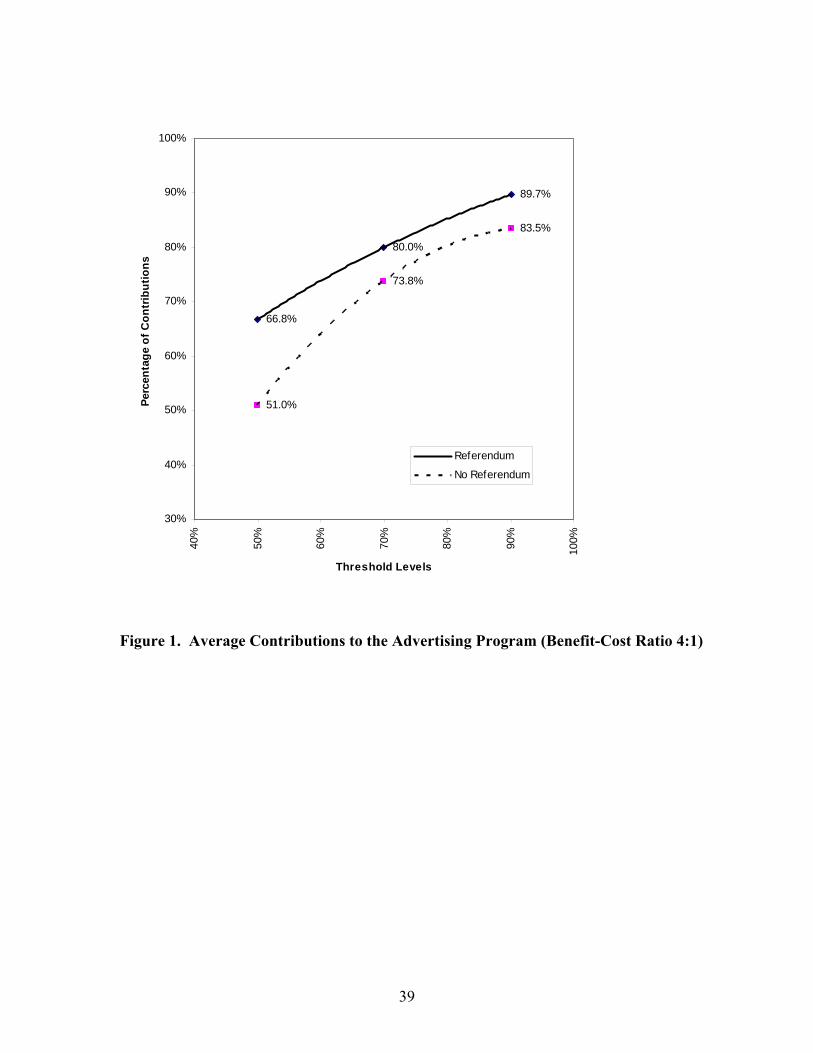
The higher producer surplus in the referendum sessions can be attributed to higher
voluntary contributions to the advertising program from subjects. A striking result,
displayed in figure 1, is that subjects offered higher average contributions (not accounting
for whether the threshold was achieved) in the referendum sessions than in the non-
referendum sessions. Using the test of proportions, these contributions were significantly
higher (α < 0.05) for all PPM thresholds. Even though the percentage of contributions
was less then the percentage voting in favor of the PPM threshold, it appears that
including referenda in the program design does significantly increase contributions, and
thereby, increases producer surplus.
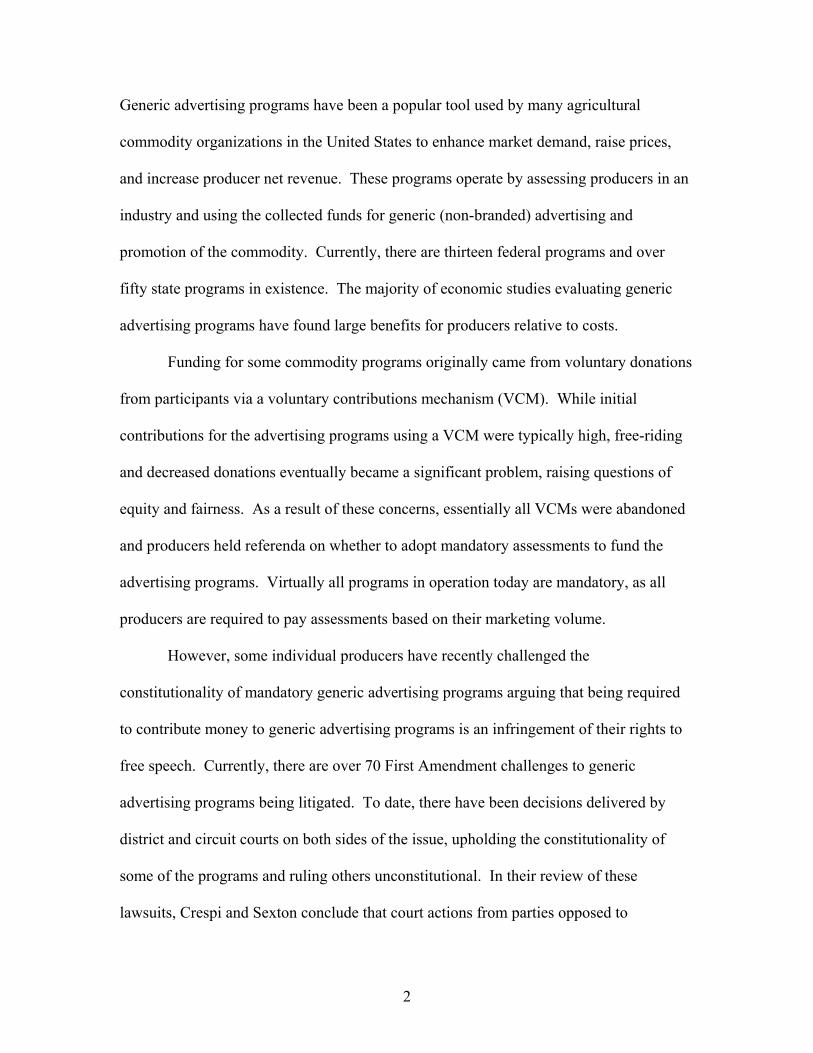
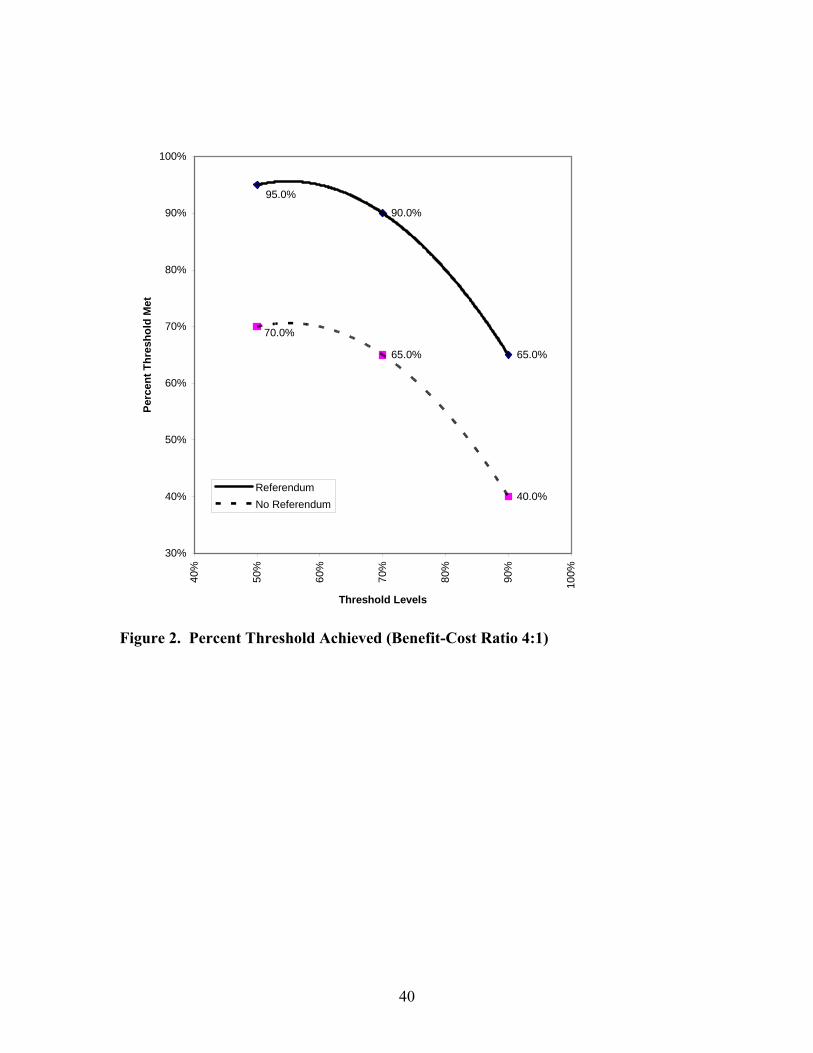
Figure 1 shows the strong positive relationship between group contributions and
PPM thresholds. That is, a higher PPM threshold leads to higher contributions from
producers. However, as in other experiments involving repeated PPM rounds (e.g., Isaac,
Schmidtz, and Walker; Marks and Croson, 1998, 1999), producers did not always reach
the threshold. In fact, the frequency with which the group achieved the threshold
14

declined as the threshold rose (figure 2). For the referendum sessions, as the threshold
increased from 50% to 70% to 90%, the frequency with which the threshold was
achieved decreased from 95% to 90% to just 65%, respectively. Likewise, for the non-
referendum sessions, the frequency with which the threshold was achieved went from
70% to 65% to just 40%, respectively, as the PPM increased over these three thresholds.
These latter results further illustrate the importance of producer referenda in the
advertising program design.
In the field, this lack of certainty regarding the achievement of the threshold could
cause logistical concerns for the advertising agency in charge of the campaign since the
stream of revenue for advertising could abruptly be turned on and off. Therefore, a
practical trade-off exists between high levels of producer contributions and actually
achieving the PPM threshold necessary to implement the program (and retain these
contributions). We evaluate this tradeoff more formally in the next section, by
estimating PPM thresholds for which producer surplus and expected advertising
contribution probabilities are maximized when threshold levels are treated as a
continuous variable.
Econometric Model
Econometric models were developed to determine the relationships between producer
surplus and advertising contributions on PPM threshold level, accounting for market
demand, group referendum type, and treatment round. The models were specified to
account for the three-level hierarchical nature of the experimental data, where subject-
level information is nested within experimental groups (or blocks) and observed over
rounds (i.e., repeated measures). Given the differentiation between group and subject
15
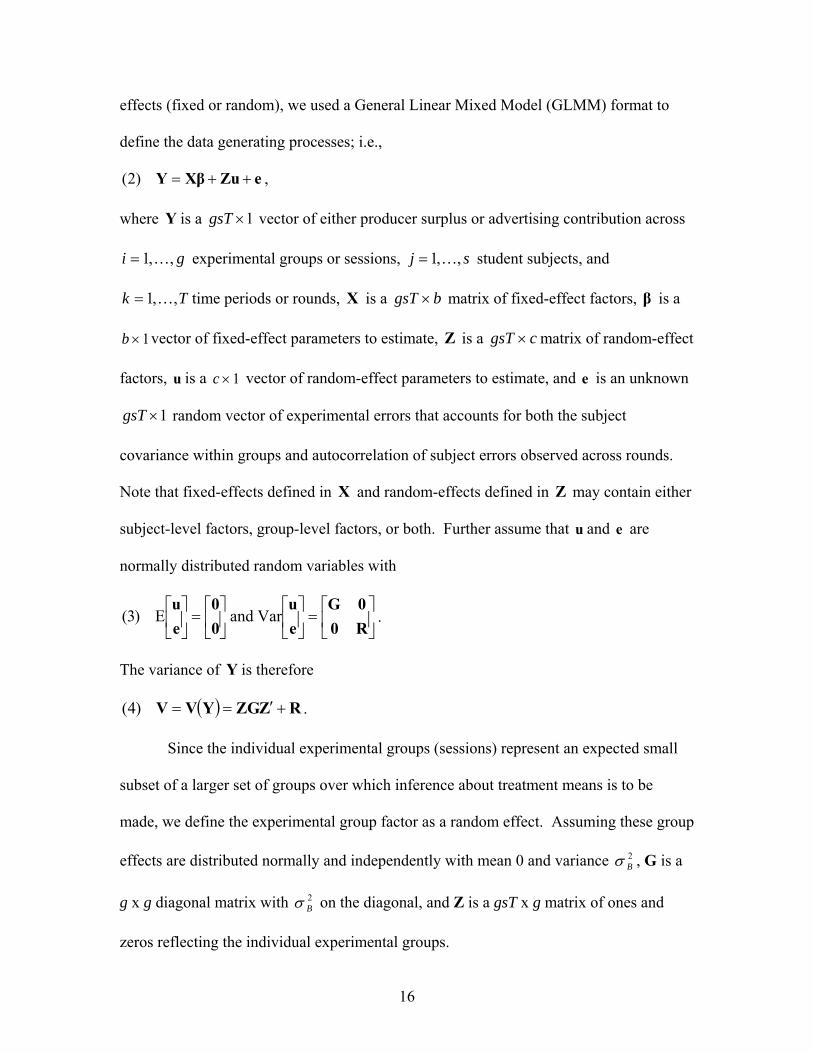
effects (fixed or random), we used a General Linear Mixed Model (GLMM) format to
define the data generating processes; i.e.,
eZuXβY ++=)2( ,
where is a vector of either producer surplus or advertising contribution across
experimental groups or sessions,
Y 1×gsT
gi ,,1…= sj ,,1…= student subjects, and
time periods or rounds, is a Tk ,,1…= X bgsT × matrix of fixed-effect factors, is a
vector of fixed-effect parameters to estimate, is a
β
1×b Z cgsT × matrix of random-effect
factors, is a vector of random-effect parameters to estimate, and e is an unknown
random vector of experimental errors that accounts for both the subject
covariance within groups and autocorrelation of subject errors observed across rounds.
Note that fixed-effects defined in and random-effects defined in may contain either
subject-level factors, group-level factors, or both. Further assume that and are
normally distributed random variables with
u 1×c
1×gsT
X Z
u e
⎥⎦
⎤⎢⎣
⎡=⎥
⎦
⎤⎢⎣
⎡⎥⎦
⎤⎢⎣
⎡=⎥
⎦
⎤⎢⎣
⎡R00G
eu
00
eu
VarandE)3( .
The variance of is therefore Y
( ) RZZGYVV +′==)4( .
Since the individual experimental groups (sessions) represent an expected small
subset of a larger set of groups over which inference about treatment means is to be
made, we define the experimental group factor as a random effect. Assuming these group
effects are distributed normally and independently with mean 0 and variance , G is a
g x g diagonal matrix with on the diagonal, and Z is a gsT x g matrix of ones and
zeros reflecting the individual experimental groups.
2Bσ
2Bσ
16
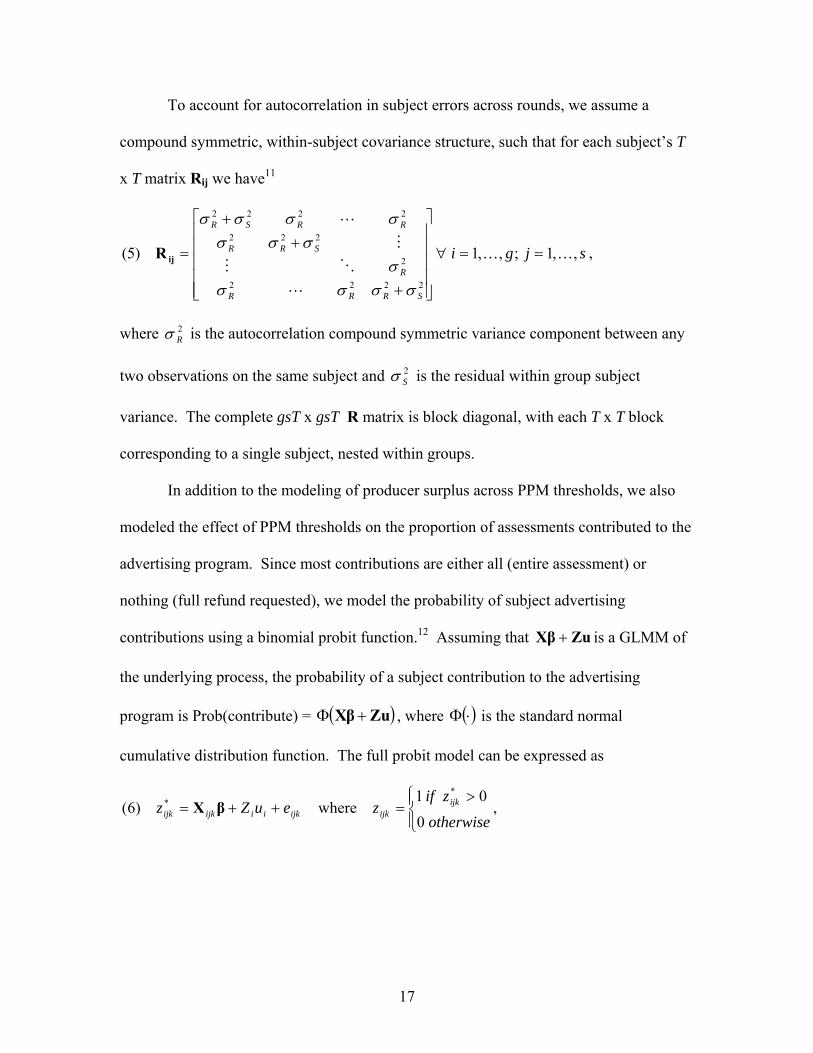
To account for autocorrelation in subject errors across rounds, we assume a
compound symmetric, within-subject covariance structure, such that for each subject’s T
x T matrix Rij we have11
sjgi
SRRR
R
SRR
RRSR
,,1;,,1)5(
2222
2
222
2222
…… ==∀
⎥⎥⎥⎥⎥
⎦
⎤
⎢⎢⎢⎢⎢
⎣
⎡
+
++
=
σσσσσ
σσσσσσσ
ijR ,
where is the autocorrelation compound symmetric variance component between any
two observations on the same subject and is the residual within group subject
variance. The complete gsT x gsT R matrix is block diagonal, with each T x T block
corresponding to a single subject, nested within groups.
2Rσ
2Sσ
In addition to the modeling of producer surplus across PPM thresholds, we also
modeled the effect of PPM thresholds on the proportion of assessments contributed to the
advertising program. Since most contributions are either all (entire assessment) or
nothing (full refund requested), we model the probability of subject advertising
contributions using a binomial probit function.12 Assuming that ZuXβ + is a GLMM of
the underlying process, the probability of a subject contribution to the advertising
program is Prob(contribute) = ( )ZuXβ +Φ , where ( )⋅Φ is the standard normal
cumulative distribution function. The full probit model can be expressed as
⎪⎩
⎪⎨⎧ >
=++=otherwise
zifzeuZz ijk
ijkijkiiijkijk 0
01where)6(
** βX ,
17

where is the unobserved (latent) variable for group i, subject j, round k, corresponding
to the observed dependent binary response variable , and the hierarchical error
structure is defined as above with the exception of the probit link error function.
*ijkz
ijkz
Empirical Results
As discussed above, since the primary goals of generic advertising programs are to
expand demand and increase producer returns, we first examine econometrically the
impact of PPM thresholds on producer surplus to determine the optimal threshold.
Following the mixed model structure, we hypothesize the empirical model as
,
)7(
8765
2432110
ijkii
iikikikiikik
ikikikijkijk
euZGRPREFROUNDROUNDPPMGRPREFPPMROUND
PPMPPMDEMANDADVCONTGPSRPLS
++++++
++++= −
ββββ
βββββ
where GPSRPLSijk is gross producer surplus for group i, subject j, round k,13
ADV_CONTijk-1 is the final advertising contribution (assessment less refunds received) for
group i, subject j, round k-1,14 DEMANDik is market demand for group i, round k, PPMik
is the provision point threshold for group i, round k, ROUNDik is the round number for
group i to account for additional round fixed-effects (e.g., behavior change over time) not
accounted for by the random error assumptions, GRPREFi is a dummy variable reflecting
whether group i is a referendum session (GRPREF=1) or non-referendum session
(GRPREF=0), and Ziui and eijk reflect the error components as described above.
PPM interaction variables reflect the a priori hypothesis that threshold effects will
vary across voting group types and over program duration. In addition, given that in the
referendum sessions subjects voted on implementing the PPM program before the first
round for each threshold, it is expected that round effects will vary across voting group
18

types. PPM thresholds are included in (7) in quadratic form to transform the threshold
class levels to a continuous basis and thereby allow computation of the threshold where
producer surplus is maximized.
Subsequently, the advertising contribution probability model was specified as
,
)8( 542
3210
ijkiiikik
iikikikikijijk
euZROUNDPPM
GRPREFPPMROUNDPPMPPMCOSTCONT
+++
+++++= ββββββ
where CONTijk is equal to one if the group i, subject j, round k final advertising
contribution is greater than zero, and equal to zero if the final contribution is zero, and
COSTij is the third unit cost for group i, subject j (costs do not change over time). Recall
that the final contributions can be equal to zero either by a subject refund request or by a
group refund, if the threshold was not achieved; so both individual and group effects are
inherent in the variable modeled. Since the contributions were not dependent upon the
previous round, all five rounds for each PPM threshold were used in the analysis.
Producer Surplus Model Estimates
Regression estimates for both models and utilizing the experimental data calibrated on a
benefit-cost ratio of 4:1 are included in table 3. All estimated parameters were
statistically significant for the producer surplus model at the 0.05 significance level or
less.15 The statistical significance of the covariance parameter estimates lends support to
the hypothesized three-level hierarchical error structure. As expected, both demand and
final advertising contribution levels were significantly high given the price impacts from
changes in demand (as described previously).
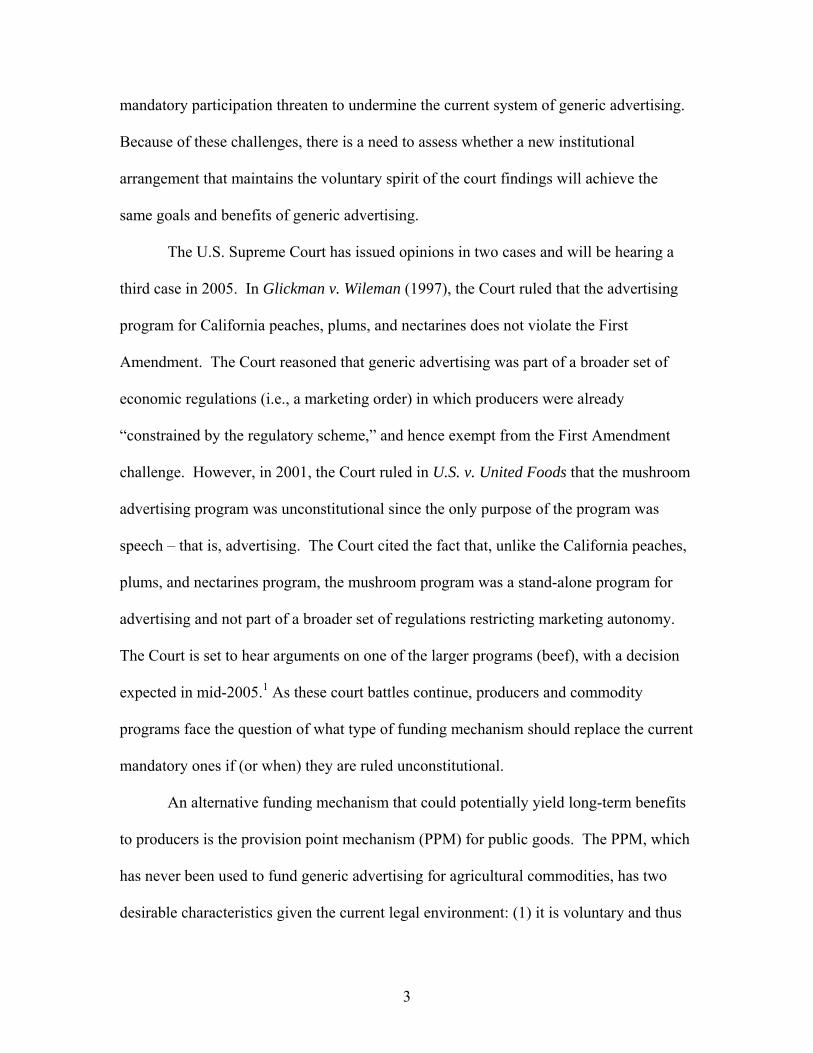
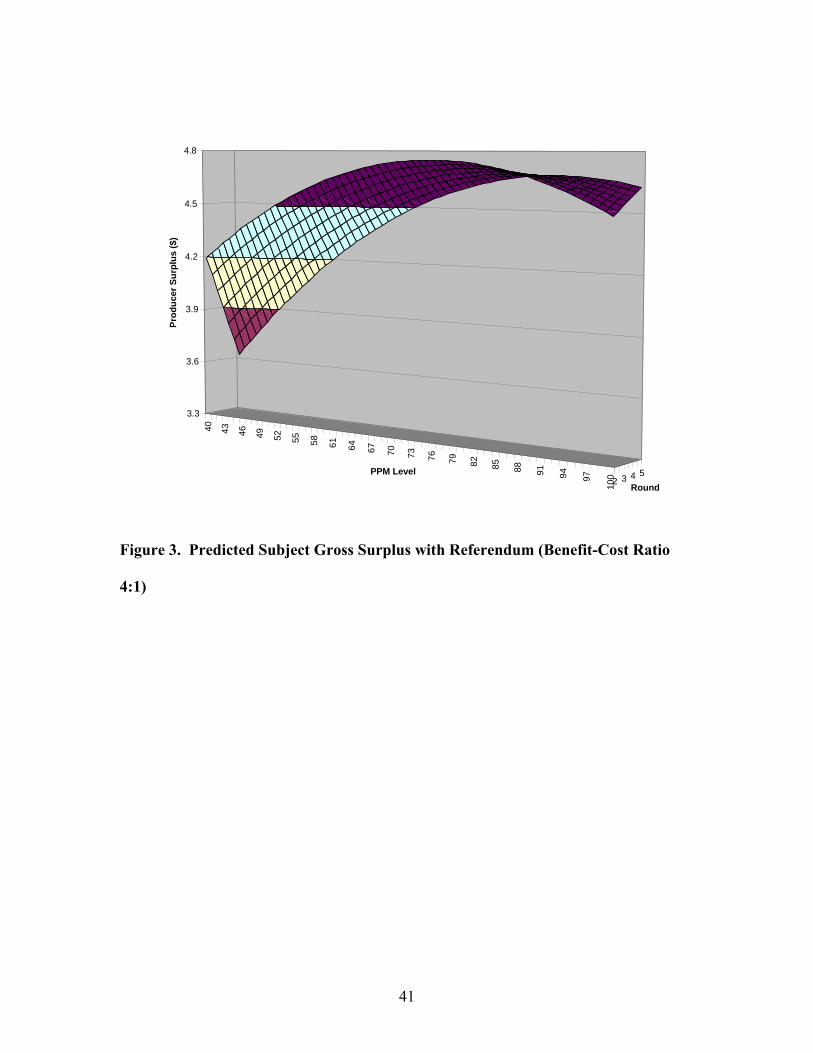
PPM thresholds significantly affected producer profits, as did their effects across
referendum groups and program duration (round). Simulation of the econometric model
indicates that with the exception of the lowest threshold levels, predicted gross producer
19
surplus in the referendum program were dramatically higher than those in the non-
referendum program. For the referendum program, these relationships are illustrated in
figures 3, which computes predicted gross producer surplus across thresholds and rounds.
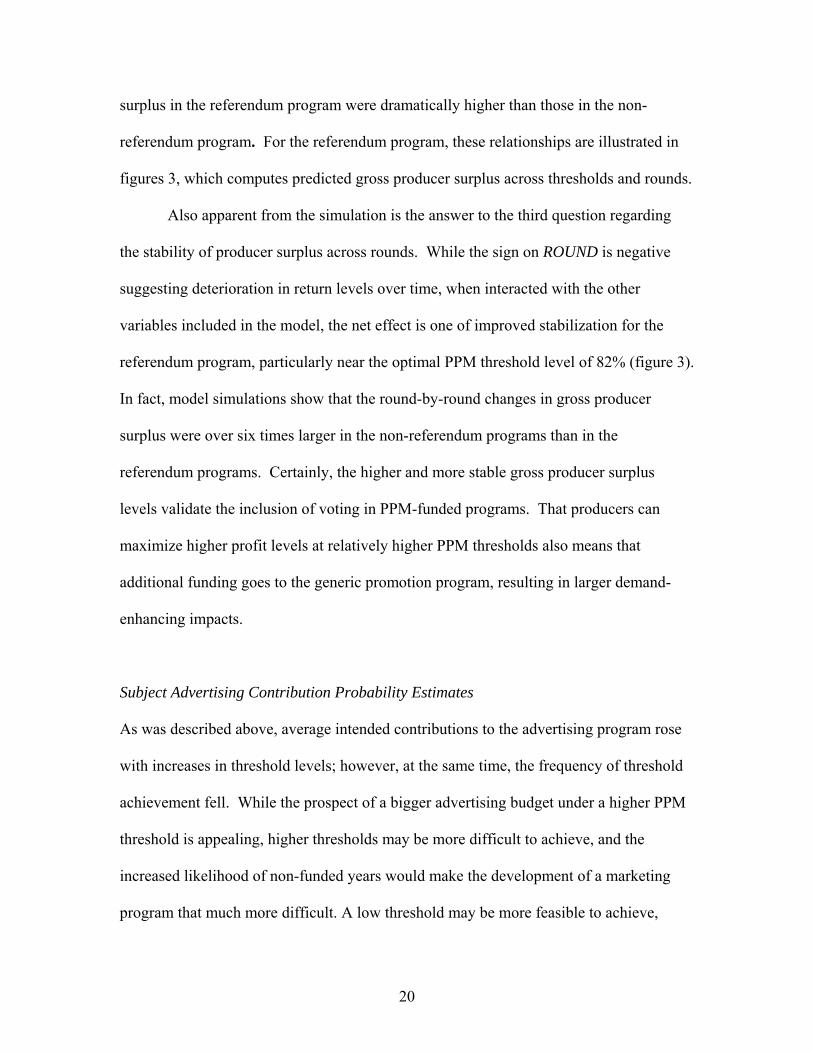
Also apparent from the simulation is the answer to the third question regarding
the stability of producer surplus across rounds. While the sign on ROUND is negative
suggesting deterioration in return levels over time, when interacted with the other
variables included in the model, the net effect is one of improved stabilization for the
referendum program, particularly near the optimal PPM threshold level of 82% (figure 3).
In fact, model simulations show that the round-by-round changes in gross producer
surplus were over six times larger in the non-referendum programs than in the
referendum programs. Certainly, the higher and more stable gross producer surplus
levels validate the inclusion of voting in PPM-funded programs. That producers can
maximize higher profit levels at relatively higher PPM thresholds also means that
additional funding goes to the generic promotion program, resulting in larger demand-
enhancing impacts.
Subject Advertising Contribution Probability Estimates
As was described above, average intended contributions to the advertising program rose
with increases in threshold levels; however, at the same time, the frequency of threshold
achievement fell. While the prospect of a bigger advertising budget under a higher PPM
threshold is appealing, higher thresholds may be more difficult to achieve, and the
increased likelihood of non-funded years would make the development of a marketing
program that much more difficult. A low threshold may be more feasible to achieve,
20
making funding for advertising more consistent, but a low threshold also enables more
producers to “free-ride,” and total contributions are consequently lower.
We conduct additional analysis to examine the subject-level probability of
positive final advertising contributions across PPM thresholds to evaluate expected
threshold achievement. By using final advertising contributions, we account for both
individual refund requests and refunds received as part of a group refund, whether the
individual subject requested a refund or not. Furthermore, we examine whether optimal
PPM thresholds for maximizing gross producer surplus levels are consistent with the
PPM threshold that maximizes the producer’s probability of contributing.
As did the econometric results for producer surplus levels, final contribution
probabilities demonstrated a statistically significant positive relationship to the PPM
threshold (table 3).16 The quadratic PPM term was also significant and negative. The
interaction effect of the referendum with PPM threshold was a significant determinant of
contribution probabilities. Relative to the referendum program, the non-referendum
programs demonstrated a greater decrease in contribution probabilities as PPM thresholds
increased. On a subject-level basis, producers with higher third unit costs were less likely
to contribute to the advertising program. Program duration (round) had a significant
effect on contribution probabilities, and, over time, contribution probabilities gradually
improved at thresholds at or above 62% as the potential to free-ride diminished.
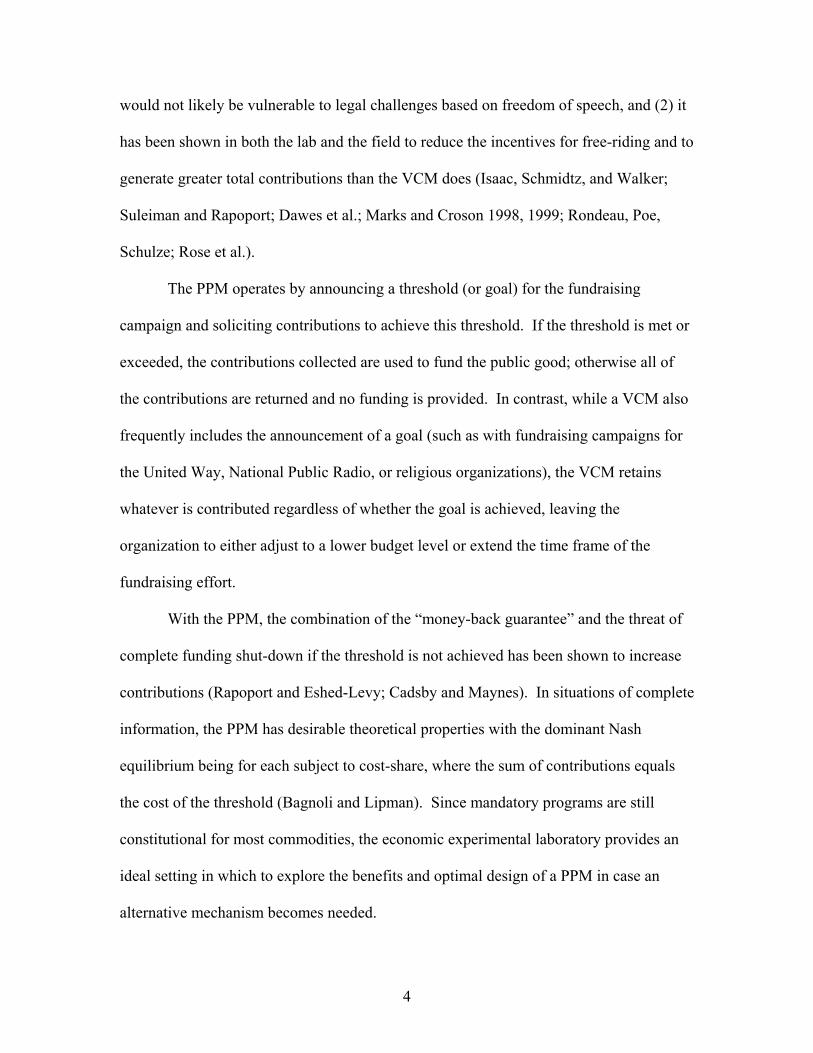
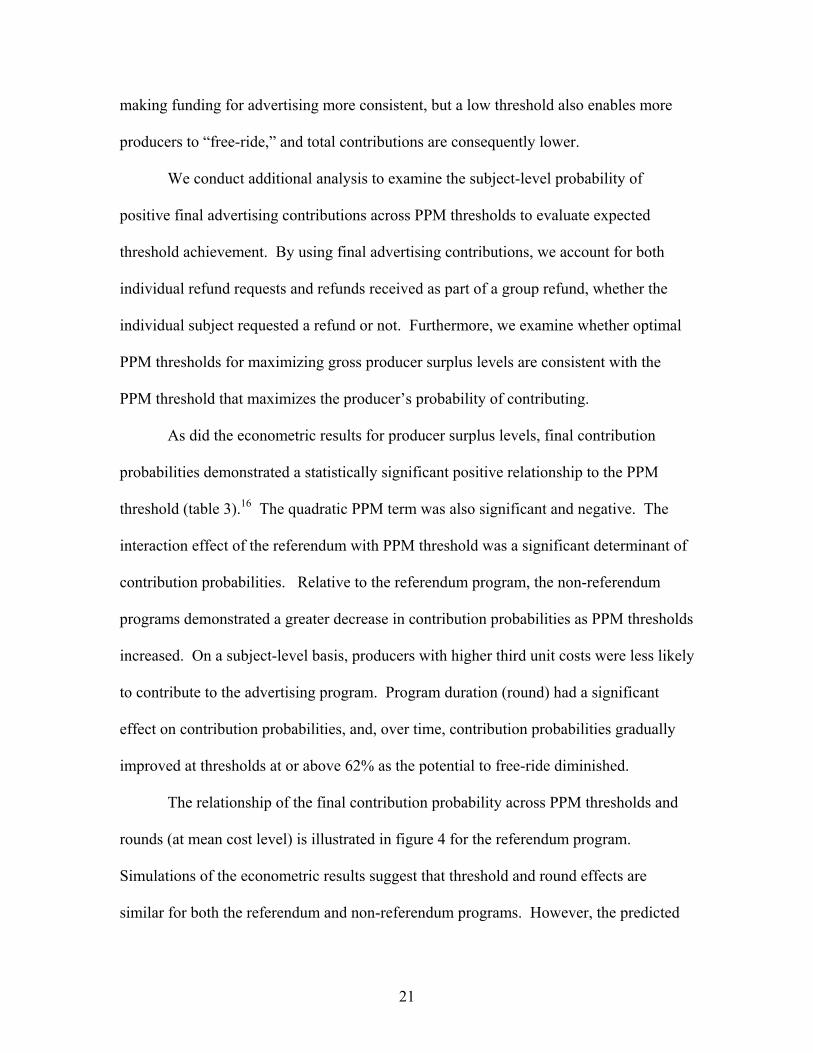
The relationship of the final contribution probability across PPM thresholds and
rounds (at mean cost level) is illustrated in figure 4 for the referendum program.
Simulations of the econometric results suggest that threshold and round effects are
similar for both the referendum and non-referendum programs. However, the predicted
21
probabilities are scaled down considerably for the non-referendum program. At lower
PPM thresholds, contribution probabilities are lower due to the increased ability to free-
ride, while at higher PPM thresholds contribution probabilities are lower due to the
increased frequency of not achieving the threshold level.
Overall, the behavior exhibited appears to be approaching the Nash equilibrium of
cost-sharing, though this study used percent participation, rather than percent
contribution, as determining whether the threshold was achieved. Evaluated at the final
round, the maximum contribution probability for the referendum program was 77.5%,
achieved at a PPM threshold of 76%. Put differently, for an assumed rate of return to
advertising of 4:1, this implies that a 76% threshold would be met or exceeded 77.5% of
the time. For the non-referendum program, the maximum contribution probability was
53.6%, achieved at a PPM threshold of 71%. Furthermore, evaluating the contribution
probabilities based on the PPM threshold that maximized producer surplus (i.e., 82% for
the referendum program and 74% for the non-referendum program) indicated only
slightly smaller contribution probabilities of 76.2% and 53.2%, respectively.
Sensitivity Analysis on Advertising Effectiveness
As mentioned above, control of the rate of return was the most critical economic element
to simulate the experiments. Also, given that a wide array of rates of return to generic
promotion programs exist in the literature, it is useful to examine how changes in this
return translate into changes in subject behavior and, ultimately, on optimal threshold
levels. We conducted additional experiments calibrated at return levels both above (6:1)
and below (2:1) the initial experimental settings. While these additional experiments do
22

not capture the entire range or reported payoff ratios, we felt that they provide additional
insight into the role of program efficacy on contributions in a PPM setting.
As expected, as benefits from advertising increased, so did subject contributions.
Specifically, the average percentage of contributions increased from 59% in the case of a
2:1 BCR, to 63% for the 4:1 BCR, and to 68% for the 6:1 BCR across all threshold
levels. The improved demand enhancing impacts as advertising’s rate of return increased
were also reflected in the average producer surplus levels across BCRs (table 4).
Supplemental regressions of similar form and specification to the 4:1 BCR data
were conducted on the additional sets of advertising payoff experiments.17 Given the
changes in contribution behavior, it is not surprising that as advertising effectiveness
decreases, so does the PPM threshold level that maximizes gross producer surplus. The
optimal PPM threshold dropped from 82% to 68% as the BCR decreased from 4:1 to 2:1
(table 4). Likewise, as effectiveness improved, the optimal threshold level reached the
maximum threshold level evaluated within the experimental data; i.e., 90%. Expected
threshold achievement at the 6:1 advertising effectiveness level was similar to that
observed in the 4:1 case (77% and 76%, respectively). However, as effectiveness
dropped to 2:1, expected threshold achievement dropped sharply to less than 50% of the
time (table 4).
The range in optimal thresholds and expected threshold achievement highlights
the crucial nature of the underlying advertising performance measure in the experimental
set up. An additional realization is that if commodity programs go to a voluntary PPM
type of program, knowledge on the relative performance of their promotions programs
23

will be crucial to setting PPM operational parameters in order to maximize the benefits to
the producers funding the program through their checkoff assessments.
Conclusions
In light of uncertainties about the constitutionality of mandatory generic advertising
programs for agricultural commodities, it is useful to investigate alternative voluntary
funding mechanisms in case they become needed. The economics laboratory is an ideal
environment in which to conduct this investigation as key economic and psychological
factors can be simulated. This type of research enables a careful analysis of the impact of
various features of a funding mechanism on producer contributions to generic advertising
programs. The focus of this analysis was on finding the combination of features and
procedures for the Provision Point Mechanism (PPM) that maximizes producer welfare
and advertising contributions given the varying effectiveness of the advertising program.
In addition to having a PPM with the “refund-by-request” feature as advocated by
Messer, Kaiser, and Schulze, separate program mechanisms were instituted to investigate
the impact of producer referenda on contribution levels over a variety of PPM thresholds.
The four issues examined were: (i) whether a producer referendum on institutional
funding mechanisms had an impact on producer surplus and contributions to the
advertising program, (ii) what the optimal threshold was for the PPM, (iii) how
institutional features impacted the stability of contributions to the advertising program
over time, and (iv) how does the effectiveness of the advertising program affect producer
contributions?
The empirical results indicate that including producer referenda as part of the
program design positively affects both producer profits and contribution probabilities.
24
Given how participation in these referenda strongly affected subjects’ contribution
behavior, advertising programs should encourage these types of institutions that help
secure higher funding levels. In addition, substantially higher program stability was
evident when the program included the referendum and the threshold was set at or near
the level where producer profits are maximized.
In programs that included the referendum, producer welfare was maximized at a
PPM threshold of 82%, assuming a benefit-cost ratio of advertising at 4:1. At this
threshold, program developers should expect that the threshold will be met or exceeded
76% of the time. Sensitivity analysis also showed direct relationships between the
effectiveness of the advertising program and both the optimal threshold level and
expected threshold achievement. For programs with lower returns (2:1), producer
welfare was maximized at a PPM threshold of 68%, which would be expected to be
achieved 47% of the time, while for programs with higher returns (6:1), producer welfare
was maximized at a PPM threshold of 90%, which would be expected to be achieved
77% of the time.
These results provide valuable information to commodity organizations that wish
to design promotion programs that may pass constitutional muster and achieve the largest
benefits possible to the producers who fund them. Understanding that estimated producer
returns to generic advertising vary over both commodity and time provides direction to
future research on the evaluation of contribution behavioral changes and how commodity
organizations should best programmatically respond to these changes. Furthermore,
extending this type of experimental application to producer groups and commodity
25

organizations is a next logical step in making these types of institutional designs practical
in a real-world setting.
26

Footnotes 1 The largest generic advertising program, the dairy farmer program, was ruled
unconstitutional by the Third Circuit Court in 2004, and may be appealed to the U.S.
Supreme Court depending upon its decision in the beef case.
2 Chavas and Klemme’s estimated supply elasticity is for a three-year length of run.
3 While the majority of empirical studies have estimated benefit-cost ratios above 1.0,
there are also some studies (particularly in the meat sector, where there is a lot of cross-
advertising among commodities) that have indicated little or no impact of generic
advertising on demand. Examples of empirical studies that have found little or no impact
of generic advertising on demand include Coulibaly and Brorsen, Brester and Schroeder,
and Kinnucan et al.
4 Subjects were unaware of the number of rounds for each PPM threshold.
5 This experiment did not capture the potential affects that the opportunity cost of a
contribution to the adverting program that is ultimately returned may have subject
behavior. Earnings treated profits from all the parts of a round equally.
6 In theory, extending the benefits beyond the threshold in this way does not modify the
individual incentives (Marks and Croson, 1998).
7 To increase transparency, the provision point was the “percentage of subjects not
requesting refunds,” since the number of subjects was always twenty. Alternatively, the
provision point could have been the “percentage of assessments collected out of the total
possible assessments.” However, the total possible assessments varied in each round due
to the stochastic demand. Additionally, a PPM based on the percentage of producer
participation is likely to be preferred because of its being perceived as more democratic.
27
8 The producer surplus measures are designed to help determine the optimal institutional
features, and should not be interpreted as predictions on the magnitude of producer
surplus that can be anticipated given these institutional features.
9 Statistical differences in average group producer surplus measures were computed using
a means difference test, distributed t.
10 Producer surplus in the non-referendum sessions was higher than in the referendum
sessions of Parts A and B, because of higher average realized demand (stochastic).
11 Alternative autocorrelation structures were investigated for the repeated-subject
measures, including no correlation and autoregressive order-1 processes. The compound
symmetric covariance structure better satisfied the Akaike Information Criterion (AIC),
and thus, was preferred. Test statistics and alternative empirical results are available
upon request.
12 We also modeled the ratio of net advertising contributions to assessment with logistical
transformations of the dependent variable. However, since most observations were either
zero or one (i.e., only 6 percent of observations had partial contributions), the empirical
results and conclusions were nearly identical to those reported for the probit model. The
additional modeling results are available upon request.
13 Gross producer surplus is defined as subject product sales (market price multiplied by
units sold) less costs of production, excluding assessments collected or refunds received.
Net program contributions are accounted for on the right hand side of the equation.
14 Advertising contributions are based on time period k-1, since total advertising
contributions in time period k-1 impact demand in time period k. Accordingly, the first
round of each PPM threshold is dropped from the estimation, since the market demand in
28
the first round of each threshold is based on contributions from the prior round, where the
funding was either a mandatory program or provided via another PPM threshold.
15 Econometric models were estimated using the PROC MIXED procedure in SAS v.8.2.
16 Note that DEMAND is not included as an explanatory variable in the Probit model.
Not only did the inclusion of this variable result in much poorer model performance
(AIC=8330.5), but most importantly since subject advertising contributions are based on
the assessment collected this indicates directly the quantity of units sold. As such
DEMAND is given and need not be included.
17 For brevity, the supplemental regression estimates are not included, but are available
upon request. Optimal PPM thresholds and expected threshold achievement are
computed analogously to the 4:1 benefit-cost ratio case.
29
References
Alm, J., G.H. McClelland, and W.D. Schulze. “Changing the Social Norm of Tax
Compliance by Voting.” KYKLOS 52 (1999):141-171.
Bagnoli, M. and B. Lipman. “Provision of Public Goods: Fully Implementing the Core
through Voluntary Contributions.” Review of Economic Studies 56(1989):583-
601.
Brester, G.W., and T.C. Schroeder. "The Impacts of Brand and Generic Advertising on
Meat Demand." American Journal of Agricultural Economics 77(1995):969-79.
Brown, D.J., and L.F. Schrader. “Cholesterol Information and Shell Egg Consumption.”
American Journal of Agricultural Economics 72 (1990):548-55.
Buhr, B.L., and H. Kim. “Dynamic Adjustment in Vertically Linked Markets: The Case
of the U.S. Beef Industry.” American Journal of Agricultural Economics 79
(1997):126-38.
Cadsby, C.B. and E. Maynes. “Voluntary Provision of Threshold Public Goods With
Continuous Contributions: Experimental Evidence.” Journal of Public Economics
71 (1999):53-73.
Capps, O., Jr., D.A. Bessler, and G.W. Williams. “Evaluating the Economic Impacts
Associated With the Advertising Effort by the Florida Department of Citrus: Final
Report.” Unpublished Report, Forecasting and Business Analytics L.L.C., 2003.
Chavas, J.P., and R.M. Klemme. “Aggregate Milk Supply Response and Investment
Behavior on U.S. Dairy Farms.” American Journal of Agricultural Economics 68
(1986):55-66.
30
Coulibaly, N. and B.W. Brorsen. “Explaining the Differences Between Two Previous
Meat Generic Advertising Studies.” Agribusiness: An International Journal 15
(1999):501-516.
Crespi, J.M., and A. Chacon-Cascante. “Do U.S. Marketing Orders Have Much Market
Power? An Examination of the Almond Board of California.” Agribusiness: An
International Journal 20 (2004):1-16.
Crespi, J.M., and R.J. Sexton. “Got Lawyers?” Choices 1 (2001):18-23.
Dawes, R., J. Orbell, R. Simmons, and A.van de Kragt. “Organizing Groups for
Collective Action.” American Political Science Review 8 (1986):1171-1185.
Davis, D. D., and C. A. Holt. Experimental Economics. Princeton: Princeton University
Press, 1993.
Goddard, E.W., and A.K. Amuah. “Demand for Canadian Fats and Oils: A Case Study of
Advertising Effectiveness.” American Journal of Agricultural Economics 71
(1989):741-49.
Isaac, R.M., D. Schmidtz, and J. Walker. “The Assurance Problem in Laboratory
Markets.” Public Choice 62 (1989):217-36.
Kaiser, H.M. “The Domestic Impacts of the Walnut Marketing Board’s Marketing
Activities.” NICPRE Quarterly. 1 (2002):1-4.
Kaiser, H.M. “Impact of National Dairy Advertising on Dairy Markets, 1984-95.”
Journal of Agricultural and Applied Economics 29 (1997):303-14.
Kinnucan, H.W., H. Xiao, C.-J. Hsia, and J.D. Jackson. "Effects of Health Information
and Generic Advertising on U.S. Meat Demand." American Journal of
Agricultural Economics 79(1997):13-23.
31
Krishnamurthy, S. “The Effect of Provision Points on Generic Advertising Funding.”
Marketing Letters 12 (2001):315-325.
Marks, M.B., and R. Croson. “Alternative Rebate Rules in the Provision of a Threshold
Public Good: An Experimental Investigation.” Journal of Public Economics 67
(1998):195-220.
Marks, M.B., and R. Croson. “The Effect of Incomplete Information in a Threshold
Public Goods Experiment.” Public Choice 99 (1999):103-18.
Messer, K., H.M. Kaiser, and W. Schulze. “Status Quo Bias and Voluntary Contributions:
Can Lab Experiments Parallel Real World Outcomes for Generic Advertising?”
NICPRE Research Bulletin 04-03, National Institute for Commodity Promotion
Research and Evaluation, Department of Applied Economics and Management,
Cornell University, February 2004.
Nichols, J.P., O. Capps, Jr., G.C. Davis, and D.A. Bessler. “Evaluating Returns to the
Cotton Checkoff Program.” NICPRE Quarterly. 2 (1997):1-4.
Rapoport, A. and D. Eshed-Levy. “Provision of Step-Level Public Goods: Effects of
Greed and Fear of Being Gypped.” Organizational Behavior and Human
Decision Processes 44 (1989):325-344.
Reed, A.J., J.W. Levedahl, and J.S. Clark. “Commercial Disappearance and Composite
Demand for Food with an Application to U.S. Meats.” Journal of Agricultural
and Resource Economics 28 (2003):53-70.
Rondeau, D., G.L. Poe, and W.D. Schulze. “VCM or PPM? A Comparison of the
Performance of Two Voluntary Public Goods Mechanisms.” Journal of Public
Economics, forthcoming.
32

Rose. S.K., J. Clark, G.L. Poe, D. Rondeau, and W.D. Schulze. “The Private Provision of
Public Goods: Tests of a Provision Point Mechanism for Funding Green Power
Programs.” Resource and Energy Economics 24 (2002):131-155.
Schmit, T.M. and H.M. Kaiser. “Decomposing the Variation in Generic Advertising
Response over Time.” American Journal of Agricultural Economics 86
(2004):139-53.
Schmit, T.M. and H.M. Kaiser. “The Impact of Dietary Cholesterol Concerns on
Consumer Demand for Eggs in the USA.” Health, Nutrition and Food Demand.
W.S. Chern and K. Rickertsen, ed., pp 203-22. Wallingford, OX, UK: CAB
International, 2003.
Shogren, J.F., M. Margolis, C. Koo, and J.A. List. “A Random Nth-Price Auction.”
Journal of Economic Behavior and Organization 46(2001): 409-421.
Suleiman, and R.A. Rapoport. “Provision of Step-Level Public Goods with
Discontinuous Contribution.” Journal of Behavioral Decision Making 5
(1992):133-153.
Vickrey, W. “Counterspeculation, Auctions, and Competitive Sealed Tenders.” Journal
of Finance 16 (1961):8-37.
Ward, R.W. “Evaluating the Beef Promotion Checkoff.” NICPRE Quarterly 4 (1998):1-
4.
Ward, R.W., and O.D. Forker. “Washington Apple Advertising: An Economic Model of
Its Impact.” Washington Apple Commission, WAC 91:1, University of Florida,
Gainesville, 1991.
33

Williams, G.W., C.R. Shumway, H.A. Love, and J.B. Ward. “Effectiveness of the
Soybean Checkoff Program.” Texas Agricultural Market Research Center Report.
Department of Agricultural Economics. Texas A&M University. May, 1998.
34

Table 1. Estimated Average Benefit-cost Ratios for Generic Advertising and
Promotion Programs for Various Commodities
Commodity Study Benefit-Cost Ratio U.S. dairy advertising Kaiser (1997) 3.4
U.S. beef advertising Ward (1998) 4.9 to 6.7
U.S. cotton promotion Nichols et al. (1997) 3.2 to 3.5
U.S. soybean export promotion & production research Williams et al. (1998) 8.3 Canadian butter advertising Goddard and Amuah (1989) 1.0
Florida orange juice advertising Capps et al. (2003) 2.9 to 6.1
Washington apple advertising Ward and Forker (1991) 7.0
Walnut domestic promotion Kaiser (2002) 1.65 to 9.72
35

Table 2. Average Group Producer Surplus and Expected Contributions (Benefit-Cost
Ratio 4:1)
Part A Part B Part C – Threshold Producer Surplus (No Program) (Mandatory) 50% 70% 90%_ Part Comparison All Sessions (All Groups) $ 31.17 $ 95.17 $ 68.21 $ 88.96 $ 75.06 Difference from Part A $ 64.00 ** $ 37.04 ** $ 57.79 ** $ 43.89 **
Difference from Part B $-26.96 ** $ -6.21 ** $-20.11 **
Difference from Part C (50%) $ 20.75 ** $ 6.85 **
Difference from Part C (70%) $-13.90 **
Group Comparison Referendum Group $ 29.98 $ 91.93 $ 77.96 $ 92.60 $ 92.31 Non-Referendum Group $ 32.35 $ 98.41 $ 58.46 $ 85.33 $ 57.82 Difference $- 2.37 ** $- 6.48 ** $ 19.50 ** $ 7.27 ** $34.49 **
Group Comparison, Expected Contribution Referendum Group 62.9% 70.6% 58.3% Non-Referendum Group 35.5% 48.4% 33.2% Difference 27.4% ** 22.2% ** 25.1% **
Note: The total number of observations = 160. Significance is indicated by * (5% significance level) and ** (1% significance level or less).
36

Table 3. Regression Results for Subject Producer Surplus and Probability of Advertising Contribution (Benefit-Cost Ratio 4:1) Dependent Variable Producer Surplus 1/0 Final Advertising Variable Per Round ($)a Contributionb
INTERCEPT -10.8288** -3.5283** (0.7073) (0.7751)
COST -0.0621* (0.0338)
ADV_CONT-1 0.6167** (0.0894)
DEMAND 0.2789** (0.0072)
PPM 0.0510** 0.1217** (0.0160) (0.0212)
PPM*PPM -0.0004** -0.0010** (0.0001) (0.0001)
PPM*GRPREF 0.0078** 0.0091** (0.0024) (0.0030)
ROUND -0.1292** -0.2535** (0.0800) (0.0866)
ROUND*PPM 0.0039** 0.0041** (0.0011) (0.0012)
ROUND*GRPREF -0.2215** (0.0353) Covariance Parameter Estimates:
2Bσ (Group) 1.1822* 0.2953*
(0.6566) (0.1664) 2Sσ (Subject) 0.7141** 0.8921**
(0.0248) (0.0283) 2Rσ (Round) 0.5081** 0.0786**
(0.0669) (0.0169)
Fit Statistics: -2 Res Log Likelihood 5047.2 7339.6 AIC 5053.2 7345.6 PPM Level where Dependent Variable Maximize (mean ROUND) GRPREF = 1 (Yes) 82 73 GRPREF= 0 (No) 74 68 Note: Standard errors appear in parentheses. Significance is indicated by * (10% significance level) and ** (5% significance level or less). a Producer Surplus is equal to subject gross profit, excluding advertising contributions. b Binomial error distribution with probit link function
37
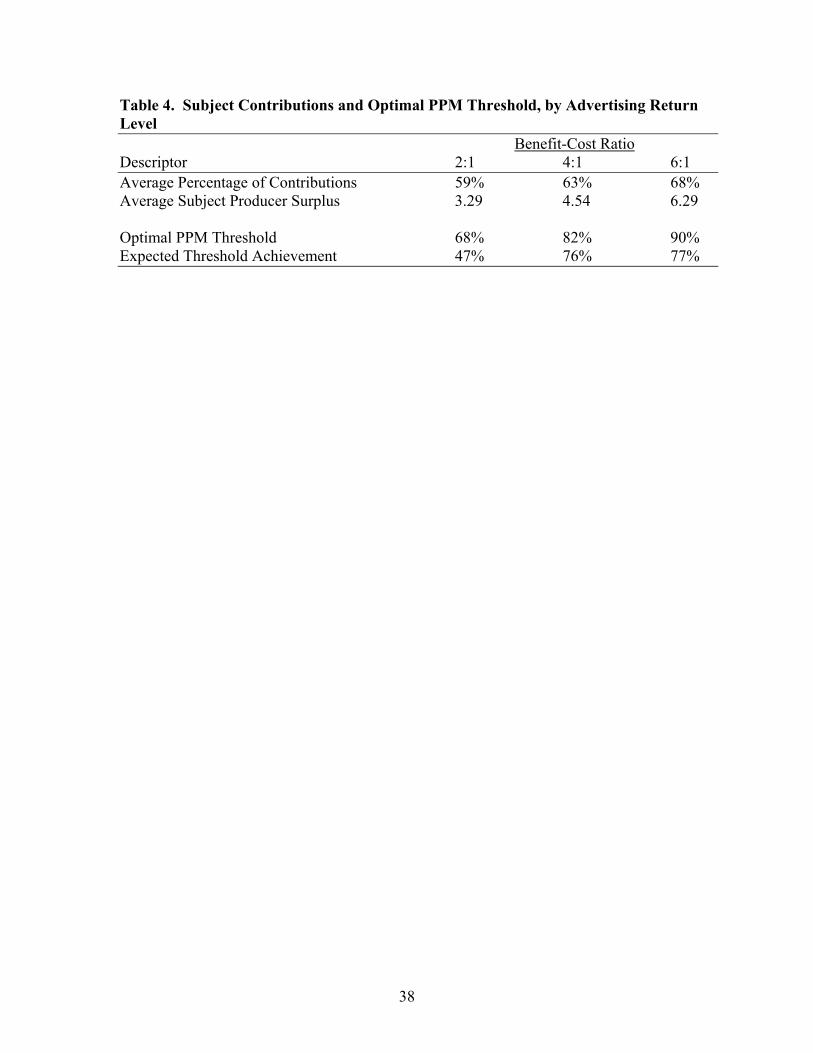
Table 4. Subject Contributions and Optimal PPM Threshold, by Advertising Return Level Benefit-Cost Ratio Descriptor 2:1 4:1 6:1 Average Percentage of Contributions 59% 63% 68% Average Subject Producer Surplus 3.29 4.54 6.29 Optimal PPM Threshold 68% 82% 90% Expected Threshold Achievement 47% 76% 77%
38
66.8%
80.0%
89.7%
51.0%
73.8%
83.5%
30%
40%
50%
60%
70%
80%
90%
100%
40%
50%
60%
70%
80%
90%
100%
Threshold Levels
Perc
enta
ge o
f Con
trib
utio
ns
Referendum
No Referendum
Figure 1. Average Contributions to the Advertising Program (Benefit-Cost Ratio 4:1)
39
90.0%
65.0%65.0%
40.0%
95.0%
70.0%
30%
40%
50%
60%
70%
80%
90%
100%
40%
50%
60%
70%
80%
90%
100%
Threshold Levels
Perc
ent T
hres
hold
Met
ReferendumNo Referendum
Figure 2. Percent Threshold Achieved (Benefit-Cost Ratio 4:1)
40
40 43 46 49 52 55 58 61 64 67 70 73 76 79 82 85 88 91 94 97
1002 3 4 5
3.3
3.6
3.9
4.2
4.5
4.8
Prod
ucer
Sur
plus
($)
PPM Level
Round
Figure 3. Predicted Subject Gross Surplus with Referendum (Benefit-Cost Ratio
4:1)
41

40 42 44 46 48 50 52 54 56 58 60 62 64 66 68 70 72 74 76 78 80 82 84 86 88 90 92 94 96 98
100
135
0.2
0.3
0.4
0.5
0.6
0.7
0.8Pr
obab
ility
PPM Level Round
Figure 4. Predicted Subject Advertising Contribution Probability with Referendum
(Benefit-Cost Ratio 4:1)
42
Related Documents