Center for Entrepreneurship & Technology cet.berkeley.edu Optimal Charging of Electric Vehicles (EVs) Center for Entrepreneurship & Technology (CET) Technical Brief Number: 2009.6.v.1.1 Revision Date: September 11, 2009 Dwight Crabtree, Thibault Faney, Konstantinos Koudigkelis, Anthony Papavasiliou Ikhlaq Sidhu (PI), Phil Kaminsky, Burghardt Tenderich

Welcome message from author
This document is posted to help you gain knowledge. Please leave a comment to let me know what you think about it! Share it to your friends and learn new things together.
Transcript

Center for Entrepreneurship & Technology
cet.berkeley.edu
Optimal Charging of Electric Vehicles (EVs)
Center for Entrepreneurship & Technology (CET) Technical Brief
Number: 2009.6.v.1.1 Revision Date: September 11, 2009
Dwight Crabtree, Thibault Faney, Konstantinos Koudigkelis, Anthony Papavasiliou
Ikhlaq Sidhu (PI), Phil Kaminsky, Burghardt Tenderich

University of California, Berkeley Center for Entrepreneurship & Technology
Center for Entrepreneurship & Technology
cet.berkeley.edu
Abstract The tremendous momentum behind electric vehicle (EV) development and its potential for mass adoption within the next decade represents perhaps the largest technological shift in automotive history. Within this emerging ecosystem, a new and untested player is central to EV success: The Electric Recharge Grid Operator, or EV service provider. These entities will need to determine how best to juggle their customers’ demands such as a high level of service and affordability, with keeping costs low and profits high. The optimal charging of electric vehicles will be the number one financial and logistical challenge these organizations will need to address. This technical brief was created to advise EV service providers on best practices for optimally charging EVs. Optimal charging is defined as the programming of vehicle charge lengths and times to minimize electricity costs and mitigate load disruptions on the electrical grid while satisfying consumers’ driving needs. With the enormous potential size and scale of EV adoption in the U.S., this is a critical task for grid operators whose businesses will either succeed or fail based on how efficiently they run their operations. Extensive research was conducted, and various models, methodologies and simulations were tested, to arrive at the EV optimal charging conclusions revealed in this technical brief.
University of California, Berkeley Center for Entrepreneurship & Technology
Center for Entrepreneurship & Technology
cet.berkeley.edu
Contents Introduction ..............................................................................................................1
Part A: Definitions and Methods ............................................................................. 2
1. Optimal Charging: Problems and Challenges ...................................................... 2
2. Models and Methodologies .................................................................................. 2
2.1. Power Management Algorithm ............................................................. 3
2.2. Customer Usage Model......................................................................... 3
2.3. Financial Model .....................................................................................7
Part B: Results......................................................................................................... 8
1. Simulation Results for Optimal Charging............................................................ 8
1.1. Smart versus Naïve Charging Under a TOU Tariff ............................... 9
1.2. Tariff Performance ...............................................................................12
1.3. Beyond Regulated Tariffs: Exposure to the Market ............................13
1.4. Should EV Service Providers Use Wind Power?..................................16
2. Financial Results: Smart versus Naïve Charging ...............................................19
2.1. Variable Cost: Fuel Cost per Mile ........................................................19
2.2. Fixed Costs: Infrastructure, SG&A, R&D ............................................21
2.3. Smart versus Naïve Profitability......................................................... 22
2.4. Key Sensitivities .................................................................................. 23
Conclusions ............................................................................................................ 25
Appendix ................................................................................................................ 26
1. PG&E Tariff Schedule for Electric Vehicles ....................................................... 26
2. Model Assumptions ........................................................................................... 26
3. Smart Charging Algorithm................................................................................. 29

University of California, Berkeley Center for Entrepreneurship & Technology
Center for Entrepreneurship & Technology
cet.berkeley.edu
4. Wind Power Data ............................................................................................... 30
Biographies..............................................................................................................31
About UC Berkeley Center for Entrepreneurship & Technology .......................... 33

University of California, Berkeley Center for Entrepreneurship & Technology
CET Technical Brief Optimal Charging of Electric Vehicles
1
Introduction EVs are experiencing serious momentum and the potential for mass adoption within the next decade represents perhaps the largest technological shift in automotive history. This transformation involves a variety of players in the EV ecosystem, from car companies to battery makers to utilities. Besides inherent economic drivers and supportive policy measures, successful EV development, deployment and maintenance will require some degree of coordinated effort among the ecosystem players in order to achieve cost competitiveness, optimal performance, ease of charging, and sufficient driving range—all of which will be essential to win customer support. Many organizations involved in the EV ecosystem already play a key role in the existing transportation ecosystem. However, there is one critical player that is functionally new to the transportation area: the Electric Recharge Grid Operator, or EV service provider. The grid operator invests in, deploys, and maintains a network of charging stations and battery exchange stations. In the same way that mobile phone companies deploy network infrastructure and charge customers for its use, EV infrastructure providers are deploying fee-based services to conveniently charge electric vehicles. In fact, there are many similarities between EV grid operators and mobile telecommunications providers, such as the fact that cars and mobile phones roam between networks, and EV and mobile service providers must establish trusted billing relationships with their customers. But perhaps most importantly, both of these types of organizations succeed through efficient operations. In order to successfully compete, efficiency is critical for EV service providers. A grid operator must carefully manage the costs of providing a high quality of service (QoS) against the costs of deployments and customer acquisition. Even a small miscalculation can become a quick recipe for failure as electric grid operators own the important role of charging optimization for large fleets of electric vehicles. Optimal charging is defined as the programming of vehicle charge lengths and times to minimize electricity costs and mitigate load disruptions on the electrical grid while satisfying consumers’ driving needs. Optimal charging will ultimately determine success or failure for EV grid operators. To support optimal charging discoveries as outlined in this brief, the authors first discuss optimal vehicle charging problems and challenges facing EV service providers. Within that section, tools are identified that EV service providers can use to effectively address these challenges and enhance the core value of their services. Second, the authors outline their models and methodologies for testing charging conditions. Third, results of the models and related simulations are presented. The fourth section outlines the financial impact of implementing optimal charging systems. And the last portion of this document provides an overview of conclusions on how to best optimally charge EVs.

University of California, Berkeley Center for Entrepreneurship & Technology
CET Technical Brief Optimal Charging of Electric Vehicles
2
Part A: Definitions and Methods
1. Optimal Charging: Problems and Challenges EV service providers face a variety of challenges with regard to managing the process of charging their customers’ electric vehicles. In general, the issues can be categorized as the following:
• Customer charging needs and preferences (e.g., frequency of charge, time-of-day, speed-of-charge)
• Customer willingness-to-pay (WTP)
• Cost of electricity to EV service providers
• Load balancing on the electric grid
• Use of renewable energy sources such as wind power
In order to add value to customers and suppliers and be profitable, EV service providers need to fully understand the role they play and how they can position themselves to minimize electricity costs as well as optimize WTP and price. The results of the modeling and simulations conducted for this brief will lead to conclusions and recommendations about how EV service providers can address each of the above challenges in their favor.
2. Models and Methodologies This section considers the optimal charging problem. The EV service provider enrolls customers in contracts, which determine the monthly energy demand (miles driven) of the users as well as the priority of their charging. Various customer usage models have been used as inputs to an algorithm that optimizes the charging of electric vehicles with the objective of maximizing the profitability of the EV service provider (see Figure A-1).
Figure A-1: Model overview.
To begin the analysis, the authors compared the electricity cost of an EV service provider charging cars using the power management algorithm versus without using the power management algorithm.

University of California, Berkeley Center for Entrepreneurship & Technology
CET Technical Brief Optimal Charging of Electric Vehicles
3
In this case, actual Pacific Gas and Electric (PG&E) in California tariffs for EVs (the E91 tariff rate, see Appendix A) were used. The model was also tested using historical 2008 tariffs. The difference in cost between smart charging (with algorithm) and naïve charging (without algorithm) represents the cost savings and financial benefit to the EV service provider of implementing the algorithm. After the initial analysis, the authors also considered the option of coupling EVs with wind power generators. This has the significant advantage of utilizing wind power generated at night that would otherwise be sold at a low price during the off-peak demand period.
2.1. Power Management Algorithm Following is an overview of the power management algorithm, as it serves as the heart of an EV service provider’s control center. The algorithm receives as inputs 1) a time-varying sequence of electric power prices; 2) requests for energy by various cars as they plug into the grid; 3) every time the algorithm determines which vehicles are charged; and 4) other relevant information such as if the service provider is using its own energy sources. The algorithm minimizes the expected purchasing costs of electricity for the EV service provider subject to various operational constraints such as requirements for charging vehicles on time. This brief models the optimization problem faced by the algorithm as a dynamic programming problem, and employs a computationally-efficient method for solving the smart charging problem in real-time. Details about the algorithm are given in Part C of the Appendix. Evidence of the potential cost savings that can be achieved by employing smart charging algorithms are demonstrated in the following sections.
2.2. Customer Usage Model The goal of the customer usage model is to establish a very basic pricing model that could be proposed by an EV service provider to run the simulations with a model that is closer to reality than the existing flat rate model. This customer usage model should provide EV service providers with the opportunity to maximize profits (and/or minimize costs), and at the same time deter EV users from excessive driving and electricity consumption. To develop this model, different subscription plans were established using the following approach: First, it was determined what subscription model should be implemented. Based on the fact that there are many similarities between a wireless company such as AT&T and an EV service provider like San Francisco Bay Area start-up Better Place, an EV service provider could implement a subscription model similar to a wireless company’s plans. As a result, EV users will pay a monthly bill for a monthly amount of miles, which is equivalent to a monthly amount of electricity. In this study, EV users were split into different behavior categories based on the amount of miles driven in a
1 The E9 tariff includes two rate options. As explained in the appendix, the study uses rate b. In the remainder of the paper any reference to the E9 tariff implies that it is considering rate b of the tariff.

University of California, Berkeley Center for Entrepreneurship & Technology
CET Technical Brief Optimal Charging of Electric Vehicles
4
month: a) customers who drive less than the average; b) customers who drive as the average; c) customers who drive above the average; and d) a premium category for customers who will pay for differentiated service. The authors also aimed for flexibility and a simple subscription model. The resulting five behavior categories are outlined in Table 1 (on page 5). It is important to note that the number of categories is arbitrary—the authors chose five behavior categories, believing that with these five different plans the authors could create a quite simple yet flexible subscription model, which could meet most of the needs of both the potential EV users and providers. However, the percentage of people in each category may vary based on local transportation data and markets. Second, the willingness-to-pay (WTP) of each user was calculated based on the equivalent price of gas, assuming a gasoline consumption of 22 miles/gal and a gasoline price of $3/gal. For example, a person in the behavior category “drive less than 1,000 miles per month” will have a WTP of 1,000 mi/month * (1/22) gal/mi * 3$/gal = 136 dollars/month. The following chart is presented in order to clarify what a customer is willing to pay for using the services of an EV service provider.
Figure A-2: Illustration of WTP.
This chart reveals that potential EV users are willing to pay no more than the amount that they pay today for gas. And as the above red line (gas prices) shifts to the right, the potential profits for the EV service providers are increased. Furthermore, as this difference between the cost of electricity and cost of gas increases, the transition from Internal Combustion Engine cars (ICEs) to EVs will happen more rapidly and easily. As a result, it is of paramount importance for an EV service provider to take all of the required actions and to employ smart techniques and tools in order to be able to buy electricity at competitive prices—at least cheaper than gas prices. It is important to note that, in addition to the cost of electricity, an EV service provider also assumes the cost of building the required infrastructure such as battery swapping stations and charging spots. In this study, it is presumed that this cost is fixed and constitutes an upfront investment. As such,

University of California, Berkeley Center for Entrepreneurship & Technology
CET Technical Brief Optimal Charging of Electric Vehicles
5
this report focuses only on the electricity cost, which changes over time (e.g., peak hours, summer, winter). Finally, it should be noted that customers might even be willing to pay more for an EV than an ICE car because driving an EV could reduce carbon dioxide emissions. As a result, an EV service provider could gain some financial advantage of the fact that EVs are environmentally friendly. Third, the authors created one plan for each behavior category and equated the price of each plan with the WTP of the users in each category. It is also possible to add a premium considering people who are willing to pay a bit more in order to drive an electric vehicle. This yields the following table: Table A-1: Behavior Categories and Pricing
Behavior category (mi/month)
People in each category Plan Price
Average value driven
Less than 200 10 % Pay-as-you-go $0.10/mile 100 mi/mo
Less than 600 20 % 600 miles $60/month or $0.083/mile 500 mi/mo
Less than 1,000 40 % 1,000 miles $100/month or $0.080/mile 800 mi/mo
Less than 1,500 20 % 1,500 miles $150/month or $0.10/mile 1,500 mi/mo
More than 1,500 10 % Unlimited $250/month or $0.10/mile 2,500 mi/mo
As in the case of mobile communications, it is assumed that drivers will choose a plan with greater mileage than their average monthly driving distance in order to avoid a penalty price for excess miles. This will serve as an input to run the simulations. Another consideration is that EV service providers should also offer their customers incentives to recharge their EVs during off-peak hours. Offering users the opportunity to charge their cars whenever they want during the day could pose significant challenges across the electric power supply chain, from the generation level down to the transmission and distribution level. One potentially severe impact of such an action would be a substantial increase in the annual peak load of the power grid. Accommodating peak demand requires generation units that are solely dedicated to this task, and otherwise remain idle year-round. Therefore, increasing peak load in a system represents a significant capital investment for the grid operator, which will pass along this cost to consumers. Consequently, as the number of peak loads increases, the price of electricity increases too. As a result, an EV service provider will buy electricity at a high price, which will lead to a decrease of its profits. Another potentially severe impact could be damage to the reliability of an EV service provider. For example, if an EV service provider is not aware of the amount of EVs requiring to be charged within a specific timeframe, it might not be able to successfully meet their charging needs, leading to a negative customer experience. These problems will become even more severe as the number of EVs grows. As a result, it is quite clear that an EV service provider should define a set of rules through which it will be able to determine which EVs should be charged, and when. If an EV service provider practices such a strategy, it will not only be able to minimize its operations costs by buying cheap electricity,

University of California, Berkeley Center for Entrepreneurship & Technology
CET Technical Brief Optimal Charging of Electric Vehicles
6
but also to increase its reliability. However, such a strategy will impose some restrictions to EV users and it might make the recharging of an EV more difficult than the refueling of an existing Internal Combustion Engine car. Consequently, the EV service provider should try to make the right trade-off between an efficient set of load-control rules, and maintaining an excellent reputation for reliability and a high QoS. In order to determine these load-control rules it is necessary to understand that EVs represent a very flexible category of loads. In particular, most EVs remain idle for the majority of the day (20 out of 24 hours per day, on average), and can be charged at any time they are idle. This concept of flexible category of loads could have significant implications for renewable energy suppliers. Renewable energy sources like wind and solar power suffer from the inability to control their variable and unpredictable output. Therefore, introducing a flexible category of loads such as EVs into the grid, which can be charged as renewable resources become available, will create extraordinary potential for increasing the integration of these energy sources in a cost-effective fashion. This will have a positive impact on the renewable energy industry, and possibly on the overall electricity economy. The purpose of this section is not to create sophisticated charging subscription categories, but is to offer a set of simple and flexible load-control rules which could achieve all of the aforementioned goals. To accomplish this, the five subscription plans were divided into the following two broad categories:
1. High priority charging: Customers in this category can charge their cars within four hours of plugging into the grid, either at home or work. However, these users have to pay a premium for this luxury.
2. Low priority charging: Customers in this category can charge their cars within eight hours of plugging into the grid, either at home or work. The majority of EV users should belong in this category.
The combination between the five different subscription models and the two priority charging categories will lead to a flexible customer usage model that will discourage excessive driving/energy consumption. It will also ensure the recharging of an electric vehicle is no more difficult than the refueling of an ICE car. The following table summarizes the differences among the five subscription plans:. It is important to note that the more miles a customer buys, the cost per mile would be cheaper for the first three plans. For example, the cost per mile for the “pay-as-you-go” is 10 cents. For 600 miles the price is 8.3 cents and for 1,000 it is 8 cents. But for the remaining two plans this is not true because the customers in this category pay some extra money for the high priority charging.

University of California, Berkeley Center for Entrepreneurship & Technology
CET Technical Brief Optimal Charging of Electric Vehicles
7
Table A-2: Priority Class for Each Plan
Plans Priority Charging
Unlimited High
1,500 High
1,000 Low
600 Low
Pay-as-you-go Low
Plans “Unlimited” and “1,500” belong in the “high priority charging category” for the following reasons: If an EV user belongs in either of the “Unlimited” or “1,500” categories, then he drives at least 50 miles per day, on average. Given that the range of his EV’s battery is almost 100 miles, probably he will need to charge his car at least once per day. As such, the EV service provider should offer him the option to charge his car as soon as possible, at a premium. The total number of customers in these two categories consists of 30% of the total number of customers. These constitute the highest-paying customers of an EV service provider and therefore should be treated, and serviced, accordingly. However, the vast majority of EV service provider customers will belong in the “low priority charging category”, which is one of the objectives of this customer usage model. The customers who are subscribers in Plans “1,000”, “600” and “Pay-as-you-go” should belong in the “low priority charging” category, as they don’t need to charge their cars on a daily basis. Of course, if there is a surplus of cheap electricity their cars might be charged more than once per day; but by driving less, these drivers present EV service providers with a huge opportunity in the form of flexibility and a huge opportunity upon which EV service providers can capitalize.
2.3. Financial Model The financial model determines the bottom-line impact (profit) of using a smart charging system instead of naive charging. The model indicates the possible price range that an EV service provider can charge, and will compare the cost of driving an EV to the cost of driving an ICE car. It assumes that drivers will not switch to EVs unless it is price competitive with ICE vehicles. Therefore, ICE car costs will determine a customer’s willingness-to-pay for an EV service. All costs are shown on a $/mile unit basis to ensure a consistent comparison and to reflect the actual cost to users. Key drivers to the model include 1) gasoline prices, which affect ICE car costs and thus customers’ willingness-to-pay for EV miles; 2) average electricity costs (smart vs. naïve charging), which represent the most significant variable cost; and 3) infrastructure costs (e.g., batteries, charge-spots, switching stations), which determine capital expenditure and depreciation expense. The model’s assumptions are tested with robust sensitivity analysis on key parameters.

University of California, Berkeley Center for Entrepreneurship & Technology
CET Technical Brief Optimal Charging of Electric Vehicles
8
Part B: Results
1. Simulation Results for Optimal Charging As mentioned previously, one of the key cost saving opportunities for the EV service provider will be to use intelligent charging patterns for EVs. This section provides simulation results which support this claim. The optimal charging dilemma presented to the EV service provider can be explained as follows: The service provider can benefit by intelligently timing the charge of EV batteries because electricity is cheaper during off-peak hours when system demand is not as high, compared to hours of peak demand. However, the service provider cannot delay the charging of batteries indefinitely because vehicle drivers are likely to run out of energy in transit if their batteries are not sufficiently charged between journeys. Additionally, certain drivers may subscribe to high-priority programs which require that their EVs be charged immediately after use. The EV service provider then faces the trade-off of immediately charging vehicles as soon as they are plugged into the grid in order to ensure that all batteries are charged as much as possible at all times (and therefore available and reliable to consumers), versus the option of delaying the charging of batteries in order to charge vehicles at a lower rate during off-peak hours. This challenge becomes more complicated when the price at which the EV service provider purchases its supply varies randomly, as would be the case if the energy is purchased from a wholesale hour-ahead electricity market compared to purchasing power from a local utility at a predetermined time-of-use (TOU) rate. Moreover, the availability of energy for the EV service provider may also vary randomly. This is particularly relevant as renewable energy sources are increasingly integrated into power systems and EVs can be used as buffers for storing renewable energy and balancing the grid during hours of high renewable energy supply. This section investigates various issues pertaining to the operations of an EV service provider. First, it is assumed that the EV service provider is charging vehicles according to a TOU tariff and the authors compare the naïve (or dumb) charging strategy—whereby vehicles are immediately charged the moment they plug into the grid—with a more sophisticated charging strategy which accounts for the time-varying price of electricity and utilizes the flexibility of EV charging. The second section introduces further complexity to the model by comparing the case where all drivers are enrolled in a single subscription plan to a tariff which consists of five different plans, and compares the performance of these tariffs in terms of EV service provider power purchasing costs. Third, the authors compare the case where the EV service provider operates under a TOU tariff to the case where the electricity is purchased from an hour-ahead wholesale electricity market. The last section proposes a scenario of coupling electric vehicle charging with wind power generation in order to mitigate the variability of wind power generation. In the following simulations it is assumed that the EV service provider is serving 100 drivers which follow a daily route from home to work and from work back home. Further details about driver behavior are provided in the Appendix Section B.

University of California, Berkeley Center for Entrepreneurship & Technology
CET Technical Brief Optimal Charging of Electric Vehicles
9
1.1. Smart versus Naïve Charging Under a TOU Tariff In this section the EV service provider is assumed to procure electricity according to a simplified version of the PG&E E9 tariff, which is described in Paragraph A of the Appendix. It should be noted that the E9 tariff differs between summer and winter. During the summer there are three tiers (off-peak, part-peak and peak), whereas winter days are split into off-peak and part-peak hours only and the corresponding prices are lower than the respective summer prices. This reflects the lower stress that prevails from system demand during the winter. Additionally, it is assumed that the average one-way route of each driver is equal to 10 miles. Further details about the modeling of driving patterns are given in Paragraph B of the Appendix. Finally, the operator is tasked with charging vehicles within eight hours after they have parked and plugged into the grid. In short, all drivers are assumed to be enrolled in the “600 miles per month” Plan. The authors compare a naïve charging strategy in which vehicles are immediately charged the moment they plug into the grid with a more sophisticated charging strategy. The latter strategy accounts for the time-varying price of electricity and utilizes the flexibility of EV charging in order to reduce the cost of procuring electricity for the EV service provider. The charging algorithm employed in the analysis is described in further detail in Section 3 of the Appendix. Figure B-1 reveals the average amount of energy (kWh) supplied to a car throughout the day according to the naïve strategy, as well as according to the proposed charging algorithm. The charging patterns differ markedly. The period between 2 p.m. and 9 p.m. is the peak period of the E9 tariff during the summer, at which time electricity is most expensive. The charging algorithm is able to avoid charging vehicles that arrive to work in the morning by immediately charging these vehicles during the part-peak period from 7 a.m. to 2 p.m. Similarly, cars that return home before 9 p.m., which is still peak period, postpone their charging until after 9 p.m. In fact, cars which arrive home late enough have their charging delayed until after midnight, at which time the off-peak tariff applies. Similar results hold for winter months, during which the part-peak is between 7 a.m. and midnight, after which time cars can be charged optimally for the EV service provider. One notable impact of time-of-use pricing is the shift of peak load at 1 a.m.: Midnight marks the beginning of the off-peak period and many cars need to be urgently charged once off-peak prices are in place. In order to mitigate this adverse effect, TOU rates often include penalty charges which prevent consumers from exceeding a certain maximum of energy consumption within a specific hour. The E9 tariff includes such charges; however, these charges have not been captured in this model for the sake of simplicity. While accounting for these charges by adapting the charging algorithm is possible, the complexity of the problem increases considerably. The reason is that capacity charges introduce a coupling in terms of the algorithm decision variables which prevents the authors from being able to solve the problem by decomposing it to one optimal control problem per user. Further details regarding the algorithm and the computational benefits achieved by decoupling are presented in the Appendix.
University of California, Berkeley Center for Entrepreneurship & Technology
CET Technical Brief Optimal Charging of Electric Vehicles
10
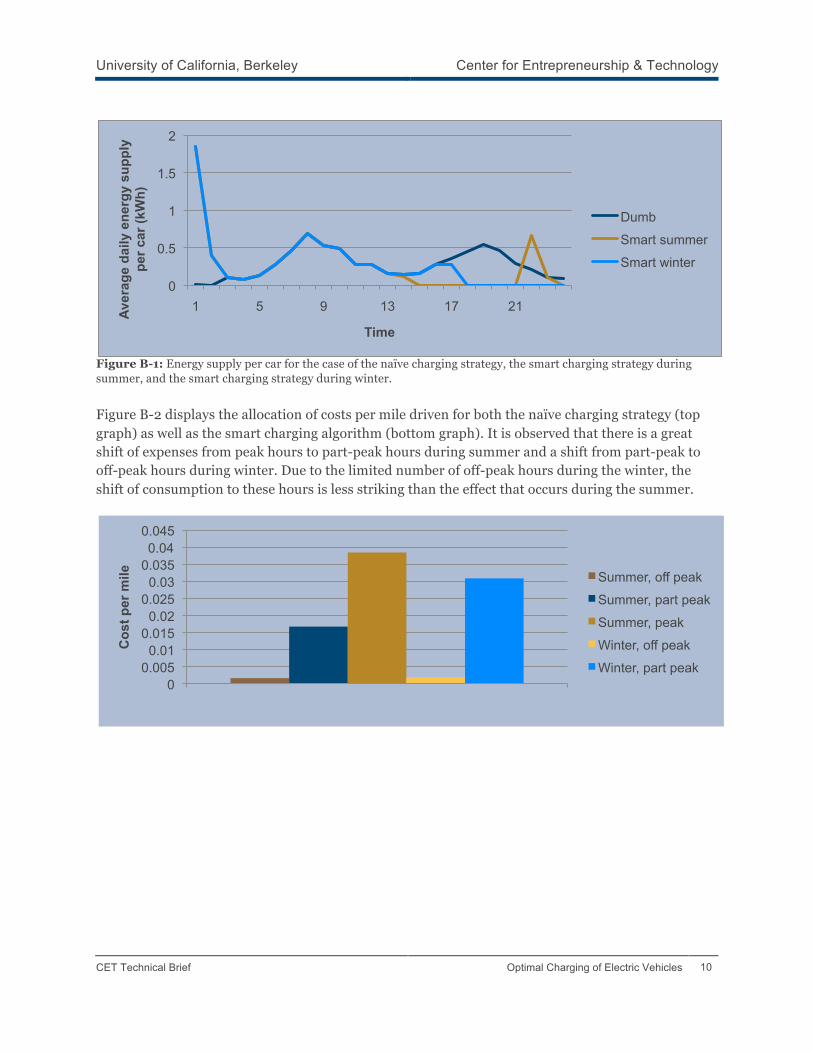
Figure B-1: Energy supply per car for the case of the naïve charging strategy, the smart charging strategy during summer, and the smart charging strategy during winter.
Figure B-2 displays the allocation of costs per mile driven for both the naïve charging strategy (top graph) as well as the smart charging algorithm (bottom graph). It is observed that there is a great shift of expenses from peak hours to part-peak hours during summer and a shift from part-peak to off-peak hours during winter. Due to the limited number of off-peak hours during the winter, the shift of consumption to these hours is less striking than the effect that occurs during the summer.
0
0.5
1
1.5
2
1 5 9 13 17 21 Aver
age
daily
ene
rgy
supp
ly
per c
ar (k
Wh)
Time
Dumb
Smart summer
Smart winter
0 0.005
0.01 0.015
0.02 0.025
0.03 0.035 0.04
0.045
Cos
t per
mile
Summer, off peak
Summer, part peak
Summer, peak
Winter, off peak
Winter, part peak
University of California, Berkeley Center for Entrepreneurship & Technology
CET Technical Brief Optimal Charging of Electric Vehicles
11
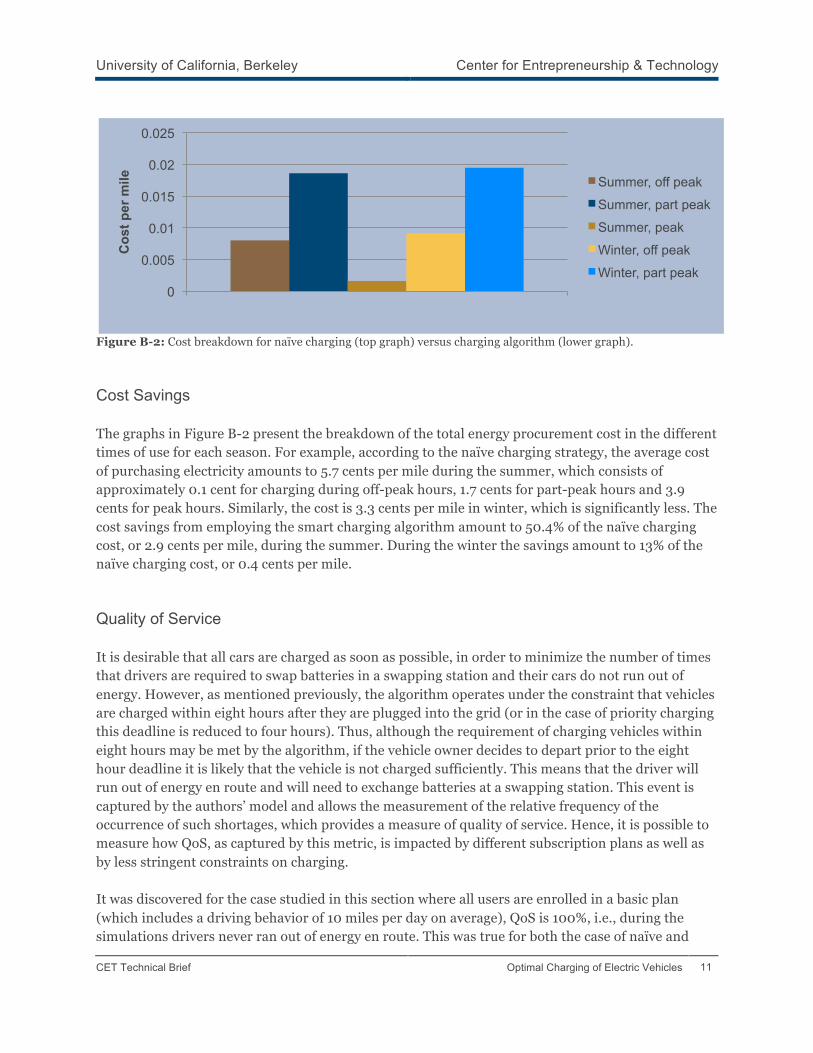
Figure B-2: Cost breakdown for naïve charging (top graph) versus charging algorithm (lower graph).
Cost Savings The graphs in Figure B-2 present the breakdown of the total energy procurement cost in the different times of use for each season. For example, according to the naïve charging strategy, the average cost of purchasing electricity amounts to 5.7 cents per mile during the summer, which consists of approximately 0.1 cent for charging during off-peak hours, 1.7 cents for part-peak hours and 3.9 cents for peak hours. Similarly, the cost is 3.3 cents per mile in winter, which is significantly less. The cost savings from employing the smart charging algorithm amount to 50.4% of the naïve charging cost, or 2.9 cents per mile, during the summer. During the winter the savings amount to 13% of the naïve charging cost, or 0.4 cents per mile. Quality of Service It is desirable that all cars are charged as soon as possible, in order to minimize the number of times that drivers are required to swap batteries in a swapping station and their cars do not run out of energy. However, as mentioned previously, the algorithm operates under the constraint that vehicles are charged within eight hours after they are plugged into the grid (or in the case of priority charging this deadline is reduced to four hours). Thus, although the requirement of charging vehicles within eight hours may be met by the algorithm, if the vehicle owner decides to depart prior to the eight hour deadline it is likely that the vehicle is not charged sufficiently. This means that the driver will run out of energy en route and will need to exchange batteries at a swapping station. This event is captured by the authors’ model and allows the measurement of the relative frequency of the occurrence of such shortages, which provides a measure of quality of service. Hence, it is possible to measure how QoS, as captured by this metric, is impacted by different subscription plans as well as by less stringent constraints on charging. It was discovered for the case studied in this section where all users are enrolled in a basic plan (which includes a driving behavior of 10 miles per day on average), QoS is 100%, i.e., during the simulations drivers never ran out of energy en route. This was true for both the case of naïve and
0
0.005
0.01
0.015
0.02
0.025 C
ost p
er m
ile
Summer, off peak
Summer, part peak
Summer, peak
Winter, off peak
Winter, part peak

University of California, Berkeley Center for Entrepreneurship & Technology
CET Technical Brief Optimal Charging of Electric Vehicles
12
smart charging. It will be noted later that changing subscription plans, and in particular by having certain drivers enroll in longer-than-average-distance contracts, it is sometimes the case that shortages occur and QoS deteriorates.
1.2. Tariff Performance This section implements the customer subscription model where drivers are enrolled in five different subscription categories, depending on the average distance of miles driven. Drivers belonging in each of the five subscription categories are assumed to consume, on average, a fraction of their full credit. In particular, the input for the simulations of this section, which determines the segmentation of customers in different plans and their average driving behavior, is drawn from Table A-2. In what follows the authors compare a scenario where customers are offered a single subscription contract (the basic “600 miles per month”) to the case where they are offered the five-tiered contract. Table B-1 compares the cost of purchasing electricity for the case of the single contract to the case of the tiered contract. In this section cost calculations are based on running the smart charging algorithm, both for the case of a single subscription plan as well as for the case of the five-tier plan. Table B-1: Costs under the Five-tier Tariff Structure Compared to the Basic Tariff for Summer and Winter
Winter costs 5 categories (cents per mile)
Winter costs 1 category (cents per mile)
Summer costs 5 categories (cents per mile)
Summer costs 1 category (cents per mile)
Off-peak 0.55 0.91 0.49 0.80
Part-peak 3.22 1.95 2.28 1.86
Peak N/A N/A 2.49 0.16
Total 3.77 2.86 5.26 2.82
It is observed that in the tiered case the costs of the service provider are significantly higher than in the case of the single tier. This can be attributed to the fact that a large fraction of customers are now subscribed in the “1,500” and “Unlimited” Plans, which are high priority plans that require the EV service provider to charge vehicles within four hours after these vehicles are plugged into the grid. Consequently, the EV service provider is forced to procure much larger amounts of peak-hour electricity during the summer—approximately doubling procurement costs. The result above indicates that the EV service provider costs are highly sensitive to the QoS constraints. Therefore, the EV service provider will have to be very careful in designing its subscription plans such that the additional costs imposed by the additional QoS guarantees do not overwhelm the revenue increase of differentiating among customers via tiered subscriptions.

University of California, Berkeley Center for Entrepreneurship & Technology
CET Technical Brief Optimal Charging of Electric Vehicles
13
Quality of Service In the case of tiered subscription, a shortage rate of 0.4% was observed, which means that drivers were short of energy en route relatively infrequently. Typically, these drivers were observed to be long distance drivers who left for their destinations at a time much earlier than their expected departures. Their early departures, combined with the fact that they traveled a large distance, resulted in losing energy midway through the trip. This highlights the interesting challenge of designing charging algorithms which are customized to the driving habits of individual drivers: Learn the driving habits of individuals and optimize vehicle charging in order to ensure reliable transportation without dramatically increasing costs for the EV service provider.
1.3. Beyond Regulated Tariffs: Exposure to the Market In this section the authors use hour-ahead electricity data from the California market, as described in the Appendix. The average electricity price for the case of summer and winter are shown in the following figure, superimposed on the aforementioned E9 tariff. The price time series shown is also used as input data for the certainty equivalent control applied by the smart charging algorithm, as described in the Appendix and seen in the following Figures B-3.
-0.05
0
0.05
0.1
0.15
0.2
0.25
0.3
1 5 9 13 17 21
Hour ahead
E9

University of California, Berkeley Center for Entrepreneurship & Technology
CET Technical Brief Optimal Charging of Electric Vehicles
14
Figure B-3: Hour-ahead electricity prices superimposed on PG&E E9 tariff for the case of summer (upper figure) and winter (lower figure).
It becomes immediately obvious that the hour-ahead market prices for the time window to which the authors’ data belongs to are on average significantly lower than the E9 tariff. This does not imply that purchasing from the hour-ahead market is generally preferable for the EV service provider, because the volatility of electricity market prices is notorious. Moreover, if EVs become widespread, power demand will only increase as will costs for EV service providers. The standing assumption in this section is that customers are distributed according to the five-tier subscription model. Figure B-4 shows the behavior of the smart charging algorithm compared to the naïve charging strategy. The smart charging algorithm actively monitors market prices, balancing at every hour the chance that the future prices of electricity will be favorable compared to the existing electricity prices, subject to the charging deadlines. As a result, the algorithm is very active in responding to market price signals.
Figure B-4: Smart charging algorithm for the case of hour-ahead wholesale electricity prices.
0
0.02
0.04
0.06
0.08
0.1
0.12
1 5 9 13 17 21
Hour ahead
E9
0 0.2 0.4 0.6 0.8
1 1.2 1.4 1.6 1.8
1 5 9 13 17 21 Aver
age
daily
ene
rgy
supp
ly
per c
ar (k
Wh)
Time
Dumb
Smart summer
Smart winter

University of California, Berkeley Center for Entrepreneurship & Technology
CET Technical Brief Optimal Charging of Electric Vehicles
15
Table B-2 compares the cost of procuring electricity under the E9 tariff versus procuring energy from the wholesale market. The cost difference is quite significant, with wholesale purchases leading to a savings of approximately 75% of the cost resulting from the E9 tariff. Moreover, the smart charging algorithm achieves a consistently improved behavior compared to the naïve charging strategy and further decreases power purchasing costs. As a note of caution, however, these results cannot be generalized because (as mentioned earlier) market prices tend to vary strongly in the daily, monthly and annual time scale and these numbers can look very different depending on the sample data used for these simulations. Table B-2: Charging Costs of the Naïve and Smart Charging Algorithm for the Case of Hour-ahead Prices, Compared to the E9 Tariff
E9 Smart charging (cents per mile)
Wholesale Naïve charging (cents per mile)
Wholesale Smart charging (cents per mile)
Summer 5.26 1.29 0.94
Winter 3.77 1.99 1.34
The Importance of Good Forecasting A parameter in the authors’ model which might have significant influence in the performance of the smart charging strategy is the ability to accurately forecast market prices in advance. Figure B-5 shows the hour-ahead market price for June 1st, 2006, the weekly average of market prices for the first week of June and the monthly average of market prices for June. The authors use these time series as forecast signals of different accuracies for the smart charging algorithm. It is observed that the signals smooth out with longer time averages of the random process, which reflects a significant loss of information. The performance of the algorithm is shown in Table B-3. It is interesting to observe that the incremental benefit of the perfect versus the weekly forecast is much greater than the incremental benefit of the weekly versus monthly forecast. That is, very accurate forecasting techniques which are very close to the exact outcome can yield noticeable economic benefits to the EV service provider, but if forecasts are not as accurate then the signals need only capture the general trends of the process at hand (e.g., a drop in the early morning, a rise in the afternoon). Based on observation, perfect versus monthly forecasting appears to enable a cost saving on the order of 10%.

University of California, Berkeley Center for Entrepreneurship & Technology
CET Technical Brief Optimal Charging of Electric Vehicles
16
Figure B-5: Perfect forecast, weekly averages and monthly averages of price data for the summer season data.
Table B-3: Performance of Smart Charging Algorithm as a Function of Forecast Accuracy
Summer cost (cents per kWh) Winter cost (cents per kWh) Perfect forecast 0.94 1.38
Weekly average 1.02 1.63
Monthly average 1.07 1.65
1.4. Should EV Service Providers Use Wind Power? In this section the authors propose a direct telemetric coupling of wind power generators with EVs. This additional energy source can be either owned by the EV service provider, or procured via a power purchasing agreement, and used to charge its vehicles while occasionally buying power from the hour-ahead market in order to cover shortages that may occur due to the random variations of wind power supply. The authors propose this coupling due to the extraordinary flexibility of charging vehicles. EVs are parked for the majority of the day and only require a few hours to be fully charged, so there is great potential for adapting their charging schedules to the availability of wind power and other renewable resources. From an algorithmic standpoint the smart charging problem becomes even more challenging and fascinating as the service provider is now facing a dual source of uncertainty, and is called to decide which cars to charge at each point in time with the variable wind power resource and whether it is necessary to also purchase power from the market at times of low wind power availability.
-0.05
0
0.05
0.1
0.15
0.2
0.25
1 5 9 13 17 21
Monthly
Weekly
Perfect

University of California, Berkeley Center for Entrepreneurship & Technology
CET Technical Brief Optimal Charging of Electric Vehicles
17
Figure B-6 shows a sample of the normalized output of wind power supply over a single day, over a week and over a month. Similar to Figure 5, the authors are using data from June 1st, 20042, the time average of the first week of June and the time average of the whole month of June. It is observed that wind power supply tends to vary on a daily basis quite significantly, as was the case for market prices.
Figure B-6: Normalized daily sample, weekly average and monthly average of wind power supply for the summer.
Figure B-7 displays the average supply of power from the smart charging algorithm and the portion of the power which is supplied from wind, where the authors employed forecasts of wind power and market prices based on monthly averages. The average wind power capacity corresponding to each vehicle is 1 kW. This implies that there is a total dedicated wind power capacity of 100 kW which is supplying power to the 100 vehicles. The authors observe that during the night, when wind power is highly available, most of the vehicle energy is supplied from wind generators and this is made possible by postponing evening charging until later in the night. In the example shown in Figure B-7, 76.3% of available wind power is used in the summer and 78.2% is used in the winter, whereas the remaining energy cannot be used because it is often the case that the available wind power exceeds the power capacity of parked vehicles.
2 The authors were unable to find market price data and wind power generation data for the same time interval, but they believe this is of limited importance since the amount of integrated wind power in California at the time could not have a significant impact on hour-ahead energy market prices.
0
0.2
0.4
0.6
0.8
1
1.2
1 5 9 13 17 21
month
day
week

University of California, Berkeley Center for Entrepreneurship & Technology
CET Technical Brief Optimal Charging of Electric Vehicles
18
Figure B-7: Average power supply per vehicle and portion of this power which comes from wind power.
The Importance of Good Forecasting As in the case of price forecasting, a good wind power forecast can improve the performance of the algorithm. This section presents results for three forecasting assumptions: perfect forecasts for both random signals i.e., both market price and wind power are known in advance; forecasts based on the weekly average of the wind power and market price signals, and; forecasts based on the monthly average of the signals. The results are shown in Tables B-4 and B-5. Again it appears that perfect forecasts can yield noticeable benefits, with minor incremental benefits resulting from the quality of less accurate forecasts. It is also worth noting that forecasting accuracy has a negligible impact on the utilization level of wind power.
0 0.2 0.4 0.6 0.8
1 1.2 1.4 1.6 1.8
1 5 9 13 17 21 Aver
age
daily
ene
rgy
supp
ly
per c
ar (k
Wh)
Time
Smart summer
Summer wind portion
0 0.2 0.4 0.6 0.8
1 1.2 1.4
1 5 9 13 17 21 Aver
age
daily
ene
rgy
supp
ly
per c
ar (k
Wh)
Time
Smart winter
Winter wind portion

University of California, Berkeley Center for Entrepreneurship & Technology
CET Technical Brief Optimal Charging of Electric Vehicles
19
Table B-4: Average Power Supply per Vehicle and Portion of this Power which Comes from Wind Power
Summer cost (cents per kWh) Winter cost (cents per kWh) Perfect forecast 0.74 0.82
Weekly average 0.79 0.90
Monthly average 0.82 0.92
Table B-5: Average Power Supply per Vehicle and Portion of this Power which Comes from Wind Power
Summer wind power utilization (%) Winter wind power utilization (%)
Perfect forecast 78.1 83.1
Weekly average 78.2 82.8
Monthly average 76.5 82.3
2. Financial Results: Smart Charging versus Naïve Charging This section explores the bottom-line financial impact of implementing a smart charging system versus a naïve charging system.
2.1. Variable Cost: Fuel Cost per Mile Variable costs in transportation are primarily fuel costs, whether they are from the cost of gasoline or the cost of electricity. These variable costs consist of a significant portion of a driver’s expense over the lifetime of a vehicle, and are acutely felt if there is large variability (as observed during oil price spikes). The first step of the authors’ financial model entailed deriving the average unit fuel cost ($/mile) for a typical ICE vehicle in order to use this as a proxy for the willingness-to-pay of an EV service provider customer. The authors used a Toyota Corolla as an example of a typical ICE vehicle as it is a popular-selling model that reflects efforts to achieve higher gasoline efficiency across fleets and is similar in size to EVs. Corollas average 30 mpg so as a base-case fuel cost, the authors use 3 $/gallon. Variation in this price is then tested in the sensitivity analysis. As such, the average fuel cost of ICE vehicles in the base-case scenario is: 3 $/gallon / 30 miles/gallon = 0.10 $/mile.

University of California, Berkeley Center for Entrepreneurship & Technology
CET Technical Brief Optimal Charging of Electric Vehicles
20
As explained in the customer usage model, this average ICE car fuel cost was used as a benchmark for the WTP of EV service provider customers and assumed that EV service providers could charge this as their unit price in customer contracts. The authors then used the electricity cost results for smart charging and naïve charging as obtained from the charging simulations and calculated the effective $/mile cost for an EV using either smart charging or naïve charging. Using PG&E E9 rates (electric vehicle time-of-use rates) and the smart charging algorithm, EV service providers can reduce their average electricity cost from 0.10 $/kWh to 0.07 $/kWh, or equivalently from 0.035 $/mile to 0.025 $/mile—a 28% reduction in costs. Assumptions and calculations for per mile fuel costs are shown in Table B-6: Table B-6

University of California, Berkeley Center for Entrepreneurship & Technology
CET Technical Brief Optimal Charging of Electric Vehicles
21
2.2. Fixed Costs: Infrastructure, SG&A, R&D In order to create a picture of the fixed costs incurred by an EV service provider, the authors examined infrastructure, SG&A or SGA (selling, general and administrative) and R&D (research and development) costs. Based on infrastructure cost data provided by San Francisco Bay Area EV service provider Better Place based on its implementation plans for Israel (Table B-7), one battery per user was assumed (which is on the low side, since an EV service provider will also need to invest in an inventory for the switching stations and for replacements) and charge spot and switching station development to a level that provides efficient scale coverage and usage. Batteries, at $15,000 per unit, remain a very high cost for EV service providers, and account for at least 75% of all capital expenditure. Total required infrastructure investment amounts to $20,000 per user, which is equivalent to $2,000 per user per year (10-year average depreciable life) and 0.14 $/mile using the authors’ base-case average driving assumption of 38 miles/day/user. In addition to infrastructure costs, the authors also estimate an SG&A cost of 27% of revenue (this is equivalent to the telecommunications industry, which has similar sales, billing and customer servicing models), and R&D costs of 10% of revenue. Table B-7

University of California, Berkeley Center for Entrepreneurship & Technology
CET Technical Brief Optimal Charging of Electric Vehicles
22
2.3. Smart versus Naïve Profitability From the willingness-to-pay data of 0.10 $/mile (which translates to actual revenues of 0.13 $/mile since on average customers only utilize 80% of their contracted miles) and the cost data, the authors constructed an income statement comparing smart charging with naïve charging on a per unit ($/mile) basis. Infrastructure capital costs and the resulting depreciation expense are so high (due mainly to the high battery cost) that earnings before interest and tax (EBIT) margins plunge firmly into negative territory. As such, the authors focus on operating cash-flow generated by the business as reflected in earnings before interest, tax, depreciation and amortization (EBITDA) margins. EBITDA margins are important as banks and investors will focus on them as an indication of the ability of a company to service debt (required to finance the infrastructure roll-out) as well as to generate cash for shareholders. As can be seen from the chart and table below, due to the 28% reduction in electricity costs by using smart charging as opposed to naïve charging, EBITDA margins for smart charging are 43% compared to 36% for naïve (or dumb) charging.
Figure B-8
0%
10%
20%
30%
40%
50%
Naïve Charge Smart Charge
Smart vs. Naïve EBITDA Margin

University of California, Berkeley Center for Entrepreneurship & Technology
CET Technical Brief Optimal Charging of Electric Vehicles
23
Table B-8
2.4. Key Sensitivities
Two key factors that drive the financial model are the gasoline cost ($/gallon), which determines the WTP of EV drivers, as well as the cost of electricity to the EV service provider (which depends on generation mix and regulatory regime of the utility providing the power). The two graphs below indicate the sensitivity of smart charging EBITDA margins to these two parameters.
1. EBITDA Margin vs. Cost of Gasoline: As gasoline prices rise (due to higher oil prices), the willingness-to-pay of customers increases and EV service providers have the potential to charge higher prices for their services. However, as shown from the graph below, the EV service provider business model is only viable with gasoline prices sustained above 2.0 $/gallon (this improves to 1.5 $/gallon for smart charging), as below this level the EV service provider would have difficulty servicing debt.

University of California, Berkeley Center for Entrepreneurship & Technology
CET Technical Brief Optimal Charging of Electric Vehicles
24
Figure B-9
2. EBITDA Margin vs. Electricity Cost: The lower the cost of electricity, the higher the profit for the EV service provider. EV service providers operating in regions with substantial hydro power and cheaper natural gas and/or wind power plants are at an advantage. Similarly, if service providers can encourage customers to charge their vehicles more during off-peak hours when electricity is cheaper, profits will improve significantly. If prices are above 0.15 $/kWh, the business model is not sustainable as the service provider would have difficulty servicing debt.
Figure B-10
-30% -20% -10%
0% 10% 20% 30% 40% 50% 60%
0.0 1.0 2.0 3.0 4.0 5.0 6.0 7.0 8.0 EBIT
DA
Mar
gin
$/Gallon
EBITDA Margin vs. Gasoline Cost
0% 10% 20% 30% 40% 50% 60%
- 0.05 0.10 0.15 0.20 0.25
EBIT
DA
%
$/kWh
EBITDA Margin vs. Cost of Electricity

University of California, Berkeley Center for Entrepreneurship & Technology
CET Technical Brief Optimal Charging of Electric Vehicles
25
Conclusions There is an immense opportunity for EV service providers to drive EV adoption and yield significant profits. In order to succeed, these organizations must consider fluctuating factors like energy prices to establish efficient business models, while keeping customer satisfaction high and services affordable. The following conclusions—based on the data found within this technical brief—can help guide EV service providers on how best to accomplish these goals.
• Employ smart charging versus naïve charging. Source data reveals that smart charging strategies can result in reduced operational expenses (28% lower electricity costs) and higher profit margins (7% improvement to EBITDA [Earnings Before Interest, Taxes, Depreciation and Amortization] margins) for an EV grid operator.
• Monitor, forecast and plan for fluctuations in gas and energy prices. The EV service provider business model is not sustainable if gasoline prices are below $2/gallon (this improves to $1.5/gallon if smart charging is used) and/or average electricity costs are above $0.15/kWh.
• Establish a set of rules that determine which EVs should be charged and when. This will minimize the complexity of dealing with volatile energy markets.
• Create subscription model contracts. A high quality of service (QoS) can be delivered via appropriate subscription model contracts. These contracts can also incentivize customers to drive no more than their average miles per day.
• Utilize wholesale energy markets to reduce electricity procurement costs. The risk associated with participating in the wholesale market can be hedged by procuring forward contracts for peak summer hours.
• Couple EVs with wind power generation to help EV service providers reduce operational costs and boost the utilization of wind power generation capacity to a level of 75-80%.

University of California, Berkeley Center for Entrepreneurship & Technology
CET Technical Brief Optimal Charging of Electric Vehicles
26
Appendix
1. PG&E Tariff Schedule for Electric Vehicles The PG&E E9 rate B3 tariff is presented below. Table X-1 shows the definition of peak, part-peak and off-peak hours as defined by PG&E for both the summer and winter seasons. Table X-2 shows the applicable rates for each part of the day and for each season. This data can be found at http://www.pge.com/tariffs /tm2/pdf/ELEC_SCHEDS_E-9.pdf. Although PG&E differentiates between weekdays and weekends, in order to simplify our analysis we have only considered the weekday tariffs and in our analysis we assumed that the same definitions apply for weekends. Moreover, PG&E has a tiered structure of which we are using only the baseline in order to further simplify our analysis. We consider this to be a reasonable assumption because the baseline quantity on which PG&E bases its calculations is season-wide energy consumption. Therefore, although daily patterns may vary significantly, since there are a large number of cars participating in the service provider system and since driving patterns are averaged throughout the entire season, the average system consumption throughout an entire season should be close to the baseline determined by PG&E. Table X-1: Definition of Peak, Part-peak and Off-peak Hours According to PG&E E9 Tariff
Summer Winter Peak 2 p.m. – 9 p.m. N/A
Part-peak 7 a.m. – 2 p.m., 9 p.m. – 12 midnight 7 a.m. – 12 midnight
Off-peak 12 midnight – 7 a.m. 12 midnight – 7 a.m.
Table X-2: Price of Electricity for Peak, Part-peak and Off-peak Hours in $/kWh
Peak Part-peak Off-peak Summer 0.28316 0.1009 0.05651
Winter N/A 0.10124 0.06423
2. Model Assumptions We assumed that vehicle batteries have a charging capacity of 22 kWh, a power rating of 6 kW and a mileage of 0.25 kWh per mile. The morning charging rate at office buildings or urban charging spots is assumed to be 6 kW and the night charging rate at homes is assumed to be 3 kW. 3 The rate B schedule applies to customers with a separately metered electric vehicle. It is therefore natural for us to use this schedule since it is expected that a service provider will provide separate electric vehicle metering at the customer location.

University of California, Berkeley Center for Entrepreneurship & Technology
CET Technical Brief Optimal Charging of Electric Vehicles
27
In terms of driving behavior we have simplified the driving patterns of drivers by decomposing their daily journeys into a morning route from home to work and an evening route from work back home. We assumed that the one-way driving distance of an average driver is randomly distributed. The arrival time of drivers to their morning and evening destinations are also randomly distributed. The joint distribution of these two random variables, energy consumption and arrival time, are displayed in the following tables. Table X-3 models morning routes from home to work and Table X-4 models evening routes from work back home. Table X-3: Joint Probability Distribution of Arrival Time to Work (rows) and Energy Consumption (kWh) for Morning Routes
0.25 0.5 0.75 1 1.25 1.5 1.75 1 0 0 0 0 0 0 0
2 0 0 0 0 0 0 0
3 0.00138889 0.002083 0.00625 0.008333 0.00625 0.002083 0.001389
4 0.00138889 0.002083 0.00625 0.008333 0.00625 0.002083 0.001389
5 0.00277778 0.004167 0.0125 0.016667 0.0125 0.004167 0.002778
6 0.00416667 0.00625 0.01875 0.025 0.01875 0.00625 0.004167
7 0.00694444 0.010417 0.03125 0.041667 0.03125 0.010417 0.006944
8 0.00972222 0.014583 0.04375 0.058333 0.04375 0.014583 0.009722
9 0.00694444 0.010417 0.03125 0.041667 0.03125 0.010417 0.006944
10 0.00694444 0.010417 0.03125 0.041667 0.03125 0.010417 0.006944
11 0.00555556 0.008333 0.025 0.033333 0.025 0.008333 0.005556
12 0.00416667 0.00625 0.01875 0.025 0.01875 0.00625 0.004167
Table X-4: Joint Probability of Arrival Time (rows) and Energy Consumption (kWh) for Evening Routes
0.25 0.5 0.75 1 1.25 1.5 1.75 13 0.00277778 0.004167 0.0125 0.016667 0.0125 0.004167 0.002778
14 0.00277778 0.004167 0.0125 0.016667 0.0125 0.004167 0.002778
15 0.00277778 0.004167 0.0125 0.016667 0.0125 0.004167 0.002778
16 0.00416667 0.00625 0.01875 0.025 0.01875 0.00625 0.004167
17 0.00555556 0.008333 0.025 0.033333 0.025 0.008333 0.005556
18 0.00694444 0.010417 0.03125 0.041667 0.03125 0.010417 0.006944
19 0.00833333 0.0125 0.0375 0.05 0.0375 0.0125 0.008333
20 0.00694444 0.010417 0.03125 0.041667 0.03125 0.010417 0.006944
21 0.00416667 0.00625 0.01875 0.025 0.01875 0.00625 0.004167
22 0.00277778 0.004167 0.0125 0.016667 0.0125 0.004167 0.002778
23 0.00138889 0.002083 0.00625 0.008333 0.00625 0.002083 0.001389
24 0.00138889 0.002083 0.00625 0.008333 0.00625 0.002083 0.001389

University of California, Berkeley Center for Entrepreneurship & Technology
CET Technical Brief Optimal Charging of Electric Vehicles
28
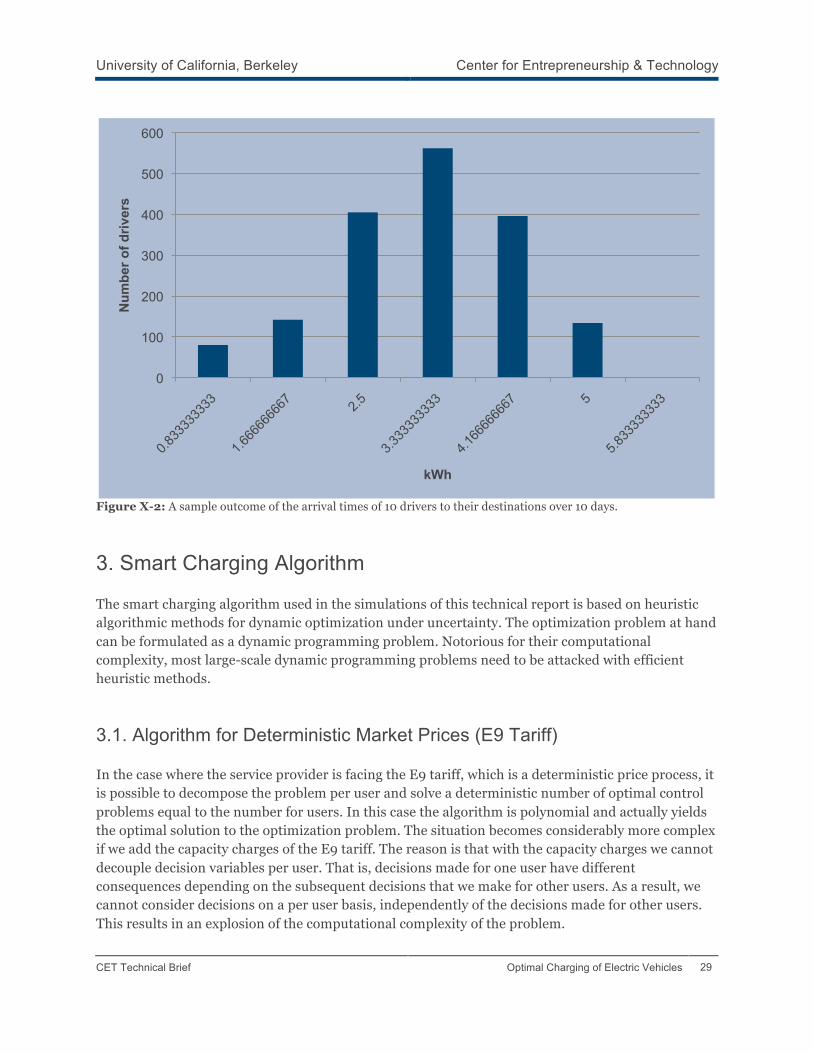
A sample realization of the driving habits of 10 drivers over 10 days based on the model described above is shown in Figures X-1 and X-2. Arrival times are distributed around 8 a.m. at which time most drivers arrive to work and 8 p.m. at which time most drivers return back home. Moreover, drivers consume an average of 3.33 kWh for each one-way route, which corresponds to a one-way average driving distance of 10 miles. The customer usage model is modified for the purpose of the simulations in Section 4. In this case the joint distributions of arrival times and energy consumption are modified for each customer in order to model the fact that drivers belonging in different subscription categories consume, on average, different amounts of energy. In particular, Figures X-1 and X-2 are centered around the average consumption of each subscription category.
Figure X-1: A sample outcome of the arrival times of 10 drivers to their destinations over 10 days.
0 2 4 6 8
10 12 14 16 18
1 2 3 4 5 6 7 8 9 10 11 12 13 14 15 16 17 18 19 20 21 22 23 24
Num
ber o
f driv
ers
Time of arrival to destination
University of California, Berkeley Center for Entrepreneurship & Technology
CET Technical Brief Optimal Charging of Electric Vehicles
29
Figure X-2: A sample outcome of the arrival times of 10 drivers to their destinations over 10 days.
3. Smart Charging Algorithm The smart charging algorithm used in the simulations of this technical report is based on heuristic algorithmic methods for dynamic optimization under uncertainty. The optimization problem at hand can be formulated as a dynamic programming problem. Notorious for their computational complexity, most large-scale dynamic programming problems need to be attacked with efficient heuristic methods.
3.1. Algorithm for Deterministic Market Prices (E9 Tariff) In the case where the service provider is facing the E9 tariff, which is a deterministic price process, it is possible to decompose the problem per user and solve a deterministic number of optimal control problems equal to the number for users. In this case the algorithm is polynomial and actually yields the optimal solution to the optimization problem. The situation becomes considerably more complex if we add the capacity charges of the E9 tariff. The reason is that with the capacity charges we cannot decouple decision variables per user. That is, decisions made for one user have different consequences depending on the subsequent decisions that we make for other users. As a result, we cannot consider decisions on a per user basis, independently of the decisions made for other users. This results in an explosion of the computational complexity of the problem.
0
100
200
300
400
500
600 N
umbe
r of d
river
s
kWh

University of California, Berkeley Center for Entrepreneurship & Technology
CET Technical Brief Optimal Charging of Electric Vehicles
30
3.2. Algorithm for Stochastic Market Prices At this point we employ the aforementioned certainty equivalent control. Rather than solving the actual stochastic program resulting from the randomness of market prices, we replace market prices with their time average which results in a deterministic control problem. We solve this control problem in polynomial time, apply the resulting control policy and then step forward in time and iterate the process. Since we are able to decompose the problem per user we can iterate this process for each different user without worrying about the random arrival time and energy demand of other users.
3.3. Algorithm for Wind Power Coupling The problem faced by the service provider in the case of wind power supply becomes considerably more complex. Intuitively, the service provider is not able to solve the problem at hand by decomposing it to individual customers, because in the presence of the limited resource of wind power the decisions made on behalf of one driver are not independent from the decisions made for the rest of the drivers. In order to obtain a computationally tractable algorithm we make a heuristic a priori assumption. We observe the available wind power supply, allocate it equally to all drivers and forecast wind power supply to individual vehicles based on this allocation of wind power capacity. As in Case B, market price stochastic variation is accounted for by feeding the expected value of hourly market prices. Hence, we have effectively decomposed the problem to deterministic user-by-user sub-problems which are computationally tractable.
4. Wind Power Data The wind data used for the simulations are based on a wind speed model developed by the National Renewable Energy Laboratory.4 We used hourly data for six locations in California for the full duration of 2004. We used the power curve characteristics of Vestas V90 3 MW generators with a cut-in speed of 4 m/s, a cut-off speed of 25 m/s, and a speed of 15 m/s for maximal output. Generators located in the same site were assumed to have identical outputs. _____________________ 4 C. W. Potter, D. Lew, J. McCaa, S. Cheng, S. Eichelberger, and E. Grimit.“Creating the Dataset for the Western Wind and Solar Integration Study (U.S.A.).” (2008) Proc.2008 7th International Workshop on Large Scale Integration of Wind Power and on Transmission Networks for Offshore Wind Farms, pp. 288-295.

University of California, Berkeley Center for Entrepreneurship & Technology
CET Technical Brief Optimal Charging of Electric Vehicles
31
Biographies Dwight Crabtree is a first-year MBA student at the Haas School of Business, where he focuses on energy and finance. Dwight has a B.A. in Economics from Princeton University. He worked in Bangkok, Thailand, for six years developing a pipeline of clean energy investments across Southeast Asia and arranging capital financing for project implementation. At UC Berkeley he was a member of the Cleantech-to-Market cellulosic ethanol team in conjunction with the Lawrence Berkeley National Laboratory and the Joint BioEnergy Institute (JBEI). Thibault Faney is a first-year Master’s student in the department of Nuclear Engineering at UC Berkeley. Thibault has a B.S. in Engineering and a Master’s degree in Economics from the Ecole des Mines de Paris in France. He participated in many projects in different aspects of the energy industry, from consulting missions in China on the future of nuclear industry to the implementation of smart grids demonstration projects in California. Konstantinos Koudigkelis is a first-year Master’s student in the department of Industrial Engineering and Operations Research at UC Berkeley. He received a B.S. in Production Engineering and Operations Research from the Technical University of Crete, Greece. Konstantinos has also participated in the GVL’s project regarding the “Electric Vehicle Charging Infrastructure Rollout Strategy.” Anthony Papavasiliou is a third-year Ph.D. student in the department of Industrial Engineering and Operations Research at UC Berkeley. He received a B.S. in Electrical Engineering and Computer Science from the National Technical University of Athens, Greece. Anthony has interned at XEROX PARC, received two honorable mentions from the Link Foundation Energy Fellowship Program, and received three student fellowships at UC Berkeley for his work on wind power integration. He has also been a semifinalist at various entrepreneurship competitions including the UC Berkeley Business Plan Competition and the MIT 100K Clean Tech competition. Phil Kaminsky is an associate professor in the Industrial Engineering and Operations Research Department at UC Berkeley. His current research focuses on the analysis and development of robust and efficient techniques for the design and operation of logistics systems and supply chains. He is a co-author of “Designing and Managing the Supply Chain: Concepts, Strategies and Case Studies” (McGraw-Hill, 1999, 2003), which won the Book-of-the-Year Award and Outstanding IIE Publication Award in 2000, and is co-author of “Managing the Supply Chain: The Definitive Guide for the Business Professional” (McGraw-Hill, 2004). Burghardt Tenderich is the Executive Director of the Center for Entrepreneurship & Technology and a lecturer on entrepreneurship. Dr. Tenderich brings to the Center over 18 years experience in marketing and communications in the information technology and internet industries. He is a Founding Partner of TnT Initiatives, LLC, a social media publishing and consulting firm focusing on web and healthcare-related technologies. Previous positions have included General Manager, North America, for the technology communications consultancy Bite Communications, Vice President, Public Relations at Siebel Systems, and Senior Vice President & Partner in the technology PR agency

University of California, Berkeley Center for Entrepreneurship & Technology
CET Technical Brief Optimal Charging of Electric Vehicles
32
Applied Communications. Dr. Tenderich holds an M.A. and a Ph.D. in Economic Geography from the University of Bonn, Germany. Ikhlaq Sidhu is the founding director of UC Berkeley’s Center for Entrepreneurship & Technology and the 2009 Emerging Area Professor of Industrial Engineering and Operations Research at UC Berkeley. He is an authority on the process of innovation and technology management. Within industry, he has held senior executive and technology leadership positions at U.S. Robotics Corporation, 3Com Corporation, and Cambia Networks. He was awarded 3Com’s “Inventor of the Year” in 1999, and has been granted over 50 U.S. patents in fundamental and broadly-used areas of networking technology, IP telephony, and PDA functionality.

University of California, Berkeley Center for Entrepreneurship & Technology
CET Technical Brief Optimal Charging of Electric Vehicles
33
About UC Berkeley Center for Entrepreneurship & Technology The Center for Entrepreneurship & Technology (CET) seeks to foster entrepreneurship within the university and to bring Berkeley’s research capability to industry collaborations. To these ends, the CET hosts multi-disciplinary research projects in collaboration with industry stakeholders; as well as provides mentoring and support to new Berkeley ventures.
Copyright 2009–10 UC Regents
Related Documents