Research Article Optical wavelength selection for improved spectroscopic photoacoustic imaging § Geoffrey P. Luke a , Seung Yun Nam a , Stanislav Y. Emelianov a,b, * a The Department of Electrical and Computer Engineering, The University of Texas at Austin, Austin, TX 78712, United States b The Department of Biomedical Engineering, The University of Texas at Austin, Austin, TX 78712, United States 1. Introduction Photoacoustic (PA) imaging, also known as optoacoustic imaging, is a rapidly growing biomedical imaging modality [1– 5]. PA imaging offers high contrast derived from differences in optical absorption with excellent resolution at clinically relevant depths. Endogenous chromophores, such as hemoglobin, melanin, and lipids, can all be detected using PA imaging [6–8]. This shows great promise for the noninvasive clinical detection and charac- terization of atherosclerotic plaques [9,10] and certain tumors [11]. Highly absorbing contrast agents (e.g., dyes or plasmonic nanoparticles) are commonly used in conjunction with PA imaging [12–16]. These contrast agents are often molecularly targeted to observe a specific cellular expression or interaction, allowing for further characterization of the disease [15,17]. The optical absorption spectra of the tissue components and contrast agents vary greatly with optical wavelength. Therefore, spectroscopic methods can be used to unmix the signals from different optical absorbers in a photoacoustic image and provide an estimate of their concentrations [8,13,18]. This technique is known as spectroscopic PA (sPA) imaging. sPA imaging allows for accurate measurement of blood oxygenation saturation (SO 2 ) or nanoparti- cle deposition in tissue [19,20]. A number of methods have been proposed to spectrally unmix absorbers in PA images. One simple spectroscopic method uses a ratio of the PA signals acquired at two optical wavelengths. This ratio is then used to estimate either SO 2 or the state of an activatable contrast agent [21,22]. The main drawback of using a ratio is that at most two absorbers can be distinguished, limiting the potential applications. Intraclass correlation (ICC) has been used to simultaneously identify multiple absorbers. ICC correlates the measured PA spectrum at each pixel to the known absorption spectra of the anticipated absorbers and assigns each pixel to one (and only one) absorber [13]. This method can identify multiple chromophores, but the assumption that each pixel only contains one absorber is not always valid – particularly in the case of blood, where the spectrum is a linear combination of deoxygenated and oxygenated hemoglobin, depending on the level of SO 2 . An alternative approach, which treats each pixel as a linear combination of absorbers, provides a more realistic model [20]. Thus, each pixel can contain multiple absorbers and the relative contribu- tion of each absorber to the overall spectrum can be estimated. A linear model is then used to calculate the absorber concentrations in each pixel while minimzing the mean squared error. Photoacoustics 1 (2013) 36–42 A R T I C L E I N F O Article history: Received 19 May 2013 Received in revised form 23 July 2013 Accepted 1 August 2013 Keywords: Spectroscopic photoacoustic imaging Feature selection Spectral unmixing Spectroscopy A B S T R A C T Spectroscopic photoacoustic imaging has the potential to become a powerful tool that can estimate distributions of optically absorbing chromophores in the body. We have developed an algorithm to select imaging wavelengths for spectroscopic photoacoustics given the spectra of expected chromophores. The algorithm uses the smallest singular value of a matrix constructed from the absorption spectra as a criterion to remove extraneous wavelengths. The method performed significantly better than an approach where evenly spaced wavelengths were used in the presence of noise and wavelength- dependent attenuation of light in tissue. Finally, the algorithm was applied to photoacoustic imaging of a phantom containing indocyanine green dye and silica-coated gold nanorods, demonstrating significant improvements in the ability to estimate relative contrast agent concentrations compared to the case where evenly spaced wavelengths were chosen. In summary, our work provides a versatile framework to select optical wavelengths and evaluate sets of absorbers for spectroscopic photoacoustic imaging. ß 2013 The Authors. Published by Elsevier GmbH. All rights reserved. § This is an open-access article distributed under the terms of the Creative Commons Attribution-NonCommercial-ShareAlike License, which permits non- commercial use, distribution, and reproduction in any medium, provided the original author and source are credited. * Corresponding author at: Department of Biomedical Engineering, The University of Texas at Austin, 107 W. Dean Keeton, stop C0800, Austin, TX 78712, United States. E-mail addresses: geoffl[email protected] (G.P. Luke), [email protected] (S.Y. Emelianov). Contents lists available at ScienceDirect Photoacoustics jo ur n al ho m epag e: ww w.els evier .c om /lo cat e/pac s 2213-5979/$ – see front matter ß 2013 The Authors. Published by Elsevier GmbH. All rights reserved. http://dx.doi.org/10.1016/j.pacs.2013.08.001

Welcome message from author
This document is posted to help you gain knowledge. Please leave a comment to let me know what you think about it! Share it to your friends and learn new things together.
Transcript
Photoacoustics 1 (2013) 36–42
Research Article
Optical wavelength selection for improved spectroscopicphotoacoustic imaging§
Geoffrey P. Luke a, Seung Yun Nam a, Stanislav Y. Emelianov a,b,*a The Department of Electrical and Computer Engineering, The University of Texas at Austin, Austin, TX 78712, United Statesb The Department of Biomedical Engineering, The University of Texas at Austin, Austin, TX 78712, United States
A R T I C L E I N F O
Article history:
Received 19 May 2013
Received in revised form 23 July 2013
Accepted 1 August 2013
Keywords:
Spectroscopic photoacoustic imaging
Feature selection
Spectral unmixing
Spectroscopy
A B S T R A C T
Spectroscopic photoacoustic imaging has the potential to become a powerful tool that can estimate
distributions of optically absorbing chromophores in the body. We have developed an algorithm to select
imaging wavelengths for spectroscopic photoacoustics given the spectra of expected chromophores. The
algorithm uses the smallest singular value of a matrix constructed from the absorption spectra as a
criterion to remove extraneous wavelengths. The method performed significantly better than an
approach where evenly spaced wavelengths were used in the presence of noise and wavelength-
dependent attenuation of light in tissue. Finally, the algorithm was applied to photoacoustic imaging of a
phantom containing indocyanine green dye and silica-coated gold nanorods, demonstrating significant
improvements in the ability to estimate relative contrast agent concentrations compared to the case
where evenly spaced wavelengths were chosen. In summary, our work provides a versatile framework to
select optical wavelengths and evaluate sets of absorbers for spectroscopic photoacoustic imaging.
� 2013 The Authors. Published by Elsevier GmbH. All rights reserved.
Contents lists available at ScienceDirect
Photoacoustics
jo ur n al ho m epag e: ww w.els evier . c om / lo cat e/pac s
1. Introduction
Photoacoustic (PA) imaging, also known as optoacousticimaging, is a rapidly growing biomedical imaging modality [1–5]. PA imaging offers high contrast derived from differences inoptical absorption with excellent resolution at clinically relevantdepths. Endogenous chromophores, such as hemoglobin, melanin,and lipids, can all be detected using PA imaging [6–8]. This showsgreat promise for the noninvasive clinical detection and charac-terization of atherosclerotic plaques [9,10] and certain tumors[11]. Highly absorbing contrast agents (e.g., dyes or plasmonicnanoparticles) are commonly used in conjunction with PA imaging[12–16]. These contrast agents are often molecularly targeted toobserve a specific cellular expression or interaction, allowing forfurther characterization of the disease [15,17].
The optical absorption spectra of the tissue components andcontrast agents vary greatly with optical wavelength. Therefore,
§ This is an open-access article distributed under the terms of the Creative
Commons Attribution-NonCommercial-ShareAlike License, which permits non-
commercial use, distribution, and reproduction in any medium, provided the
original author and source are credited.
* Corresponding author at: Department of Biomedical Engineering, The
University of Texas at Austin, 107 W. Dean Keeton, stop C0800, Austin, TX
78712, United States.
E-mail addresses: [email protected] (G.P. Luke), [email protected]
(S.Y. Emelianov).
2213-5979/$ – see front matter � 2013 The Authors. Published by Elsevier GmbH. All
http://dx.doi.org/10.1016/j.pacs.2013.08.001
spectroscopic methods can be used to unmix the signals fromdifferent optical absorbers in a photoacoustic image and provide anestimate of their concentrations [8,13,18]. This technique is knownas spectroscopic PA (sPA) imaging. sPA imaging allows for accuratemeasurement of blood oxygenation saturation (SO2) or nanoparti-cle deposition in tissue [19,20].
A number of methods have been proposed to spectrally unmixabsorbers in PA images. One simple spectroscopic method uses aratio of the PA signals acquired at two optical wavelengths. Thisratio is then used to estimate either SO2 or the state of anactivatable contrast agent [21,22]. The main drawback of using aratio is that at most two absorbers can be distinguished, limitingthe potential applications. Intraclass correlation (ICC) has beenused to simultaneously identify multiple absorbers. ICC correlatesthe measured PA spectrum at each pixel to the known absorptionspectra of the anticipated absorbers and assigns each pixel to one(and only one) absorber [13]. This method can identify multiplechromophores, but the assumption that each pixel only containsone absorber is not always valid – particularly in the case of blood,where the spectrum is a linear combination of deoxygenated andoxygenated hemoglobin, depending on the level of SO2.
An alternative approach, which treats each pixel as a linearcombination of absorbers, provides a more realistic model [20]. Thus,each pixel can contain multiple absorbers and the relative contribu-tion of each absorber to the overall spectrum can be estimated. Alinear model is then used to calculate the absorber concentrations ineach pixel while minimzing the mean squared error.
rights reserved.

G.P. Luke et al. / Photoacoustics 1 (2013) 36–42 37
In each aforementioned method, the choice of optical wave-lengths is critically important. The unique spectral features of eachabsorber must be captured by a discrete set of wavelengths.Ideally, a large number of wavelengths spanning a broad spectrumshould be used. In practice, the number of wavelengths that can beused is limited by a number of factors, including the linewidth ofthe laser, the spectral range of the laser, the spectral-dependentattenuation of light in tissue, and the pulse repetition rate of thelaser. In PA imaging, the temporal resolution is primarily limited bythe pulse repetition rate of the laser, typically 10–20 Hz for a highenergy tunable laser system. Each imaging wavelength furtherdecreases the temporal resolution, thereby increasing the overallimaging time and the likelihood of introducing motion artifacts,which can be detrimental to spectral unmixing. Thus, wavelengthselection can be used to improve the temporal resolution whilemaintaining acceptable levels of uncertainty in the estimatedchromophore concentrations. Heretofore, the optical wavelengthsused in sPA imaging have typically been chosen heuristically. Herewe present a method to select optical wavelengths such that theconcentration estimation remains robust in the presence of noise.
2. Theory
Assuming the stress and thermal confinements are met (i.e., thelaser pulse length is short enough that the local pressure andtemperature rise are constrained to a small volume), the peakpressure, P, generated by the PA effect depends on the Gruneisenparameter of the tissue, G, the laser fluence at the absorber, F, andthe optical absorption coefficient of the absorber, ma [23]:
P ¼ G Fma (1)
In practice, the pressure detected by an ultrasound transducerhas been attenuated as the pressure wave travels through thetissue toward the transducer. Accurate reconstruction of P is nottrivial and depends on the geometry and point spread function ofthe transducer [24]. In this paper, to simplify the problem andfocus on spectral unmixing, we assume that P has been accuratelyreconstructed.
Additional factors also complicate Eq. (1). In practice, F can varygreatly depending on optical properties of tissue and opticalwavelength, l. Furthermore, ma is a function of l and each of N
distinct absorbers in the region of interest will contribute to theoverall absorption. Thus, Eq. (1) becomes:
PðlÞ ¼ G FðlÞðma1ðlÞ þ ma2
ðlÞ þ � � � þ maNðlÞÞ: (2)
The optical absorption can be related to the concentration of anabsorber and the absorption cross section as follows:
maiðlÞ ¼ C½i�eai
ðlÞ; (3)
where C[i] is the concentration of the ith absorber and eaiðlÞ is the
molar absorption cross section of the ith absorber at wavelength l.Eq. (2) is then expanded to:
PðlÞ ¼ G FðlÞðC½1�ea1ðlÞ þ C½2�ea2
ðlÞ þ � � � þ C½N�eaNðlÞÞ: (4)
The Gruneisen parameter is tissue-dependent and has littlevariation in water-based tissues at constant temperature. There-fore, it is often assumed to be constant. If the fluence at theabsorber is known, then the optical absorption coefficient vector,mest(l), can be estimated:
mestðlÞ ¼ PðlÞG FðlÞ : (5)
Then Eq. (4) can be simplified to a set of linear equations:
mest ¼ eC; (6)
where mest is a vector whose components correspond to thereconstructed absorption coefficient at each individual opticalwavelength, e is the absorption cross-section matrix whose rowscorrespond to optical wavelengths and columns are the normal-ized absorption cross section spectra of the optical absorbers (i.e.,eij ¼ ea j
ðliÞÞ, and C is a vector whose elements correspond to therelative concentration of each optical absorber.
In order to solve Eq. (6) for the absorber concentrations, thenumber of optical wavelengths used to acquire images, M, must begreater than or equal to the number of absorbers, N. In the presenceof noise, it is useful to have M > N, thus making Eq. (6) over-constrained. In this case, a least squared error estimate of C can befound:
C � eþmest; (7)
where e+ is the Moore-Penrose pseudoinverse of e, defined as [25]:
eþ ¼ ðeTeÞ�1eT: (8)
This estimate of the concentrations has been used tosimultaneously measure SO2 and the concentration of a dye ornanoparticles in vivo [19,20]. Further modifications can be made toEq. (7) to ensure the sum of the concentrations is 1 and negativeconcentrations (an artifact related to finite signal-to-noise ratio ofthe images or the presence of an absorber not included inabsorption cross-section matrix) are avoided [20,26].
3. Materials and methods
3.1. Wavelength selection algorithm
The goal of the wavelength selection algorithm was to select aset of optical wavelengths in such a way as to increase the accuracyof existing spectral unmixing algorithms. This set of imagingwavelengths was chosen from a larger set of wavelengths forwhich accurate values of ma(l) for each of the absorbers in theimaging volume were found from literature or were measured(e.g., via spectrophotometry). Extraneous wavelengths wererecursively discarded such that the salient features of eachabsorber’s spectrum were maintained.
First, the molar absorption matrix, e, was populated with theabsorption spectra with N columns corresponding to individualabsorbers and M rows corresponding to the optical wavelengths.Only absorbers that are present in the imaging volume andgenerate detectable PA signal in the spectral range should beincluded in e. The number of rows is limited by a number of factors,including the spectral range of the laser and spectral resolution ofthe absorption spectra data. It was assumed that the rank(e) = N.That is, the concentrations of all N absorbers can be perfectlyreconstructed from the M wavelengths in the absence of noise.
The smallest singular value of e, smin, was used as an indicationof its stability. As smin! 0, e becomes unstable and may lose rankin the presence of noise. In other words, the spectrum of oneabsorber can be approximated by a linear combination of the otherabsorbers. Thus, multiple combinations of absorber concentrationscan represent a single PA spectrum.
Each row was iteratively removed from e and smin wascalculated for the truncated matrix. The row whose removalresulted in the largest smin was taken to correspond to the least-critical wavelength and was excluded. This process was recursivelyrepeated until the desired number of wavelengths was reached. Inpractice, the number of wavelengths will depend on the temporalresolution required, the noise level of the imaging system, and thedesired level of accuracy in concentration estimations. Theimplementation of the algorithm is outlined below:
G.P. Luke et al. / Photoacoustics 1 (2013) 36–4238
1. Construct e from N absorbers and M wavelengths2. Remove the first row of e and calculate smin of the truncated
matrix3. Repeat step 2 M times for each row of e4. Let e equal the truncated matrix with the largest smin; let M
equal M � 15. Repeat steps 2–4 until M is the desired number of wavelengths
or smin reaches the minimum desired level
3.2. Algorithm evaluation
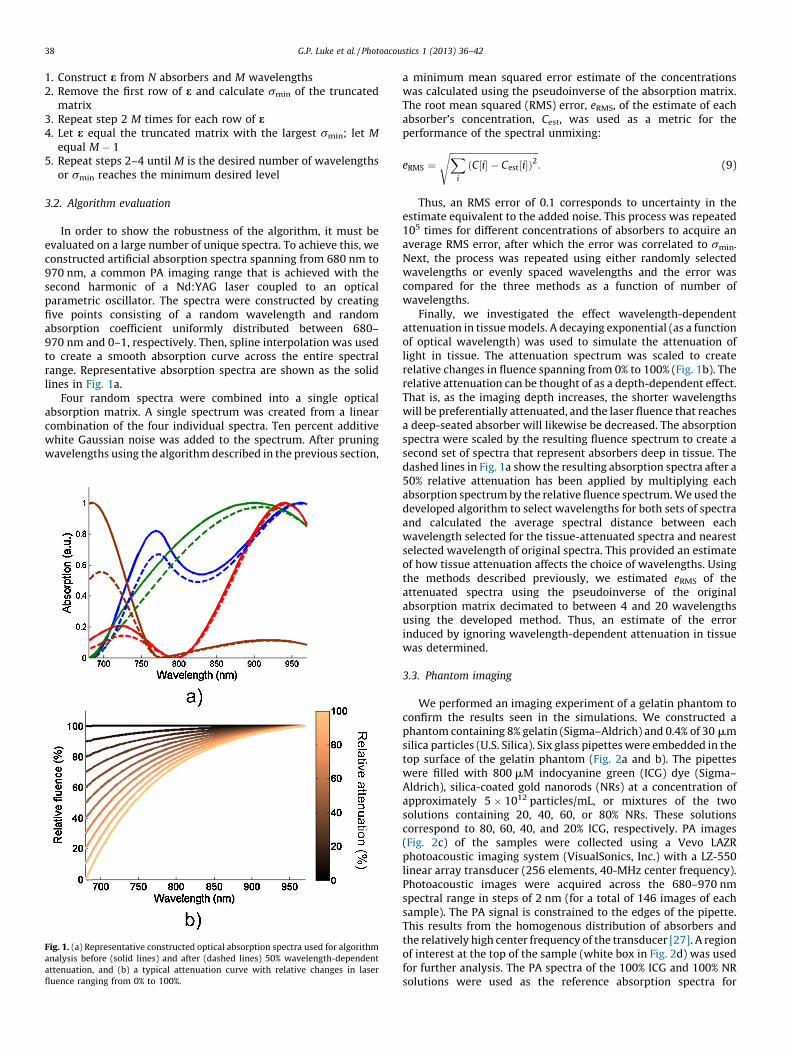
In order to show the robustness of the algorithm, it must beevaluated on a large number of unique spectra. To achieve this, weconstructed artificial absorption spectra spanning from 680 nm to970 nm, a common PA imaging range that is achieved with thesecond harmonic of a Nd:YAG laser coupled to an opticalparametric oscillator. The spectra were constructed by creatingfive points consisting of a random wavelength and randomabsorption coefficient uniformly distributed between 680–970 nm and 0–1, respectively. Then, spline interpolation was usedto create a smooth absorption curve across the entire spectralrange. Representative absorption spectra are shown as the solidlines in Fig. 1a.
Four random spectra were combined into a single opticalabsorption matrix. A single spectrum was created from a linearcombination of the four individual spectra. Ten percent additivewhite Gaussian noise was added to the spectrum. After pruningwavelengths using the algorithm described in the previous section,
Fig. 1. (a) Representative constructed optical absorption spectra used for algorithm
analysis before (solid lines) and after (dashed lines) 50% wavelength-dependent
attenuation, and (b) a typical attenuation curve with relative changes in laser
fluence ranging from 0% to 100%.
a minimum mean squared error estimate of the concentrationswas calculated using the pseudoinverse of the absorption matrix.The root mean squared (RMS) error, eRMS, of the estimate of eachabsorber’s concentration, Cest, was used as a metric for theperformance of the spectral unmixing:
eRMS ¼ffiffiffiffiffiffiffiffiffiffiffiffiffiffiffiffiffiffiffiffiffiffiffiffiffiffiffiffiffiffiffiffiffiffiffiffiffiffiffiX
i
ðC½i� � Cest½i�Þ2s
: (9)
Thus, an RMS error of 0.1 corresponds to uncertainty in theestimate equivalent to the added noise. This process was repeated105 times for different concentrations of absorbers to acquire anaverage RMS error, after which the error was correlated to smin.Next, the process was repeated using either randomly selectedwavelengths or evenly spaced wavelengths and the error wascompared for the three methods as a function of number ofwavelengths.
Finally, we investigated the effect wavelength-dependentattenuation in tissue models. A decaying exponential (as a functionof optical wavelength) was used to simulate the attenuation oflight in tissue. The attenuation spectrum was scaled to createrelative changes in fluence spanning from 0% to 100% (Fig. 1b). Therelative attenuation can be thought of as a depth-dependent effect.That is, as the imaging depth increases, the shorter wavelengthswill be preferentially attenuated, and the laser fluence that reachesa deep-seated absorber will likewise be decreased. The absorptionspectra were scaled by the resulting fluence spectrum to create asecond set of spectra that represent absorbers deep in tissue. Thedashed lines in Fig. 1a show the resulting absorption spectra after a50% relative attenuation has been applied by multiplying eachabsorption spectrum by the relative fluence spectrum. We used thedeveloped algorithm to select wavelengths for both sets of spectraand calculated the average spectral distance between eachwavelength selected for the tissue-attenuated spectra and nearestselected wavelength of original spectra. This provided an estimateof how tissue attenuation affects the choice of wavelengths. Usingthe methods described previously, we estimated eRMS of theattenuated spectra using the pseudoinverse of the originalabsorption matrix decimated to between 4 and 20 wavelengthsusing the developed method. Thus, an estimate of the errorinduced by ignoring wavelength-dependent attenuation in tissuewas determined.
3.3. Phantom imaging
We performed an imaging experiment of a gelatin phantom toconfirm the results seen in the simulations. We constructed aphantom containing 8% gelatin (Sigma–Aldrich) and 0.4% of 30 mmsilica particles (U.S. Silica). Six glass pipettes were embedded in thetop surface of the gelatin phantom (Fig. 2a and b). The pipetteswere filled with 800 mM indocyanine green (ICG) dye (Sigma–Aldrich), silica-coated gold nanorods (NRs) at a concentration ofapproximately 5 � 1012 particles/mL, or mixtures of the twosolutions containing 20, 40, 60, or 80% NRs. These solutionscorrespond to 80, 60, 40, and 20% ICG, respectively. PA images(Fig. 2c) of the samples were collected using a Vevo LAZRphotoacoustic imaging system (VisualSonics, Inc.) with a LZ-550linear array transducer (256 elements, 40-MHz center frequency).Photoacoustic images were acquired across the 680–970 nmspectral range in steps of 2 nm (for a total of 146 images of eachsample). The PA signal is constrained to the edges of the pipette.This results from the homogenous distribution of absorbers andthe relatively high center frequency of the transducer [27]. A regionof interest at the top of the sample (white box in Fig. 2d) was usedfor further analysis. The PA spectra of the 100% ICG and 100% NRsolutions were used as the reference absorption spectra for

Fig. 2. (a and b) Photographs showing the imaging phantom consisting of pipettes containing ICG dye and silica-coated gold nanorods embedded in a gelatin phantom, (c) a
representative PA image acquired at 880 nm, (d) the same image as in (c) with the location of the pipette (dashed circle) and the region of interest used for further analysis
(white box) indicated, (e) the PA spectra of ICG and silica-coated gold nanorods which were used for spectral unmixing in this experiment, (f) PA images of the region of
interest of each pipette acquired with an excitation wavelength of 880 nm, and (g) the spectrally unmixed sPA images of the same region of interest using PA images from all
146 optical wavelengths. Scale bars are 1 mm.
G.P. Luke et al. / Photoacoustics 1 (2013) 36–42 39
wavelength selection and served as controls for spectral unmixing(Fig. 2e). The ICG spectrum indicates that it has assumed itsaggregated state [28]. The PA images of the region of interest ofeach sample (Fig. 2f) were used to estimate the relativeconcentrations of ICG and NRs (Fig. 2g). Following imaging, a 3-mm optical and ultrasound attenuation layer containing 8%gelatin, 0.4% silica, and 40 mM ICG was placed above the samplesand imaging was repeated. The ICG served as an optical absorberand the silica acted as an acoustic and optical scatterer.
4. Results and discussion
The median error in reconstructed concentrations proved to beinversely proportional to smin across a broad range of wavelengthsand optical spectra (Fig. 3a; R2 = 0.96). For large smin, the spectracan be unmixed with high accuracy. However, as smin approaches0, e becomes unstable and the RMS error in the reconstructedconcentrations becomes much greater than the magnitude of theadded noise. Thus, smin provides a good criterion for selecting asubset of wavelengths for sPA imaging. Furthermore, because theinverse relationship is linear, smin can be used to predict the levelof precision with which absorber concentrations can be estimated.Therefore, the imaging wavelengths and contrast agent(s) can besimultaneously optimized for a given application.
The developed algorithm was compared to two other methodsof wavelength selection: (1) choosing wavelengths randomly and
(2) choosing wavelengths that are evenly spaced throughout theoptical range (Fig. 3b). The algorithm consistently yielded betterresults than the other two wavelength selection methods. In fact,only half of the wavelengths are needed to reach the input noiselevel than in the case where evenly spaced wavelengths are used.This improved performance is due to the algorithm’s tendency topreserve the salient spectral characteristics of the absorbers whileextraneous wavelengths are discarded.
In deriving Eq. (6), we made four important assumptions: (1)the magnitude of the initial photoacoustic pressure is accuratelyreconstructed in each pixel, (2) the Gruneisen parameter isconstant throughout the image, (3) the photoacoustic signalgeneration is linear, and (4) the fluence has been accuratelyestimated in each pixel. Neither the accuracy of the pressurereconstruction nor the Gruneisen parameter depends on theexcitation wavelength. Therefore, errors resulting from the firsttwo assumptions will only affect the magnitude of mest ; therelative absorber concentration estimates will remain unchanged.Nonlinear photoacoustic signal generation (e.g., arising from highlaser fluence or aggregated nanoparticles) could lead to a distortedmest, but these nonlinear effects are not significant in most imagingapplications [29–31].
Because the fluence is wavelength-dependent, errors from thefourth assumption will result in spectral changes of mest.Estimating the laser fluence that reaches the absorber is a complexproblem and depends on the distribution of all absorbers and
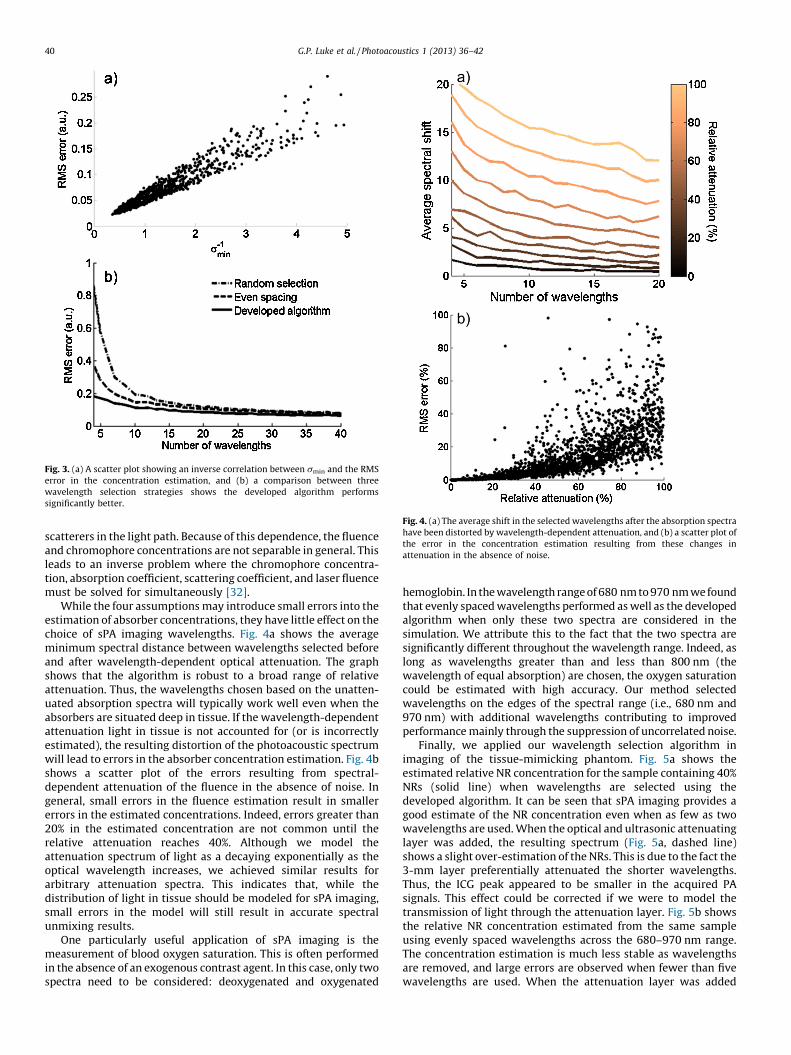
Fig. 3. (a) A scatter plot showing an inverse correlation between smin and the RMS
error in the concentration estimation, and (b) a comparison between three
wavelength selection strategies shows the developed algorithm performs
significantly better.
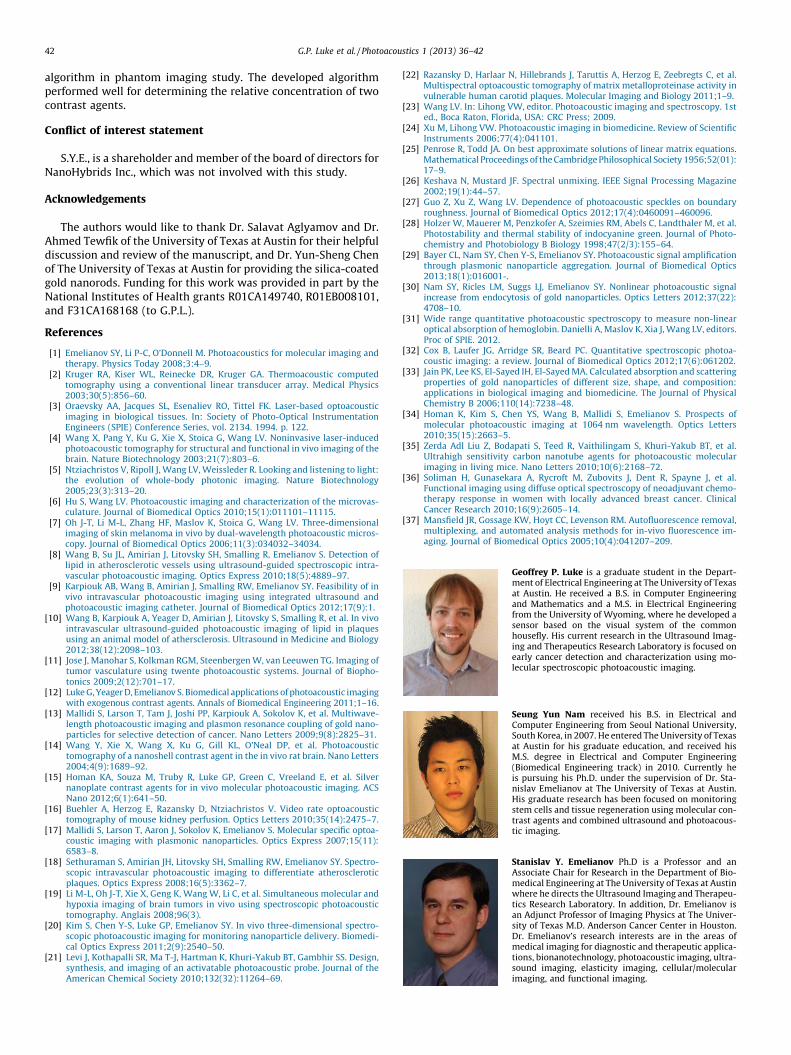
Fig. 4. (a) The average shift in the selected wavelengths after the absorption spectra
have been distorted by wavelength-dependent attenuation, and (b) a scatter plot of
the error in the concentration estimation resulting from these changes in
attenuation in the absence of noise.
G.P. Luke et al. / Photoacoustics 1 (2013) 36–4240
scatterers in the light path. Because of this dependence, the fluenceand chromophore concentrations are not separable in general. Thisleads to an inverse problem where the chromophore concentra-tion, absorption coefficient, scattering coefficient, and laser fluencemust be solved for simultaneously [32].
While the four assumptions may introduce small errors into theestimation of absorber concentrations, they have little effect on thechoice of sPA imaging wavelengths. Fig. 4a shows the averageminimum spectral distance between wavelengths selected beforeand after wavelength-dependent optical attenuation. The graphshows that the algorithm is robust to a broad range of relativeattenuation. Thus, the wavelengths chosen based on the unatten-uated absorption spectra will typically work well even when theabsorbers are situated deep in tissue. If the wavelength-dependentattenuation light in tissue is not accounted for (or is incorrectlyestimated), the resulting distortion of the photoacoustic spectrumwill lead to errors in the absorber concentration estimation. Fig. 4bshows a scatter plot of the errors resulting from spectral-dependent attenuation of the fluence in the absence of noise. Ingeneral, small errors in the fluence estimation result in smallererrors in the estimated concentrations. Indeed, errors greater than20% in the estimated concentration are not common until therelative attenuation reaches 40%. Although we model theattenuation spectrum of light as a decaying exponentially as theoptical wavelength increases, we achieved similar results forarbitrary attenuation spectra. This indicates that, while thedistribution of light in tissue should be modeled for sPA imaging,small errors in the model will still result in accurate spectralunmixing results.
One particularly useful application of sPA imaging is themeasurement of blood oxygen saturation. This is often performedin the absence of an exogenous contrast agent. In this case, only twospectra need to be considered: deoxygenated and oxygenated
hemoglobin. In the wavelength range of 680 nm to 970 nm we foundthat evenly spaced wavelengths performed as well as the developedalgorithm when only these two spectra are considered in thesimulation. We attribute this to the fact that the two spectra aresignificantly different throughout the wavelength range. Indeed, aslong as wavelengths greater than and less than 800 nm (thewavelength of equal absorption) are chosen, the oxygen saturationcould be estimated with high accuracy. Our method selectedwavelengths on the edges of the spectral range (i.e., 680 nm and970 nm) with additional wavelengths contributing to improvedperformance mainly through the suppression of uncorrelated noise.
Finally, we applied our wavelength selection algorithm inimaging of the tissue-mimicking phantom. Fig. 5a shows theestimated relative NR concentration for the sample containing 40%NRs (solid line) when wavelengths are selected using thedeveloped algorithm. It can be seen that sPA imaging provides agood estimate of the NR concentration even when as few as twowavelengths are used. When the optical and ultrasonic attenuatinglayer was added, the resulting spectrum (Fig. 5a, dashed line)shows a slight over-estimation of the NRs. This is due to the fact the3-mm layer preferentially attenuated the shorter wavelengths.Thus, the ICG peak appeared to be smaller in the acquired PAsignals. This effect could be corrected if we were to model thetransmission of light through the attenuation layer. Fig. 5b showsthe relative NR concentration estimated from the same sampleusing evenly spaced wavelengths across the 680–970 nm range.The concentration estimation is much less stable as wavelengthsare removed, and large errors are observed when fewer than fivewavelengths are used. When the attenuation layer was added

Fig. 5. (a) The relative concentrations of ICG and silica-coated gold nanorods can be
accurately estimated from PA images acquired at wavelengths selected by the
developed algorithm even when as few as 2 wavelengths are used (solid line).
Adding a 3-mm layer of attenuating gelatin leads to a slight over-estimation of the
nanorods concentration (dashed line). (b) When evenly-spaced wavelengths are
used, the concentration estimate becomes unstable when a small number of
wavelengths are used (solid line), and this effect becomes more pronounced when
G.P. Luke et al. / Photoacoustics 1 (2013) 36–42 41
(dashed line), a similar overestimation of the NR concentration isseen as in Fig. 5a. In addition, the concentration estimation errorsare greatly accentuated. Fig. 5c shows a comparison of theestimated relative NR concentration for each of the samples (in theabsence of the attenuation layer) when using evenly spacedwavelengths (black lines) and when using wavelengths selectedusing the developed algorithm (blue lines). The top and bottomlines represent controls because the PA spectra acquired fromthese samples were used for spectral unmixing. These resultsindicate that by carefully selecting imaging wavelengths, signifi-cant improvements in sPA imaging can be achieved.
The benefits of spectral unmixing and the developed algorithmdepend on several factors. The contrast agent(s) must be selectedto have desirable spectral characteristics. Contrast agents withdistinct spectral features (e.g., a sharp peak or multiple peaks) areideal. In general, dyes tend to have a narrower absorption peakthan plasmonic nanoparticles (owing mainly to the polydispersitywhich results from commonly-used wet chemistry synthesismethods). Nanoparticles, however, can exhibit a much higheroptical absorption than dyes [33]. Light penetration in tissue is alsoan important factor when choosing contrast agents. Deeperpenetration in tissue at longer wavelengths (near 1064 nm),results in an increased signal-to-noise ratio [34]. Of course, whenin vivo imaging is performed, there are many more importantcharacteristics in determining an appropriate contrast agent. Theseinclude toxicity, clearance, circulation time, delivery and molecu-lar specificity. Therefore, choosing one of the myriad PA contrastagents should be deliberate and will depend on the application.
Spectroscopic photoacoustic imaging can be augmented withother methods to help localize contrast agents and estimate theirconcentrations. One method that can be used is collecting abaseline image before administering the contrast agent. This imagecan be subtracted from a second image collected after the contrastagent has been injected [35]. If it is assumed that the concentrationof endogenous absorbers does not change, then the resulting imagecontains only the signal from the contrast agent. After effectivelyremoving the endogenous absorbers from the image, the sPAunmixing algorithms can focus on resolving the exogenouscontrast agents. Thus, fewer wavelengths can be used and greateraccuracy in concentration estimation can be achieved. The maindrawback of this method is that it requires two imaging sessionsand, furthermore, exact co-registration between the two images, afeat that is often difficult to achieve in vivo.
Our method is not limited to sPA imaging. Indeed, it can beapplied to a wide variety of spectroscopic imaging applications tosimultaneously improve accuracy and decrease acquisition time.For example, the work could be extended to identify light sourcesfor diffuse optical spectroscopic imaging [36]. It may also bepossible to modify the algorithm to optimize multiplex fluorescentimaging [37].
5. Conclusion
We have developed an algorithm to choose optical wavelengthsfor spectroscopic photoacoustic imaging based on the spectralcharacteristics of the absorbers known to be in the region. We havedemonstrated that significantly improved results can be achievedby simply selecting a better set of wavelengths. Furthermore, thecriterion for wavelength selection – smin – provides a useful metricto predict (and optimize) the ability to spectrally unmix a specificset of absorbers. Finally we showed the application of the
the attenuating layer is added (dashed line). (c) The developed algorithm (blue
lines) produces much more reliable estimates of concentration than even spacing
(black lines) in all inclusions. The 0% and 100% lines act as controls since the
absorption spectra were derived from these signals.
G.P. Luke et al. / Photoacoustics 1 (2013) 36–4242
algorithm in phantom imaging study. The developed algorithmperformed well for determining the relative concentration of twocontrast agents.
Conflict of interest statement
S.Y.E., is a shareholder and member of the board of directors forNanoHybrids Inc., which was not involved with this study.
Acknowledgements
The authors would like to thank Dr. Salavat Aglyamov and Dr.Ahmed Tewfik of the University of Texas at Austin for their helpfuldiscussion and review of the manuscript, and Dr. Yun-Sheng Chenof The University of Texas at Austin for providing the silica-coatedgold nanorods. Funding for this work was provided in part by theNational Institutes of Health grants R01CA149740, R01EB008101,and F31CA168168 (to G.P.L.).
References
[1] Emelianov SY, Li P-C, O’Donnell M. Photoacoustics for molecular imaging andtherapy. Physics Today 2008;3:4–9.
[2] Kruger RA, Kiser WL, Reinecke DR, Kruger GA. Thermoacoustic computedtomography using a conventional linear transducer array. Medical Physics2003;30(5):856–60.
[3] Oraevsky AA, Jacques SL, Esenaliev RO, Tittel FK. Laser-based optoacousticimaging in biological tissues. In: Society of Photo-Optical InstrumentationEngineers (SPIE) Conference Series, vol. 2134. 1994. p. 122.
[4] Wang X, Pang Y, Ku G, Xie X, Stoica G, Wang LV. Noninvasive laser-inducedphotoacoustic tomography for structural and functional in vivo imaging of thebrain. Nature Biotechnology 2003;21(7):803–6.
[5] Ntziachristos V, Ripoll J, Wang LV, Weissleder R. Looking and listening to light:the evolution of whole-body photonic imaging. Nature Biotechnology2005;23(3):313–20.
[6] Hu S, Wang LV. Photoacoustic imaging and characterization of the microvas-culature. Journal of Biomedical Optics 2010;15(1):011101–11115.
[7] Oh J-T, Li M-L, Zhang HF, Maslov K, Stoica G, Wang LV. Three-dimensionalimaging of skin melanoma in vivo by dual-wavelength photoacoustic micros-copy. Journal of Biomedical Optics 2006;11(3):034032–34034.
[8] Wang B, Su JL, Amirian J, Litovsky SH, Smalling R, Emelianov S. Detection oflipid in atherosclerotic vessels using ultrasound-guided spectroscopic intra-vascular photoacoustic imaging. Optics Express 2010;18(5):4889–97.
[9] Karpiouk AB, Wang B, Amirian J, Smalling RW, Emelianov SY. Feasibility of invivo intravascular photoacoustic imaging using integrated ultrasound andphotoacoustic imaging catheter. Journal of Biomedical Optics 2012;17(9):1.
[10] Wang B, Karpiouk A, Yeager D, Amirian J, Litovsky S, Smalling R, et al. In vivointravascular ultrasound-guided photoacoustic imaging of lipid in plaquesusing an animal model of athersclerosis. Ultrasound in Medicine and Biology2012;38(12):2098–103.
[11] Jose J, Manohar S, Kolkman RGM, Steenbergen W, van Leeuwen TG. Imaging oftumor vasculature using twente photoacoustic systems. Journal of Biopho-tonics 2009;2(12):701–17.
[12] Luke G, Yeager D, Emelianov S. Biomedical applications of photoacoustic imagingwith exogenous contrast agents. Annals of Biomedical Engineering 2011;1–16.
[13] Mallidi S, Larson T, Tam J, Joshi PP, Karpiouk A, Sokolov K, et al. Multiwave-length photoacoustic imaging and plasmon resonance coupling of gold nano-particles for selective detection of cancer. Nano Letters 2009;9(8):2825–31.
[14] Wang Y, Xie X, Wang X, Ku G, Gill KL, O’Neal DP, et al. Photoacoustictomography of a nanoshell contrast agent in the in vivo rat brain. Nano Letters2004;4(9):1689–92.
[15] Homan KA, Souza M, Truby R, Luke GP, Green C, Vreeland E, et al. Silvernanoplate contrast agents for in vivo molecular photoacoustic imaging. ACSNano 2012;6(1):641–50.
[16] Buehler A, Herzog E, Razansky D, Ntziachristos V. Video rate optoacoustictomography of mouse kidney perfusion. Optics Letters 2010;35(14):2475–7.
[17] Mallidi S, Larson T, Aaron J, Sokolov K, Emelianov S. Molecular specific optoa-coustic imaging with plasmonic nanoparticles. Optics Express 2007;15(11):6583–8.
[18] Sethuraman S, Amirian JH, Litovsky SH, Smalling RW, Emelianov SY. Spectro-scopic intravascular photoacoustic imaging to differentiate atheroscleroticplaques. Optics Express 2008;16(5):3362–7.
[19] Li M-L, Oh J-T, Xie X, Geng K, Wang W, Li C, et al. Simultaneous molecular andhypoxia imaging of brain tumors in vivo using spectroscopic photoacoustictomography. Anglais 2008;96(3).
[20] Kim S, Chen Y-S, Luke GP, Emelianov SY. In vivo three-dimensional spectro-scopic photoacoustic imaging for monitoring nanoparticle delivery. Biomedi-cal Optics Express 2011;2(9):2540–50.
[21] Levi J, Kothapalli SR, Ma T-J, Hartman K, Khuri-Yakub BT, Gambhir SS. Design,synthesis, and imaging of an activatable photoacoustic probe. Journal of theAmerican Chemical Society 2010;132(32):11264–69.
[22] Razansky D, Harlaar N, Hillebrands J, Taruttis A, Herzog E, Zeebregts C, et al.Multispectral optoacoustic tomography of matrix metalloproteinase activity invulnerable human carotid plaques. Molecular Imaging and Biology 2011;1–9.
[23] Wang LV. In: Lihong VW, editor. Photoacoustic imaging and spectroscopy. 1sted., Boca Raton, Florida, USA: CRC Press; 2009.
[24] Xu M, Lihong VW. Photoacoustic imaging in biomedicine. Review of ScientificInstruments 2006;77(4):041101.
[25] Penrose R, Todd JA. On best approximate solutions of linear matrix equations.Mathematical Proceedings of the Cambridge Philosophical Society 1956;52(01):17–9.
[26] Keshava N, Mustard JF. Spectral unmixing. IEEE Signal Processing Magazine2002;19(1):44–57.
[27] Guo Z, Xu Z, Wang LV. Dependence of photoacoustic speckles on boundaryroughness. Journal of Biomedical Optics 2012;17(4):0460091–460096.
[28] Holzer W, Mauerer M, Penzkofer A, Szeimies RM, Abels C, Landthaler M, et al.Photostability and thermal stability of indocyanine green. Journal of Photo-chemistry and Photobiology B Biology 1998;47(2/3):155–64.
[29] Bayer CL, Nam SY, Chen Y-S, Emelianov SY. Photoacoustic signal amplificationthrough plasmonic nanoparticle aggregation. Journal of Biomedical Optics2013;18(1):016001-.
[30] Nam SY, Ricles LM, Suggs LJ, Emelianov SY. Nonlinear photoacoustic signalincrease from endocytosis of gold nanoparticles. Optics Letters 2012;37(22):4708–10.
[31] Wide range quantitative photoacoustic spectroscopy to measure non-linearoptical absorption of hemoglobin. Danielli A, Maslov K, Xia J, Wang LV, editors.Proc of SPIE. 2012.
[32] Cox B, Laufer JG, Arridge SR, Beard PC. Quantitative spectroscopic photoa-coustic imaging: a review. Journal of Biomedical Optics 2012;17(6):061202.
[33] Jain PK, Lee KS, El-Sayed IH, El-Sayed MA. Calculated absorption and scatteringproperties of gold nanoparticles of different size, shape, and composition:applications in biological imaging and biomedicine. The Journal of PhysicalChemistry B 2006;110(14):7238–48.
[34] Homan K, Kim S, Chen YS, Wang B, Mallidi S, Emelianov S. Prospects ofmolecular photoacoustic imaging at 1064 nm wavelength. Optics Letters2010;35(15):2663–5.
[35] Zerda Adl Liu Z, Bodapati S, Teed R, Vaithilingam S, Khuri-Yakub BT, et al.Ultrahigh sensitivity carbon nanotube agents for photoacoustic molecularimaging in living mice. Nano Letters 2010;10(6):2168–72.
[36] Soliman H, Gunasekara A, Rycroft M, Zubovits J, Dent R, Spayne J, et al.Functional imaging using diffuse optical spectroscopy of neoadjuvant chemo-therapy response in women with locally advanced breast cancer. ClinicalCancer Research 2010;16(9):2605–14.
[37] Mansfield JR, Gossage KW, Hoyt CC, Levenson RM. Autofluorescence removal,multiplexing, and automated analysis methods for in-vivo fluorescence im-aging. Journal of Biomedical Optics 2005;10(4):041207–209.
Geoffrey P. Luke is a graduate student in the Depart-ment of Electrical Engineering at The University of Texasat Austin. He received a B.S. in Computer Engineeringand Mathematics and a M.S. in Electrical Engineeringfrom the University of Wyoming, where he developed asensor based on the visual system of the commonhousefly. His current research in the Ultrasound Imag-ing and Therapeutics Research Laboratory is focused onearly cancer detection and characterization using mo-lecular spectroscopic photoacoustic imaging.
Seung Yun Nam received his B.S. in Electrical andComputer Engineering from Seoul National University,South Korea, in 2007. He entered The University of Texasat Austin for his graduate education, and received hisM.S. degree in Electrical and Computer Engineering(Biomedical Engineering track) in 2010. Currently heis pursuing his Ph.D. under the supervision of Dr. Sta-nislav Emelianov at The University of Texas at Austin.His graduate research has been focused on monitoringstem cells and tissue regeneration using molecular con-trast agents and combined ultrasound and photoacous-tic imaging.
Stanislav Y. Emelianov Ph.D is a Professor and anAssociate Chair for Research in the Department of Bio-medical Engineering at The University of Texas at Austinwhere he directs the Ultrasound Imaging and Therapeu-tics Research Laboratory. In addition, Dr. Emelianov isan Adjunct Professor of Imaging Physics at The Univer-sity of Texas M.D. Anderson Cancer Center in Houston.Dr. Emelianov’s research interests are in the areas ofmedical imaging for diagnostic and therapeutic applica-tions, bionanotechnology, photoacoustic imaging, ultra-sound imaging, elasticity imaging, cellular/molecularimaging, and functional imaging.
Related Documents