I. '.a NASA Contractor Report 179646 Optical Strain Measurement System Development (LASA-CR-1396 46) OF3 ICAL S'IEA1 b RE ASUBEHEIT N87-26316 SPSTEP DEVELCf UENI Final Bepcrt (Sverdrup !Ircbncloqy) 15 F Avail: 8115 tC AO2/HF ECl CSCL 1UB Unclas G3/35 CC877 12 Christian T. Lant and Walid Qaqish Sverdrup Technology, Inc. Lewis Research Center Cleveland, Ohio July 1987 Prepared for Lewis Research Center Under Contract NAS3-24 105 National Aeronautics and Space Administration https://ntrs.nasa.gov/search.jsp?R=19870016893 2020-04-06T16:48:09+00:00Z

Welcome message from author
This document is posted to help you gain knowledge. Please leave a comment to let me know what you think about it! Share it to your friends and learn new things together.
Transcript
I. ' . a
NASA Contractor Report 179646
Optical Strain Measurement System Development
(LASA-CR-1396 46) O F 3 ICAL S'IEA1 b RE ASUBEHEIT N87-26316 S P S T E P DEVELCf U E N I F i n a l Bepcrt ( S v e r d r u p ! Ircbnc loqy) 15 F A v a i l : 8115 t C AO2/HF E C l CSCL 1UB Unclas
G3/35 CC877 12
Christian T. Lant and Walid Qaqish Sverdrup Technology, Inc. Lewis Research Center Cleveland, Ohio
July 1987
Prepared for Lewis Research Center Under Contract NAS3-24 105
National Aeronautics and Space Administration
https://ntrs.nasa.gov/search.jsp?R=19870016893 2020-04-06T16:48:09+00:00Z
OPlICAL STRAIN MEASUREMEN1 SYSTEM DEVELOPMENT
7
I co h CD m
I w
C h r i s t i a n T . Lant and Wal id Qaqish Sverdrup Technology, I n c .
Lewi s Research Center Cleveland, Ohio 44135
SUMMARY
A l a s e r speckle, d i f f e r e n t i a l s t r a i n measurement system has been b u i l t and t e s t e d f o r f u t u r e a p p l i c a t i o n s i n h o s t i l e environments. One-dimensional e l e c t r o n i c c o r r e l a t i o n o f speckle p a t t e r n movement a l l ows a quas i - rea l t ime measure o f s t r a i n . The system has been used s u c c e s s f u l l y t o measure u n i a x i a l s t r a i n reach ing i n t o p l a s t i c deformat ion o f a t e s t specimen, a t temperatures rang ing t o 450 "C. A r e s o l u t i o n o f 16 m i c r o s t r a i n i s g i ven by t h e photodiode a r r a y sensor p i t c h and t h e specimen t o sensor separa t ion . The s t r a i n meas- urement e r r o r i s es t ima ted t o be k18 m i c r o s t r a i n k0.3 pe rcen t o f t h e s t r a i n read ing . p e r t u r b a t i o n s causing d e c o r r e l a t i o n o f t h e re fe rence and s h i f t e d speckle p a t - t e rns , and may be improved by l i m i t i n g convec t i ve f l o w I n t h e immediate v i c i n i t y o f t h e t e s t specimen.
The upper temperature l i m l t o f t h e gauge i s determined by a i r d e n s i t y
INTRODUCTION
T h i s paper covers the Phase I r e s u l t s of a mu l t i phase e f f o r t t o develop an o p t i c a l s t r a i n gauge capable o f mapping t h e p r i n c i p a l axes o f s t r a i n on t h e su r face o f a h o t specimen. D u r a b i l i t y enhancement programs f o r p r o p u l s i o n system components prompted t h e need f o r such i n s t r u m e n t a t i o n . The o b j e c t i v e o f t h i s f i r s t phase has been t o p rov ide a noncontact , s i n g l e a x i s , d i f f e r e n t i a l s t r a i n gauge f o r exper imenta l purposes. Sverdrup Technology, I n c . i s develop- i n g t h i s o p t i c a l s t r a i n measurement system f o r t h e Lewis Research Center.
The design o f t h e o p t i c a l s t r a i n gauge i s based on t h e speckle s h i f t method o f I c h i r o u Yamaguchil a t The I n s t i t u t e o f Phys ica l and Chemical Research, Japan. Laser speckle i s a phase e f f e c t caused by t h e d i f f u s e r e f l e c - t i o n o f s p a t i a l l y coherent l i g h t o f f o f a rough sur face . I n t e r f e r e n c e o f the l i g h t r e f l e c t e d o f f o f a specimen r e s u l t s i n a l l g h t and dark i n t e n s i t y d i s t r i - b u t i o n a t t he sensor. Yamaguchi's noncontact method o f measuring d i f f e r e n t i a l su r face s t r a i n makes use o f speckle f i e l d displacements de tec ted by c ross- c o r r e l a t i n g e l e c t r i c a l s i g n a l s f rom a l i n e a r photodiode a r r a y . A l i m l t i n g geometry makes speckle displacement due t o s t r e s s on a t e s t specimen d i r e c t l y p r o p o r t i o n a l t o t h e assoc ia ted s t r a i n . Use o f t h i s method e l i m i n a t e s problems u s u a l l y caused by s u b j e c t i n g convent ional measurement devices t o h o s t i l e env i - ronments such as extreme temperatures, and h i g h e lec t romagne t i c f i e l d s ; t h e sensor need n o t be i n t h e same environment as t h e specimen. I n a d d i t i o n , Yamaguchi's method has t h e advantages over o t h e r o p t i c a l s t r a i n measurement techniques o f n o t o n l y be ing noncontact ing, b u t needing no su r face p repara t i on , a u t o m a t i c a l l y c o r r e c t i n g f o r s t r a i n e r r o r due t o r i g i d body mot ion, and g i v i n g q u a s i - r e a l t ime r e s u l t s ( t h e va lue o f s t r a i n i s c a l c u l a t e d w i t h i n seconds o f t a k i n g t h e data) .
THEORY
The u t i l i z a t i o n o f l a s e r speck le t o determine d i f f e r e n t i a l s t r a i n i s achieved by app ly ing the F r e s n e l - K l r c h h o f f d i f f r a c t i o n I n t e g r a l d e s c r i b i n g t h e propagat ion o f l i g h t I n f r e e space. This i n t e g r a l i s used t o d e r i v e t h e r e l a - t i o n s h i p between sur face deformat ion o f a specimen s u b j e c t t o l o a d i n g and speck le displacement i n t h e d i f f r a c t i o n f i e l d ( r e f s . 1 and 2 ) . The speck le d isp lacement conta ins terms of t r a n s l a t i o n , r o t a t i o n , and s t r a i n , f rom which t h e p r i n c i p l e s t r a i n te rm must be e x t r a c t e d . This e x t r a c t i o n r e l i e s on t h e use o f two symmetr ica l ly i n c i d e n t l a s e r beams r e f l e c t e d s e q u e n t i a l l y on to a l i n e a r photodiode a r r a y o r i e n t e d p a r a l l e l t o t h e specimen sur face . re fe rence ( b e f o r e - s t r a i n ) and s h i f t e d ( a f t e r - s t r a i n ) speck le p a t t e r n s f rom each beam a r e recorded and c o r r e l a t e d , t h e d i f f e r e n c e i n speck le s h i f t between them i s taken leav ing o n l y t h e component o f s h i f t due t o su r face s t r a i n .
A f t e r t h e
The theo ry I n t e r p r e t i n g t h e speck le d lsp lacement on t h e obse rva t i on p lane i s based on t h e assumption t h a t t h e i l l u m i n a t e d r e g i o n o f t h e specimen i s homo- geneous; t h i s reg ion a c t s as a random d i f f r a c t i o n g r a t i n g . For speck le s h i f t t o a c c u r a t e l y represent s t r a i n then r e q u i r e s t h a t t h e change i n t h e su r face roughness spacing be un i fo rm. Th is proved t o be t h e case i n t h e experimenta- t i o n w i t h i n t h e e l a s t i c l i m i t o f t h e t e s t specimen, as observed i n t h e s t a b i l - i t y o f t h e speckle p a t t e r n s and t h e agreement o f t h e r e s u l t s w i t h known q u a n t i t i e s .
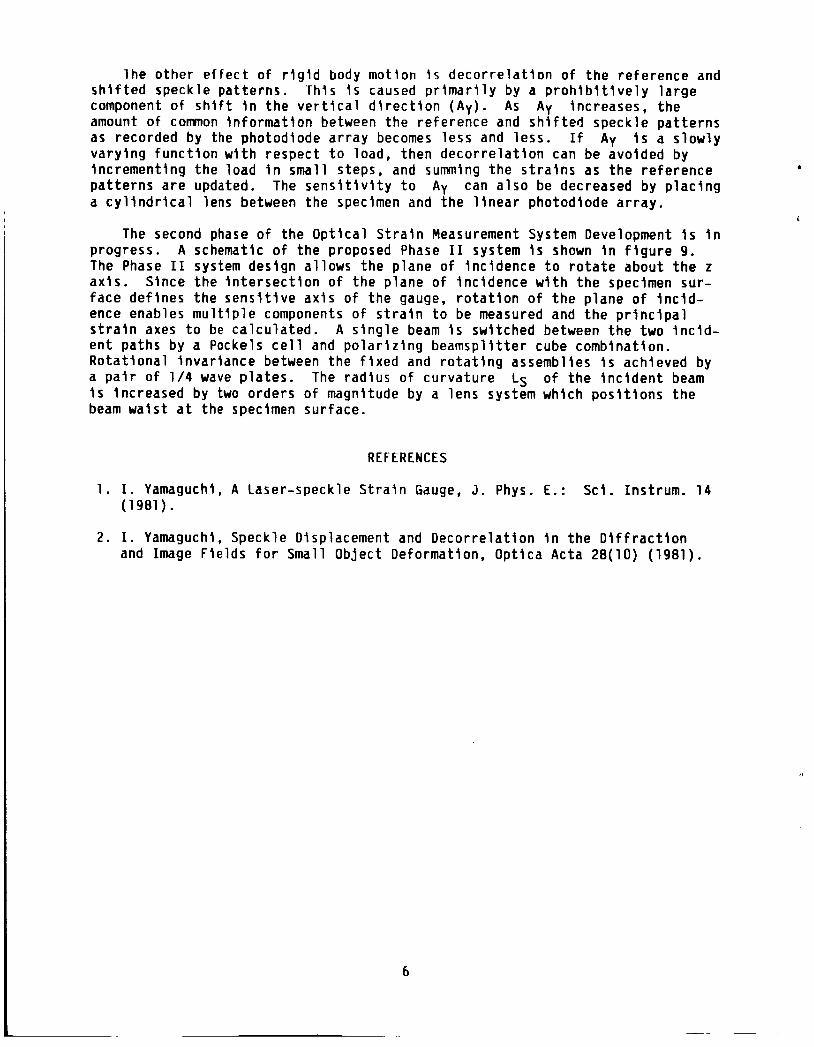
R e f e r r i n g t o t h e s i m p l i f i e d coo rd ina te system shown i n f i g u r e 1, a l a s e r beam i s i n c i d e n t on t h e d i f f u s e su r face o f a t e s t specimen a t an ang le 8, f r om t h e normal t o t h e sur face . The obse rva t i on p lane I s t h e X,Y p lane, and t h e o b j e c t p lane i s t h e lowercase x,y p lane. The cen te r o f t h e i n c i d e n t l a s e r spot i s a t t h e o r i g i n o f t h e x,y p lane. When t h e o b j e c t i s s t ressed and deformed, t h e ob jec t p o i n t I s d i sp laced by$x,y). t h e wavef ron t i s denoted Ls. The speck le d isp lacement A i s broken down i n t o components, g iven by
The r d i u s o f c u r v a t u r e o f
A X = a x - Lo [cxxsin((eS) - n Y [cos(es) + 11 1 ( 1 .a) L
s i n ( e s ) - n X [ cos (8 S ) + 1 1 - n Z s i n ( e S ) Y Y X Y
A- where a, $2, and [Y] a r e t h e t r a n s l a t i o n vec tor , t h e r o t a t i o n vec to r , and s t a i n tensor , respec t i ve l y . As l o n g as t h e d isp lacement Ay i s much sma l le r than t h e sum o f t h e sensor h e i g h t and t h e t y p i c a l speck le s i z e on t h e sensor A X can be determined by c r o s s - c o r r e l a t i n g t h e sensor s i g n a l s b e f o r e and a f t e r sur - f a c e deformat ion. The c o r r e l a t i o n i s performed between t h e re fe rence and t h e s h i f t e d speck le pa t te rns f rom t h e l e f t i n c i d e n t beam, and aga in between t h e re fe rence and t h e s h i f t e d p a t t e r n s f rom t h e r i g h t I n c i d e n t beam.
I n i t i a l c a n c e l l a t i o n o f r i g i d body mot ion terms r e q u i r e s t h e i n c i d e n t r a d i u s
AX, which can be cance l l ed
o f c u r v a t u r e Ls t o be much g r e a t e r than t h e sensor d i s t a n c e LO, and Lo t o be much g r e a t e r than t h e spot d iameter o f t h e i n c i d e n t beam. Equat ions (1) show t h e remaining r i g i d body mot ion components i n o u t by t a k i n g the d i f f e r e n c e between speck le d isp lacements f rom t h e two beams a t +es and -8s. From equa t ion (1.a) then
2
4
4
bAx = - 2 L o ~ ~ ~ s i n ( e ) (where e = l es l )
-bAx t = x x 2LOs in (e )
I f t h e c r i t e r i o n Lo/Ls << 1 i s not met, then t h e ou t -o f -p lane e r r o r t e r m
e r r o r te rm =
i s added t o t h e s t r a i n formula (eq. ( 3 ) ) .
( 3 )
( 4 )
MEASUREMENT SYSTEM DESIGN AND SETUP
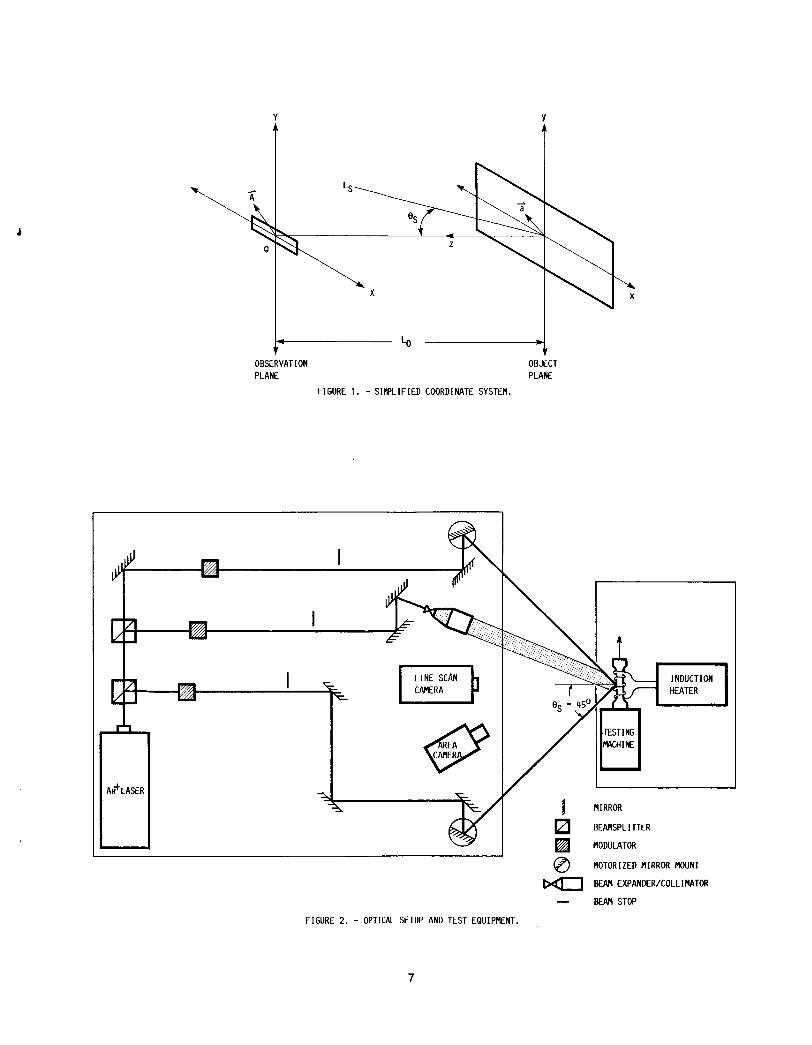
The system i s designed t o run predominantly under computer c o n t r o l , w i t h t h e opera to r s e l e c t i n g procedures f rom menus on t h e CRT. A schematic o f t h e o p t i - c a l setup i s dep ic ted i n f i g u r e 2. The l a s e r and the beamsteering components a r e mounted on a hard-coupled o p t i c a l t a b l e ( t h i s n o n - i n t e r f e r o m e t r i c tech- n ique does n o t r e q u i r e v i b r a t i o n I s o l a t i o n ) . Two v a r i a b l e b e a m s p l l t t e r s a r e used t o c r e a t e t h r e e beam paths, each beam switched by an acous to-op t ic modu- l a t o r . A l i n e scan camera records the speckle p a t t e r n s generated by t h e l e f t and r i g h t beams a t 8s = 45" . and an area a r r a y camera a l l o w s t h e t e s t s e c t i o n and gauge p o s i t i o n t o be mon i to red remotely. The cameras, modulators, and t h e motor ized m i r r o r mounts a r e r e m o t e l y c o n t r o l l e d . i n d u c t i o n heater a r e mounted on a hyd rau l i c l i f t t a b l e t o p r o v i d e p o s i t i o n i n g r e l a t i v e t o t h e o p t i c s . An e r r o r ana lys i s of t h i s system shows an o v e r a l l s t r a i n measurement e r r o r es t ima te o f f18 m i c r o s t r a i n 50.3 percen t o f t h e s t r a i n read 1 ng .
The t e s t i n g machine and
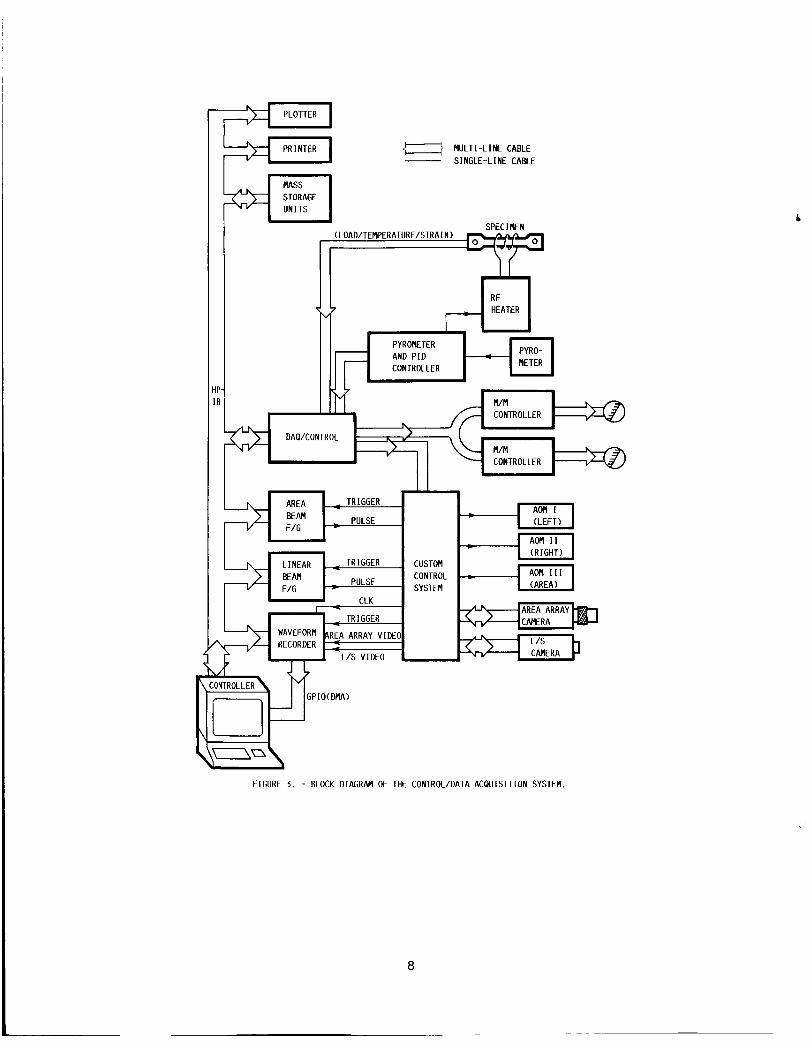
The c o n t r o l and da ta paths a r e shown i n f i g u r e 3. The system c o n t r o l l e r i n i t i a t e s procedures through t h r e e main components, these be ing t h e da ta a c q u i s i t i o n / c o n t r o l u n l t ( D A Q ) , and two pu lse genera tors . The da ta a c q u i s i t i o n / c o n t r o l u n i t ou tpu ts c o n t r o l s lgna ls t o t h e custom c i r c u i t r y used f o r exposlng and read ing t h e l i n e a r and area array cameras; these c i r c u i t s synchronize t h e p u l s e genera tors w i t h the a r r a y cameras, t r l g g e r i n g t h e p u l s e genera tors t o ou tpu t TTL exposure pu lses t o t h e acous to-op t ic modulator RF genera tors . The t r i g g e r e d ou tpu ts o f t h e pu lse generators s w i t c h i n g on and o f f t h e beam- d e f l e c t i n g modulators a c t as h i g h speed programmable s h u t t e r s . a l s o used t o read the vo l tages f r o m thermocouples, r e s i s t a n c e s t r a i n gauges on t h e specimen, and a load c e l l . Higher temperatures a r e a l s o measured by t h e i n f r a r e d pyrometer which, i n a d d i t i o n , p rov ides a temperature c o n t r o l s i g n a l t o t h e i n d u c t i o n hea te r . This al lows p r e c i s e c o n t r o l o f t h e specimen tempera- t u r e a t t he gauge p o s i t i o n .
The DAQ i s
RESULTS AND RECOMMENDATIONS
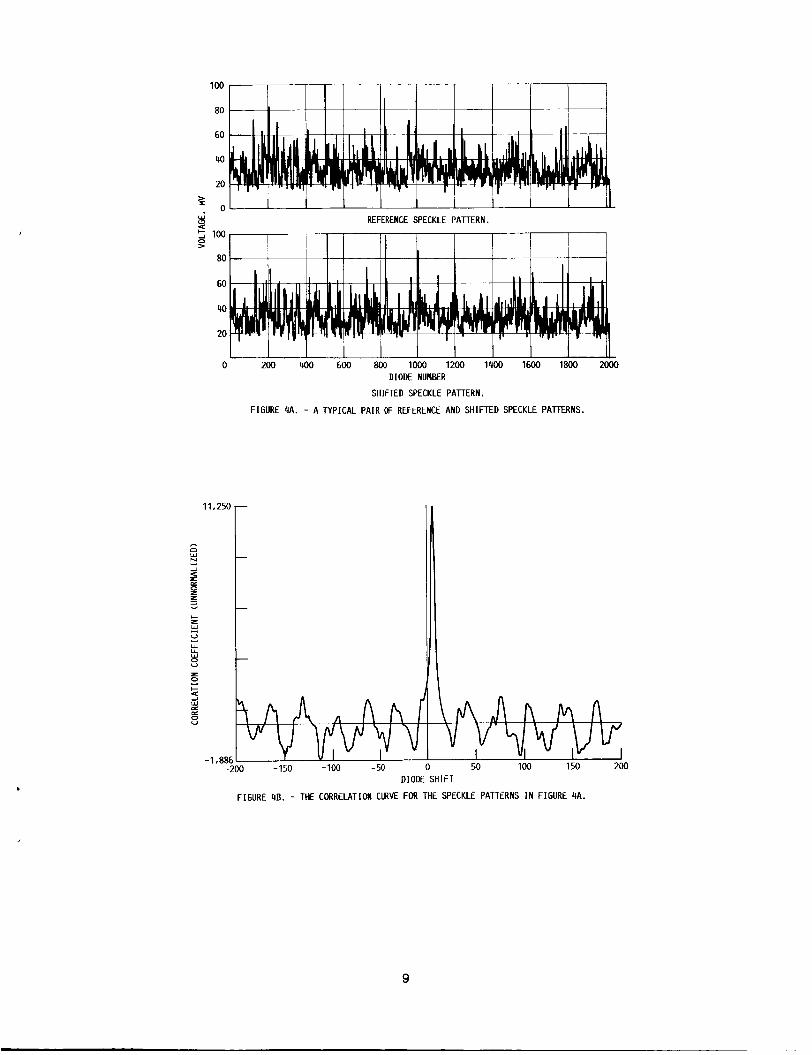
A s e r l e s o f t e s t r e s u l t s shown i n t h e f o l l o w i n g paragraphs g i v e a good i n d i c a t i o n o f t h e o v e r a l l system response. A 750 d iode c ross s e c t i o n o f each speck le p a t t e r n i s used i n the c o r r e l a t i o n s i n o rder t o minlrnize t h e execu t ion
3
t i m e o f t h e measurement. A t y p i c a l p a i r of speck le p a t t e r n s ( r e f e r e n c e and s h i f t e d ) and t h e i r c r o s s - c o r r e l a t i o n f u n c t i o n i s shown i n f i g u r e s 4(a) and ( b ) . The s h i f t between t h e speck le p a t t e r n s was induced by a 13.8 MPa ( 2 k s l ) load . The s h i f t 65 m i c r o s t r a i n on the specimen a f t e r r l g l d body s h i f t was cance l l ed ou t . The c o r r e l a t i o n curve was n o t normal ized, i n o rde r t o decrease t h e execu t ion t i m e 1 n v o l ved .
A X was c a l c u l a t e d t o be 7 diodes (105 urn), corresponding t o
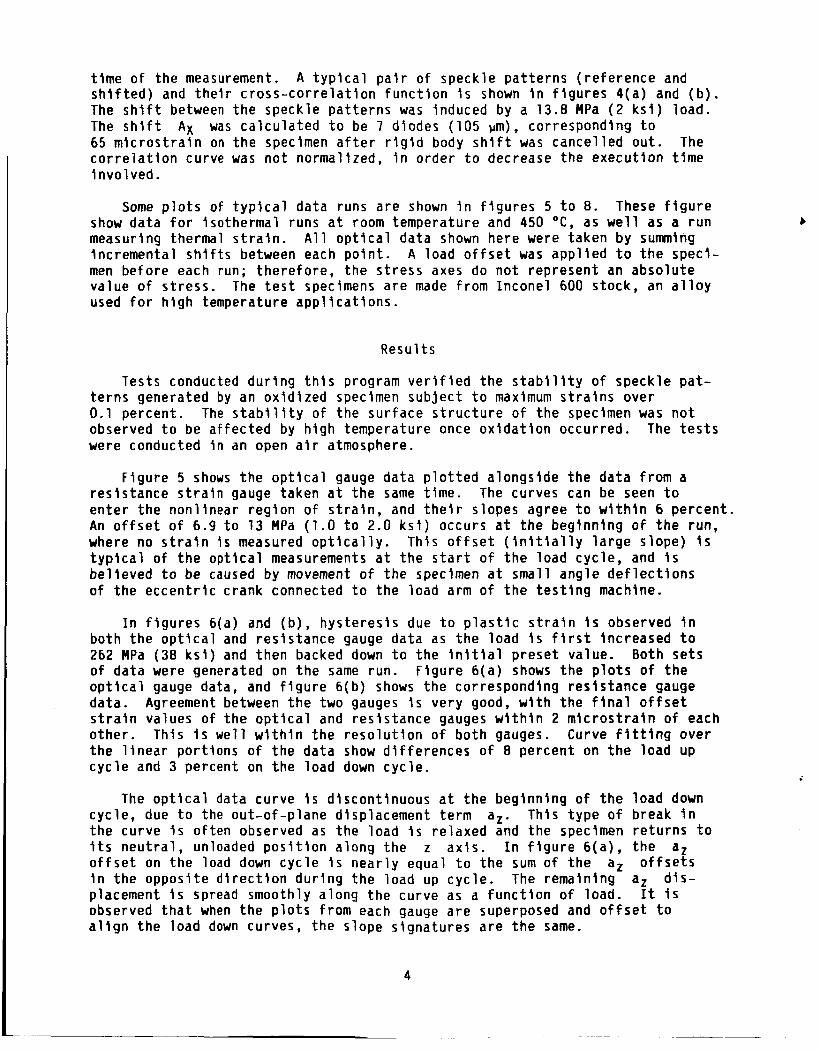
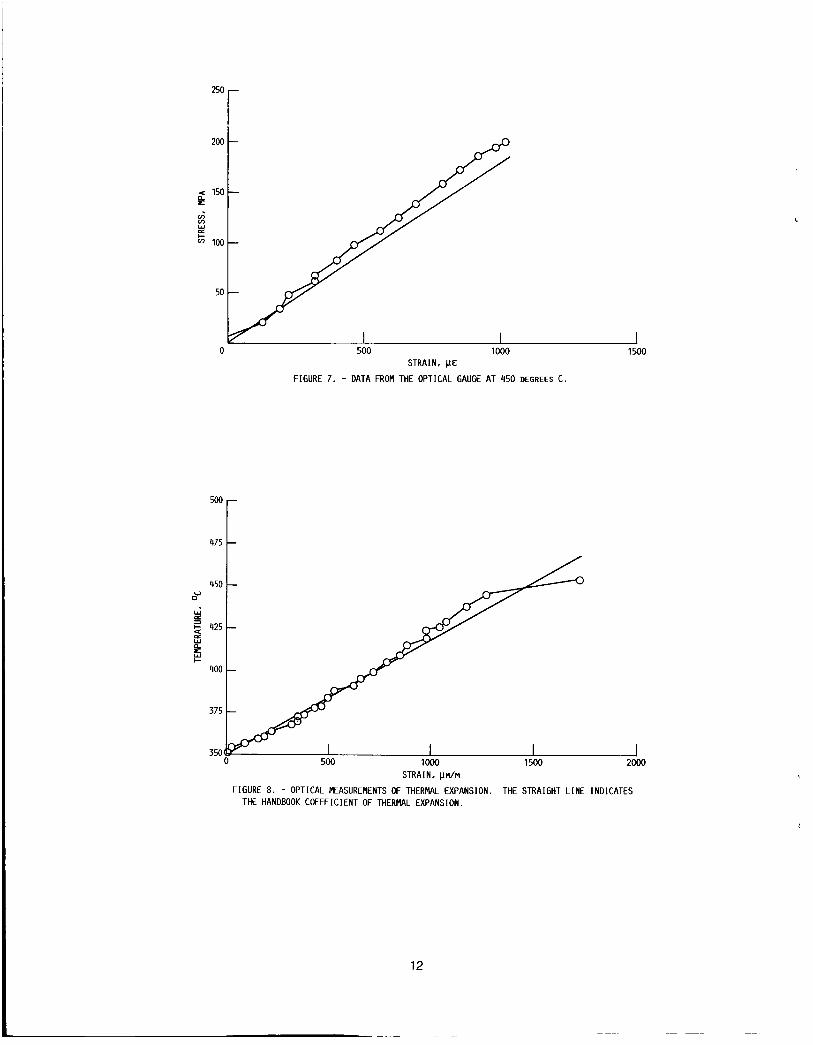
Some p l o t s of t y p i c a l da ta runs a r e shown i n f i g u r e s 5 t o 8. These f i g u r e show da ta f o r i so thermal runs a t room temperature and 450 O C , as w e l l as a r u n measuring thermal s t r a i n . A l l o p t i c a l da ta shown here were taken by sunning inc rementa l s h i f t s between each p o i n t . A l oad o f f s e t was a p p l i e d t o t h e specI - men be fo re each run; t h e r e f o r e , t h e s t r e s s axes do n o t rep resen t an abso lu te va lue o f s t r e s s . The t e s t specimens a r e made f rom Incone l 600 s tock , an a l l o y used f o r h i g h temperature a p p l i c a t i o n s .
Resu l ts
Tests conducted d u r i n g t h i s program v e r i f i e d t h e s t a b i l i t y o f speck le p a t - t e r n s generated by an o x i d i z e d specimen s u b j e c t t o maximum s t r a i n s over 0.1 percent . The s t a b i l i t y o f t h e su r face s t r u c t u r e o f t h e specimen was n o t observed t o be a f f e c t e d by h i g h temperature once o x i d a t i o n occurred. The t e s t s were conducted i n an open a i r atmosphere.
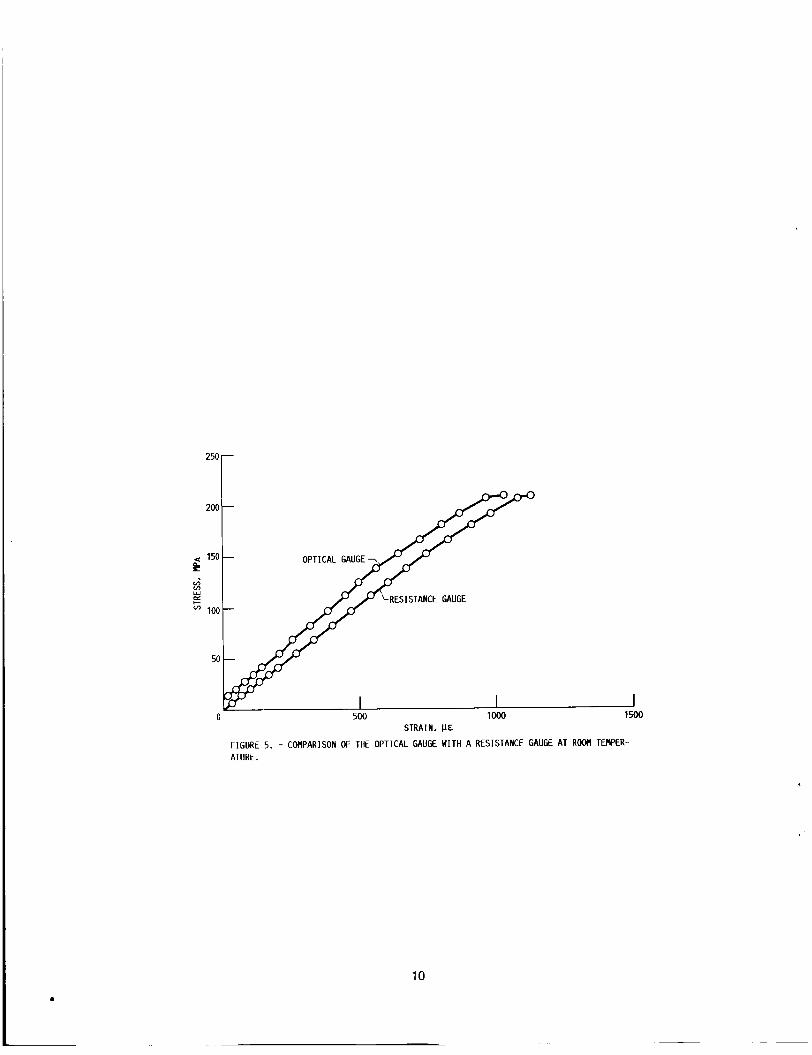
F igu re 5 shows t h e o p t i c a l gauge da ta p l o t t e d a longs ide t h e da ta f rom a r e s i s t a n c e s t r a i n gauge taken a t t h e same t ime. The curves can be seen t o en te r t h e non l i nea r r e g i o n o f s t r a i n , and t h e i r slopes agree t o w i t h i n 6 pe rcen t . An o f f s e t o f 6.9 t o 13 MPa (1.0 t o 2.0 k s i ) occurs a t t h e beg inn ing o f t h e run, where no s t r a i n 1 s measured o p t i c a l l y . Th is o f f s e t ( i n i t i a l l y l a r g e s lope) i s t y p i c a l o f t h e o p t i c a l measurements a t t h e s t a r t o f t h e l oad cyc le , and I s b e l i e v e d t o be caused by movement o f t h e specimen a t smal l ang le d e f l e c t i o n s o f t h e e c c e n t r i c crank connected t o t h e l oad arm o f t h e t e s t i n g machine.
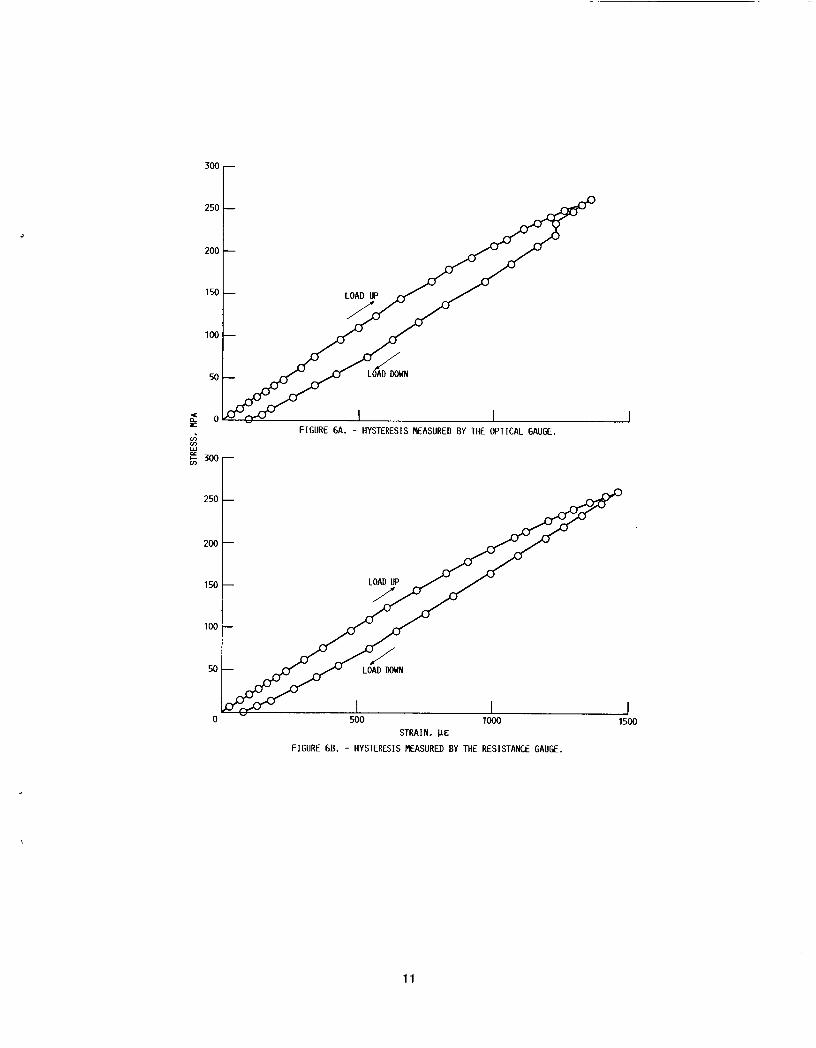
I n f j g u r e s 6(a) and ( b ) , h y s t e r e s i s due t o p l a s t i c s t r a i n i s observed i n bo th t h e o p t i c a l and r e s i s t a n c e gauge da ta as t h e l oad I s f i r s t inc reased t o 262 MPa ( 3 8 k s i ) and then backed down t o t h e i n i t i a l p r e s e t va lue. Both se ts o f da ta were generated on t h e same run . F i g u r e 6 (a ) shows t h e p l o t s o f t h e o p t i c a l gauge data, and f i g u r e 6(b) shows t h e cor respond ing r e s i s t a n c e gauge data. Agreement between t h e two gauges i s very good, w i t h t h e f i n a l o f f s e t s t r a i n values o f t h e o p t i c a l and r e s i s t a n c e gauges w i t h i n 2 m i c r o s t r a i n o f each o the r . Th is i s w e l l w i t h i n t h e r e s o l u t i o n o f b o t h gauges. Curve f i t t i n g over t h e l i n e a r po r t i ons o f t h e da ta show d i f f e r e n c e s o f 8 pe rcen t on t h e l o a d up c y c l e and 3 percent on t h e l oad down c y c l e .
The o p t i c a l data curve i s d iscont inuous a t t h e beg inn ing o f t h e l oad down cyc le , due t o the ou t -o f -p lane d isp lacement te rm a,. t h e curve i s o f t e n observed as t h e l oad i s re laxed and t h e specimen r e t u r n s t o i t s n e u t r a l , unloaded p o s i t i o n a long t h e z a x i s . I n f i g u r e 6(a) , t h e a, o f f s e t on t h e load down c y c l e i s n e a r l y equal t o t h e sum o f t h e o f f s e t s i n t h e oppos i te d i r e c t i o n d u r i n g t h e l oad up c y c l e . The remain ing aZ d l s - placement i s spread smoothly a long t h e curve as a f u n c t i o n o f load . It 1 s observed t h a t when t h e p l o t s from each gauge a r e superposed and o f f s e t t o a l i g n t h e l oad down curves, t h e s lope s igna tu res a r e t h e same.
Th is t y p e o f break I n
az
4
Figure 7 shows stress-strain data at hlgh temperature; the temperature setpoint was 450 OC. elasticity E(T = 450') given by an Inconel 600 data sheet. The slope calcu- lated from the optical gauge data is 10 percent higher than the handbook value. The optical data show discontinuities below 67 MPa (10 ksi) due to specimen shifting in the 200 HPa (29 ksi). At high loads, the term az has been observed to increase proportionally with load, which accounts for the slightly larger slope of the optical data.
The straight line drawn on the plot is the modulus of
z direction (az), but smooths out for a constant slope up to
A test run measuring thermal strain is shown in figure 8. As with the iso- thermal runs, poor correlation occurred at temperatures above 450°, and the run was terminated. expansion to be 14.3 pm/m°C. This is within 3 percent of the handbook value. Some random error (214.8 pm/m) occurred due to the uncertainty in the temper- ature setpoint value.
A linear fit of the data gives the measured coefficient of
A least-squares regression over the linear portion of the strain data taken for each run provides a good measure of the accuracy of the data. The calcu- lated modulus of elasticity (E) or coefficient of thermal expansion shows error trends in the system (e.g., the error due to az increasing with load). The linear-correlation coefficient indicates the degree of confidence in E , or how well strain is shown to be a function of stress. The plots shown here have linear-correlation coefficients ranging from 0.998 to 1.000,
Phase 1 Conclusion and Phase I1 Design
The experimentation conducted during this project has resulted in a number o f useful insights regarding the implementation of Yamaguchi's theory. Over- all, this measurement system works very well for measuring strain at low to midrange temperatures (up to 450 "C) using an open air specimen configuration. Increasing the temperature range depends on how well air density perturbations in the vicinity of the specimen can be controlled. time-varying speckle intensity fluctuations which lead to a relative shift between the left and right correlation functions. be increased by placing baffles in the viclnity of the heated specimen, or by enclosing the specimen, which would block convective air flow and decrease transverse thermal gradients between the specimen and the sensor.
These perturbations cause
The temperature range could
The most practical result of the testing, though, is that the effectiveness o f Yamaguchi's speckle shift technique as a strain gauge is limited by the extent of the system's imnunity to rigid body motion of the test specimen. Thus, the limiting factors in implementing the test system are terms of rigid body motion. An increase in the radius of curvature of the laser beam wave- front, as well as careful alignment of the specimen in the load train, can eliminate the systematic error observed in these tests and ensure the reliabil- ity of the data with minimum equipment specifications. The present system contributes an out-of-plane error term (eq. (4)) of 0.13 az strain to the measurement. The az sensitivity can be decreased sufficiently by increaslng the radius of wavefront curvature translations of the test components are extreme and unavoidable, the translation term could be measured for each pair of speckle patterns recorded and calculated out of the speckle shlft equation.
Ls. For the case of a test situation where az
5
l h e o the r e f f e c t o f r i g i d body mot ion i s d e c o r r e l a t i o n o f t h e re fe rence and s h i f t e d speck le p a t t e r n s . This I s caused p r i m a r i l y by a p r o h i b i t i v e l y l a r g e component o f s h i f t i n t h e v e r t i c a l d i r e c t i o n (Ay) . As Ay Increases, t h e amount o f common i n f o r m a t i o n between t h e re fe rence and s h i f t e d speck le p a t t e r n s as recorded by the photodiode a r r a y becomes l e s s and l e s s . I f Ay i s a s l o w l y v a r y i n g f u n c t i o n w i t h respec t t o load, then d e c o r r e l a t i o n can be avoided by inc rement ing t h e l oad i n smal l s teps, and summing t h e s t r a i n s as t h e re fe rence p a t t e r n s a r e updated. The s e n s i t i v i t y t o Ay can a l s o be decreased by p l a c i n g a c y l i n d r i c a l lens between t h e specimen and t h e l i n e a r photodiode a r r a y .
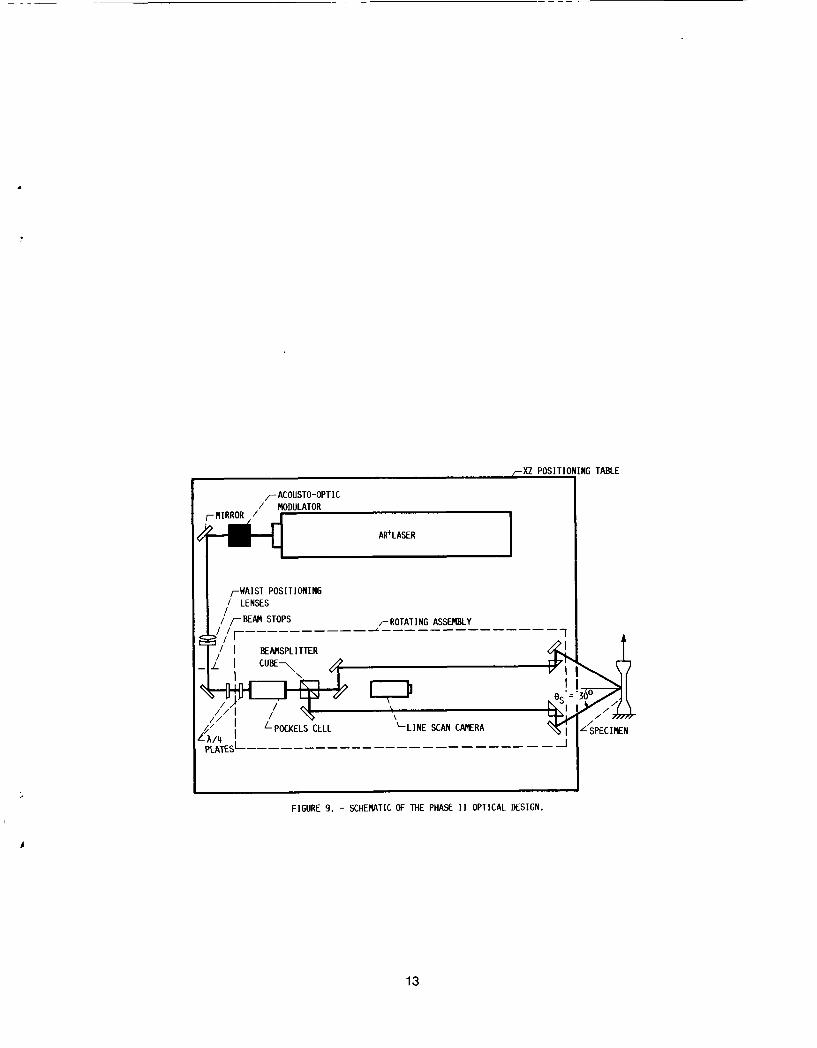
The second phase o f t h e O p t i c a l S t r a i n Measurement System Development i s i n progress . A schematic o f t h e proposed Phase I 1 system i s shown i n f i g u r e 9. The Phase I 1 system des ign a l l ows t h e p lane o f i nc idence t o r o t a t e about t h e z a x i s . S ince t h e i n t e r s e c t i o n o f t h e p lane o f i nc idence w i t h t h e specimen sur- f a c e d e f i n e s t h e s e n s i t i v e a x i s o f t h e gauge, r o t a t i o n o f t h e p lane o f i n c i d - ence enables m u l t i p l e components of s t r a i n t o be measured and t h e p r i n c i p a l s t r a i n axes t o be c a l c u l a t e d . A s i n g l e beam i s swi tched between t h e two i n c i d - e n t paths by a Pockels c e l l and p o l a r i z i n g b e a m s p l i t t e r cube combinat ion. R o t a t i o n a l i nva r iance between t h e f i x e d and r o t a t i n g assemblies i s ach ieved by a p a i r of 1 /4 wave p l a t e s . The rad ius o f c u r v a t u r e LS o f t h e i n c i d e n t beam i s inc reased by two orders o f magnitude by a l e n s system which p o s i t i o n s t h e beam w a i s t a t the specimen sur face .
REFERENCES
1. I. Yamaguchi, A Laser-speckle S t r a i n Gauge, J . Phys. E.: S c i . Ins t rum. 14 (1981).
2. I. Yamaguchi, Speckle Displacement and D e c o r r e l a t i o n i n t h e D i f f r a c t i o n and Image F ie lds f o r Small Object Deformation, Op t i ca Acta 28(10) (1981).
6
V ' OBSCRVATION OBJECT PLANE PLANE
FIGURE 1. - SIMPLIFIED COORDINATE SYSTEM.
LINE SCAN
AR+LASEG
Q C M R
INDUCTION HEATER
f MIRROR
BEAMSPLITTER
MODULATOR
@ MOTORIZED MIRROR MOUNT a BEAM EXPANDER/COLLIMATOR
- BEAM STOP
FIGURE 2. - OPTICAL SETUP AND TEST EQUIPMENT.
7
4-1 MULTI-LINE CABLE SINGLE-LINE CABLE
STORAGE UNITS
SPECIMEN
RF HEATER -
- PYRO- PYROMETER AND P I D CONTROLLER
- METER
WM h CONTROLLER
h V
DAWCONTROL - C Y
V WM I.
CONTROLLER > V
h
V
AREA TRIGGER ~ =
BEAM F I G
- PULSE -
k
V
LINEAR TR I GGER BEAM F/G
> - PULSE - - CLK -
I I I - TRIGGER
RECORDER
CONTROLLER @ CUSTOM CONTROL SYSTEM
+--IT (LEFT)
(AREA)
CAMERA
FIGURE 3. - BLOCK DIAGRAM OF THE CONTROL/DATA ACQUISITION SYSTEM.
8
J
80 I
60
40
20
- 0 s I I I I I I I REFERENCE SPECKLE PATTERN.
60
40
20
0 200 400 600 800 lo00 1200 1400 1600 1800 2000 DIODE N U W R
SHIFTED SPECKLE PATTERN.
FIGURE 4A. - A TYPICAL PAIR OF REFERENCE AND SHIFTED SPECKLE PATTERNS.
DIODE SHIFT
FIGURE 4B. - THE CORRELATION CURVE FOR THE SPECKLE PATTERNS I N FIGURE 4A.
9
250r
STRAIN, LIE
FIGURE 5 . - COMPARISON OF THE OPTICAL GAUGE WITH A RESISTANCE GAUGE AT ROOn TWPER- ATURE .
10
250
J
200
150
100
50
- FIGURE 6A. - HYSTERESIS REASURED BY THE OPTICAL GAUGE.
W
r E 300
STRAIN. NE
FIGURE 6B. - HYSTERESIS MEASURED BY THE RESISTANCE GAUGE.
11
0
500
475
450 0-
W ET
425 a
$ e 400
375
500 1000 STRAIN, C(E
FIGURE 7 . - DATA FROM THE OPTICAL GAUGE AT 4 5 0 DEGREES C.
1500
350 0 500 lo00 1500 2000
STRAIN. ~ W M
THE HANDBOOK COEFFICIENT OF THERMAL EXPANSION. FIGURE 8. - OPTICAL MEASUREMENTS OF THERMAL EXPANSION. THE STRAIGHT L I N E INDICATES
12
/-xz POSITI(
/-ACOUSTO-OPTIC / MODULATOR
MIRROR /
AR+LASER
,-WAIST POSITION I NG
r ROTAT I NG ASSEMBLY // LENSES / /--BEAM STOPS
1 /,Ir __________ A - -___________- I E M S P L I T T E R
I ! I C U B E 7
I
FIGURE 9 . - SCHEMTIC OF THE PHASE I 1 OPTICAL DESIGN.
NG TABLE
t 4 / /
13
Report Documentation Page
NASA CR-179646 4. Title and Subtitle
Optical Strain Measurement System Development
7. Author@)
Christian T. Lant and Walid Qaqish
9. Performing Organization Name and Address
Sverdrup Technology, Inc. Lewis Research Center Cleveland, Ohio 44135
~~
12. Sponsoring Agency Name and Address
National Aeronautics and Space Administration Lewis Research Center Cleveland. Ohio 44135
15. Supplementary Notes
3. Recipient's Catalog No.
5. Report Date
July 1987 6. Performing Organization Code
8. Performing Organization Report No.
None (E-3678) IO. Work Unit No.
506-42-1 1 11. Contract or Grant No.
NAS3-24105 13. Type of Report and Period Covered Contractor Report Final
14. Sponsoring Agency Code
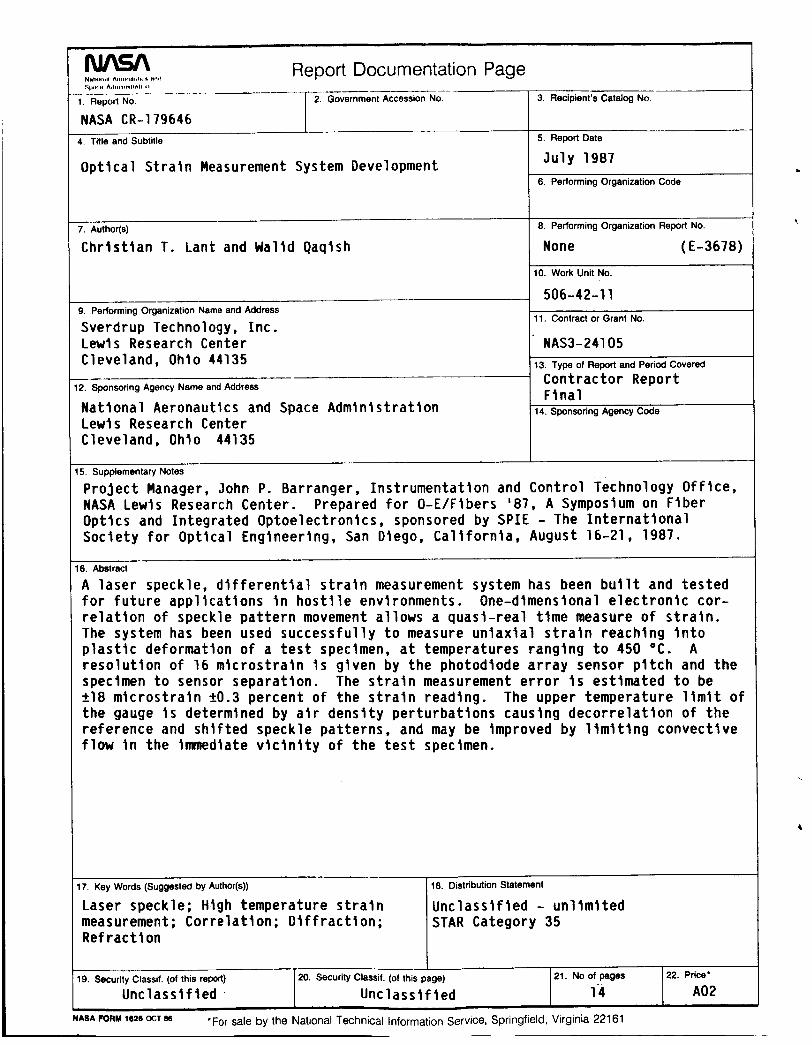
Project Manager, John P. Barranger, Instrumentation and Control Technology Office, NASA Lewis Research Center. Prepared for 0-E/Fibers '87, A Symposium on Fiber Optics and Integrated Optoelectronics, sponsored by SPIE - The International Society for Optical Engineering, San Diego, California, August 16-21, 1987.
A laser speckle, differential strain measurement system has been built and tested for future applications in hostile environments. One-dimensional electronic cor- relation of speckle pattern movement allows a quasi-real time measure of strain. The system has been used successfully to measure uniaxial strain reaching into plastic deformation of a test specimen, at temperatures ranging to 450 O C . A resolution of 16 microstrain is given by the photodiode array sensor pitch and the specimen to sensor separatlon. 218 microstrain 20.3 percent of the strain reading. the gauge is determined by air density perturbations causing decorrelation of the reference and shifted speckle patterns, and may be improved by limiting convective flow in the imnediate vicinity of the test specimen.
16. Abstract
The strain measurement error Is estimated to be The upper temperature limlt of
17. Key Words (Suggested by Author($)) I 18. Distribution Statement
Laser speckle; High temperature strain measurement; Correlation; Diffraction; Refraction
Unclassified - unlimited STAR Category 35
I 20. Security Classif. (of this page) 21. No of pages 22. Price' 19. Security Classif. (of this report)
Unclassified Unclassified 14 A02
'For sale by the National Technical Information Service, Springfield, Virginia 221 61 IASA FORM 1626 OCT 86
Related Documents