For Peer Review Only OPTICAL SCANNING FOR STRUCTURAL VIBRATION MEASUREMENT Journal: Research in Nondestructive Evaluation Manuscript ID: URND-2010-0008.R1 Manuscript Type: Original Paper Date Submitted by the Author: n/a Complete List of Authors: Ferrer, Belen; Universidad de Alicante, Departamento de Ingeniería de la Construcción Espinosa, Julián; Universidad de Alicante, Instituto Universitario de Física Aplicada a las Ciencias y a las Tecnologías Pérez, Jorge; Universidad de Alicante, Instituto Universitario de Física Aplicada a las Ciencias y a las Tecnologías Ivorra, Salvador; Universidad de Alicante, Departamento de Ingeniería de la Construcción Mas, David; Universidad de Alicante, Instituto Universitario de Física Aplicada a las Ciencias y a las Tecnologías Keywords: Image Processing, Impact, Measurement, Non-contact, Optical URL: http://mc.manuscriptcentral.com/urnd E-mail: [email protected] Research in Nondestructive Evaluation

Welcome message from author
This document is posted to help you gain knowledge. Please leave a comment to let me know what you think about it! Share it to your friends and learn new things together.
Transcript
For Peer Review O
nly
OPTICAL SCANNING FOR STRUCTURAL VIBRATION
MEASUREMENT
Journal: Research in Nondestructive Evaluation
Manuscript ID: URND-2010-0008.R1
Manuscript Type: Original Paper
Date Submitted by the Author:
n/a
Complete List of Authors: Ferrer, Belen; Universidad de Alicante, Departamento de Ingeniería de la Construcción Espinosa, Julián; Universidad de Alicante, Instituto Universitario de Física Aplicada a las Ciencias y a las Tecnologías Pérez, Jorge; Universidad de Alicante, Instituto Universitario de Física Aplicada a las Ciencias y a las Tecnologías Ivorra, Salvador; Universidad de Alicante, Departamento de Ingeniería de la Construcción Mas, David; Universidad de Alicante, Instituto Universitario de Física Aplicada a las Ciencias y a las Tecnologías
Keywords: Image Processing, Impact, Measurement, Non-contact, Optical
URL: http://mc.manuscriptcentral.com/urnd E-mail: [email protected]
Research in Nondestructive Evaluation
For Peer Review O
nly
OPTICAL SCANNING FOR STRUCTURAL VIBRATION
MEASUREMENT
Belén Ferrera*
, Julián Espinosab, Jorge Pérez
b, Salvador Ivorra
a, David Mas
b
aUniversidad de Alicante, Departamento de ingeniería de la Construcción, San Vicente
del Raspeig, Alicante 03690, Spain
bUniversidad de Alicante, Instituto Universitario de Física Aplicada a las Ciencias y a
las Tecnologías, San Vicente del Raspeig, Alicante 03690, Spain
*Corresponding author: Tel.: +34 965903400, Ext.: 1167; Fax.: +34 965903678
ABSTRACT
High speed cameras are often used for monitoring impacts and fast dynamic processes
on structures. However, quantitative information about these processes is usually
obtained through other means like accelerometers or Doppler vibrometers. In this paper,
we show that a proper arrangement of the experiment and the camera allows non contact
measurement of the characteristics of the main displacement mode (amplitude,
frequency and attenuation). An application is given for the analysis of structure
damages after low speed car impacts. The method is low cost, fast and accurate, and it
permits direct visualization and measurement of the movement of the vibrating body.
KEYWORD
Image Processing, Impact, Measurement, Non-contact, Optical
Page 5 of 31
URL: http://mc.manuscriptcentral.com/urnd E-mail: [email protected]
Research in Nondestructive Evaluation
123456789101112131415161718192021222324252627282930313233343536373839404142434445464748495051525354555657585960
For Peer Review O
nly
1. INTRODUCTION
Monitoring of vibrations and displacements of structures under dynamic excitations or
impacts is a hot topic in structural engineering. Measurement of the dynamic response
to ambient excitation contributes to know the condition of structures and to identify
possible damage [1]. Furthermore, the maximum displacement under dynamic loading
allows defining the equivalent static load as the load that statically applied provokes the
same displacement on the structure [2]. This magnitude is commonly used as a
parameter to design safe structures under dynamic loading [3,4]. However, in spite of its
usefulness, the list of accurate displacement sensors is quite short.
Traditional structural displacement sensors, such as linear variable differential
transformers (LVDT) and dial gauges can accurately measure the displacement of a
point in the structure and in any direction. Unfortunately, the sensors need a stationary
platform near the structure with their two ends rigidly fixed to the reference and the
measured point, respectively. If this fixation is not strong enough, the probe will loose
contact with the surface during a hard impact, providing false position information.
Furthermore, the placement of such auxiliary construction is not always possible, thus
impeding accurate displacement measurements.
In principle, dynamic displacement can be also obtained by double integration of a
corresponding acceleration time history with some corrections [5]. Although this
approach is theoretically right, in practice, direct integration does not provide good
results and further considerations are often needed [6,7]. Moreover, acceleration
amplitude is proportional to the square of the angular frequency and thus, signal due to
high frequency modes with low displacement amplitude can mask results of interest.
We will come back on this issue below.
Page 6 of 31
URL: http://mc.manuscriptcentral.com/urnd E-mail: [email protected]
Research in Nondestructive Evaluation
123456789101112131415161718192021222324252627282930313233343536373839404142434445464748495051525354555657585960
For Peer Review O
nly
Other devices that seem to be very attractive for such applications are interferometric
sensors, such as laser vibrometers or high speed radar interferometry. These devices can
be used to no contact measure of both small and large displacements. Their accuracy
and dynamic range is also high [8-11] and thus, they can be used in a high variety of
applications [12-14]. Unfortunately, these devices tend to be very expensive, what
makes that they are not cost-effective for many applications. Besides, the GPS is used to
measure dynamic displacement but its accuracy is around 15 mm, which makes it only
suitable for monitoring of very large structures [15].
Optical and vision-based systems for measuring displacement offer a good alternative to
traditional sensors [16-18]. Fast development of the electronics and computer
technology has helped to decrease the price of such technologies and thus, its use is
becoming more and more popular. Examples of such optical instrumentation are high
resolution cameras in both spatial and temporal domains.
This paper focuses on monochrome high speed CCD video cameras. We propose to use
a fast imaging system to capture the displacement of a vibrating column. The developed
method allows a direct visualization of the movement and, after image processing, it is
possible to measure the amplitude, damping and frequency of the vibration. The cost of
the whole system is less than 3000 € and it does not require of any special hardware,
aside of a fast enough camera (200 Hz).
Our method was tested on a steel column under a lateral impact. The lateral impact was
provided by a steel sphere holding by a thread at the highest part of the column. A
special target was attached in the lateral part of the column, at the height of the impact,
so that vibrations in the direction of the impact can be measured. Our measuring device
is composed by a high speed camera and different accelerometers attached to the
column. Although accelerometers do not provide direct information about
Page 7 of 31
URL: http://mc.manuscriptcentral.com/urnd E-mail: [email protected]
Research in Nondestructive Evaluation
123456789101112131415161718192021222324252627282930313233343536373839404142434445464748495051525354555657585960
For Peer Review O
nly
displacements, they can register the frequency of the vibration modes which are going
to be checked with those obtained with the camera.
In the following sections, we make a brief mathematical description of the problem,
together with a numerical model of our particular problem. Afterwards, we describe the
image capturing and processing methods in order to obtain the displacements in the
column. Our results are compared both with those obtained through the accelerometers
and with the numerical calculation based on a finite element model for this problem.
2. PROBLEM DESCRIPTION
The aim of this paper is to propose an alternative low cost method to measure the
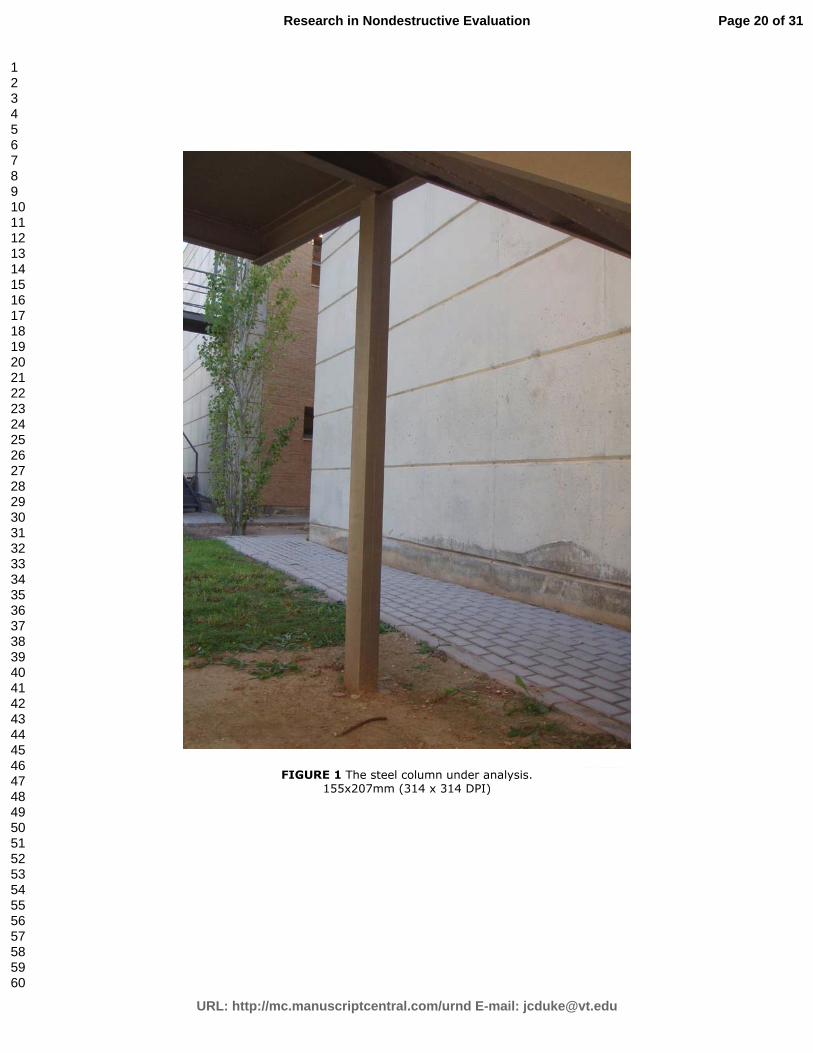
displacements in a column due to an impact. To this end, we selected a 2.1 m length
steel column composed by two welded UPN-100 beams forming a hollow column. The
two ends of the column are fixed to the floor and to one larger steel structure, as can be
seen in figure 1.
A steel ball of 0.44 kg was used as projectile for the impact. This ball was mounted in a
pendulum of 1.5 m, hanging from the upper part of the column. By releasing pendulum
form a fixed height, we ensure the repeatability of the experiment.
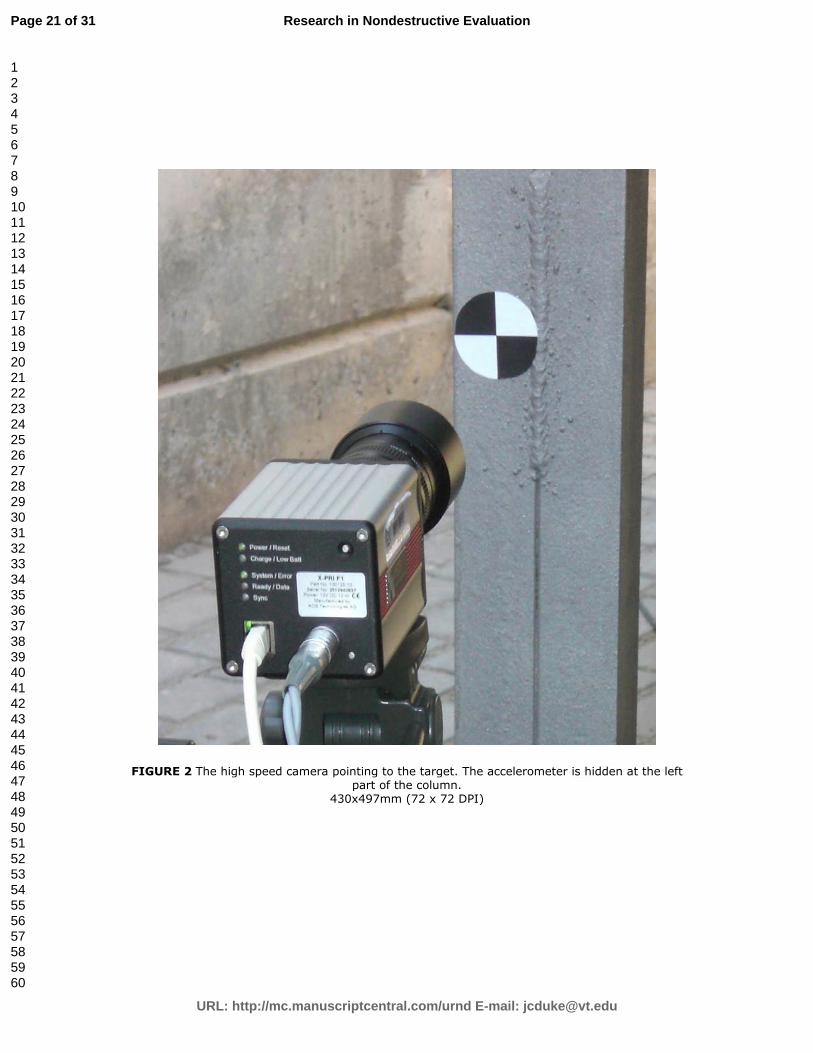
The column vibration after the impact was registered with an accelerometer located at
the impact height in the opposite side of the column. At the same height, in a lateral side
of the column, an image target of 5 cm of diameter was attached. The movement of the
target was registered by a high speed (X-PRI AOS Technologies AC) working at 1000
fps with a spatial resolution of 800x560 located at 1 m from the column (see figure 2).
In order to have a sharp and luminous image, a Navitar Zoom 7000 Macro Lens was
attached to the camera. The camera was connected to a laptop through an Ethernet
connection, so no special acquisition devices were needed.
Page 8 of 31
URL: http://mc.manuscriptcentral.com/urnd E-mail: [email protected]
Research in Nondestructive Evaluation
123456789101112131415161718192021222324252627282930313233343536373839404142434445464748495051525354555657585960
For Peer Review O
nly
3. IMAGE PROCESSING TECHNIQUES
Seven impacts were recorded with the camera and the accelerometer. The target was
designed as a round circle with alternative black and white quadrants (see figure 2). The
camera acquired sequences of 3 seconds for each impact that were saved and then
processed off-line with our own software developed in Matlab (The Mathworks inc.).
All image processing is done on binary images, so the first step consists in selecting a
proper threshold value. Since the image is composed of black and white areas, any
intermediate gray value will provide correct results, so the mean value of the first frame
in the sequence was selected and the rest of them were thresholded according to this
parameter.
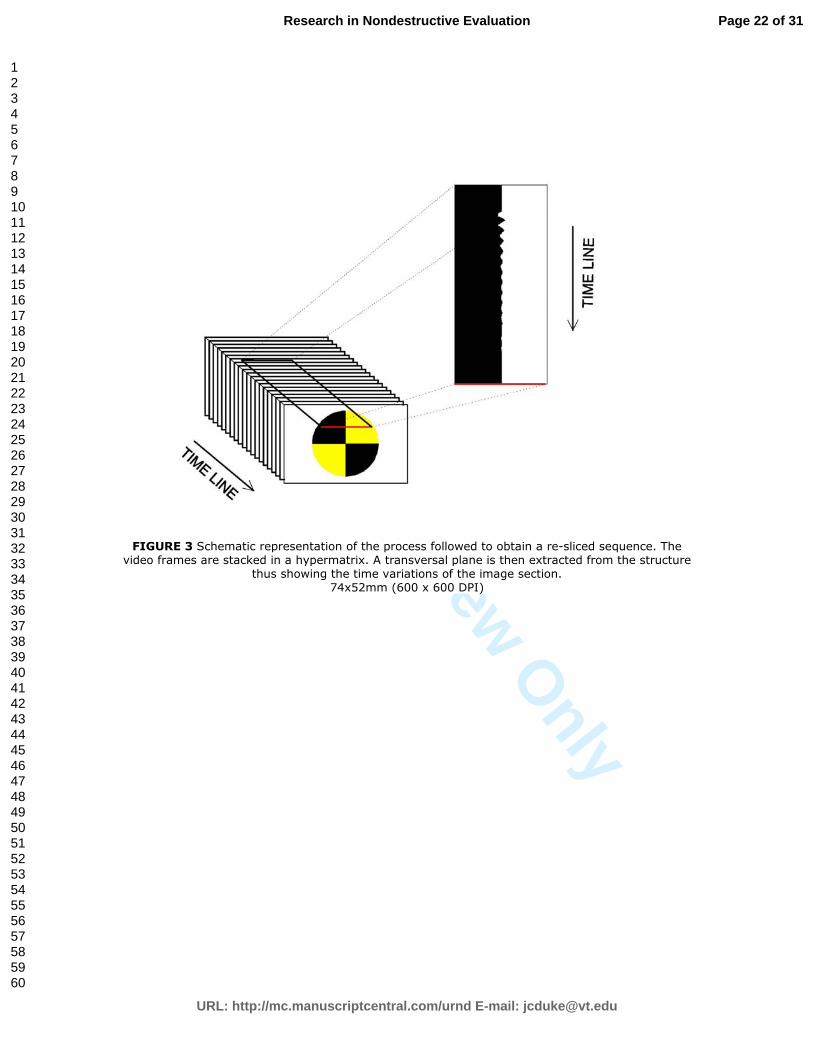
Processed images from the video sequence are arranged in a stack thus forming a 3D
hypermatrix. The procedure is similar to that used in tomography. Such structure allows
3D reslicing of the sequence thus getting different time sections of the image, as it is
shown in figure 2. Depending on the specialization field, these sections are also called
M-scans or kymograms. In this particular case, in order to analyze the movement of the
target in the impact direction, we select a horizontal scan line crossing the vertical
border between two consecutive quadrants. So obtained sections are disposed as rows in
a new image matrix, which allow a direct observation of the temporal sequence thus
making clear the movement dynamics (figure 3).
The reader should notice that this first step allows direct visualization of the column
vibration. Although we used some pre-processing of the image, direct reslicing of the
video sequence can be done by using free software like ImageJ [19], an open source
program devoted to numerical processing of biological and tomographic images. This
Page 9 of 31
URL: http://mc.manuscriptcentral.com/urnd E-mail: [email protected]
Research in Nondestructive Evaluation
123456789101112131415161718192021222324252627282930313233343536373839404142434445464748495051525354555657585960
For Peer Review O
nly
simple processing provides a fast and immediate analysis of the dynamic process
previous to any numerical filtering and processing of the signal.
A quantitative estimation of the amplitude, frequency and damping of the vibration can
be calculated from the obtained scan. Notice that every binary segment forming the
rows of the time sequence can be considered as a Heaviside step function. The
derivative of such function is a delta function which localizes the position of the border
and thus, allows obtaining relative position in pixels of the target in each frame. The
conversion from pixels (px) to millimeters can be easily done since the real size of the
target is known and, from the first frame, we can directly obtain the relation between
real and image sizes. This relation depends on the CCD structures and the zooming
system. In our case this conversion value is 50 px/mm, thus giving an accuracy of 0.02
mm.
4. NUMERICAL SIMULATION THROUGH FINITE ELEMENTS MODELS
The problem under study has been implemented in a Finite Element Model (FEM) and a
modal and dynamic analysis was performed. The FEM was created in LSDYNA code
[20]. The column was modelled with SOLID element. This type of element is
hexahedral shaped and is defined by 8 nodes with 3 degrees of freedom per node. The
size of the elements was 10x10x50 mm, thus the column model having 2077 elements
with 3506 nodes. The steel was modelled as an elastic-plastic material with a Young
modulus of 210 GPa, Poisson modulus 0.3, density 7850 kg/m3 and yield strength 275
MPa. The column was modelled as a two pinned beam. A modal analysis was
performed to find the first 20 modes and to validate the column model thought
comparison with analysis of data recorded. The frequencies (in Hertz) of these modes
are shown in table 1.
Page 10 of 31
URL: http://mc.manuscriptcentral.com/urnd E-mail: [email protected]
Research in Nondestructive Evaluation
123456789101112131415161718192021222324252627282930313233343536373839404142434445464748495051525354555657585960
For Peer Review O
nly
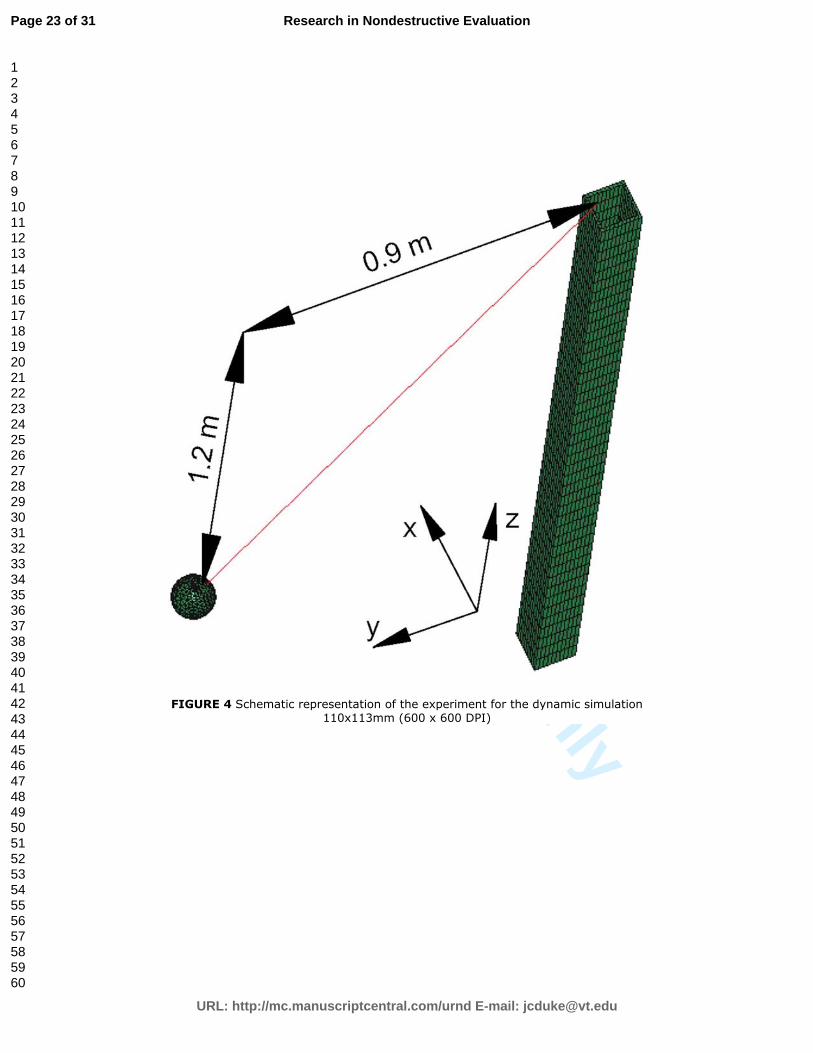
In order to perform the dynamic analysis, a spherical ball was modelled hanging by a
thread of 1 mm of diameter fixed to the upper part of the column. The ball was meshed
with 4 nodes tetrahedral SOLID elements and it has been modelled with the same
material than the column. Figure 4 shows the complete model for dynamic calculations.
In both modal and dynamic analyses, the y axis match the direction of the impact and
the z axis is vertical.
The ball was placed 1.2 m high from the upper part and 0.9 m far from the column.
Starting in this position, the ball is released and, by the only force of gravity, the ball
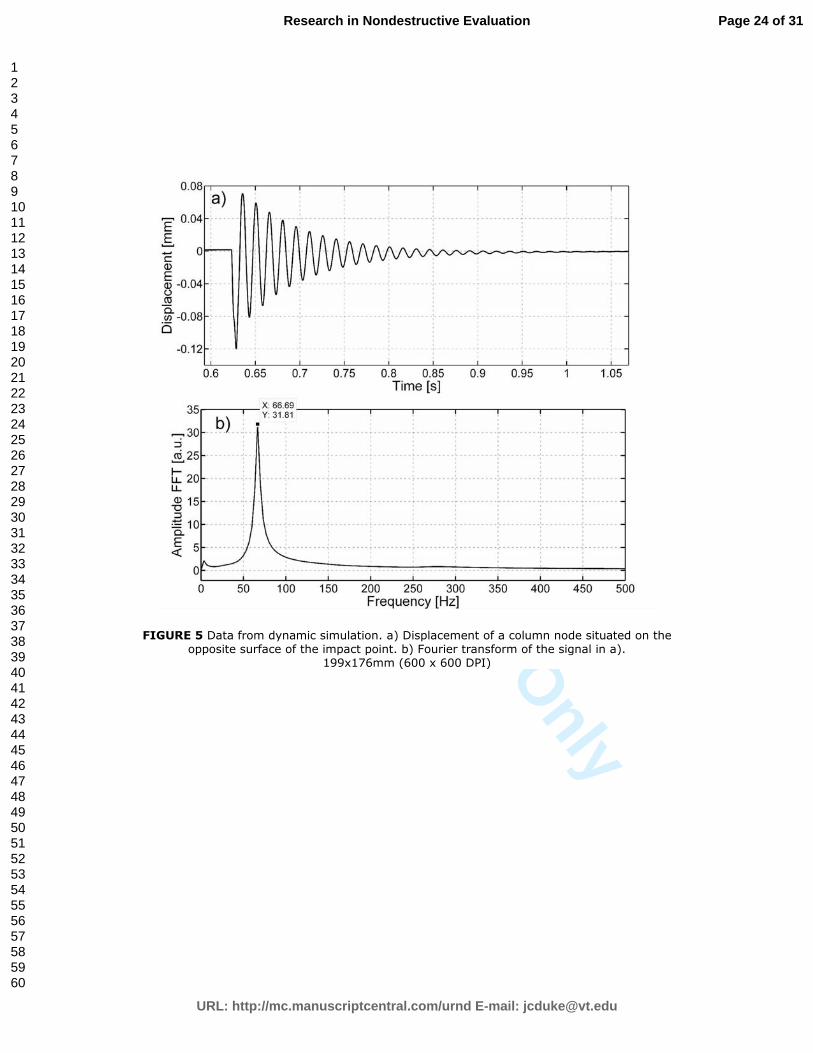
strikes the column and rebounds. Through this dynamic analysis we find, inter alia, the
displacement of the all nodes and, in particular, of one node situated at the same height
of the point of impact and in the exterior x surface of the column. This displacement is
shown in figure 5 a).
The Fourier transform of the signal provides information about the main modes being
excited with the impact. As can be seen in figure 5 b), the vibration is monomodal and
corresponds to the first mode of the vibration analysis (see Table 1). Monomodal
vibrations are easy to analyze, since the movement can be described as an attenuated
oscillation as
( )·( ) sin 2tx t Ae f t
µ π φ−= ⋅ + ; (1)
where A is the amplitude of the oscillation, f is the linear frequency, µ is the attenuation
constant, and φ is a boundary constant. Data form the dynamic simulation has been
fitted to (1) by a least squared method (LSM), thus obtaining the values in expression (2)
for the parameters (with 95% confidence bounds), in which the subindex d refers to the
dynamic simulation, with a correlation coefficient 2 0.9917r = . The confidence bounds
are shown between brackets.
Page 11 of 31
URL: http://mc.manuscriptcentral.com/urnd E-mail: [email protected]
Research in Nondestructive Evaluation
123456789101112131415161718192021222324252627282930313233343536373839404142434445464748495051525354555657585960
For Peer Review O
nly
1 1 1
A = 0.0933 mm [0.0936 mm, 0.0943 mm]
= -1.572 rad [-1.575 rad, -1.568 rad]
= 14.67 s [14.60 s ,14.75 s ]
= 66.7 Hz [66.5 Hz, 66.8 Hz]
d
d
d
df
φ
µ − − − (2)
5. RESULTS
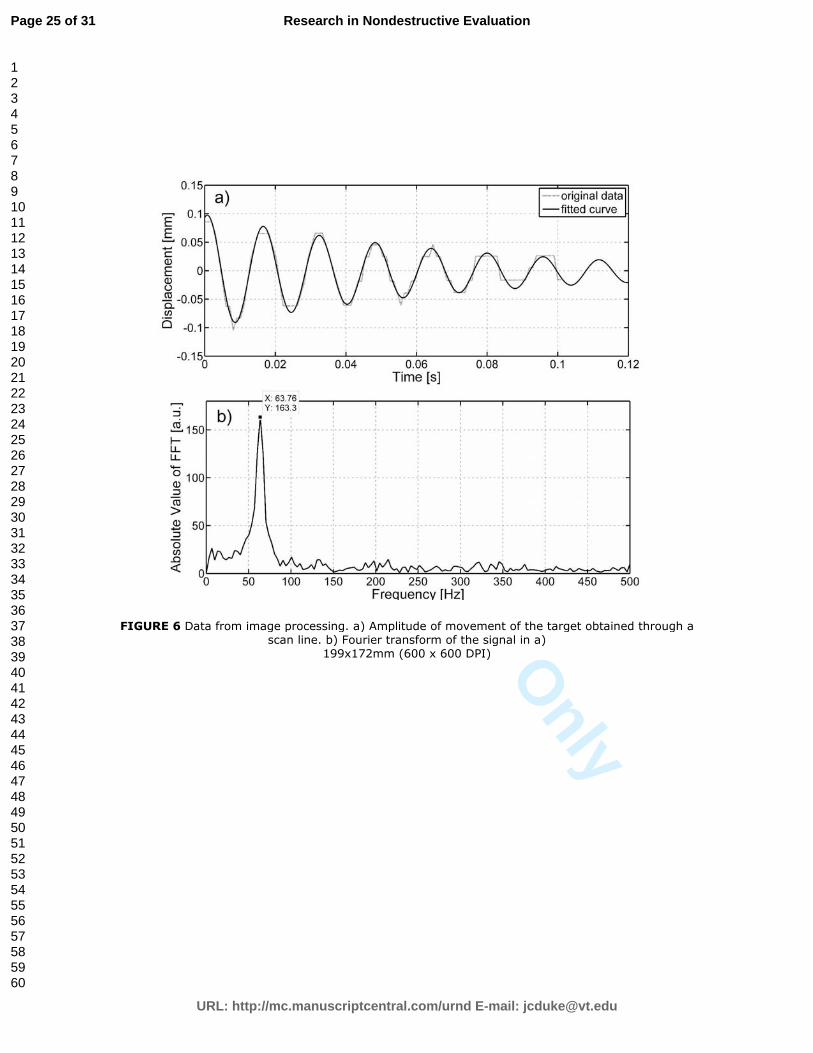
The curve obtained from a single scan line (fig. 3), permits analyzing the vibration of
the column. In figure 6a, we show the curve obtained from one segment after re-slicing
the video sequence of one impact. After computing the Fourier transform of this signal
(figure 6b), we show that the oscillation can also be considered monomodal. The LSM
fitting to equation (1) provides the values in expression (3), where subindex s refers to
single scan line, with a correlation coefficient of 2 0.9620r = . The confidence bounds
are shown between brackets.
1 1 1
A = 0.1005 mm [0.0943 mm, 0.1066 mm]
= 7.536 rad [7.47 rad, 7.602 rad]
= 13.97 s [12.33 s ,15.61 s ]
= 63.1 Hz [62.8 Hz, 63.4 Hz]
s
s
s
sf
φ
µ − − − (3)
The selection of one single scan line (see figure 3) is subjected to the arbitrariness of the
researcher. At high magnifications, the border profile appears rough. Moreover, the
image can be affected of sun glares, scratches, irregularities, etc. In an attempt to
eliminate this source of error, we have extended the study to a large number of segments.
A large rectangle containing a big part of the vertical border in the target is selected and
all the rows in this rectangle are analyzed. Only the data with a 2r larger than 0.85 in
the LSM fitting, have been analyzed. In practice, this means that around 320 line scans
have been analyzed for each impact and only 5% of the scanning lines have been
rejected. We have obtained the mean and standard deviation of the parameters of eq. (1)
for each impact. In table 2, the values obtained for the seven impacts performed are
Page 12 of 31
URL: http://mc.manuscriptcentral.com/urnd E-mail: [email protected]
Research in Nondestructive Evaluation
123456789101112131415161718192021222324252627282930313233343536373839404142434445464748495051525354555657585960
For Peer Review O
nly
presented. The value for the constant φ has been omitted from the analysis since it is
different for each scan line and it does not add any relevant physical information.
The results presented in eq. 3, which correspond to one single scan from Test 1, are
slightly different to those in eq. 2 due to statistical variations. We would like to point
out that results obtained through the high speed camera are in very good coincidence
with those provided by the dynamic simulation in the three relevant parameters
(amplitude, damping and vibration frequency), thus confirming the usefulness of the
tool here developed.
In order to have an additional experimental confirmation of our results, the data
obtained with the high speed camera have been compared with those provided by an
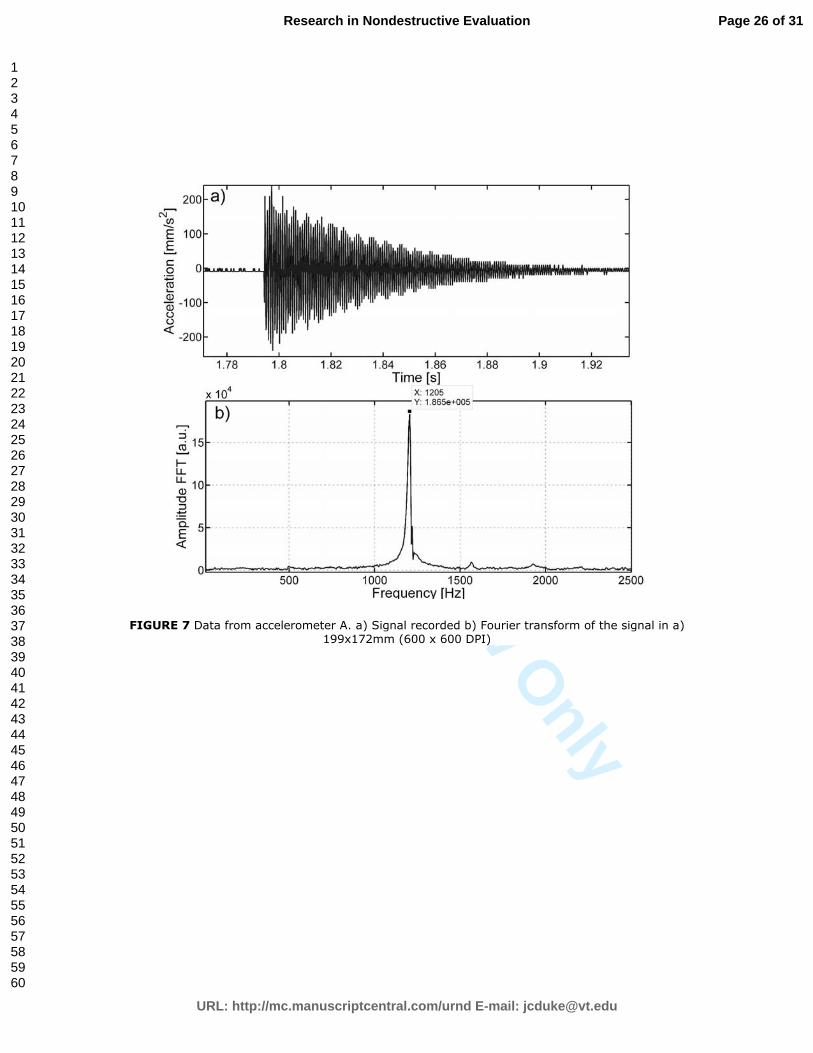
accelerometer attached to the column. The impact was firstly monitorized with
accelerometer A (Shock 350B03 PCB Piezotronics), with a measurement range of
±10000g and a frequency range from 0.4 to 10000 Hz. The registered signal and its
Fourier transform are plotted in figure 7a) and 7b), respectively.
One can see there that this impact is also monomodal but the registered mode is quite
different from that obtained by the HS camera and the dynamic simulation. According
to the results of the modal analysis of the column, the registered vibration corresponds
to a combination of modes 11 to 13 in Table 1. This vibration may come from an impact
of the ball in a slightly deviated position from the center but, in any case, it is not the
main vibration mode. The existence in the structure of the lowest mode at 64 Hz was
checked in a second experiment by placing the accelerometer B (Structural 333B50
PCB Piezotronics), with a measurement range of ±5g and a frequency range from 0.5 to
3000 Hz. A weak impact in the same place but with an Impulse Force Hammer (Kistler,
type 9728A20000) was performed and the registration of the fundamental mode was
possible.
Page 13 of 31
URL: http://mc.manuscriptcentral.com/urnd E-mail: [email protected]
Research in Nondestructive Evaluation
123456789101112131415161718192021222324252627282930313233343536373839404142434445464748495051525354555657585960
For Peer Review O
nly
The question that arises here is why there is no evidence of the first mode in the
acceleration signal registered with accelerometer A. Assuming monomodal vibration,
the acceleration can be calculated from the second derivative of expression (1):
( ) ( ) ( )· 2 2(2 ) sin 2 4 cos 2ta Ae f f t f f t
µ µ π π φ πµ π φ− = − ⋅ + + ⋅ + (4)
For the measured values of A, f and µ shown in Table 2, the calculated acceleration
through eq. 4 gives an absolute maximum peak of 4 21.5 10 mm/s× (1.5 g). A careful
analysis of the signal shows that the dark current in the accelerometer A measuring
setup provoked impulsional noise of amplitude ±5g, which masks the acceleration due
to the lowest mode (1.5g).
For the impact here performed, the accelerometer A is not capable of registering the
acceleration due to the lowest mode while the accelerometer B is not capable of giving a
good signal but a saturated one. Although this could be solved by correct selection of
the accelerometer, in many cases the maximum expected acceleration is unknown so a
correct prior election is not always possible. Even it may happen that measurements can
only be taken in one single session and the system has to be robust enough to provide
good results with only one trial.
The situation here described illustrates one of the advantages of our system. The
amplitude of acceleration linearly depends on the square of the frequency for low
damping constants. This effect is especially noticeable when strong impacts occur and
many modes are excited at the same time. Since acceleration based devices are very
sensitive to high frequencies, the lowest modes, which produce the highest
displacements, can be masked and interpretation of the signal may lead to wrong
conclusions.
Otherwise, it should be noted that, since the sampling frequency of the camera is set to
1000 Hz, it is not able to register the movement associated with the frequency of 1200
Page 14 of 31
URL: http://mc.manuscriptcentral.com/urnd E-mail: [email protected]
Research in Nondestructive Evaluation
123456789101112131415161718192021222324252627282930313233343536373839404142434445464748495051525354555657585960
For Peer Review O
nly
Hz, as it is shown in figure 7b. However, as can be seen in table 1, all the movements
with a frequency around 1200 Hz are rhomboidal deformations of the section; then the
movement of the target is in the direction of the optical axis of the camera, and thus it is
not visible with the actual setup. Moreover, in the finite element simulation, this 1200
Hz frequency does not appear due to the complete symmetry of the impact, unlike the
reality, in which small deviation of the ball during its fall can cause this kind of
movements.
6. APPLICATIONS
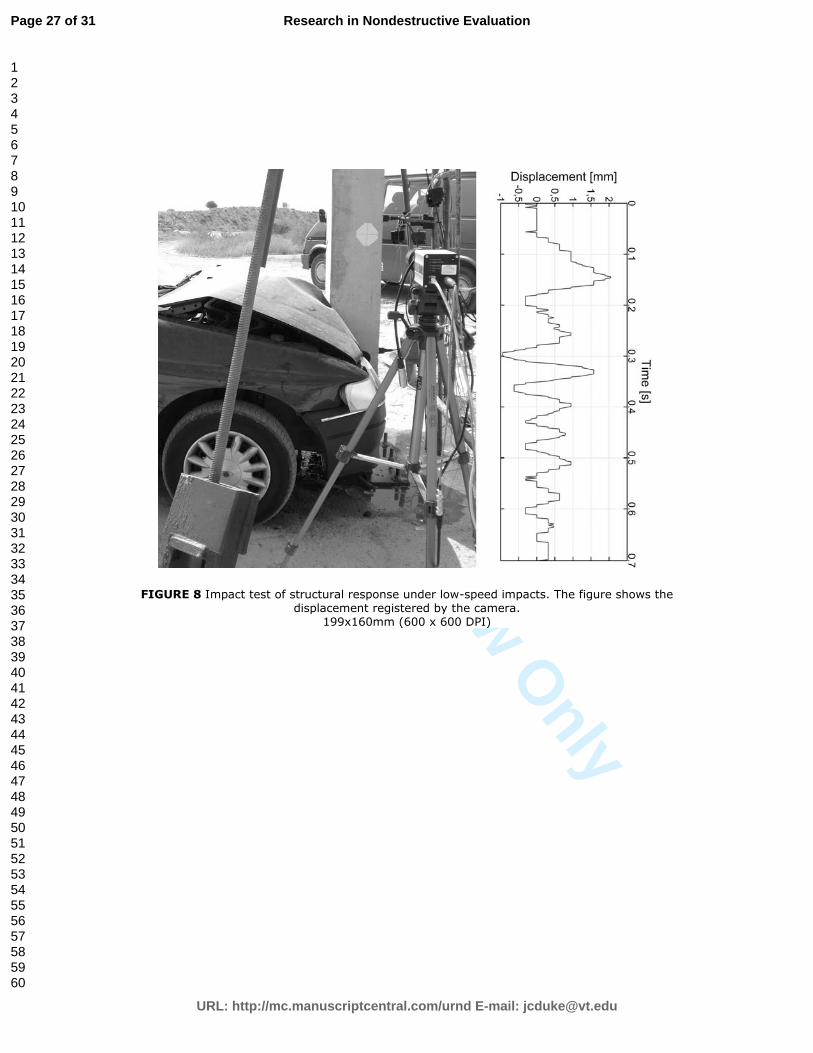
The system here presented has been used in a real scale experiment for testing building
structures under low speed car impacts [21]. The aim of the experiment was to register
the maximum displacement and vibration modes of a concrete column. This parameter
is important for analyzing the stresses on the structure under dynamic loading [2] and to
determine its integrity. In figure 8, we show a picture of the crash test together with the
displacement registered by the camera. The column was monitorized through several
accelerometers (ACC), linear displacement sensors (LDS) and the high speed camera
(HSC). Accelerometers and linear displacement sensors were screwed to the column.
LDS were also hold by a parallel structure. For safety reasons and in order to avoid
influence from ground vibration the camera was situated at 2.5 m away from the column.
Accelerometers provided valuable information about vibration modes, but the noise in
the signal did not allow double integration for displacement calculation. Linear
displacement sensors also failed, since the parallel structure to which they were attached
was too close to the column and it was influenced by the ground vibrations. Only data
obtained from the camera were reliable and allowed us to obtain the maximum
displacement (Table 3). Vibration frequencies obtained from the camera were in
Page 15 of 31
URL: http://mc.manuscriptcentral.com/urnd E-mail: [email protected]
Research in Nondestructive Evaluation
123456789101112131415161718192021222324252627282930313233343536373839404142434445464748495051525354555657585960
For Peer Review O
nly
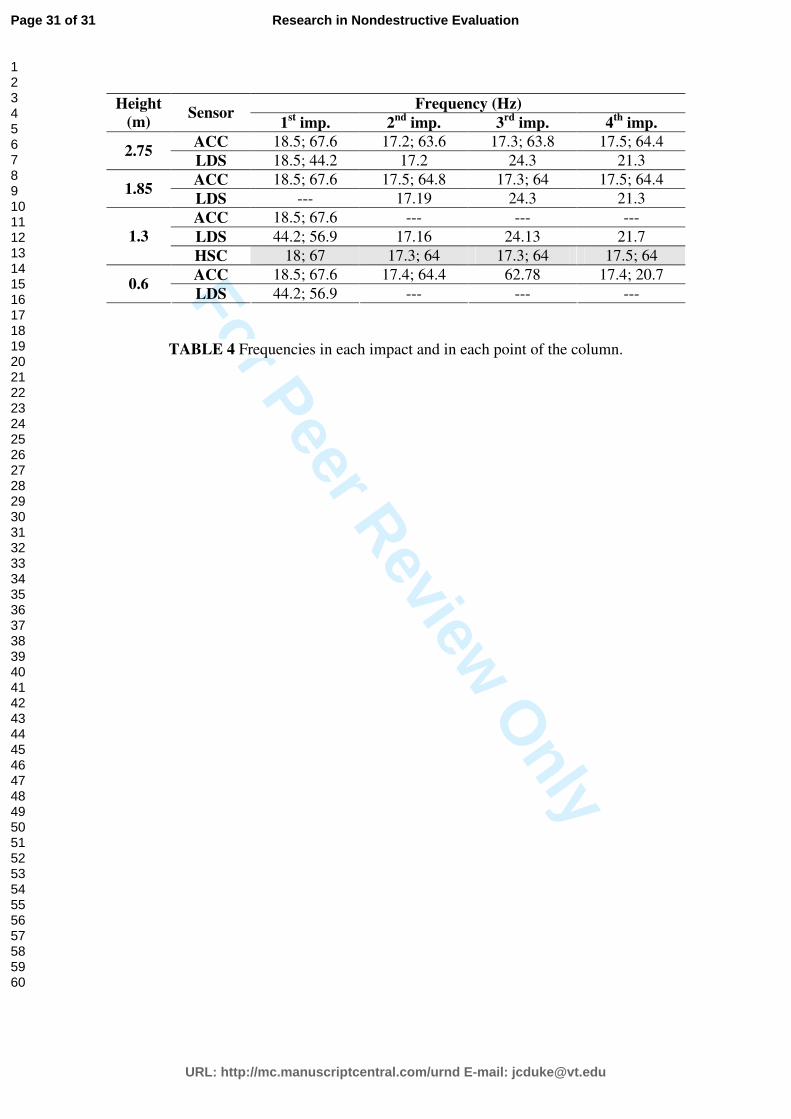
coincidence with those obtained with the accelerometers (Table 4). Notice that in both
tables, there are empty cells. Those are measurements where signal noise impeded
obtaining a clear result.
Crash tests were conducted for experimentally testing the parameters established by the
Eurocode 1 [3]. We can see that, in general, LDS are not reliable for measuring the
displacement of a structure. Although provided displacements are of the same order of
magnitude than those obtained with the camera, the lack of repeatability makes them
inaccurate for our proposal. The reader should notice the good coincidence between the
frequency registered by the camera and by the accelerometers. It is remarkable that
accelerometer at the impact point (0.6 meters) did not work correctly, probably due to
the violence of the car crash. These facts confirm that, for some applications, image
based non contact methods are more robust than traditional electronic systems.
7. CONCLUSIONS
We have used an image based method for non contact measurement of displacements
and vibrations on a structure. Images of an impact were recorded with a high speed
camera at 1000 fps. A convenient re-slicing of the video sequence allows direct
visualization of the structure displacement and obtaining the main parameters of the
vibrating movement. In order to have some reference data about the real movement of
the column, we used some accelerometers and we did a finite element model which
reflects the actual behavior of the column. The obtained results through the re-slicing of
the video sequence were successfully compared with those obtained from a FEM model
and showed to be consistent with accelerometers, thus showing the accuracy of the
procedure.
Page 16 of 31
URL: http://mc.manuscriptcentral.com/urnd E-mail: [email protected]
Research in Nondestructive Evaluation
123456789101112131415161718192021222324252627282930313233343536373839404142434445464748495051525354555657585960
For Peer Review O
nly
The method can overcome a common limitation of the accelerometer for registering low
frequencies under strong impacts and avoids the need for adequate a priori choice of the
accelerometer, when the maximum acceleration of the signal to be recorded is unknown.
This is very important when there is only one opportunity of measuring. Furthermore,
with this technique, double integration of the acceleration for displacement calculation
is not needed.
This method can be useful in the measurement of displacement of structures as bridges
under rail traffic, buildings under earthquake or slender structures subjected to the wind,
where contact measurements are difficult or even impossible. Determination of the
accuracy of the method is difficult, due to the variety of situations where it can be
applicable. An adequate combination of the CCD resolution, the objective and the
distance to the target will determine the performance of the method and the limitation of
the system. These parameters have to be adjusted according to the expected
displacement distances. As a rule of thumb, the system has to be able to detect
displacements of at least 2 pixels. Detection below this limit will not be reliable and the
method will not be applicable.
Although the camera here used is somehow expensive, the same experiment can be
implemented with a camera taking 200 fps, thus making a low cost, fast and accurate
method to analyze the movement of a structure.
The distinctiveness fact that the movement of the studied point can be directly seen with
a simple procedure helps very much to interpret results. All this features make this
method interesting and powerful to the study of the behavior of the structures during
dynamic excitation.
Page 17 of 31
URL: http://mc.manuscriptcentral.com/urnd E-mail: [email protected]
Research in Nondestructive Evaluation
123456789101112131415161718192021222324252627282930313233343536373839404142434445464748495051525354555657585960
For Peer Review O
nly
REFERENCES
[1] Gentile C, Saisi A. Ambient vibration testing of historic masonry towers for
structural identification and damage assessment. Constr Build Mater. 2007 Jun 21; 6:
1311-1321
[2] Chopra AK 2001. Equations of Motion, Problem Statement and Solution Methods.
In Stenquist B, Scherwatzky K, editors. Dynamic of structures: Theory and applications
to earthquake engineering, 2nd
Ed., New Jersey: Prentice-Hall, Englewood Cliffs; 2001.
p. 23-25.
[3] Eurocode 1: Actions on structures – Part 2-7: Accidental actions due to impact and
explosions. ENV 1991-2-7, European committee for Standardization, June 1998.
[4] Minimun Design Loads for Buildings and Other Structures. ASCE STANDARD,
ASCE/SEI 7-05, American Society of Civil Engineers, 2006.
[5] Park KT, Kim SH, Lee KW. Eng Struct. 2005; 27: 371-8.
[6] Yang J, Li JB, Lin G. Soil Dyn Earthq Eng. 2006; 26: 725-734.
[7] Stiros SC. Soil Dyn Earthq Eng. 2008; 28: 415-420.
[8] Cunha A, Caetano E, Delgado R. J Bridge Eng ASCE. 2001; 6(1): 54-62.
[9] Nassif HN, Gindy M, Davis J. NDT & E Int. 2005; 38(3): 213-128
[10] Pieraccini M, Fratini M, Parrini F, Atzeni C, Bartoli G. NDT & E Int. Jun. 2008;
41(4): 258-264.
[11] Gentile C, Bernardini G. NDT & E Int. 2008; 41(7): 544-553.
[12] Castellini P, Martarelli M, Tomasini EP. Mech syst signal pr. 2006; 20: 1265-1285.
[13] Bartoli G, Facchini L, Pieraccini M, Fratini M, Atzeni C. Struct. Control Health
Monit. Apr. 2008; 15 (3): 283-298.
[14] Pieraccini M, Fratini M, Parrini F, Atzeni C. IEEE T Geosci Remote Sens. Nov.
2006; 40 (11): 3284-3288.
Page 18 of 31
URL: http://mc.manuscriptcentral.com/urnd E-mail: [email protected]
Research in Nondestructive Evaluation
123456789101112131415161718192021222324252627282930313233343536373839404142434445464748495051525354555657585960
For Peer Review O
nly
[15] Nickitopoulou A, Protopsalti K, Stiros S. Eng Struct. Aug. 2006; 28 (10): 1471-
1482.
[16] Hack E, Leroy D. Opt Lasers Eng. 2005; 43: 455-474.
[17] Wahbeh AM, Caffrey JP, Masri SF. Smart Mater Struct. 2003; 12: 785-794
[18] Lee JJ, Shinozuka M. NDT & E Int. 2006; 39: 425-431.
[19] Image Processing and analysis with Java, http://rsb.info.nih.gov/ij/
[20] LS-DYNA Keyword user’s manual, version 970. © Livermore Software
Technology Corporation. April 2003.
[21] Ferrer B, Ivorra S, Irles R, Mas D, Real size experiments of car crash against
building column, 11th
International Conference on Structures Under Shock and Impact
(SUSI 2010), Tallin (Estonia), July 2010.
Page 19 of 31
URL: http://mc.manuscriptcentral.com/urnd E-mail: [email protected]
Research in Nondestructive Evaluation
123456789101112131415161718192021222324252627282930313233343536373839404142434445464748495051525354555657585960
For Peer Review O
nly
FIGURE 1 The steel column under analysis. 155x207mm (314 x 314 DPI)
Page 20 of 31
URL: http://mc.manuscriptcentral.com/urnd E-mail: [email protected]
Research in Nondestructive Evaluation
123456789101112131415161718192021222324252627282930313233343536373839404142434445464748495051525354555657585960
For Peer Review O
nly
FIGURE 2 The high speed camera pointing to the target. The accelerometer is hidden at the left part of the column.
430x497mm (72 x 72 DPI)
Page 21 of 31
URL: http://mc.manuscriptcentral.com/urnd E-mail: [email protected]
Research in Nondestructive Evaluation
123456789101112131415161718192021222324252627282930313233343536373839404142434445464748495051525354555657585960
For Peer Review O
nly
FIGURE 3 Schematic representation of the process followed to obtain a re-sliced sequence. The video frames are stacked in a hypermatrix. A transversal plane is then extracted from the structure
thus showing the time variations of the image section. 74x52mm (600 x 600 DPI)
Page 22 of 31
URL: http://mc.manuscriptcentral.com/urnd E-mail: [email protected]
Research in Nondestructive Evaluation
123456789101112131415161718192021222324252627282930313233343536373839404142434445464748495051525354555657585960
For Peer Review O
nly
FIGURE 4 Schematic representation of the experiment for the dynamic simulation 110x113mm (600 x 600 DPI)
Page 23 of 31
URL: http://mc.manuscriptcentral.com/urnd E-mail: [email protected]
Research in Nondestructive Evaluation
123456789101112131415161718192021222324252627282930313233343536373839404142434445464748495051525354555657585960
For Peer Review O
nly
FIGURE 5 Data from dynamic simulation. a) Displacement of a column node situated on the opposite surface of the impact point. b) Fourier transform of the signal in a).
199x176mm (600 x 600 DPI)
Page 24 of 31
URL: http://mc.manuscriptcentral.com/urnd E-mail: [email protected]
Research in Nondestructive Evaluation
123456789101112131415161718192021222324252627282930313233343536373839404142434445464748495051525354555657585960
For Peer Review O
nly
FIGURE 6 Data from image processing. a) Amplitude of movement of the target obtained through a scan line. b) Fourier transform of the signal in a)
199x172mm (600 x 600 DPI)
Page 25 of 31
URL: http://mc.manuscriptcentral.com/urnd E-mail: [email protected]
Research in Nondestructive Evaluation
123456789101112131415161718192021222324252627282930313233343536373839404142434445464748495051525354555657585960
For Peer Review O
nly
FIGURE 7 Data from accelerometer A. a) Signal recorded b) Fourier transform of the signal in a) 199x172mm (600 x 600 DPI)
Page 26 of 31
URL: http://mc.manuscriptcentral.com/urnd E-mail: [email protected]
Research in Nondestructive Evaluation
123456789101112131415161718192021222324252627282930313233343536373839404142434445464748495051525354555657585960
For Peer Review O
nly
FIGURE 8 Impact test of structural response under low-speed impacts. The figure shows the displacement registered by the camera.
199x160mm (600 x 600 DPI)
Page 27 of 31
URL: http://mc.manuscriptcentral.com/urnd E-mail: [email protected]
Research in Nondestructive Evaluation
123456789101112131415161718192021222324252627282930313233343536373839404142434445464748495051525354555657585960

For Peer Review O
nly
MODE FREQUENCY
(Hz)
DESCRIPTION OF MOVEMENT
1 66.87 Displacement, y direction,1/2 wavelenght
2 71.21 Displacement, x direction, 1/2 wavelenght
3 261.31 Displacement, y direction, 1 wavelenght
4 274.92 Displacement, x direction, 1 wavelenght
5 566.36 Displacement, y direction, 3/2 wavelenght
6 584.84 Displacement, x direction, 3/2 wavelenght
7 662.67 Torsion, z direction, 1/2 wavelenght
8 957.76 Displacement, y direction, 2 wavelenght
9 966.00 Displacement, x direction, 2 wavelenght
10 1044.35 Displacement, z direction, 2 wavelenght
11 1194.66 Rhomb shape, plane x=y, 1 wavelenght
12 1201.42 Rhomb shape, plane x=y, 1 wavelenght
13 1280.79 Rhomb shape, plane x=y, 3/2 wavelenght
14 1345.35 Torsion, z direction, 1 wavelenght
15 1381.54 Displacement, y direction, 5/2 wavelenght
16 1407.67 Displacement, x direction, 5/2 wavelenght
17 1415.57 Rhomb shape, plane x=y, 2 wavelenght
18 1631.95 Rhomb shape, plane x=y, 2 wavelenght
19 1797.75 Displacement, x direction, 3 wavelenght
20 1885.34 Displacement, y direction, 3 wavelenght
TABLE 1 Vibration modes for the steel column in the finite element model. In the right
column the vibration is described by giving the type of movement, its direction and the
number of waves included in the total column length.
Page 28 of 31
URL: http://mc.manuscriptcentral.com/urnd E-mail: [email protected]
Research in Nondestructive Evaluation
123456789101112131415161718192021222324252627282930313233343536373839404142434445464748495051525354555657585960

For Peer Review O
nly
A(mm) µ (s-1
) f (Hz)
Test 1 0.097±0.005 15.2±1.2 62.9±0.1
Test 2 0.090±0.004 16.6±1.5 63.1±0.1
Test 3 0.098±0.005 15.0±1.3 62.8±0.2
Test 4 0.099±0.005 15.1±1.5 62.8±0.2
Test 5 0.099±0.003 15.0±1.2 62.6±0.1
Test 6 0.101±0.004 15.6±1.1 62.5±0.1
Test 7 0.102±0.004 15.1±1.0 62.5±0.1
Average 0.098±0.004 15.1±1.3 62.7±0.2
TABLE 2 Average results from 320 (approx) scan lines for the different tests
performed.
Page 29 of 31
URL: http://mc.manuscriptcentral.com/urnd E-mail: [email protected]
Research in Nondestructive Evaluation
123456789101112131415161718192021222324252627282930313233343536373839404142434445464748495051525354555657585960

For Peer Review O
nly
Maximum registered displacement (mm) Height
(m) Sensor
1st imp. 2
nd imp. 3
rd imp. 4
th imp.
2.75 LDS 2.1 1.2 2.7 1.8
1.85 LDS --- 4.4 5.7 3.8
1.3 LDS 3.8 1.8 2.6 1.7
1.3 HSC 1.8 2.1 2 1.8
TABLE 3 Maximum displacement registered in each impact and in each point of the
column.
Page 30 of 31
URL: http://mc.manuscriptcentral.com/urnd E-mail: [email protected]
Research in Nondestructive Evaluation
123456789101112131415161718192021222324252627282930313233343536373839404142434445464748495051525354555657585960
For Peer Review O
nly
Frequency (Hz) Height
(m) Sensor
1st imp. 2
nd imp. 3
rd imp. 4
th imp.
ACC 18.5; 67.6 17.2; 63.6 17.3; 63.8 17.5; 64.4 2.75
LDS 18.5; 44.2 17.2 24.3 21.3
ACC 18.5; 67.6 17.5; 64.8 17.3; 64 17.5; 64.4 1.85
LDS --- 17.19 24.3 21.3
ACC 18.5; 67.6 --- --- ---
LDS 44.2; 56.9 17.16 24.13 21.7 1.3
HSC 18; 67 17.3; 64 17.3; 64 17.5; 64
ACC 18.5; 67.6 17.4; 64.4 62.78 17.4; 20.7 0.6
LDS 44.2; 56.9 --- --- ---
TABLE 4 Frequencies in each impact and in each point of the column.
Page 31 of 31
URL: http://mc.manuscriptcentral.com/urnd E-mail: [email protected]
Research in Nondestructive Evaluation
123456789101112131415161718192021222324252627282930313233343536373839404142434445464748495051525354555657585960
Related Documents