Optical Coherence Tomography Longitudinal Evaluation of Retinal Nerve Fiber Layer Thickness in Glaucoma Gadi Wollstein, MD 1,2 , Joel S Schuman, MD 1,2 , Lori L Price, MS 3 , Ali Aydin, MD 1 , Paul C Stark, ScD 3 , Ellen Hertzmark, MA 4 , Edward Lai, BSc 1 , Hiroshi Ishikawa, MD 1,2 , Cynthia Mattox, MD 1 , James G Fujimoto, PhD 5 , and Lelia A Paunescu, PhD. 1 1 New England Eye Center, Tufts-New England Medical Center, Tufts University School of Medicine, Boston, MA 2 UPMC Eye Center, University of Pittsburgh, Pittsburgh, PA 3 Biostatistics Research Center, Division of Clinical Care Research, Tufts-New England Medical Center, Tufts University School of Medicine, Boston, MA 4 Department of Epidemiology, Harvard School of Public Health, Boston, MA 5 Department of Electrical Engineering and Research Laboratory of Electronics, Massachusetts Institute of Technology, Cambridge, MA Abstract Objectives— To longitudinally evaluate optical coherence tomography (OCT) peripapillary retinal nerve fiber layer (RNFL) thickness measurements and to compare RNFL thickness over time to clinical status and automated perimetry. Methods— Retrospective evaluation of 64 eyes (37 subjects) of glaucoma suspects and glaucoma patients participating in a prospective longitudinal study. All participants had comprehensive clinical assessment, visual field (VF) testing and OCT scanning every 6 months. Field progression was defined as reproducible drop of at least 2dB of VF mean deviation (VF-MD) from baseline visit. OCT progression was defined as reproducible mean RNFL thinning of at least 2μm. Results— With a median follow-up of 4.7 years, subjects had a median of 5 usable OCT scans. The difference in the linear regression slopes of RNFL thickness between glaucoma suspects and glaucoma patients was found to be non-significant for all parameters; however, Kaplan-Meier survival curve analysis demonstrated a higher progression rate by OCT than by VF. 66% of eyes were stable throughout the duration of follow-up, 22% progressed by OCT alone, 9% by VF-MD alone and 3% by both VF and OCT. Conclusions— A greater likelihood of glaucomatous progression was identified by OCT compared to automated perimetry. This might reflect either OCT hypersensitivity or true damage identified by OCT prior to detection by conventional means. Glaucoma is characterized by a combination of structural and functional damage. Previous studies have indicated that structural changes in glaucoma patients as detected by optic disc and/or nerve fiber layer assessment precede functional changes detected by perimetry. 1–10 In recent years glaucoma imaging modalities were incorporated into the management of glaucoma patients. These imaging modalities were designed to detect morphological Correspondence to: Joel S. Schuman, MD, UPMC Eye Center, University of Pittsburgh School of Medicine, 203 Lothrop Street, The Eye and Ear Institute, Suite 816, Pittsburgh, PA 15213. Tel: 412-647-2205, Fax 412-647-5119, e-mail: [email protected]. Proprietary interest: Drs. Schuman and Fujimoto are inventors of OCT. NIH Public Access Author Manuscript Arch Ophthalmol. Author manuscript; available in PMC 2007 August 9. Published in final edited form as: Arch Ophthalmol. 2005 April ; 123(4): 464–470. NIH-PA Author Manuscript NIH-PA Author Manuscript NIH-PA Author Manuscript

Welcome message from author
This document is posted to help you gain knowledge. Please leave a comment to let me know what you think about it! Share it to your friends and learn new things together.
Transcript
Optical Coherence Tomography Longitudinal Evaluation ofRetinal Nerve Fiber Layer Thickness in Glaucoma
Gadi Wollstein, MD1,2, Joel S Schuman, MD1,2, Lori L Price, MS3, Ali Aydin, MD1, Paul CStark, ScD3, Ellen Hertzmark, MA4, Edward Lai, BSc1, Hiroshi Ishikawa, MD1,2, CynthiaMattox, MD1, James G Fujimoto, PhD5, and Lelia A Paunescu, PhD.11 New England Eye Center, Tufts-New England Medical Center, Tufts University School of Medicine, Boston,MA
2 UPMC Eye Center, University of Pittsburgh, Pittsburgh, PA
3 Biostatistics Research Center, Division of Clinical Care Research, Tufts-New England Medical Center,Tufts University School of Medicine, Boston, MA
4 Department of Epidemiology, Harvard School of Public Health, Boston, MA
5 Department of Electrical Engineering and Research Laboratory of Electronics, Massachusetts Institute ofTechnology, Cambridge, MA
AbstractObjectives— To longitudinally evaluate optical coherence tomography (OCT) peripapillary retinalnerve fiber layer (RNFL) thickness measurements and to compare RNFL thickness over time toclinical status and automated perimetry.
Methods— Retrospective evaluation of 64 eyes (37 subjects) of glaucoma suspects and glaucomapatients participating in a prospective longitudinal study. All participants had comprehensive clinicalassessment, visual field (VF) testing and OCT scanning every 6 months. Field progression wasdefined as reproducible drop of at least 2dB of VF mean deviation (VF-MD) from baseline visit.OCT progression was defined as reproducible mean RNFL thinning of at least 2μm.
Results— With a median follow-up of 4.7 years, subjects had a median of 5 usable OCT scans.The difference in the linear regression slopes of RNFL thickness between glaucoma suspects andglaucoma patients was found to be non-significant for all parameters; however, Kaplan-Meiersurvival curve analysis demonstrated a higher progression rate by OCT than by VF. 66% of eyeswere stable throughout the duration of follow-up, 22% progressed by OCT alone, 9% by VF-MDalone and 3% by both VF and OCT.
Conclusions— A greater likelihood of glaucomatous progression was identified by OCT comparedto automated perimetry. This might reflect either OCT hypersensitivity or true damage identified byOCT prior to detection by conventional means.
Glaucoma is characterized by a combination of structural and functional damage. Previousstudies have indicated that structural changes in glaucoma patients as detected by optic discand/or nerve fiber layer assessment precede functional changes detected by perimetry.1–10
In recent years glaucoma imaging modalities were incorporated into the management ofglaucoma patients. These imaging modalities were designed to detect morphological
Correspondence to: Joel S. Schuman, MD, UPMC Eye Center, University of Pittsburgh School of Medicine, 203 Lothrop Street, TheEye and Ear Institute, Suite 816, Pittsburgh, PA 15213. Tel: 412-647-2205, Fax 412-647-5119, e-mail: [email protected] interest: Drs. Schuman and Fujimoto are inventors of OCT.
NIH Public AccessAuthor ManuscriptArch Ophthalmol. Author manuscript; available in PMC 2007 August 9.
Published in final edited form as:Arch Ophthalmol. 2005 April ; 123(4): 464–470.
NIH
-PA Author Manuscript
NIH
-PA Author Manuscript
NIH
-PA Author Manuscript
glaucomatous abnormalities and might improve the ability to detect longitudinal changesutilizing quantitative measurements. Several cross-sectional studies have demonstrated thecapability of these modalities to identify glaucomatous changes.11–25 Limited information,however, is available as to their use for longitudinal glaucoma assessment.9
Optical coherence tomography (OCT) is a high resolution glaucoma imaging device capableof obtaining reproducible retinal and nerve fiber layer thickness measurements.26–28 Thisdevice has been shown in cross-sectional studies to allow differentiation between normals andglaucoma patients.11, 18, 29–35
The purpose of this study is to longitudinally evaluate optical coherence tomography (OCT)circumpapillary retinal nerve fiber layer (RNFL) measurements as compared to standardclinical assessment and automated perimetry.
MethodsData for this study were retrospectively collected from a prospective longitudinal study carriedout in the glaucoma service at New England Eye Center, Tufts-New England Medical Center,Tufts University School of Medicine, Boston, Massachusetts, between 1994 and 2001. Allsubjects attending the service willing to participate in the study and qualified according to thecriteria below were included. Institutional Review Board (IRB) / Ethics Committee approvalwas obtained for the study and all participants gave their approval to participate in the study.This study followed the principles of the Declaration of Helsinki.
Patients were included in the study according to the following inclusion criteria: best correctedvisual acuity of 20/60 or better, refractive error between +3.00 to −6.00 diopters and at leastfive reliable VF tests and five good quality OCT scans. The exclusion criteria were: subjectswith a history of diabetes as well as eyes with signs of posterior pole pathology other than thoseattributed to glaucoma or significant media opacity in which the fundus was not visible. Eyesthat underwent cataract extraction or any other intraocular surgery within the period of follow-up were excluded from the study.
Study protocolAll subjects underwent thorough baseline ophthalmic evaluation including medical history,intraocular pressure (IOP) measurement, undilated and dilated biomicroscopy, visual field(VF) testing and OCT scanning. Both eyes were included in the study if they were found to beeligible.
All subjects were scheduled for follow-up assessments every 6 months, unless additional visitswere medically indicated. Each visit included full ophthalmic evaluation, VF testing and OCTscanning.
Clinical diagnosisThe study population included glaucoma suspects and glaucoma patients. Glaucoma suspecteyes were defined as those with no history of retinal pathology, laser therapy or intra-ocularsurgery. An IOP of 22 – 30 mmHg and/or asymmetric ONH cupping (difference in verticalcup / disc ratio greater than 0.2 between the eyes) or abnormal appearing ONH all in thepresence of normal VF test were also included in the definition. This group contained suspecteyes from different etiologies such as ocular hypertension, increased cupping (vertical cup /disc ratio > 0.6), asymmetric cupping and family history of glaucoma.
Wollstein et al. Page 2
Arch Ophthalmol. Author manuscript; available in PMC 2007 August 9.
NIH
-PA Author Manuscript
NIH
-PA Author Manuscript
NIH
-PA Author Manuscript

Glaucomatous eyes were defined as those having at least one of the following: 1. Aglaucomatous VF defect; 2. IOP > 35 mmHg despite a full VF in the presence of large ONHcupping; 3. nerve fiber layer defect on stereo biomicroscopy.
Visual field testingAll patients underwent Humphrey full-threshold 24-2 achromatic perimetry or SwedishInteractive Thresholding Algorithm (SITA) standard 24-2 perimetry. A reliable VF test wasdefined as one with fewer than 30% fixation losses, false positive or false negative responses.Normal VF test results were defined as having no cluster of three or more adjacent pointsdepressed more than 5 dB or two adjacent points depressed more than 10 dB in the patterndeviation plot. Abnormal VF test was defined as a cluster of abnormal points as defined above.
Two glaucoma experts independently assessed the VF tests to determine progression betweenconsecutive visits and between first and last visit. The graders were masked to each other, anyclinical information, date of test and patient age. The graders were asked to grade the changefrom previous VF testing as deterioration, no change or improvement and overall assessmentof change between the first and last VF tests. Consensus between the graders was required incases of disagreement.
Eyes were defined for the analysis as VF progressors by subjective assessment when bothgraders or the consensus agreement, labeled deterioration in the same VF location in 2 of 3consecutive follow-up VFs. All other eyes were classified as VF non-progressors. Eyes weredefined as VF progressors by MD when VF-MD dropped by 2 dB from baseline value in 2 of3 consecutive follow-up visits. Parameters used for the analysis were VF mean deviation (VF-MD), pattern standard deviation (VF-PSD) and the subjective assessment of the VF. For eyesthat were tested by both full-threshold and SITA protocols during the follow-up period, theglobal VF indices were treated as a continuum.
OCT scanningOCT is the optical equivalent of B-scan ultrasound where the delay of the backscattered lightfrom the various components of the scanned tissue enables one to differentiate between varioustissue layers. Detailed descriptions of OCT have been previously published.26, 36, 37 OCThas been shown to obtain accurate and reproducible RNFL and retinal thickness measurements.26–28
All OCT scans in this study were performed with a prototype device with a reported resolutionof 10μm.26 This device acquired 100 circumpapillary measuring points in approximately 2.5seconds. RNFL thickness measurements acquired by this device have been shown to be highlycorrelated with those obtained with a commercially available OCT device (Pakter HM,Schuman JS, Hertzmark E, et al. Measurement of nerve fiber layer thickness in normal andglaucomatous eyes using optical coherence tomography. Unpublished data).
All patients had pupillary dilation with 1% tropicamide and 2.5% phenylephrine beforerecording OCT images. Each patient had 3 circular scans centered on the optic disc with adiameter of 3.4 mm. Poor quality scans were defined as those with signal / noise < 40 or thepresence of overt misalignment of the surface detection algorithm of at least 15 consecutivepixels or 20 additive pixels.
Parameters used for the analysis were mean peripapillary RNFL thickness (OCT mean) andtwo new parameters that were computed for this study: OCT mean deviation (OCT-MD) - themean difference between each of the 100 measuring points and age adjusted normative valuesas determined in a previous study (Pakter HM, Schuman JS, Hertzmark E, et al. Measurementof nerve fiber layer thickness in normal and glaucomatous eyes using optical coherence
Wollstein et al. Page 3
Arch Ophthalmol. Author manuscript; available in PMC 2007 August 9.
NIH
-PA Author Manuscript
NIH
-PA Author Manuscript
NIH
-PA Author Manuscript
tomography. Unpublished data) and OCT pattern standard deviation (OCT-PSD) - the standarddeviation of the difference between the measured value and the age adjusted normative value.Confirmed OCT progression was defined as thinning of the mean RNFL of at least 20μm (basedon 2 * reproducibility error of the device26) from the baseline measurement in 2 of 3consecutive follow-up OCT scans.
Statistical analysisThe data were analyzed using SAS software (SAS Institute, Cary, NC). The mixed procedurein SAS was used to correct for the correlation between measurements from the same patient.Pearson correlations were calculated between VF results and OCT measurements for testsconducted within 6 months from each other. Linear regression was used to determine the slopeof change for VF and OCT measurements for each eye over time. The group mean slope wasused for the analysis. A significant slope was defined as a slope that significantly differed froma zero slope (p < 0.05).
Kaplan-Meier (K-M) survival curves were used to assess time to progression as defined by thefollowing criteria: OCT mean drop of 20μm or VF-MD drop of 2 dB from baseline value in 2of 3 consecutive follow-up visits. The log-rank test was used to compare the K-M curves bydiagnosis and subjective assessment of VF. The paired Prentice-Wilcoxon test as suggestedby Woolson,38 was used to compare the OCT mean and VF-MD curves to each other.
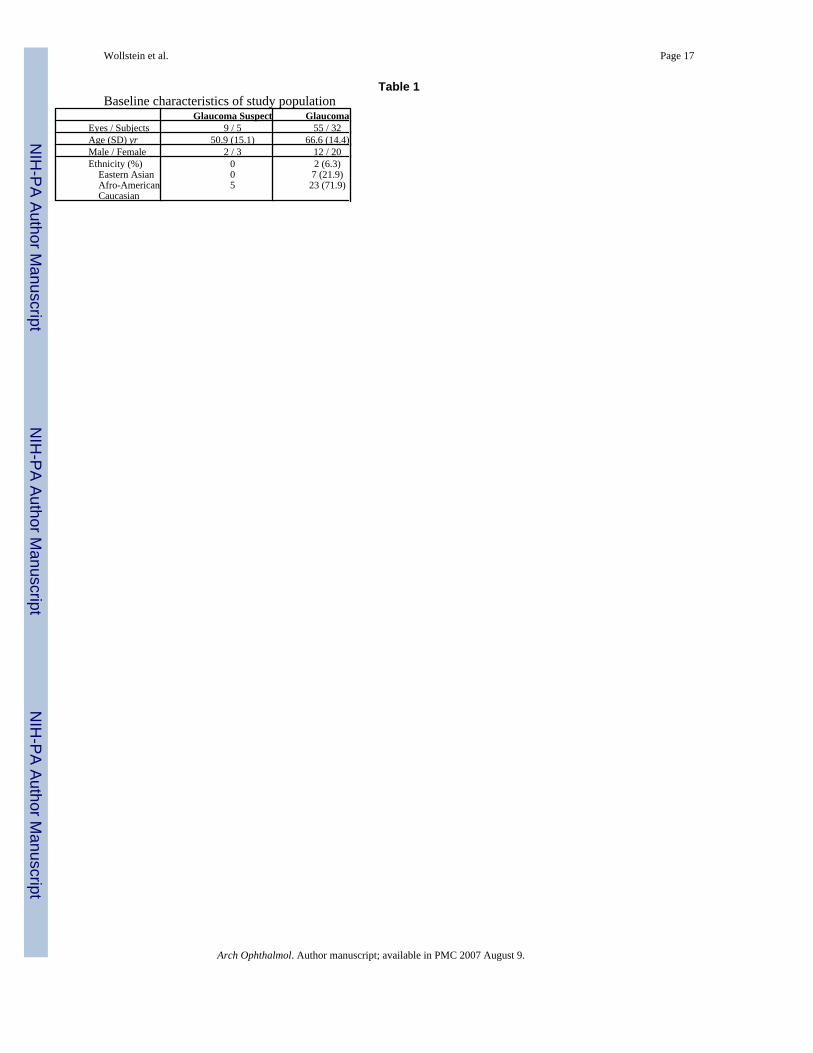
ResultsFifty-five glaucoma eyes (32 subjects) and 9 glaucoma suspect eyes (5 subjects) qualified forthe study. The characteristics of the study population are summarized in Table 1. Within amedian follow-up period of 4.7 years the participants had a median of 5 qualified OCT scans.A median of 6 qualified VF tests were performed within a median of 4.2 years of follow-up.95.3% of OCT and VF tests were conducted within 6 months of each other (Figure 1).
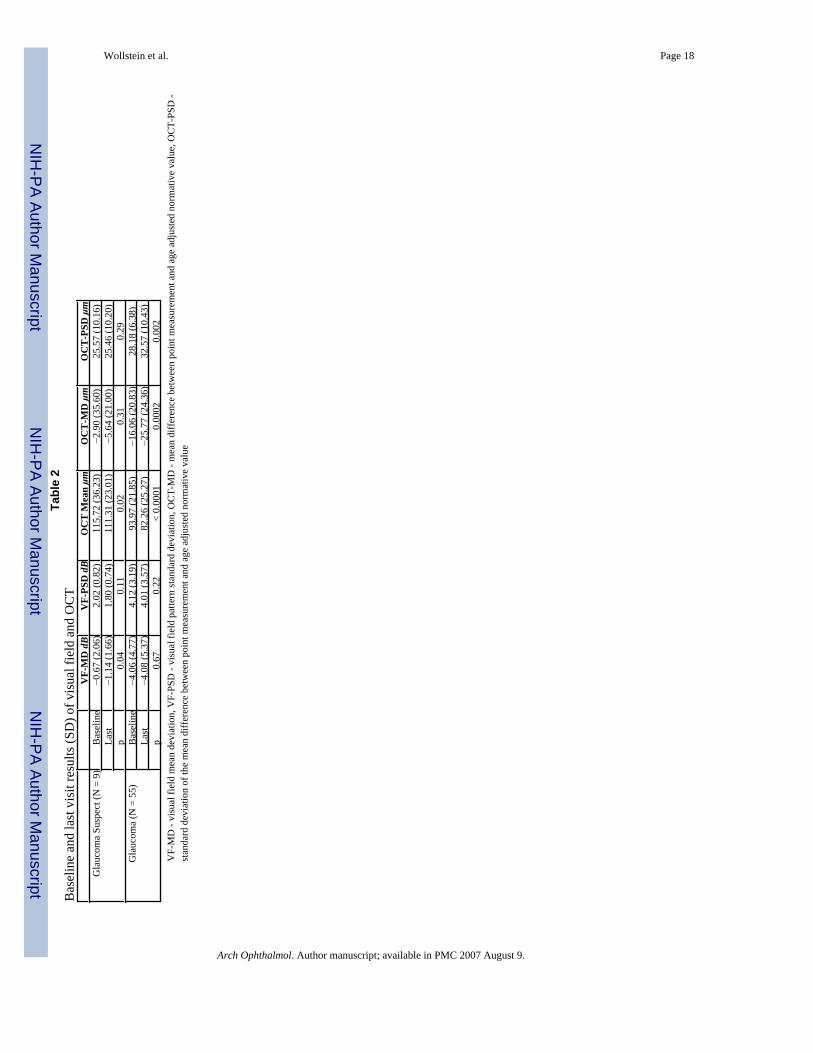
Baseline VF-MD for the glaucoma suspect group was −0.7 ± 2.1 dB and at last visit −1.1 ± 1.7dB (p = 0.04). Baseline VF-MD for the glaucoma group was −4.1 ± 4.8 dB and at last visit−4.1 ± 5.4 dB (p = 0.67) (Table 2). No significant difference was found between initial andfinal VF-PSD in neither group. For OCT mean, the initial measure in the glaucoma suspectgroup was 115.7 ± 36.2μm and the last visit 111.3 ± 23.0μm (p = 0.02). In the glaucoma groupthe initial OCT mean was 94.0 ± 21.9μm and the final value was 82.3 ± 25.3μm (p < 0.0001).For both OCT-MD and OCT-PSD the difference between first and last values was significantonly in the glaucoma group.
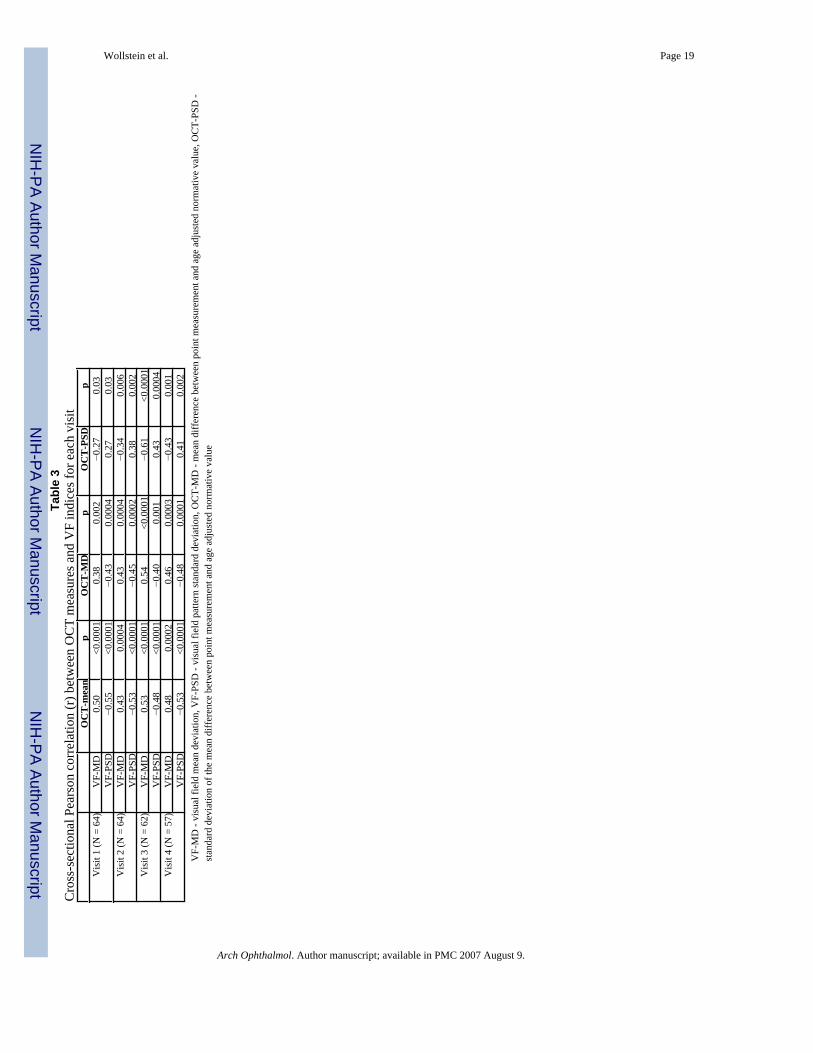
Cross-sectional correlations between OCT measures and global VF indices of tests conductedwithin 6 months from each other were moderate to good in each visit (Table 3).
K-M survival curves were used for evaluating time to progression. Overall there was greaterlikelihood of repeatable OCT mean RNFL drop of 20μm compared to VF-MD drop of 2 dBfrom baseline values (p = 0.12) (Figure 2). Altogether, 22/64 eyes were found to progress whenapplying the repeatable VF-MD drop of 2 dB and repeatable OCT drop of 20μm criteria.Fourteen (21.9%) eyes progressed by OCT only, 6 (9.4%) by VF only and 2 by both methods(Figure 3). Defining VF-MD progression as a repeatable drop of 1 dB yielded a higher numberof VF progressors (12 eyes OCT only, 15 VF only and 4 both methods) while setting the levelat 4 dB reduced the number (16 eyes OCT only, 1 VF only and none by both methods) (Figure4, top and bottom).
Wollstein et al. Page 4
Arch Ophthalmol. Author manuscript; available in PMC 2007 August 9.
NIH
-PA Author Manuscript
NIH
-PA Author Manuscript
NIH
-PA Author Manuscript

The K-M curves using OCT mean did not differ significantly between glaucoma suspects andglaucoma patients (p = 0.72). Similar results were found for K-M curves of OCT mean stratifiedby subjective VF assessment (p = 0.40).
Comparing OCT mean and VF-MD for subjects defined as progressors or non-progressors bythe subjective assessment of VF we found a greater likelihood for progression for OCT meancompared to VF-MD in the VF non-progressor group (p = 0.01) (Figure 5, top). In VF-progressors, the curves overlapped and the difference was not significant (p = 0.31) (Figure 5,bottom).
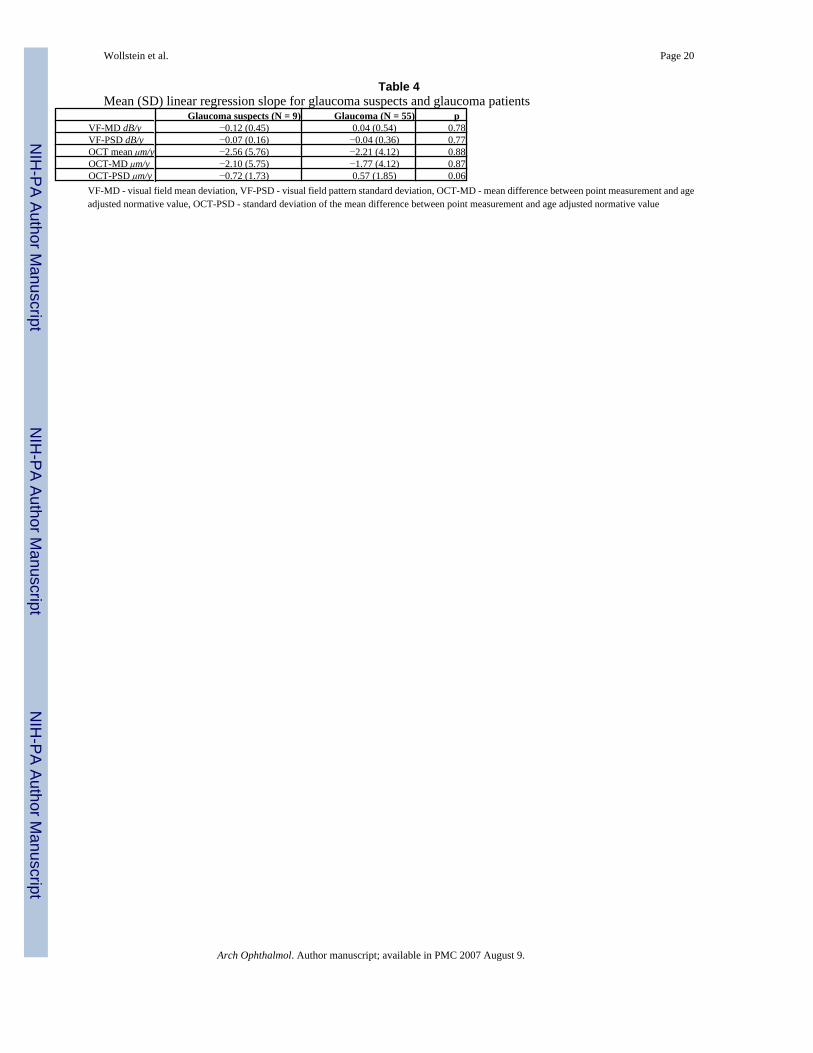
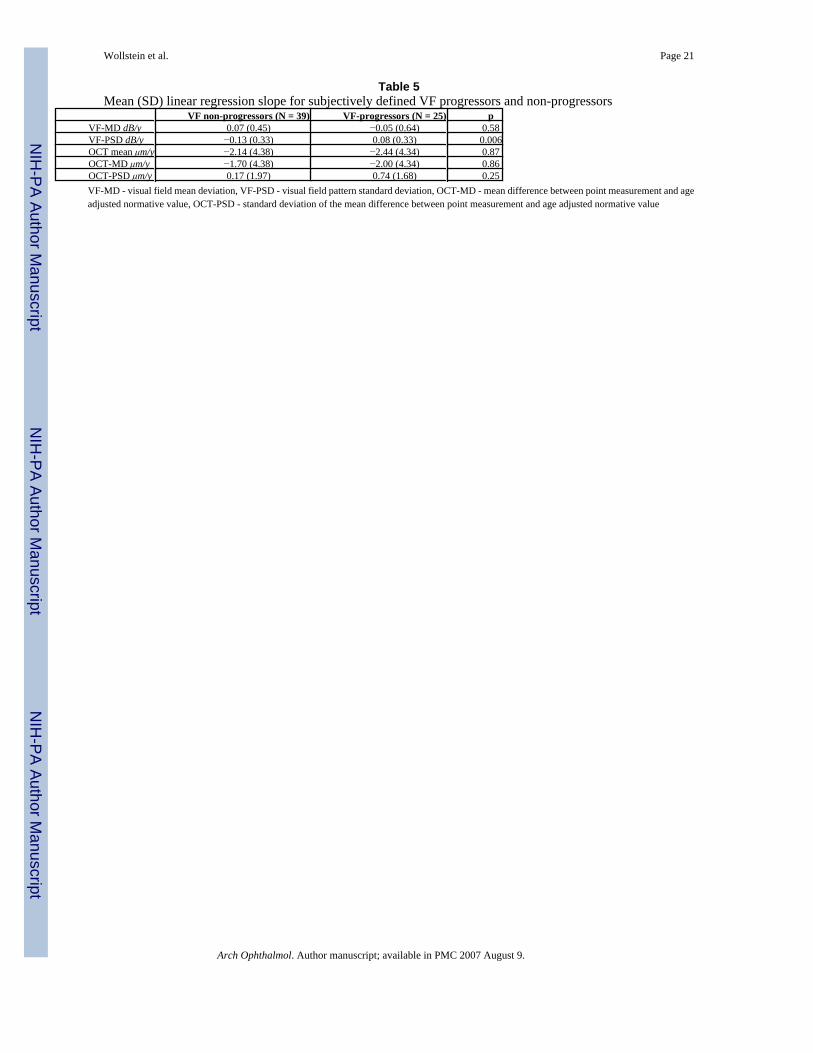
Linear regression analysis was used as an additional method to assess progression. Mean linearregression slopes for the various VF and OCT parameters for the glaucoma suspects andglaucoma patients are summarized in Table 4. The difference in the slope between the groupswas non-significant for all parameters. Stratifying the group based on the subjective assessmentof VF into VF-progressors and VF-non progressors, we found a significant difference only forVF-PSD (Table 5). To investigate the possible effect of baseline VF damage on the rate ofprogression, the group was stratified according to baseline VF-MD above or below −5dB(Table 6). The difference between the groups was non-significant for all the parameters. Thepower to detect a difference between the groups with an alpha = 0.05 was calculated to bebetween 5% and 12% for the various parameters.
To determine the possibility of identifying changes using sectoral analysis we reanalyzed thedata after grouping the OCT data into four quadrants: superior, temporal, inferior and nasal.The slope for each quadrant was calculated for each parameter after subdividing the group toprogressors and non-progressors based on subjective assessment of VF. No significantdifferences were found between the mean slopes of progressors and non-progressors for anysector.
DiscussionThis study evaluated longitudinal morphological RNFL changes as determined by OCT andcompared these changes to clinical status as well as to functional glaucoma testing. The resultsof this study indicate that the rate of RNFL thinning, as determined by OCT, exceeded the rateof functional loss as measured by VF-MD deterioration for all participants (Figure 2).
In evaluating longitudinal changes one should take into account the test-retest variability inrepeated measurements. The criteria for progression events used for the K-M survival curveanalysis were based on the known reproducibility error of the OCT technology used in thisstudy26 and a chosen cut point for VF-MD.
In setting the cut-off for VF-MD we tried to simulate clinical criteria for progression. Westratified the eyes into progressors and non-progressors based on subjective VF assessment.In this condition, perfect sensitivity and specificity for our objective global VF progressioncriteria should identify all subjectively chosen progressors as progressing and should find thatall non-progressors were stable. The VF-MD that came closest to this was 2 dB (Figure 4, topand bottom). When we liberalized the cut-off to 1 dB, we increased the sensitivity but decreasedspecificity. Many eyes subjectively identified as stable were called progressors by the objectiveglobal criteria at this level. Moreover, the objective criteria, which is based on a globalparameter, is not expected to be more sensitive than subjective assessment which takes intoaccount global as well as localized changes in detecting progression. Using a criterion of VF-MD of 4 dB very few subjectively stable eyes were called progressors (Figure 4, top); however,many VF progressors were missed at this threshold (Figure 4, bottom). Thus, VF-MD drop of2 dB provided the best balance in this setting.
Wollstein et al. Page 5
Arch Ophthalmol. Author manuscript; available in PMC 2007 August 9.
NIH
-PA Author Manuscript
NIH
-PA Author Manuscript
NIH
-PA Author Manuscript
Using these criteria, 2 of the 8 eyes that progressed according to the VF criterion were definedas progressors also by OCT, while 14 eyes progressed by OCT without corresponding VFprogression (Figure 3). Similar findings regarding the relationship between structural andfunctional changes were reported by Kass et al. in the ocular hypertension study (OHTS). Inthat study, 55% of the subjects reached the predefined end-point criteria of their longitudinalstudy by ONH progression only, 35% by VF criteria and only 10% by both methods.10Chauhan et al. reported similar findings with confocal scanning laser ophthalmoscopy (CSLO)where 22 of 25 eyes, from a total of 77 studied eyes, that progressed by VF also progressed byCSLO while 31 eyes progressed by CSLO only.9
When grouping the participating eyes by subjective assessment of VF, K-M analysis showeda significantly greater likelihood of progression by OCT than by VF for those who wereclassified as VF non-progressors, and there were overlapping curves in the VF progressorgroup. It should be remembered that the findings of our study for subjective assessment of VFare biased in favor of VF-MD results since the graders were not masked to the global indicesresults in the VF printouts. The higher rate of RNFL loss in the non-progressor group mightreflect hypersensitivity of the OCT or it might reflect true structural changes preceding theappearance of functional changes. This latter explanation is in agreement with previous studiesin which a curvilinear relationship was found between functional and structural changes.39–42 One would expect a much larger change to be required initially to manifest a detectablefunctional change than a structural change (Figure 7). In the midportion of the disease,functional change has a greater slope than structural change, but late in the disease, structuralchange is again more acute. However, a recent study suggested that there was a linear structuraland functional relationship and attributed the curvilinear relationship described above to thelogarithmic scaling of VF.43 Further studies are warranted to investigate this relationship.
In order to obtain longitudinal data the study was conducted utilizing data collected from ourprototype OCT device. Although this device differs from current commercially availabledevices in that it has a longer scan time (2.5 seconds) and fewer points per scan (100 A-scans),a previous study showed high correlation between measurements obtained by the prototypedevice and the commercial OCT 2000 (Pakter HM, Schuman JS, Hertzmark E, et al.Measurement of nerve fiber layer thickness in normal and glaucomatous eyes using opticalcoherence tomography. Unpublished data). Taking into account that OCT devices utilize thesame physical principals and the high correlation between measurements obtained by prototypeand OCT 2000 devices we believe that the data presented in this study are relevant to thecurrently available commercial device. The reproducibility of RNFL measurements with thecurrently available commercial OCT (Stratus OCT, Carl Zeiss Meditec, Dublin, CA) is~2.5μm compared to the ~10μm of the prototype device used in this study (Paunescu LA,Schuman JS, Price LL, et al. Reproducibility of nerve fiber thickness, macular thickness andoptic nerve head measurements using third generation commercial optical coherencetomography (Stratus OCT). Submitted to Inves Ophth Vis Sci). The improved reproducibilityof Stratus OCT might improve the ability to detect longitudinal structural changes to a greaterdegree than we found in this study. This warrants further investigation.
Cross-sectional correlation between OCT measures and global VF indices was found to bemoderate to good throughout the follow-up period (Table 3). This finding is in agreement withprevious studies that found good cross-sectional correlation between OCT and VF findings.11, 32
Linear regression analysis has been used in previous studies to evaluate longitudinal VFchanges.44–52 However, due to the large inter-visit VF fluctuation it has been recommendedto obtain a large number of VF tests over a long period of follow-up.49, 50 Thus, we requiredat least 5 VF tests as an inclusion criterion for this study. Most of the participants in the study
Wollstein et al. Page 6
Arch Ophthalmol. Author manuscript; available in PMC 2007 August 9.
NIH
-PA Author Manuscript
NIH
-PA Author Manuscript
NIH
-PA Author Manuscript
were familiar with VF testing at the initial study visit. No perimetry learning effect was notedfor the remaining participants.
The difference between the likelihood of progression of VF and OCT measures as defined bythe linear regression slope stratified by baseline clinical diagnosis was found to be non-significant (Table 4). The difference between likelihood of progression for eyes that wereclassified as VF progressors and non-progressors was found to be non-significant except forVF-PSD (Table 5). It should be noted that the subjective assessment of the VF was not maskedto the global VF indices and thus the results may be biased in favor of VF related parameters.We cannot explain the similarity of these VF-MD curves. Sectoral analysis of OCT results didnot yield differences in the likelihood of progression between groups as determined bysubjective assessment of VF.
No relationship was found between baseline VF-MD and rate of progression as determined byOCT (Table 6). This finding is in agreement with previous studies where the rate of VF losswas not related to the baseline VF defect.49–51 However, our study was inadequately poweredto evaluate this relationship.
Based on our results, the usefulness of linear regression for detection of longitudinalglaucomatous changes with the OCT is questionable. It is possible that glaucoma progressionoccurs in a non-linear fashion, and that regression is not the most suitable technique forprogression detection. The use of OCT-MD and OCT-PSD did not improve the ability to detectchange.
In summary, this study longitudinally evaluated OCT peripapillary RNFL measurements andcompared these to functional measures as determined by VF and to clinical status. There wasa greater likelihood of glaucomatous progression as measured by OCT compared to VF. Ourfindings suggest that OCT may be a more sensitive indicator than automated perimetry forglaucomatous progression; however, we cannot rule out the possibility that some of theprogression identified by OCT represented type-I error. Since there is no gold standard measureof glaucomatous progression, further study of larger populations over longer periods of timewill be required to definitively answer this question.
Acknowledgements
Supported in part by NIH R01-EY13178-4, RO1-EY11289-16, and P30-EY13078, NSF ECS-0119452, Air ForceOffice of Scientific Research F49620-01-1-0184, Medical Free Electron Laser Program F49620-01-1-0186, by a grantfrom the Massachusetts Lions Eye Research Fund Inc., and by Research to Prevent Blindness. G. Wollsteinacknowledges support from the American Physician Fellowship for Medicine in Israel.
References1. Sommer A, Pollack I, Maumenee A. Optic disc parameters and onset of glaucomatous field loss. I.
Methods and progressive changes in disc morphology. Archives of Ophthalmology 1979;97:1444–8.[PubMed: 464866]
2. Pederson J, Anderson D. The mode of progressive disc cupping in ocular hypertension and glaucoma.Archives of Ophthalmology 1980;98:490–5. [PubMed: 7362506]
3. Sommer A, Quigley H, Robin A. Evaluation of nerve fiber layer assessment. Archives ofOphthalmology 1984;102:1766–71. [PubMed: 6508617]
4. Sommer A, Katz J, Quigley HA, et al. Clinically detectable nerve fiber atrophy precedes the onset ofglaucomatous field loss. Arch Ophthalmol 1991;109:77–83. [PubMed: 1987954]
5. Quigley HA, Katz J, Derick RJ, Gilbert D, Sommer A. An evaluation of optic disc and nerve fiberlayer examinations in monitoring progression of early glaucoma damage. Ophthalmology 1992;99:19–28. [PubMed: 1741133]
Wollstein et al. Page 7
Arch Ophthalmol. Author manuscript; available in PMC 2007 August 9.
NIH
-PA Author Manuscript
NIH
-PA Author Manuscript
NIH
-PA Author Manuscript
6. Zeyen TG, Caprioli J. Progression of disc and field damage in early glaucoma. Arch Ophthalmol1993;111:62–5. [PubMed: 8424726]
7. Quigley HA, Enger C, Katz J, et al. Risk factors for the development of glaucomatous visual field lossin ocular hypertension. Arch Ophthalmol 1994;112:644–9. [PubMed: 8185522]
8. Sommer A, Miller N, Pollack I. The nerve fiber layer in the diagnosis of glaucoma. Archives ofOphthalmology 1997;95:2149–56. [PubMed: 588106]
9. Chauhan BC, McCormick TA, Nicolela MT, LeBlanc RP. Optic disc and visual field changes in aprospective longitudinal study of patients with glaucoma: comparison of scanning laser tomographywith conventional perimetry and optic disc photography. Arch Ophthalmol 2001;119:1492–9.[PubMed: 11594950]
10. Kass MA, Heuer DK, Higginbotham EJ, et al. The Ocular Hypertension Treatment Study: arandomized trial determines that topical ocular hypotensive medication delays or prevents the onsetof primary open-angle glaucoma. Arch Ophthalmol 2002;120:701–13. [PubMed: 12049574]discussion 829–30
11. Schuman JS, Hee MR, Puliafito CA, et al. Quantification of nerve fiber layer thickness in normal andglaucomatous eyes using optical coherence tomography. Arch Ophthalmol 1995;113:586–96.[PubMed: 7748128]
12. Mikelberg FS, Parfitt CM, Swindale NV. Ability of the Heidelberg Retina Tomograph to detect earlyglaucomatous visual field loss. J Glaucoma 1996;4:242–7.
13. Weinreb RN, Zangwill L, Berry CC, Bathija R, Sample PA. Detection of glaucoma with scanninglaser polarimetry. Arch Ophthalmol 1998;116:1583–9. [PubMed: 9869785]
14. Wollstein G, Garway-Heath DF, Hitchings RA. Identification of early glaucoma cases with thescanning laser ophthalmoscope. Ophthalmology 1998;105:1557–63. [PubMed: 9709774]
15. Zeimer R, Asrani S, Zou S, Quigley H, Jampel H. Quantitative detection of glaucomatous damage atthe posterior pole by retinal thickness mapping. A pilot study. Ophthalmology 1998;105:224–31.[PubMed: 9479279]
16. Wollstein G, Garway-Heath DF, Fontana L, Hitchings RA. Identifying early glaucomatous changes.Comparison between expert clinical assessment of optic disc photographs and confocal scanningophthalmoscopy. Ophthalmology 2000;107:2272–7. [PubMed: 11097609]
17. Yamada N, Chen PP, Mills RP, et al. Glaucoma screening using the scanning laser polarimeter. JGlaucoma 2000;9:254–61. [PubMed: 10877377]
18. Bowd C, Zangwill LM, Berry CC, et al. Detecting early glaucoma by assessment of retinal nervefiber layer thickness and visual function. Invest Ophthalmol Vis Sci 2001;42:1993–2003. [PubMed:11481263]
19. Choplin NT, Lundy DC. The sensitivity and specificity of scanning laser polarimetry in the detectionof glaucoma in a clinical setting. Ophthalmology 2001;108:899–904. [PubMed: 11320020]
20. Miglior S, Casula M, Guareschi M, et al. Clinical ability of Heidelberg retinal tomograph examinationto detect glaucomatous visual field changes. Ophthalmology 2001;108:1621–7. [PubMed:11535460]
21. Nicolela MT, Martinez-Bello C, Morrison CA, et al. Scanning laser polarimetry in a selected groupof patients with glaucoma and normal controls. Am J Ophthalmol 2001;132:845–54. [PubMed:11730647]
22. Sanchez-Galeana C, Bowd C, Blumenthal EZ, et al. Using optical imaging summary data to detectglaucoma. Ophthalmology 2001;108:1812–8. [PubMed: 11581054]
23. Zangwill LM, Bowd C, Berry CC, et al. Discriminating between normal and glaucomatous eyes usingthe Heidelberg Retina Tomograph, GDx Nerve Fiber Analyzer, and Optical Coherence Tomograph.Arch Ophthalmol 2001;119:985–93. [PubMed: 11448320]
24. Greaney MJ, Hoffman DC, Garway-Heath DF, et al. Comparison of optic nerve imaging methods todistinguish normal eyes from those with glaucoma. Invest Ophthalmol Vis Sci 2002;43:140–5.[PubMed: 11773024]
25. Kesen MR, Spaeth GL, Henderer JD, et al. The Heidelberg Retina Tomograph vs clinical impressionin the diagnosis of glaucoma. Am J Ophthalmol 2002;133:613–6. [PubMed: 11992857]
26. Huang D, Swanson EA, Lin CP, et al. Optical coherence tomography. Science 1991;254:1178–81.[PubMed: 1957169]
Wollstein et al. Page 8
Arch Ophthalmol. Author manuscript; available in PMC 2007 August 9.
NIH
-PA Author Manuscript
NIH
-PA Author Manuscript
NIH
-PA Author Manuscript
27. Schuman JS, Pedut-Kloizman T, Hertzmark E, et al. Reproducibility of nerve fiber layer thicknessmeasurements using optical coherence tomography. Ophthalmology 1996;103:1889–98. [PubMed:8942887]
28. Blumenthal EZ, Williams JM, Weinreb RN, et al. Reproducibility of nerve fiber layer thicknessmeasurements by use of optical coherence tomography. Ophthalmology 2000;107:2278–82.[PubMed: 11097610]
29. Mistlberger A, Liebmann JM, Greenfield DS, et al. Heidelberg retina tomography and opticalcoherence tomography in normal, ocular-hypertensive, and glaucomatous eyes. Ophthalmology1999;106:2027–32. [PubMed: 10519603]
30. Pieroth L, Schuman JS, Hertzmark E, et al. Evaluation of focal defects of the nerve fiber layer usingoptical coherence tomography. Ophthalmology 1999;106:570–9. [PubMed: 10080216]
31. Bowd C, Weinreb RN, Williams JM, Zangwill LM. The retinal nerve fiber layer thickness in ocularhypertensive, normal, and glaucomatous eyes with optical coherence tomography. Arch Ophthalmol2000;118:22–6. [PubMed: 10636409]
32. Hoh ST, Greenfield DS, Mistlberger A, et al. Optical coherence tomography and scanning laserpolarimetry in normal, ocular hypertensive, and glaucomatous eyes. Am J Ophthalmol2000;129:129–35. [PubMed: 10682963]
33. Zangwill LM, Williams J, Berry CC, Knauer S, Weinreb RN. A comparison of optical coherencetomography and retinal nerve fiber layer photography for detection of nerve fiber layer damage inglaucoma. Ophthalmology 2000;107:1309–15. [PubMed: 10889104]
34. Guedes V, Schuman JS, Hertzmark E, et al. Optical coherence tomography measurement of macularand nerve fiber layer thickness in normal and glaucomatous human eyes. Ophthalmology2003;110:177–89. [PubMed: 12511364]
35. Kanamori A, Nakamura M, Escano MF, et al. Evaluation of the glaucomatous damage on retinalnerve fiber layer thickness measured by optical coherence tomography. Am J Ophthalmol2003;135:513–20. [PubMed: 12654369]
36. Hee MR, Izatt JA, Swanson EA, et al. Optical coherence tomography of the human retina. ArchOphthalmol 1995;113:325–32. [PubMed: 7887846]
37. Pedut-Kloizman T, Pakter HM, Schuman JS, et al. Ophthalmic diagnosis using optical coherencetomography. Ophthalmol Clin North Am 1998;11:1178–81.
38. Woolson RF, O’Gorman TW. A comparison of several tests for censored paired data. Statistics inMedicine 1992;11:193–208. [PubMed: 1579758]
39. Airaksinen PJ, Drance SM, Douglas GR, Schulzer M. Neuroretinal rim areas and visual field indicesin glaucoma. Am J Ophthalmol 1985;99:107–10. [PubMed: 3970114]
40. Jonas JB, Grundler AE. Correlation between mean visual field loss and morphometric optic diskvariables in the open-angle glaucomas. Am J Ophthalmol 1997;124:488–97. [PubMed: 9323939]
41. Bartz-Schmidt KU, Thumann G, Jonescu-Cuypers CP, Krieglstein GK. Quantitative morphologicand functional evaluation of the optic nerve head in chronic open-angle glaucoma. Surv Ophthalmol1999;44:S41–53. [PubMed: 10548116]
42. Harwerth RS, Carter-Dawson L, Shen F, Smith EL 3rd, Crawford ML. Ganglion cell losses underlyingvisual field defects from experimental glaucoma. Invest Ophthalmol Vis Sci 1999;40:2242–50.[PubMed: 10476789]
43. Garway-Heath DF, Holder GE, Fitzke FW, Hitchings RA. Relationship between electrophysiological,psychophysical, and anatomical measurements in glaucoma. Invest Ophthalmol Vis Sci2002;43:2213–20. [PubMed: 12091419]
44. Mikelberg FS, Schulzer M, Drance SM, Lau W. The rate of progression of scotomas in glaucoma.Am J Ophthalmol 1986;101:1–6. [PubMed: 3942160]
45. Chauhan BC, Drance SM, Douglas GR. The use of visual field indices in detecting changes in thevisual field in glaucoma. Invest Ophthalmol Vis Sci 1990;31:512–20. [PubMed: 2318590]
46. Morgan RK, Feuer WJ, Anderson DR. Statpac 2 glaucoma change probability. Arch Ophthalmol1991;109:1690–2. [PubMed: 1841577]
47. Advanced Glaucoma Intervention Study 2. Visual field test scoring and reliability. Ophthalmology1994;101:1445–55. [PubMed: 7741836]
Wollstein et al. Page 9
Arch Ophthalmol. Author manuscript; available in PMC 2007 August 9.
NIH
-PA Author Manuscript
NIH
-PA Author Manuscript
NIH
-PA Author Manuscript

48. The Glaucoma Laser Trial (GLT); Glaucoma Laser Trial Research Group. Treatment groupdifferences in visual field changes. Am J Ophthalmol 1995;6(120):10–22.
49. Smith SD, Katz J, Quigley HA. Analysis of progressive change in automated visual fields in glaucoma.Invest Ophthalmol Vis Sci 1996;37:1419–28. [PubMed: 8641844]
50. Katz J, Gilbert D, Quigley HA, Sommer A. Estimating progression of visual field loss in glaucoma.Ophthalmology 1997;104:1017–25. [PubMed: 9186444]
51. Rasker MT, van den Enden A, Bakker D, Hoyng PF. Rate of visual field loss in progressive glaucoma.Arch Ophthalmol 2000;118:481–8. [PubMed: 10766133]
52. Spry PG, Johnson CA. Identification of progressive glaucomatous visual field loss. Surv Ophthalmol2002;47:158–73. [PubMed: 11918896]
Wollstein et al. Page 10
Arch Ophthalmol. Author manuscript; available in PMC 2007 August 9.
NIH
-PA Author Manuscript
NIH
-PA Author Manuscript
NIH
-PA Author Manuscript
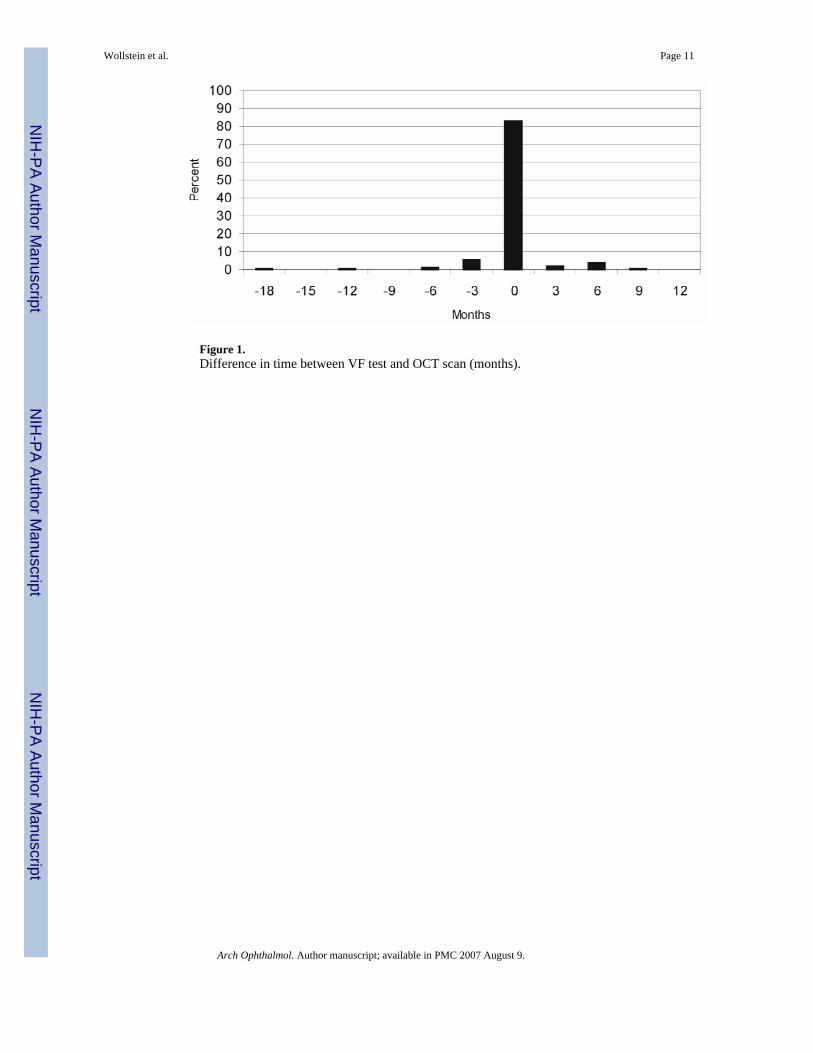
Figure 1.Difference in time between VF test and OCT scan (months).
Wollstein et al. Page 11
Arch Ophthalmol. Author manuscript; available in PMC 2007 August 9.
NIH
-PA Author Manuscript
NIH
-PA Author Manuscript
NIH
-PA Author Manuscript
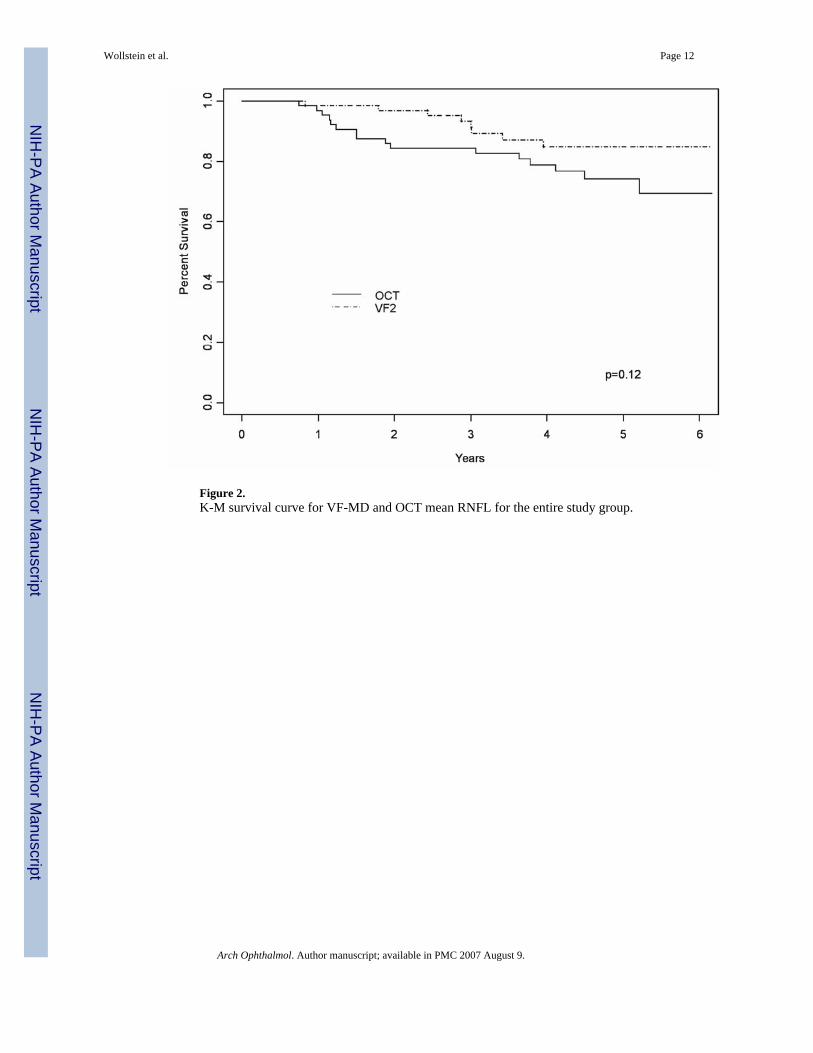
Figure 2.K-M survival curve for VF-MD and OCT mean RNFL for the entire study group.
Wollstein et al. Page 12
Arch Ophthalmol. Author manuscript; available in PMC 2007 August 9.
NIH
-PA Author Manuscript
NIH
-PA Author Manuscript
NIH
-PA Author Manuscript
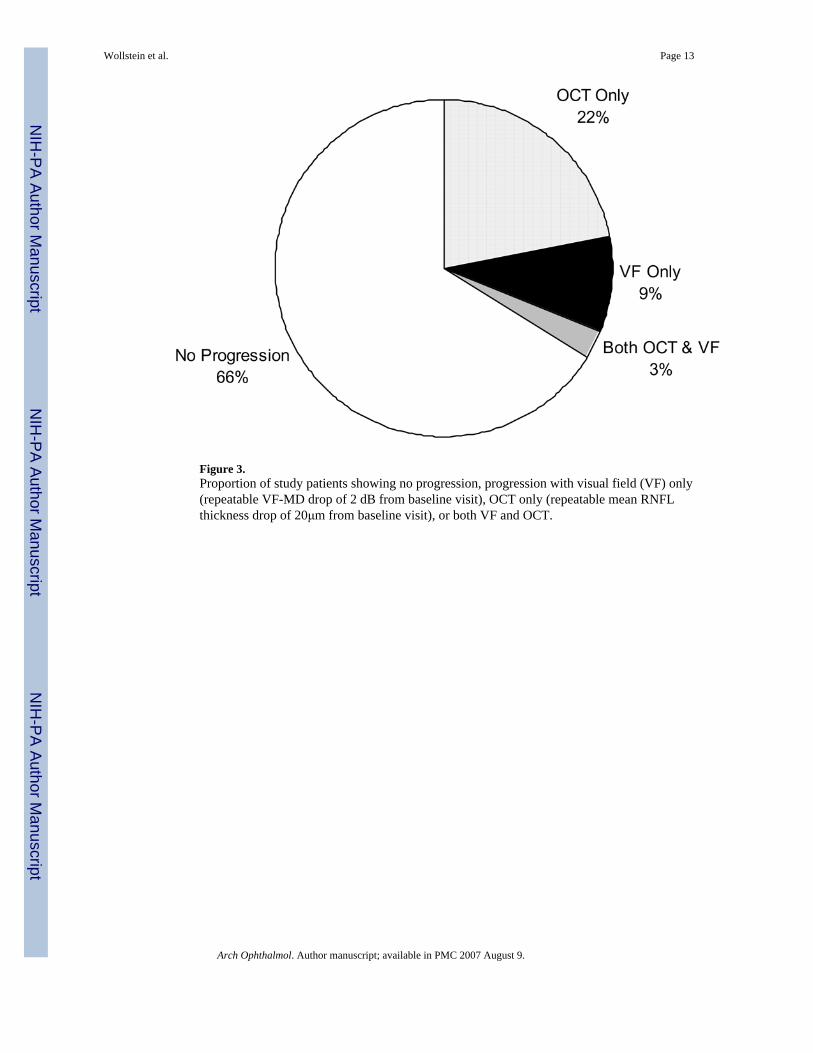
Figure 3.Proportion of study patients showing no progression, progression with visual field (VF) only(repeatable VF-MD drop of 2 dB from baseline visit), OCT only (repeatable mean RNFLthickness drop of 20μm from baseline visit), or both VF and OCT.
Wollstein et al. Page 13
Arch Ophthalmol. Author manuscript; available in PMC 2007 August 9.
NIH
-PA Author Manuscript
NIH
-PA Author Manuscript
NIH
-PA Author Manuscript
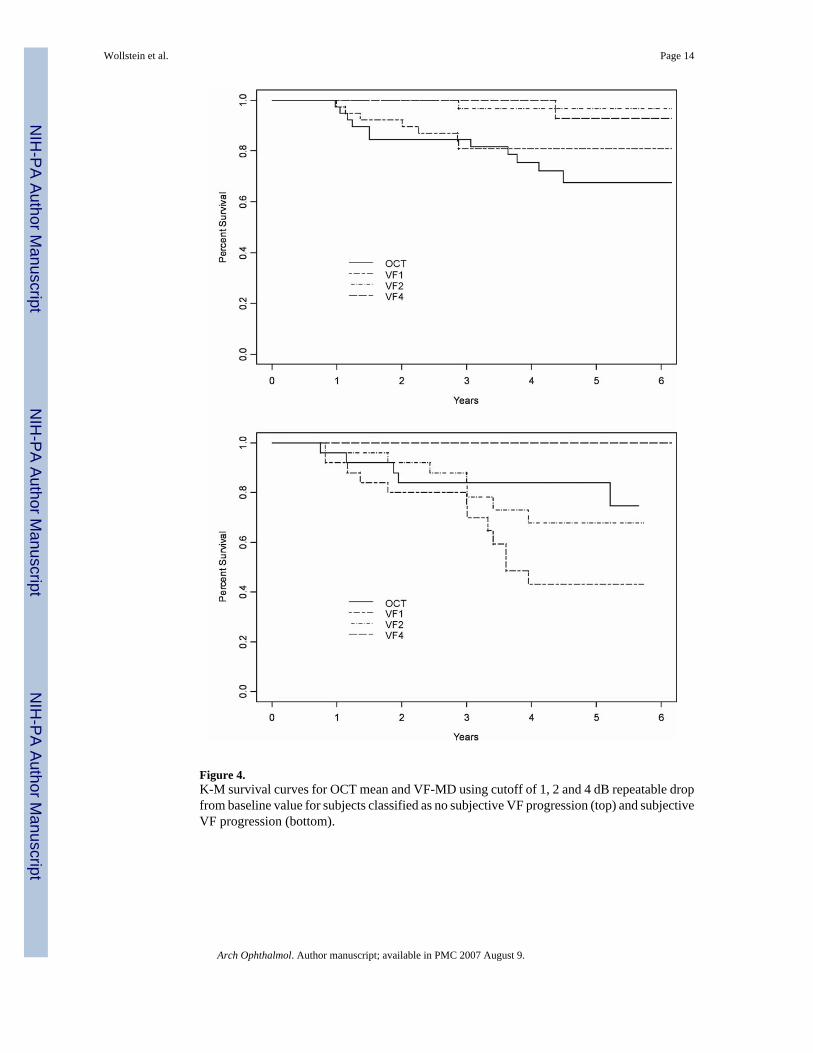
Figure 4.K-M survival curves for OCT mean and VF-MD using cutoff of 1, 2 and 4 dB repeatable dropfrom baseline value for subjects classified as no subjective VF progression (top) and subjectiveVF progression (bottom).
Wollstein et al. Page 14
Arch Ophthalmol. Author manuscript; available in PMC 2007 August 9.
NIH
-PA Author Manuscript
NIH
-PA Author Manuscript
NIH
-PA Author Manuscript
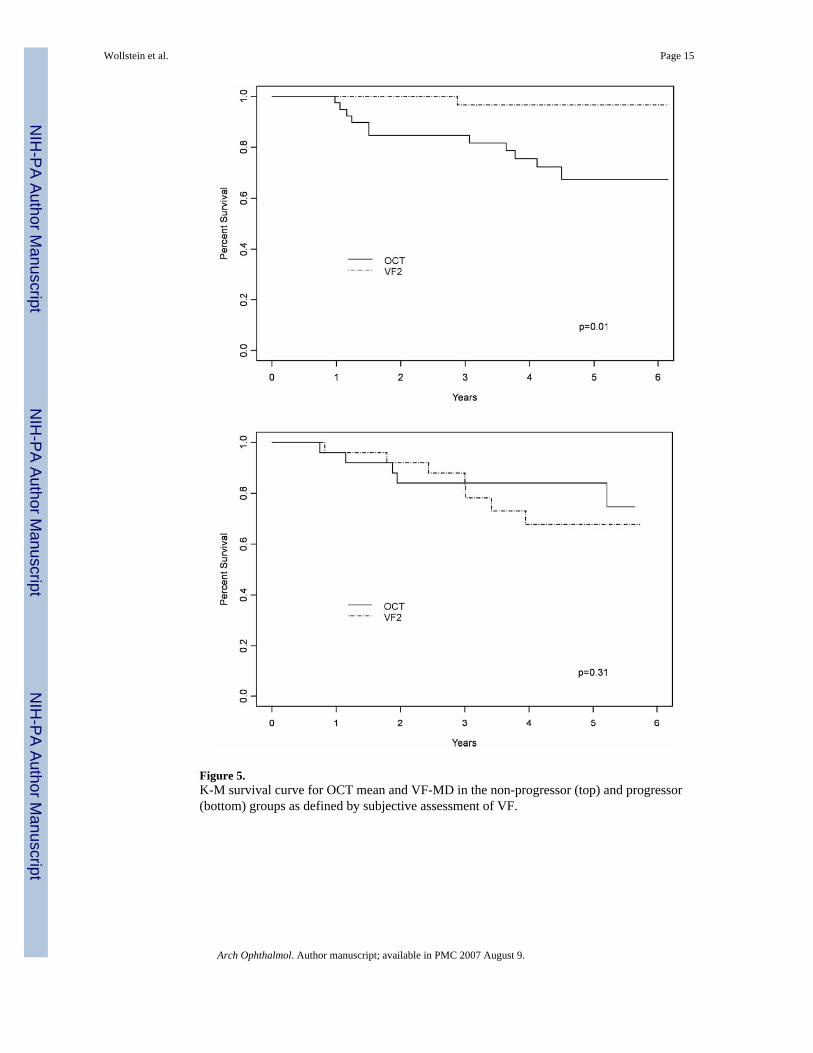
Figure 5.K-M survival curve for OCT mean and VF-MD in the non-progressor (top) and progressor(bottom) groups as defined by subjective assessment of VF.
Wollstein et al. Page 15
Arch Ophthalmol. Author manuscript; available in PMC 2007 August 9.
NIH
-PA Author Manuscript
NIH
-PA Author Manuscript
NIH
-PA Author Manuscript
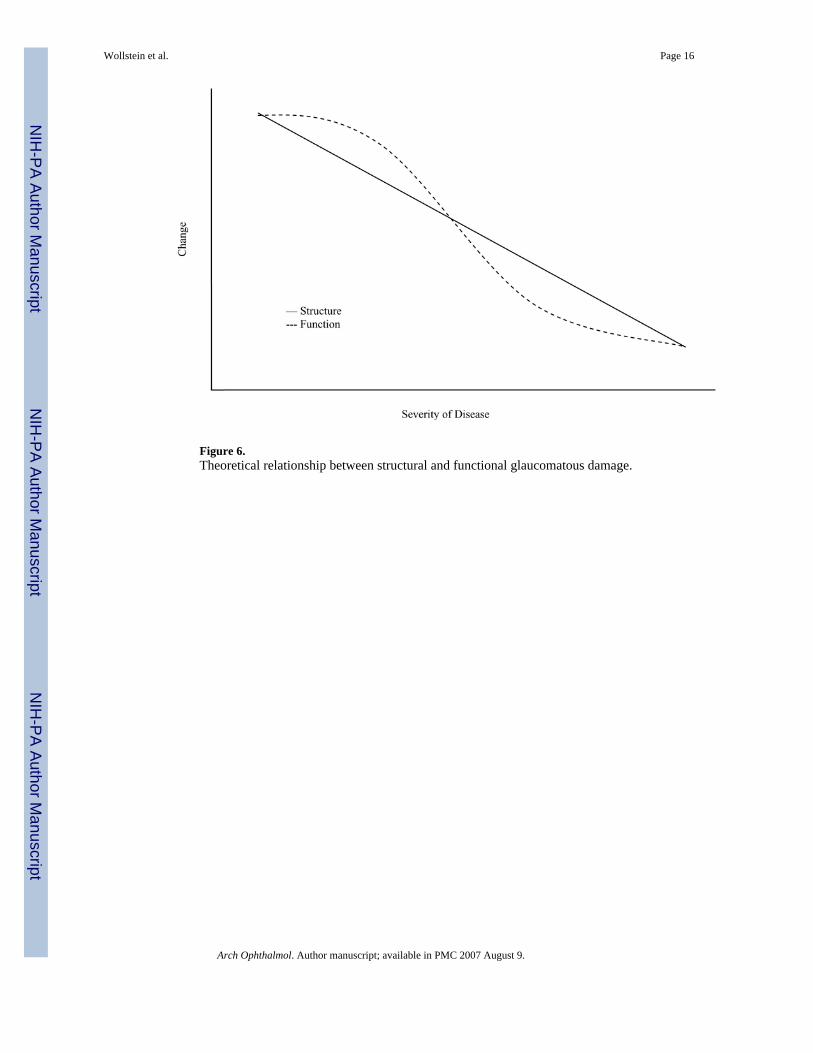
Figure 6.Theoretical relationship between structural and functional glaucomatous damage.
Wollstein et al. Page 16
Arch Ophthalmol. Author manuscript; available in PMC 2007 August 9.
NIH
-PA Author Manuscript
NIH
-PA Author Manuscript
NIH
-PA Author Manuscript
NIH
-PA Author Manuscript
NIH
-PA Author Manuscript
NIH
-PA Author Manuscript
Wollstein et al. Page 17
Table 1Baseline characteristics of study population
Glaucoma Suspect GlaucomaEyes / Subjects 9 / 5 55 / 32Age (SD) yr 50.9 (15.1) 66.6 (14.4)Male / Female 2 / 3 12 / 20Ethnicity (%) Eastern Asian Afro-American Caucasian
005
2 (6.3)7 (21.9)23 (71.9)
Arch Ophthalmol. Author manuscript; available in PMC 2007 August 9.
NIH
-PA Author Manuscript
NIH
-PA Author Manuscript
NIH
-PA Author Manuscript
Wollstein et al. Page 18Ta
ble
2B
asel
ine
and
last
vis
it re
sults
(SD
) of v
isua
l fie
ld a
nd O
CT
VF-
MD
dB
VF-
PSD
dB
OC
T M
ean μm
OC
T-M
D μ
mO
CT
-PSD
μm
Gla
ucom
a Su
spec
t (N
= 9
)B
asel
ine
−0.6
7 (2
.06)
2.02
(0.8
2)11
5.72
(36.
23)
−2.9
0 (3
5.60
)25
.57
(10.
16)
Last
−1.1
4 (1
.66)
1.80
(0.7
4)11
1.31
(23.
01)
−5.6
4 (2
1.00
)25
.46
(10.
20)
p0.
040.
110.
020.
310.
29G
lauc
oma
(N =
55)
Bas
elin
e−4
.06
(4.7
7)4.
12 (3
.19)
93.9
7 (2
1.85
)−1
6.06
(20.
83)
28.1
8 (6
.38)
Last
−4.0
8 (5
.37)
4.01
(3.5
7)82
.26
(25.
27)
−25.
77 (2
4.36
)32
.57
(10.
43)
p0.
670.
22<
0.00
010.
0002
0.00
2V
F-M
D -
visu
al fi
eld
mea
n de
viat
ion,
VF-
PSD
- vi
sual
fiel
d pa
ttern
stan
dard
dev
iatio
n, O
CT-
MD
- m
ean
diff
eren
ce b
etw
een
poin
t mea
sure
men
t and
age
adj
uste
d no
rmat
ive
valu
e, O
CT-
PSD
-st
anda
rd d
evia
tion
of th
e m
ean
diff
eren
ce b
etw
een
poin
t mea
sure
men
t and
age
adj
uste
d no
rmat
ive
valu
e
Arch Ophthalmol. Author manuscript; available in PMC 2007 August 9.
NIH
-PA Author Manuscript
NIH
-PA Author Manuscript
NIH
-PA Author Manuscript
Wollstein et al. Page 19Ta
ble
3C
ross
-sec
tiona
l Pea
rson
cor
rela
tion
(r) b
etw
een
OC
T m
easu
res a
nd V
F in
dice
s for
eac
h vi
sit
OC
T-m
ean
pO
CT
-MD
pO
CT
-PSD
pV
isit
1 (N
= 6
4)V
F-M
D0.
50<0
.000
10.
380.
002
−0.2
70.
03V
F-PS
D−0
.55
<0.0
001
−0.4
30.
0004
0.27
0.03
Vis
it 2
(N =
64)
VF-
MD
0.43
0.00
040.
430.
0004
−0.3
40.
006
VF-
PSD
−0.5
3<0
.000
1−0
.45
0.00
020.
380.
002
Vis
it 3
(N =
62)
VF-
MD
0.53
<0.0
001
0.54
<0.0
001
−0.6
1<0
.000
1V
F-PS
D−0
.48
<0.0
001
−0.4
00.
001
0.43
0.00
04V
isit
4 (N
= 5
7)V
F-M
D0.
480.
0002
0.46
0.00
03−0
.43
0.00
1V
F-PS
D−0
.53
<0.0
001
−0.4
80.
0001
0.41
0.00
2V
F-M
D -
visu
al fi
eld
mea
n de
viat
ion,
VF-
PSD
- vi
sual
fiel
d pa
ttern
stan
dard
dev
iatio
n, O
CT-
MD
- m
ean
diff
eren
ce b
etw
een
poin
t mea
sure
men
t and
age
adj
uste
d no
rmat
ive
valu
e, O
CT-
PSD
-st
anda
rd d
evia
tion
of th
e m
ean
diff
eren
ce b
etw
een
poin
t mea
sure
men
t and
age
adj
uste
d no
rmat
ive
valu
e
Arch Ophthalmol. Author manuscript; available in PMC 2007 August 9.
NIH
-PA Author Manuscript
NIH
-PA Author Manuscript
NIH
-PA Author Manuscript
Wollstein et al. Page 20
Table 4Mean (SD) linear regression slope for glaucoma suspects and glaucoma patients
Glaucoma suspects (N = 9) Glaucoma (N = 55) pVF-MD dB/y −0.12 (0.45) 0.04 (0.54) 0.78VF-PSD dB/y −0.07 (0.16) −0.04 (0.36) 0.77OCT mean μm/y −2.56 (5.76) −2.21 (4.12) 0.88OCT-MD μm/y −2.10 (5.75) −1.77 (4.12) 0.87OCT-PSD μm/y −0.72 (1.73) 0.57 (1.85) 0.06VF-MD - visual field mean deviation, VF-PSD - visual field pattern standard deviation, OCT-MD - mean difference between point measurement and ageadjusted normative value, OCT-PSD - standard deviation of the mean difference between point measurement and age adjusted normative value
Arch Ophthalmol. Author manuscript; available in PMC 2007 August 9.
NIH
-PA Author Manuscript
NIH
-PA Author Manuscript
NIH
-PA Author Manuscript
Wollstein et al. Page 21
Table 5Mean (SD) linear regression slope for subjectively defined VF progressors and non-progressors
VF non-progressors (N = 39) VF-progressors (N = 25) pVF-MD dB/y 0.07 (0.45) −0.05 (0.64) 0.58VF-PSD dB/y −0.13 (0.33) 0.08 (0.33) 0.006OCT mean μm/y −2.14 (4.38) −2.44 (4.34) 0.87OCT-MD μm/y −1.70 (4.38) −2.00 (4.34) 0.86OCT-PSD μm/y 0.17 (1.97) 0.74 (1.68) 0.25VF-MD - visual field mean deviation, VF-PSD - visual field pattern standard deviation, OCT-MD - mean difference between point measurement and ageadjusted normative value, OCT-PSD - standard deviation of the mean difference between point measurement and age adjusted normative value
Arch Ophthalmol. Author manuscript; available in PMC 2007 August 9.

NIH
-PA Author Manuscript
NIH
-PA Author Manuscript
NIH
-PA Author Manuscript
Wollstein et al. Page 22
Table 6Mean (SD) linear regression slope stratified by baseline VF-MD
≥ −5dB (N = 53) < −5dB (N = 11) pVF-MD dB/y 0.02 (0.48) 0.00 (0.73) 0.86VF-PSD dB/y −0.06 (0.34) 0.03 (0.34) 0.17OCT mean μm/y −2.40 (4.46) −1.60 (3.78) 0.21OCT-MD μm/y −1.96 (4.46) −1.16 (3.77) 0.21OCT-PSD μm/y 0.29 (1.83) 0.90 (2.10) 0.33VF-MD - visual field mean deviation, VF-PSD - visual field pattern standard deviation, OCT-MD - mean difference between point measurement and ageadjusted normative value, OCT-PSD - standard deviation of the mean difference between point measurement and age adjusted normative value
Arch Ophthalmol. Author manuscript; available in PMC 2007 August 9.
Related Documents


![Research Article Analysis of Retinal Peripapillary ...downloads.hindawi.com/journals/bmri/2015/636548.pdfretinal degenerations have been described [ , ]. e retinal nerve berlayer(RNFL)iscomposedofretinal-ganglioncell](https://static.cupdf.com/doc/110x72/612026abd26ded4f3f5438f8/research-article-analysis-of-retinal-peripapillary-retinal-degenerations-have.jpg)


