Breakthrough Technologies Optical Coherence Microscopy. A Technology for Rapid, in Vivo, Non-Destructive Visualization of Plants and Plant Cells 1[w] James W. Hettinger, Matthew de la Pen ˜ a Mattozzi, Whittier R. Myers 2 , Mary E. Williams, Aaron Reeves, Ronald L. Parsons, Richard C. Haskell, Daniel C. Petersen, Ruye Wang, and June I. Medford* Department of Biology, Colorado State University, Fort Collins, Colorado 80523–1878 (J.W.H., A.R., R.L.P., J.I.M.); and Departments of Biology (M.d.l.P.M., M.E.W.), Physics (W.R.M., R.C.H., D.C.P.), and Engineering (R.W.), Harvey Mudd College, Claremont, California 91711 We describe the development and utilization of a new imaging technology for plant biology, optical coherence microscopy (OCM), which allows true in vivo visualization of plants and plant cells. This novel technology allows the direct, in situ (e.g. plants in soil), three-dimensional visualization of cells and events in shoot tissues without causing damage. With OCM we can image cells or groups of cells that are up to 1 mm deep in living tissues, resolving structures less than 5 mm in size, with a typical collection time of 5 to 6 min. OCM measures the inherent light-scattering properties of biological tissues and cells. These optical properties vary and provide endogenous developmental markers. Singly scattered photons from small (e.g. 5 3 5 3 10 mm) volume elements (voxels) are collected, assembled, and quantitatively false-colored to form a three- dimensional image. These images can be cropped or sliced in any plane. Adjusting the colors and opacities assigned to voxels allows us to enhance different features within the tissues and cells. We show that light-scattering properties are the greatest in regions of the Arabidopsis shoot undergoing developmental processes. In large cells, high light scattering is produced from nuclei, intermediate light scatter is produced from cytoplasm, and little if any light scattering originates from the vacuole and cell wall. OCM allows the rapid, repetitive, non-destructive collection of quantitative data about inherent properties of cells, so it provides a means of continuously monitoring plants and plant cells during development and in response to exogenous stimuli. Studies in plant physiology and development char- acteristically follow changes in space and time that occur as part of normal plant activity or in response to exogenous stimuli. Typical studies require the de- struction and analysis of a plant or a tissue sample, followed by the collection and analysis of a second distinct plant or sample. Thus, biological responses or changes are inferred by comparing different plants or samples. Such approaches have been used for centuries and have produced a great deal of knowl- edge. However, when scientists are able to non- destructively follow biological changes, important concepts and insights have emerged. For example, critical genes involved in programmed cell death were found in Caenorhabditis elegans partially because the developing nematode is nearly transparent, al- lowing the fate of each cell to be followed in vivo by light microscopy (Gilbert, 1998). Similarly, an elegant fate map for Arabidopsis roots was constructed be- cause the relatively transparent roots allow changes in individual plants to be followed continuously (Dolan et al., 1993). This study led to new discoveries such as the presence of downward communication between mature root cells and the root apical meris- tem and short-range control of differentiation signals (van den Berg et al., 1997a, 1997b). Except for the relatively transparent Arabidopsis root, plants provide a challenge for in vivo analyses. For example, plant shoots are highly pigmented and many key processes take place in cells and tissues that are deeply buried. Technologies that allow a limited type of in vivo imaging of plants have been developed. For example, magnetic resonance imag- ing (MRI) allows imaging of plants (Faust et al., 1997). However, image collection requires a long time period, and the relatively low resolution gener- ally limits its use to large morphological features such as those in fruits and seeds (Faust et al., 1997). Confocal microscopy allows imaging of transgenic plants containing green fluorescent protein (GFP) or fixed plants stained with propidium iodide (Running et al., 1995; Haseloff, 1999). Imaging with GFP, how- ever, is limited to relatively shallow depths of 60 to 80 mm (Haseloff, 1999). Also, GFP imaging appears to involve the production of free radicals, which are potentially damaging to the plant (Haseloff, 1999). Because of its shallow penetration depths, confocal imaging of the shoot apex typically involves the re- 1 This work was supported by the National Science Foundation (grant no. DBI–9612240 to R.C.H., D.C.P., R.W., M.E.W., and Scott Fraser [California Institute of Technology]). 2 Present address: Department of Physics, 366 LeConte Hall, University of California, Berkeley, CA 94720 –7300. [w] The on-line version of this article contains Web-only data. This version is available at www.plantphysiol.org. * Corresponding author; e-mail [email protected]; fax 970 – 491– 0649. Plant Physiology, May 2000, Vol. 123, pp. 3–15, www.plantphysiol.org © 2000 American Society of Plant Physiologists 3 www.plantphysiol.org on December 20, 2018 - Published by Downloaded from Copyright © 2000 American Society of Plant Biologists. All rights reserved.

Welcome message from author
This document is posted to help you gain knowledge. Please leave a comment to let me know what you think about it! Share it to your friends and learn new things together.
Transcript

Breakthrough Technologies
Optical Coherence Microscopy. A Technology forRapid, in Vivo, Non-Destructive Visualization ofPlants and Plant Cells1[w]
James W. Hettinger, Matthew de la Pena Mattozzi, Whittier R. Myers2, Mary E. Williams, Aaron Reeves,Ronald L. Parsons, Richard C. Haskell, Daniel C. Petersen, Ruye Wang, and June I. Medford*
Department of Biology, Colorado State University, Fort Collins, Colorado 80523–1878 (J.W.H., A.R., R.L.P.,J.I.M.); and Departments of Biology (M.d.l.P.M., M.E.W.), Physics (W.R.M., R.C.H., D.C.P.), and Engineering(R.W.), Harvey Mudd College, Claremont, California 91711
We describe the development and utilization of a new imaging technology for plant biology, optical coherence microscopy(OCM), which allows true in vivo visualization of plants and plant cells. This novel technology allows the direct, in situ (e.g.plants in soil), three-dimensional visualization of cells and events in shoot tissues without causing damage. With OCM wecan image cells or groups of cells that are up to 1 mm deep in living tissues, resolving structures less than 5 mm in size, witha typical collection time of 5 to 6 min. OCM measures the inherent light-scattering properties of biological tissues and cells.These optical properties vary and provide endogenous developmental markers. Singly scattered photons from small (e.g.5 3 5 3 10 mm) volume elements (voxels) are collected, assembled, and quantitatively false-colored to form a three-dimensional image. These images can be cropped or sliced in any plane. Adjusting the colors and opacities assigned to voxelsallows us to enhance different features within the tissues and cells. We show that light-scattering properties are the greatestin regions of the Arabidopsis shoot undergoing developmental processes. In large cells, high light scattering is producedfrom nuclei, intermediate light scatter is produced from cytoplasm, and little if any light scattering originates from thevacuole and cell wall. OCM allows the rapid, repetitive, non-destructive collection of quantitative data about inherentproperties of cells, so it provides a means of continuously monitoring plants and plant cells during development and inresponse to exogenous stimuli.
Studies in plant physiology and development char-acteristically follow changes in space and time thatoccur as part of normal plant activity or in responseto exogenous stimuli. Typical studies require the de-struction and analysis of a plant or a tissue sample,followed by the collection and analysis of a seconddistinct plant or sample. Thus, biological responsesor changes are inferred by comparing different plantsor samples. Such approaches have been used forcenturies and have produced a great deal of knowl-edge. However, when scientists are able to non-destructively follow biological changes, importantconcepts and insights have emerged. For example,critical genes involved in programmed cell deathwere found in Caenorhabditis elegans partially becausethe developing nematode is nearly transparent, al-lowing the fate of each cell to be followed in vivo bylight microscopy (Gilbert, 1998). Similarly, an elegantfate map for Arabidopsis roots was constructed be-
cause the relatively transparent roots allow changesin individual plants to be followed continuously(Dolan et al., 1993). This study led to new discoveriessuch as the presence of downward communicationbetween mature root cells and the root apical meris-tem and short-range control of differentiation signals(van den Berg et al., 1997a, 1997b).
Except for the relatively transparent Arabidopsisroot, plants provide a challenge for in vivo analyses.For example, plant shoots are highly pigmented andmany key processes take place in cells and tissuesthat are deeply buried. Technologies that allow alimited type of in vivo imaging of plants have beendeveloped. For example, magnetic resonance imag-ing (MRI) allows imaging of plants (Faust et al.,1997). However, image collection requires a longtime period, and the relatively low resolution gener-ally limits its use to large morphological featuressuch as those in fruits and seeds (Faust et al., 1997).Confocal microscopy allows imaging of transgenicplants containing green fluorescent protein (GFP) orfixed plants stained with propidium iodide (Runninget al., 1995; Haseloff, 1999). Imaging with GFP, how-ever, is limited to relatively shallow depths of 60 to80 mm (Haseloff, 1999). Also, GFP imaging appears toinvolve the production of free radicals, which arepotentially damaging to the plant (Haseloff, 1999).Because of its shallow penetration depths, confocalimaging of the shoot apex typically involves the re-
1 This work was supported by the National Science Foundation(grant no. DBI–9612240 to R.C.H., D.C.P., R.W., M.E.W., and ScottFraser [California Institute of Technology]).
2 Present address: Department of Physics, 366 LeConte Hall,University of California, Berkeley, CA 94720 –7300.
[w] The on-line version of this article contains Web-only data.This version is available at www.plantphysiol.org.
* Corresponding author; e-mail [email protected];fax 970 – 491– 0649.
Plant Physiology, May 2000, Vol. 123, pp. 3–15, www.plantphysiol.org © 2000 American Society of Plant Physiologists 3 www.plantphysiol.orgon December 20, 2018 - Published by Downloaded from Copyright © 2000 American Society of Plant Biologists. All rights reserved.

moval of overlying leaves (Running et al., 1995; Ha-seloff, 1999). Furthermore, because confocal micros-copy and GFP imaging often require a fluorescenceexcitation light source, endogenous autofluorescencefrom plant pigments and cell walls can interfere withimaging.
We have developed and used a new imaging tech-nology for plants, optical coherence microscopy(OCM). Plant cells and intact plants are imaged di-rectly (e.g. in soil) without any type of stain, pretreat-ment, or transgene insertion. The technology uses thenatural penetration of light into living tissues andthe back-scattering of photons from inherent cellu-lar components (Fujimoto et al., 1998). Back-scattered photons are collected, measured, and usedto assemble an image. Therefore, we have devel-oped a technology that allows us to rapidly, contin-uously, and noninvasively follow micrometer-sizechanges within plant tissues.
RESULTS
OCM
The remarkable achievement of OCM is the abilityto image cells located up to 1 mm deep in tissue.Overlying tissue that is highly scattering obscuresthese deeper structures when using any other type ofoptical microscopy. Figure 1A illustrates this point.An image of deep target cells can be formed withphotons that illuminate the cells, scatter once fromthe cells, and are subsequently collected by a lens.However, most photons collected by the lens willhave been scattered once or multiple times from theoverlying tissue, probably never encountering thecells of interest. These photons carry no informationabout the target cells. OCM preferentially selectsthose photons that have been scattered once from thetarget cells by requiring that all photons used to forman image have traveled a specified total path lengthin the tissue. For example, in Figure 1A (left), thetotal path length required could be the distance fromthe air-tissue interface to the target cells and back upto the tissue-air interface, where photons are col-lected by the lens. Most photons scattered by theoverlying tissue will not have this particular totalpath length and will be excluded from the imageformation process (Fig. 1A, right). This exclusion isnot absolute: some photons that are multiply scat-tered from overlying tissue will satisfy the pathlength requirement, and these photons ultimatelyplace a limit on the depth to which OCM is effective.
OCM imaging involves two steps, the collection ofback-scattered light from plants, and then the visu-alization of the data sets as three-dimensional im-ages. The optical principles behind this type of im-aging have been reviewed by Masters (1999) andFercher (1996). Our instrument is similar to that de-scribed by Izatt (1996). A more detailed descriptionof the instrument is provided by Hoeling et al. (2000).
A schematic of the OCM instrument we used isshown in Figure 1B. Near-infrared light at 850 nm(for good penetration in tissue) was provided by avery low intensity (300-mW) superluminescent diode(SLD) so that there was no damage to the plant or
Figure 1. Optical coherence microscope: fundamental principle andschematic. A, In forming an image of deep target cells, OCM pref-erentially selects photons that are singly scattered from the targetcells (left) and rejects photons that are scattered from overlying tissue(right). B, Near-infrared light (850 nm) is emitted by an SLD andtravels along a single-mode optical fiber to the beamsplitter of aMichelson interferometer. Roughly 50% of the light travels along anoptical fiber to a reference mirror whose position is controlled by acomputer. The other 50% of the light travels along an optical fiber tothe sample and is focused to a 5-mm diameter spot in the plant tissue.A pair of rotating mirrors moves the focused spot across the x-yplane. To move the focused spot deeper into the tissue, motorizedactuators translate the lens toward the plant. Photons traveling thesame path length in the sample and reference arms combine to forminterference fringes on the photodetector at the output of the Mich-elson interferometer. The amplitude of the fringes is measured elec-tronically and stored in the computer as the beam is scanned throughthe sample volume. Fringe amplitude is proportional to the squareroot of the scattering coefficient of the sample volume element underexamination.
Hettinger et al.
4 Plant Physiol. Vol. 123, 2000 www.plantphysiol.orgon December 20, 2018 - Published by Downloaded from Copyright © 2000 American Society of Plant Biologists. All rights reserved.

plant cells. The light beam travels along single-modeoptical fibers. The light is split (50/50), with halfgoing along the sample arm to the plant and halfgoing along the reference arm to a mirror. In thesample arm the light beam is focused to a diameter ofapproximately 5 mm. The coherence length of theSLD is 10 mm, so the resolution volume probed at anyparticular time is 5 mm in diameter by 10 mm long.Rotating mirrors are used to move the light beam inthe transverse directions (x and y) at a specifieddepth (z plane). A typical scan will collect back-scattered light from 100 voxels along both the x andy directions (for 10,000 voxels in a single z plane).
The distance the beam moves between voxels isadjustable, which affects both the sampling intervaland the size of the image. After each scan of a z plane,the focusing lens is stepped down in depth and an-other z plane is scanned. Light back-scattered fromeach voxel returns via the sample arm optical fiber tothe beamsplitter, where it recombines with light re-turning from the reference mirror of a Michelsoninterferometer (Fig. 1B). If the path lengths in thereference and sample arms are the same to within acoherence length of the SLD (approximately 10 mm),interference fringes will be recorded by the photode-tector. The amplitude of the fringes is recorded andstored in computer memory as a three-dimensionaldata set. The fringe amplitude is proportional to thesquare root of the intensity back-scattered from eachtissue voxel, so the OCM image is a quantitativemeasure of the back-scattering property of the tissue.
Light scattered by tissue overlying the cells of in-terest may also return via the sample arm opticalfiber. However, most of this light will have traveleda different total path length and will not contribute tointerference fringes at the photodetector. The OCMrecords the amplitude of the interference fringesonly, so photons scattered by overlying tissue areeffectively rejected and do not contribute to the OCMimage.
OCM Images of Plants
OCM images can be obtained of plants growing insoil without any type of treatment, staining, or trans-genic production. Our early OCM studies indicatedthat trichomes back-scattered an inordinately largeamount of light, which masks the underlying lightscattering of plant tissues and organs. This observa-tion is corroborated by a previous study showingthat trichomes greatly scatter light (Gausman, 1977).To avoid the problematic light scattering fromtrichomes, we used plants with a trichome defi-ciency (glabrous-1, gl-1) as our standard geneticbackground.
Figure 2A shows an OCM image of an Arabidopsisshoot. This image is derived from back-scatteredlight from 1 million voxels (100 voxels in each dimen-sion) that are spaced 7.5 3 7.5 3 5 mm (x 3 y 3 z)
Figure 2. OCM and SEM images of a 9-d-old Arabidopsis plant. A,Three-dimensional OCM image of an Arabidopsis shoot. The imageis 750 mm in x and y, and 500 mm in depth (into the page, z). Leaves3 and 4 and the petiole of an older leaf are indicated. This image hasbeen rotated slightly to align better with the SEM images. Edges of thescanned volume are indicated with arrows. B, Scanning electronmicrograph of the same plant as in A at a magnification close to thatof the OCM. C, Scanning electron micrograph at a lower magnifica-tion showing the entire shoot. L3 and L4, Leaf primordia 3 and 4; Pet,petiole. Scale bars in A and B 5 100 mm and C 5 1 mm.
Optical Coherence Microscopy. A Rapid, in Vivo, Non-Destructive Imaging Technology
Plant Physiol. Vol. 123, 2000 5 www.plantphysiol.orgon December 20, 2018 - Published by Downloaded from Copyright © 2000 American Society of Plant Biologists. All rights reserved.
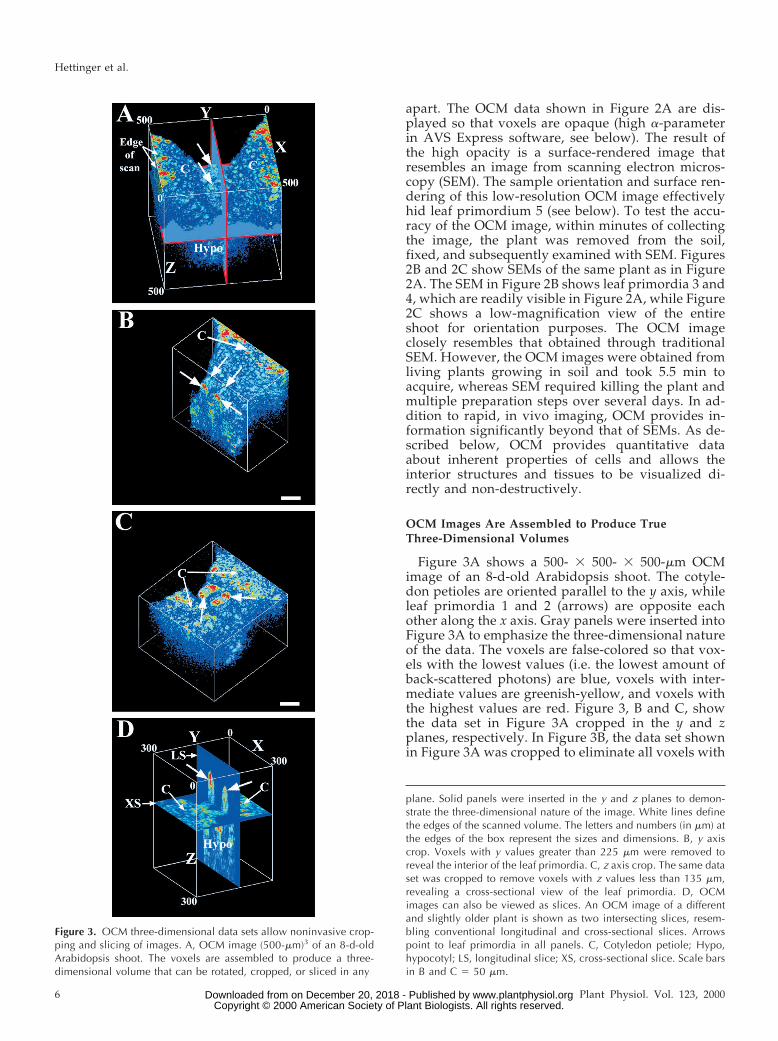
apart. The OCM data shown in Figure 2A are dis-played so that voxels are opaque (high a-parameterin AVS Express software, see below). The result ofthe high opacity is a surface-rendered image thatresembles an image from scanning electron micros-copy (SEM). The sample orientation and surface ren-dering of this low-resolution OCM image effectivelyhid leaf primordium 5 (see below). To test the accu-racy of the OCM image, within minutes of collectingthe image, the plant was removed from the soil,fixed, and subsequently examined with SEM. Figures2B and 2C show SEMs of the same plant as in Figure2A. The SEM in Figure 2B shows leaf primordia 3 and4, which are readily visible in Figure 2A, while Figure2C shows a low-magnification view of the entireshoot for orientation purposes. The OCM imageclosely resembles that obtained through traditionalSEM. However, the OCM images were obtained fromliving plants growing in soil and took 5.5 min toacquire, whereas SEM required killing the plant andmultiple preparation steps over several days. In ad-dition to rapid, in vivo imaging, OCM provides in-formation significantly beyond that of SEMs. As de-scribed below, OCM provides quantitative dataabout inherent properties of cells and allows theinterior structures and tissues to be visualized di-rectly and non-destructively.
OCM Images Are Assembled to Produce TrueThree-Dimensional Volumes
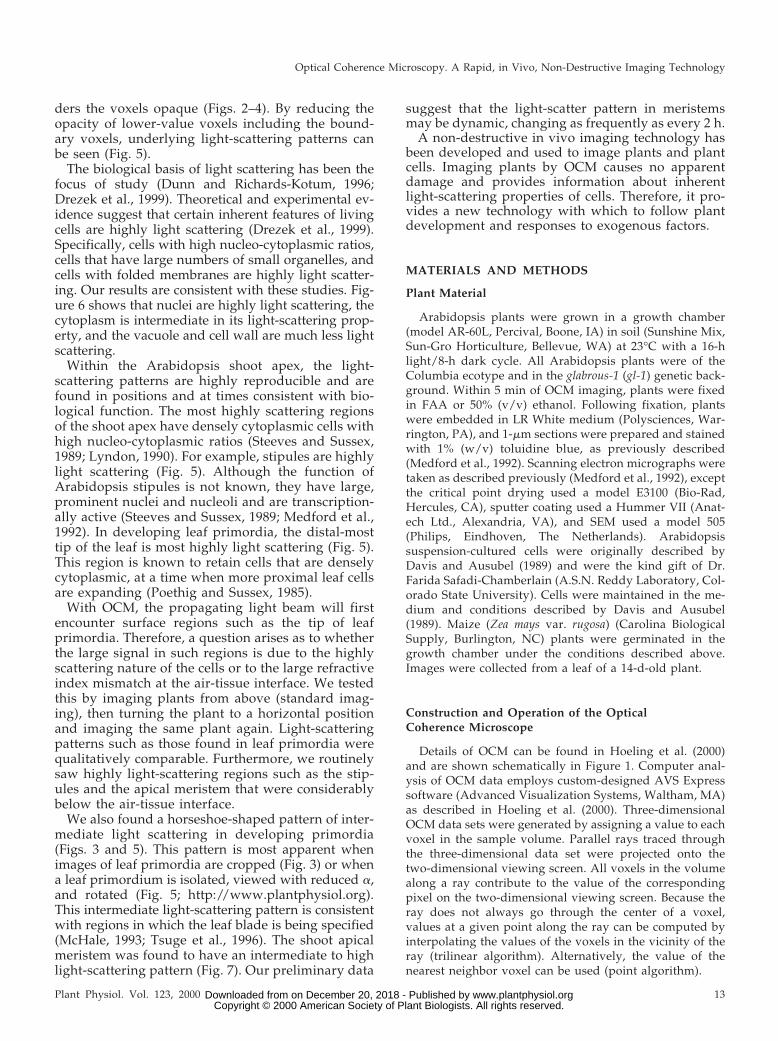
Figure 3A shows a 500- 3 500- 3 500-mm OCMimage of an 8-d-old Arabidopsis shoot. The cotyle-don petioles are oriented parallel to the y axis, whileleaf primordia 1 and 2 (arrows) are opposite eachother along the x axis. Gray panels were inserted intoFigure 3A to emphasize the three-dimensional natureof the data. The voxels are false-colored so that vox-els with the lowest values (i.e. the lowest amount ofback-scattered photons) are blue, voxels with inter-mediate values are greenish-yellow, and voxels withthe highest values are red. Figure 3, B and C, showthe data set in Figure 3A cropped in the y and zplanes, respectively. In Figure 3B, the data set shownin Figure 3A was cropped to eliminate all voxels with
Figure 3. OCM three-dimensional data sets allow noninvasive crop-ping and slicing of images. A, OCM image (500-mm)3 of an 8-d-oldArabidopsis shoot. The voxels are assembled to produce a three-dimensional volume that can be rotated, cropped, or sliced in any
plane. Solid panels were inserted in the y and z planes to demon-strate the three-dimensional nature of the image. White lines definethe edges of the scanned volume. The letters and numbers (in mm) atthe edges of the box represent the sizes and dimensions. B, y axiscrop. Voxels with y values greater than 225 mm were removed toreveal the interior of the leaf primordia. C, z axis crop. The same dataset was cropped to remove voxels with z values less than 135 mm,revealing a cross-sectional view of the leaf primordia. D, OCMimages can also be viewed as slices. An OCM image of a differentand slightly older plant is shown as two intersecting slices, resem-bling conventional longitudinal and cross-sectional slices. Arrowspoint to leaf primordia in all panels. C, Cotyledon petiole; Hypo,hypocotyl; LS, longitudinal slice; XS, cross-sectional slice. Scale barsin B and C 5 50 mm.
Hettinger et al.
6 Plant Physiol. Vol. 123, 2000 www.plantphysiol.orgon December 20, 2018 - Published by Downloaded from Copyright © 2000 American Society of Plant Biologists. All rights reserved.

y coordinates greater than 225 mm, effectively “cut-ting into” the developing leaf primordia and hypo-cotyl. In Figure 3C, the data set was cropped toremove all voxels with z coordinates less than 135mm, effectively producing a “cross-sectional” view ofthe leaf primordia and cotyledon petioles. In cross-section, the highest light-scattering regions are seenat the lateral edges of the leaf primordia in a positionconsistent with the developing leaf blade (McHale,1993; Tsuge et al., 1996). To further demonstrate thethree-dimensional nature of the OCM data, we haveassembled a video showing this data set cropped ineach plane and rotated (compare with http://www.colostate.edu/Depts/Biology/OCM and http://www.plantphysiol.org). Figure 3D shows that OCM data canbe visualized in any plane as voxel-thick volumes orslices. In Figure 3D, an OCM image of a different(slightly older) Arabidopsis shoot is shown as twointersecting, two-dimensional slices.
Visualization of OCM Data Sets
All of the three-dimensional data sets were imagedusing AVS Express.
Effects of Voxel Sampling Density
The voxel probed by the OCM at any particulartime is a cylinder approximately 5 mm in diameter by10 mm in depth. However, by collecting light fromvoxels spaced more closely than 5 mm, finer detailcan normally be seen, particularly when there is alarge difference in scattering properties betweenneighboring voxels. (A similar strategy was recentlyreported to improve image quality in ophthalmolog-ical studies: Gurses-Ozden et al., 1999.) Decreasingvoxel density allows a larger area to be scanned, butresults in an image with less detail (e.g. Fig. 2A). Toaccount for the effect of voxel sampling density, wetypically perform two scans of a sample: a large-areascan with less definition and a small-area scan withmore definition. Figure 4, A and B, shows two imagesof the same Arabidopsis plant taken within minutesof each other but with a voxel spacing of 7 3 7 3 5mm or 3 3 3 3 5 mm, respectively. The image shownin Figure 4A was collected with lower voxel density,so it includes a wider area but has less definition thanthe image shown in Figure 4B. The image collectedwith higher voxel density provides finer detail about
Figure 4. Effects of voxel spacing and smoothing algorithm on visualization of OCM data. All panels show the same 7-d-oldArabidopsis plant. All panels (except F) are oriented with the cotyledons or cotyledon petioles at the panel sides. A, OCMimage produced with voxels spaced 7 mm apart. Arrows indicate leaf primordia; arrowhead indicates stipules. B, OCMimage produced with voxels spaced 3 mm apart. C, SEM image of the plant shown in A, B, D, and E. The same data set asshown in B was cropped to remove some of the voxels including those of the outermost surface of the leaf primordia. D,Image smoothed using AVS trilinear algorithm. E, Image generated without the smoothing algorithm. F, Higher magnificationSEM in which stipules can be seen (arrowhead). Scale bars in A 5 250 mm; B, D, and E 5 100 mm; C 5 500 mm; and F 550 mm.
Optical Coherence Microscopy. A Rapid, in Vivo, Non-Destructive Imaging Technology
Plant Physiol. Vol. 123, 2000 7 www.plantphysiol.orgon December 20, 2018 - Published by Downloaded from Copyright © 2000 American Society of Plant Biologists. All rights reserved.

the structure of the plant and its inherent light-scattering properties. For comparison, SEMs of thesame plant are shown in Figure 4, C and F.
Boundary Effect
The boundary of the plant tissue is typically false-colored blue in our OCM images. At the micron level,the edge of a plant is irregular and never preciselyfills a voxel. Therefore, the voxels at the air-tissueinterface, or boundary voxels, normally have lowvalues, as only a portion of their volume representstissue. When the boundary voxels are not included inthe image, the higher light-scattering regions withinthe tissue are more apparent. Boundary voxels can beexcluded in two ways. In the image shown in Figure4A, the scan begins within the tissue of the cotyle-dons, so the air-tissue boundary is excluded and theunderlying light scattering of the cotyledons is evi-dent. Similarly, the boundary voxels can be removedby cropping the image, which reveals the light scat-tering of the underlying tissue. For example, com-pare Figure 4B, in which the leaf primordia appearblue because of the boundary voxels, with Figure 4, Dand E, in which the same data set has been croppedto remove some of the voxels, including those at theair-tissue interface.
Interpolation
We use two different methods to project our three-dimensional data sets onto a two-dimensional view-ing screen. All OCM images shown to this point havebeen constructed using the trilinear algorithm, whichinterpolates between voxels in the AVS Express soft-ware. When displayed using the trilinear algorithm,OCM images show morphological features resem-bling those seen with direct visualization or SEM. Incontrast, images may also be rendered using anearest-neighbor algorithm (point algorithm). Whenthe point algorithm is used, each display element ofany plane in the three-dimensional volume is basedon the value of a single voxel, rather than an inter-polation of several voxel values. We routinely exam-ine our OCM images with both the point algorithmand the trilinear algorithm. Figure 4, D and E, showthe same data set displayed with the trilinear algo-rithm or with the point algorithm. With the pointalgorithm, individual voxels are seen and the overallimage appears pixelated (Fig. 4E). With the trilinearalgorithm, the image appears less jagged orsmoothed. Because of the better morphological ap-pearance displayed with the trilinear algorithm, weroutinely employed it for most images.
Colormaps and a-Settings
The software employed to visualize the OCM dataallows a wide range of options for data display.
These options, used to control the way in which dataare false-colored, are valuable as they allow us tovisualize different features and produce see-throughimages. Figure 5, A through D, display a portion ofthe same data set shown in Figure 4, B, D, and E, butcropped and rotated so that only one leaf primor-dium is displayed. Because our system crops (orslices) in voxel volume increments, and organs in theshoot apex are at times touching each other, we can-not cleanly isolate a leaf primordium from surround-ing tissues in images of this plant (Fig. 5A, arrow-head). Figure 5A shows the leaf primordium viewedwith the same settings as used in Figures 2 through 4,in which the blue boundary voxels are renderedopaque, resulting in a surface view. The slightly con-cave adaxial and convex abaxial surfaces of the pri-mordium are evident. The plant’s prominent stipules(Fig. 4F) have been sliced into and appear as highlyscattering structures in the OCM image (marked “S”in Fig. 5A).
We adjusted the color assigned to voxels of variousvalues, or the colormap, so that voxels with lowvalues corresponding to background (electrical)noise are transparent and appear black. Voxels withvalues above the noise level are assigned colors rang-ing from blue (low values) to red (high values) usinga linear scale. The voxel values are proportional tothe square root of the light back-scattering coefficient(Hoeling et al., 2000). At the bottom of each panel wehave placed the exact colormap used to produce eachimage. In Figure 5A, the colormap indicates that thefeatures within the stipules that are false-colored redare approximately (240/15)2, or 256, times morehighly light scattering than the blue boundary voxelsat the surface of the primordium.
We can adjust the apparent voxel opacity (a-parameter) independently of the colormap to revealthe internal structure of the tissue. In Figure 5A,the voxels are opaque, and only the blue boundaryvoxels of the leaf primordium are evident. Figures5B and 5C show the effects of reducing the opacity(a-parameter). By reducing the tissue opacity, a highlight-scattering region at the distal region of the leafprimordium is seen (indicated by an arrow in Fig. 5B).
By adjusting the colormap, without altering theopacity, we can enhance the appearance of voxelsof intermediate light-scattering values. In Figure 5Dthe colormap is compressed as indicated and an in-termediate light-scattering pattern, false-colored anorange-yellow, is seen to form a horseshoe-shapedpattern within the leaf primordium. However, bycompressing the colormap, the quantitative differ-ences between red and blue are reduced. In Figure5D, voxels colored red are at least (105/15)2, or 49-fold, more light scattering than those colored blue.The three-dimensional nature of this horseshoe-shaped pattern is better demonstrated when the leafprimordium’s image is rotated (see http://www.plantphysiol.org). Furthermore, when the leaf pri-
Hettinger et al.
8 Plant Physiol. Vol. 123, 2000 www.plantphysiol.orgon December 20, 2018 - Published by Downloaded from Copyright © 2000 American Society of Plant Biologists. All rights reserved.

mordium is rotated, the high light scattering at thedistal-most tip appears more prevalent toward theadaxial surface of the developing primordium.
Visualization of Cells/OCM Resolution
In the images shown in Figures 2 through 5, indi-vidual cells are not distinctly resolved. In Arabidop-sis meristems and young leaf primordia, cells aretypically 5 to 10 mm in size (Medford et al., 1992),which is near the size of the volume element probedby our OCM (Hoeling et al., 2000). To determine ifOCM can resolve individual cells and subcellularfeatures, we examined larger cells in planta and inculture.
Figure 6A shows an in planta image of maize leafcells from a 14-d-old maize plant. The long axis of theleaf runs from the left to right, parallel to the longaxes of the cells. Highly light-scattering regions areapparent at the periphery of the cells. As maize leafcells are highly vacuolated, this region encompassesboth the cytoplasm and the cell wall. To identifywhich cellular features are the cause of the lightscattering, we examined large, vacuolated cells froman aneuploid Arabidopsis suspension culture line(Davis and Ausubel, 1989). Figures 6B and 6C showthe optical coherence and light microscope images,respectively, of a cluster of suspension-cultured cells.The prominent nuclei (arrows) and large vacuolestypical of these cells are evident in the bright-fieldlight microscope image (Fig. 6C). In the OCM image,the nuclei (arrows) are highly scattering and there-fore false-colored red (Fig. 6B). The cytoplasm, whichis closely pressed against cell walls, produces lesslight scatter, and these intermediate scattering valuesare false-colored yellow-green. Figure 6, D through F,show a different cluster of cells that have a sea horseshape. In the dark-field light microscope image, thecytoplasmic membrane of the second cell from thebottom has retracted from the cell wall and appearsas a wavy protoplast (Fig. 6E, arrowhead). In the
Figure 5. Adjusting the a-parameter and colormap allows differentaspects of the data to be emphasized. The same data set seen in
Figure 4B was cropped to display only one leaf primordium. Theexact color map used to produce the image is seen at the base of eachpanel. Voxels of higher light scattering are colored red. A, Imagesdisplayed with a high opacity show outside features like those of anSEM. Stipules (indicated by arrows) are highly light scattering. Ar-rowhead indicates residual cotyledon tissue. B, The opacity withwhich voxels are displayed can be reduced by adjusting thea-parameter, allowing underlying light-scattering patterns to be seen.Arrow indicates a highly scattering region at the distal end of the leafprimordium. C, Lowering the a-parameter more renders an imagethat is nearly completely transparent. D, Image produced using thesame a-factor as in C, but in which the color map has been com-pressed, rendering voxels of intermediate value in reds and yellows.Ab, Abaxial surface; Ad, adaxial surface; L2, a portion of leaf pri-mordium 2 that was not cropped from this image; S, stipules. Scalebars in A through D 5 100 mm. A dynamic presentation of the effectsof adjusting the a-parameter and color map and a rotation of the leafprimordium’s image can be found at http://www.plantphysiol.org.
Optical Coherence Microscopy. A Rapid, in Vivo, Non-Destructive Imaging Technology
Plant Physiol. Vol. 123, 2000 9 www.plantphysiol.orgon December 20, 2018 - Published by Downloaded from Copyright © 2000 American Society of Plant Biologists. All rights reserved.
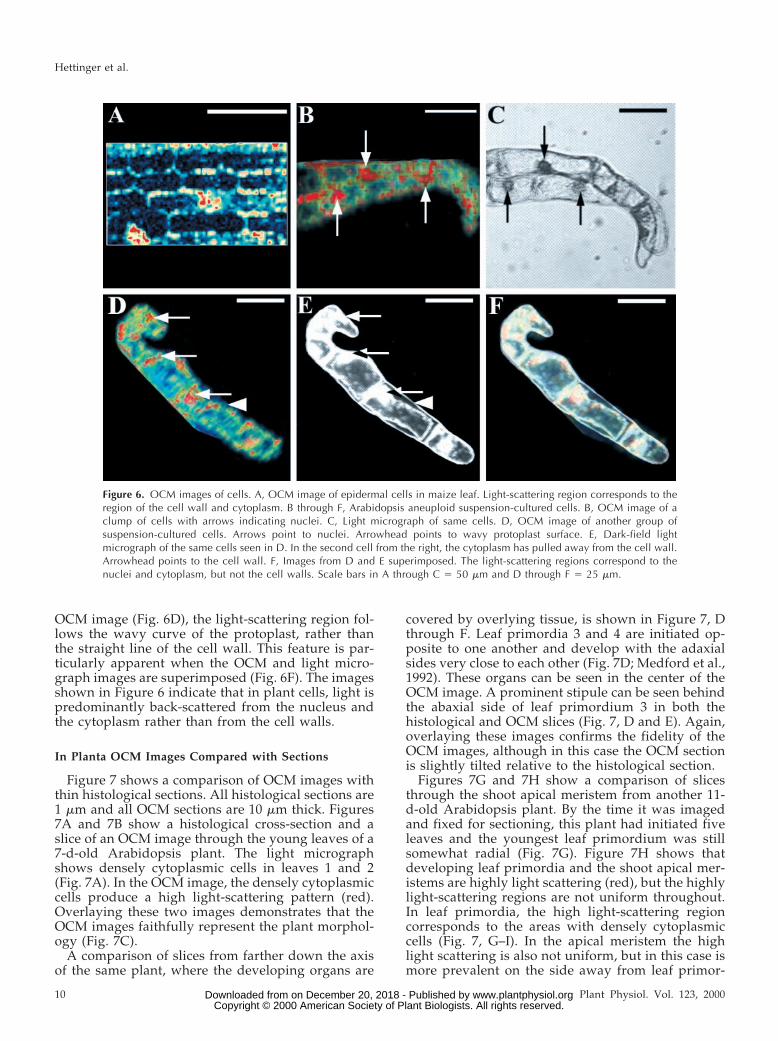
OCM image (Fig. 6D), the light-scattering region fol-lows the wavy curve of the protoplast, rather thanthe straight line of the cell wall. This feature is par-ticularly apparent when the OCM and light micro-graph images are superimposed (Fig. 6F). The imagesshown in Figure 6 indicate that in plant cells, light ispredominantly back-scattered from the nucleus andthe cytoplasm rather than from the cell walls.
In Planta OCM Images Compared with Sections
Figure 7 shows a comparison of OCM images withthin histological sections. All histological sections are1 mm and all OCM sections are 10 mm thick. Figures7A and 7B show a histological cross-section and aslice of an OCM image through the young leaves of a7-d-old Arabidopsis plant. The light micrographshows densely cytoplasmic cells in leaves 1 and 2(Fig. 7A). In the OCM image, the densely cytoplasmiccells produce a high light-scattering pattern (red).Overlaying these two images demonstrates that theOCM images faithfully represent the plant morphol-ogy (Fig. 7C).
A comparison of slices from farther down the axisof the same plant, where the developing organs are
covered by overlying tissue, is shown in Figure 7, Dthrough F. Leaf primordia 3 and 4 are initiated op-posite to one another and develop with the adaxialsides very close to each other (Fig. 7D; Medford et al.,1992). These organs can be seen in the center of theOCM image. A prominent stipule can be seen behindthe abaxial side of leaf primordium 3 in both thehistological and OCM slices (Fig. 7, D and E). Again,overlaying these images confirms the fidelity of theOCM images, although in this case the OCM sectionis slightly tilted relative to the histological section.
Figures 7G and 7H show a comparison of slicesthrough the shoot apical meristem from another 11-d-old Arabidopsis plant. By the time it was imagedand fixed for sectioning, this plant had initiated fiveleaves and the youngest leaf primordium was stillsomewhat radial (Fig. 7G). Figure 7H shows thatdeveloping leaf primordia and the shoot apical mer-istems are highly light scattering (red), but the highlylight-scattering regions are not uniform throughout.In leaf primordia, the high light-scattering regioncorresponds to the areas with densely cytoplasmiccells (Fig. 7, G–I). In the apical meristem the highlight scattering is also not uniform, but in this case ismore prevalent on the side away from leaf primor-
Figure 6. OCM images of cells. A, OCM image of epidermal cells in maize leaf. Light-scattering region corresponds to theregion of the cell wall and cytoplasm. B through F, Arabidopsis aneuploid suspension-cultured cells. B, OCM image of aclump of cells with arrows indicating nuclei. C, Light micrograph of same cells. D, OCM image of another group ofsuspension-cultured cells. Arrows point to nuclei. Arrowhead points to wavy protoplast surface. E, Dark-field lightmicrograph of the same cells seen in D. In the second cell from the right, the cytoplasm has pulled away from the cell wall.Arrowhead points to the cell wall. F, Images from D and E superimposed. The light-scattering regions correspond to thenuclei and cytoplasm, but not the cell walls. Scale bars in A through C 5 50 mm and D through F 5 25 mm.
Hettinger et al.
10 Plant Physiol. Vol. 123, 2000 www.plantphysiol.orgon December 20, 2018 - Published by Downloaded from Copyright © 2000 American Society of Plant Biologists. All rights reserved.
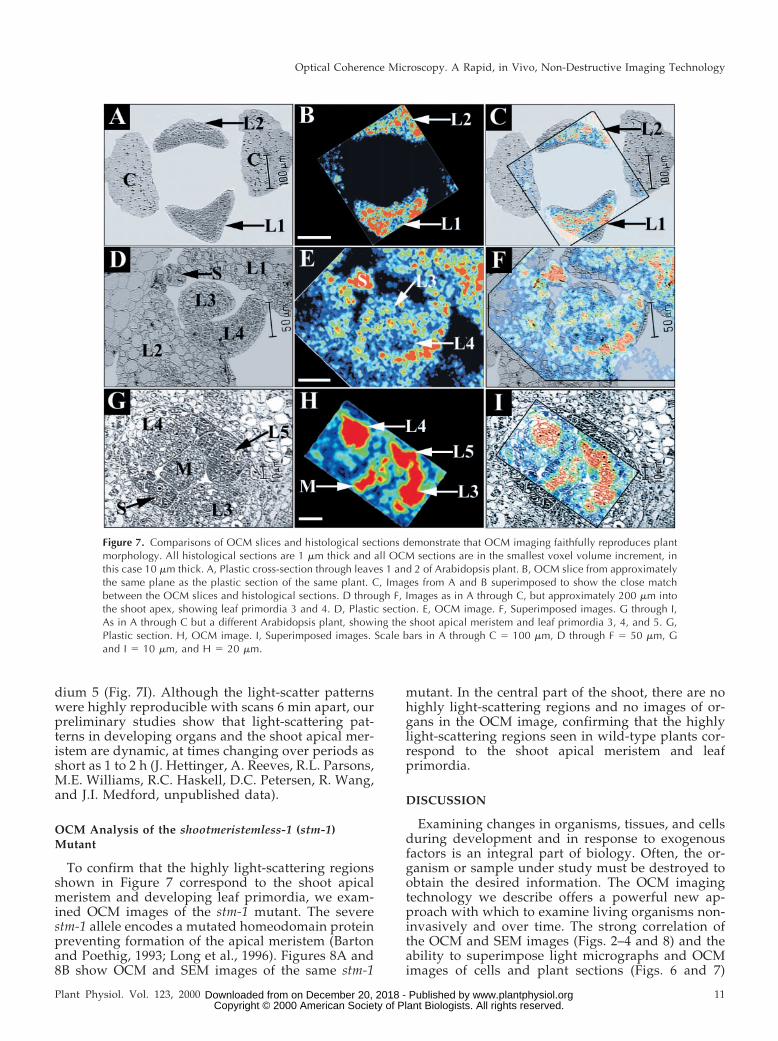
dium 5 (Fig. 7I). Although the light-scatter patternswere highly reproducible with scans 6 min apart, ourpreliminary studies show that light-scattering pat-terns in developing organs and the shoot apical mer-istem are dynamic, at times changing over periods asshort as 1 to 2 h (J. Hettinger, A. Reeves, R.L. Parsons,M.E. Williams, R.C. Haskell, D.C. Petersen, R. Wang,and J.I. Medford, unpublished data).
OCM Analysis of the shootmeristemless-1 (stm-1)Mutant
To confirm that the highly light-scattering regionsshown in Figure 7 correspond to the shoot apicalmeristem and developing leaf primordia, we exam-ined OCM images of the stm-1 mutant. The severestm-1 allele encodes a mutated homeodomain proteinpreventing formation of the apical meristem (Bartonand Poethig, 1993; Long et al., 1996). Figures 8A and8B show OCM and SEM images of the same stm-1
mutant. In the central part of the shoot, there are nohighly light-scattering regions and no images of or-gans in the OCM image, confirming that the highlylight-scattering regions seen in wild-type plants cor-respond to the shoot apical meristem and leafprimordia.
DISCUSSION
Examining changes in organisms, tissues, and cellsduring development and in response to exogenousfactors is an integral part of biology. Often, the or-ganism or sample under study must be destroyed toobtain the desired information. The OCM imagingtechnology we describe offers a powerful new ap-proach with which to examine living organisms non-invasively and over time. The strong correlation ofthe OCM and SEM images (Figs. 2–4 and 8) and theability to superimpose light micrographs and OCMimages of cells and plant sections (Figs. 6 and 7)
Figure 7. Comparisons of OCM slices and histological sections demonstrate that OCM imaging faithfully reproduces plantmorphology. All histological sections are 1 mm thick and all OCM sections are in the smallest voxel volume increment, inthis case 10 mm thick. A, Plastic cross-section through leaves 1 and 2 of Arabidopsis plant. B, OCM slice from approximatelythe same plane as the plastic section of the same plant. C, Images from A and B superimposed to show the close matchbetween the OCM slices and histological sections. D through F, Images as in A through C, but approximately 200 mm intothe shoot apex, showing leaf primordia 3 and 4. D, Plastic section. E, OCM image. F, Superimposed images. G through I,As in A through C but a different Arabidopsis plant, showing the shoot apical meristem and leaf primordia 3, 4, and 5. G,Plastic section. H, OCM image. I, Superimposed images. Scale bars in A through C 5 100 mm, D through F 5 50 mm, Gand I 5 10 mm, and H 5 20 mm.
Optical Coherence Microscopy. A Rapid, in Vivo, Non-Destructive Imaging Technology
Plant Physiol. Vol. 123, 2000 11 www.plantphysiol.orgon December 20, 2018 - Published by Downloaded from Copyright © 2000 American Society of Plant Biologists. All rights reserved.

indicates that OCM provides consistent and realisticimages of plant cells and intact plants.
OCM, a modification of optical coherence tomog-raphy, has previously been used for medical andmammalian applications (Boppart et al., 1997a,1997b, 1998a, 1998b, 1998c, 1999; Tearney et al., 1997;Fujimoto et al., 1998; Herrmann et al., 1998; Ripan-delli et al., 1998; Baumal, 1999; Chauhan and Mar-shall, 1999; Parisi et al., 1999). Our system (Hoeling etal., 2000; Fig. 1) is similar to these systems, yet hasnotable advantages. First, our system simultaneouslymoves the focusing lens and reference mirror in acoordinated way to keep the lateral resolution con-stant throughout the depth of the sample. Second,our voxel data are spaced roughly uniformly in allthree dimensions, so that our images have compa-rable resolution in all three dimensions. This uni-form voxel density facilitates the rotation, cropping,and slicing of the images (Fig. 3; http://www.plantphysiol.org).
OCM is substantially different from other imagingtechnologies. It is advantageous in that it can pene-trate to tissue depths approximately 10-fold greaterthan that of a confocal microscope (Running et al.,1995; Haseloff, 1999; Paddock, 1999). Some signalattenuation occurs with OCM with increasing scandepth, and can lead to shadows in the image. We arecurrently exploring techniques for correcting for thisattenuation with depth. Imaging with a confocal mi-croscope produces free radicals that are potentiallydamaging to living cells, which, along with photo-bleaching, typically limit confocal visualization to 1to 2 h (Haseloff, 1999; Paddock, 1999). In contrast,OCM uses a low-intensity light source (300 mW) thatproduces no detectable damage. Similar imaging sys-tems and intensities are used to scan living human
retinas (Baumal, 1999; Chauhan and Marshall, 1999;Gurses-Ozden et al., 1999; Parisi et al., 1999). Wehave used OCM to follow development in multipleindependent plants for over 1 week, collecting morethan 100 images each from separate, individualplants, and have observed no detectable damage ordevelopmental alterations (J. Hettinger, A. Reeves,R.L. Parsons, M.E. Williams, R.C. Haskell, D.C. Pe-tersen, R. Wang, and J.I. Medford, unpublished data).
Our OCM system has a number of features thatmake it a particularly useful tool for biological study.First, it detects back-scattered photons from inherentfeatures of the plant or plant cells (Fig. 6). Thesefeatures do not deteriorate during the imaging pro-cess. Second, the high light-scattering property asso-ciated with cytoplasmically dense cells provides atype of natural endogenous developmental marker tofollow over time. Third, OCM allows imaging ofplants in situ, without removal from soil or growthmedia. Fourth, images are acquired rapidly. We cur-rently acquire an image of the Arabidopsis shoot in5.5 min, and improvements under way will reducethe collection time to approximately 1 min. Becauseof the rapid acquisition of images without cell ortissue damage, OCM allows us to obtain successiveimages of one plant at near real time to examinebiological processes. Finally, our specific OCM sys-tem has been optimized for three-dimensional datacollection and display. As shown in Figures 3through 7, our data can be disassembled and viewedas cropped three-dimensional images or two-dimensional slices. The lower light-scattering valuesobtained for the blue boundary voxels are fortuitousin that they allow us to identify the outer surface oforgans and/or tissue. OCM images resemble SEMswhen viewed with a high a-parameter, which ren-
Figure 8. OCM and SEM images of stm-1 mutant. A, An OCM image of the stm-1 mutant does not show the highlylight-scattering regions corresponding to the shoot apical meristem and leaf primordia. The arrow indicates the position atwhich the shoot apical meristem would be in a wild-type plant. B, An SEM of the same plant as in A. C, Cotyledon. Scalebars in A and B 5 100 mm.
Hettinger et al.
12 Plant Physiol. Vol. 123, 2000 www.plantphysiol.orgon December 20, 2018 - Published by Downloaded from Copyright © 2000 American Society of Plant Biologists. All rights reserved.
ders the voxels opaque (Figs. 2–4). By reducing theopacity of lower-value voxels including the bound-ary voxels, underlying light-scattering patterns canbe seen (Fig. 5).
The biological basis of light scattering has been thefocus of study (Dunn and Richards-Kotum, 1996;Drezek et al., 1999). Theoretical and experimental ev-idence suggest that certain inherent features of livingcells are highly light scattering (Drezek et al., 1999).Specifically, cells with high nucleo-cytoplasmic ratios,cells that have large numbers of small organelles, andcells with folded membranes are highly light scatter-ing. Our results are consistent with these studies. Fig-ure 6 shows that nuclei are highly light scattering, thecytoplasm is intermediate in its light-scattering prop-erty, and the vacuole and cell wall are much less lightscattering.
Within the Arabidopsis shoot apex, the light-scattering patterns are highly reproducible and arefound in positions and at times consistent with bio-logical function. The most highly scattering regionsof the shoot apex have densely cytoplasmic cells withhigh nucleo-cytoplasmic ratios (Steeves and Sussex,1989; Lyndon, 1990). For example, stipules are highlylight scattering (Fig. 5). Although the function ofArabidopsis stipules is not known, they have large,prominent nuclei and nucleoli and are transcription-ally active (Steeves and Sussex, 1989; Medford et al.,1992). In developing leaf primordia, the distal-mosttip of the leaf is most highly light scattering (Fig. 5).This region is known to retain cells that are denselycytoplasmic, at a time when more proximal leaf cellsare expanding (Poethig and Sussex, 1985).
With OCM, the propagating light beam will firstencounter surface regions such as the tip of leafprimordia. Therefore, a question arises as to whetherthe large signal in such regions is due to the highlyscattering nature of the cells or to the large refractiveindex mismatch at the air-tissue interface. We testedthis by imaging plants from above (standard imag-ing), then turning the plant to a horizontal positionand imaging the same plant again. Light-scatteringpatterns such as those found in leaf primordia werequalitatively comparable. Furthermore, we routinelysaw highly light-scattering regions such as the stip-ules and the apical meristem that were considerablybelow the air-tissue interface.
We also found a horseshoe-shaped pattern of inter-mediate light scattering in developing primordia(Figs. 3 and 5). This pattern is most apparent whenimages of leaf primordia are cropped (Fig. 3) or whena leaf primordium is isolated, viewed with reduced a,and rotated (Fig. 5; http://www.plantphysiol.org).This intermediate light-scattering pattern is consistentwith regions in which the leaf blade is being specified(McHale, 1993; Tsuge et al., 1996). The shoot apicalmeristem was found to have an intermediate to highlight-scattering pattern (Fig. 7). Our preliminary data
suggest that the light-scatter pattern in meristemsmay be dynamic, changing as frequently as every 2 h.
A non-destructive in vivo imaging technology hasbeen developed and used to image plants and plantcells. Imaging plants by OCM causes no apparentdamage and provides information about inherentlight-scattering properties of cells. Therefore, it pro-vides a new technology with which to follow plantdevelopment and responses to exogenous factors.
MATERIALS AND METHODS
Plant Material
Arabidopsis plants were grown in a growth chamber(model AR-60L, Percival, Boone, IA) in soil (Sunshine Mix,Sun-Gro Horticulture, Bellevue, WA) at 23°C with a 16-hlight/8-h dark cycle. All Arabidopsis plants were of theColumbia ecotype and in the glabrous-1 (gl-1) genetic back-ground. Within 5 min of OCM imaging, plants were fixedin FAA or 50% (v/v) ethanol. Following fixation, plantswere embedded in LR White medium (Polysciences, War-rington, PA), and 1-mm sections were prepared and stainedwith 1% (w/v) toluidine blue, as previously described(Medford et al., 1992). Scanning electron micrographs weretaken as described previously (Medford et al., 1992), exceptthe critical point drying used a model E3100 (Bio-Rad,Hercules, CA), sputter coating used a Hummer VII (Anat-ech Ltd., Alexandria, VA), and SEM used a model 505(Philips, Eindhoven, The Netherlands). Arabidopsissuspension-cultured cells were originally described byDavis and Ausubel (1989) and were the kind gift of Dr.Farida Safadi-Chamberlain (A.S.N. Reddy Laboratory, Col-orado State University). Cells were maintained in the me-dium and conditions described by Davis and Ausubel(1989). Maize (Zea mays var. rugosa) (Carolina BiologicalSupply, Burlington, NC) plants were germinated in thegrowth chamber under the conditions described above.Images were collected from a leaf of a 14-d-old plant.
Construction and Operation of the OpticalCoherence Microscope
Details of OCM can be found in Hoeling et al. (2000)and are shown schematically in Figure 1. Computer anal-ysis of OCM data employs custom-designed AVS Expresssoftware (Advanced Visualization Systems, Waltham, MA)as described in Hoeling et al. (2000). Three-dimensionalOCM data sets were generated by assigning a value to eachvoxel in the sample volume. Parallel rays traced throughthe three-dimensional data set were projected onto thetwo-dimensional viewing screen. All voxels in the volumealong a ray contribute to the value of the correspondingpixel on the two-dimensional viewing screen. Because theray does not always go through the center of a voxel,values at a given point along the ray can be computed byinterpolating the values of the voxels in the vicinity of theray (trilinear algorithm). Alternatively, the value of thenearest neighbor voxel can be used (point algorithm).
Optical Coherence Microscopy. A Rapid, in Vivo, Non-Destructive Imaging Technology
Plant Physiol. Vol. 123, 2000 13 www.plantphysiol.orgon December 20, 2018 - Published by Downloaded from Copyright © 2000 American Society of Plant Biologists. All rights reserved.
Another consideration when blending voxels along a rayis their opacity value. Small opacity values mean that manyvoxels will contribute to a pixel value. Therefore, the two-dimensional image generated with small opacity valueswill contain information about the interior of the three-dimensional data set as well as the surface voxels nearestthe viewing screen. Larger opacity values will yield a two-dimensional image that is similar to a surface rendering ofthe data set. All plant images were collected from soil-grown plants under normal laboratory light and tempera-ture conditions.
ACKNOWLEDGMENTS
The authors thank Dr. Scott Fraser for suggesting the useof OCM to examine plants. We acknowledge the work andassistance of numerous Harvey Mudd College undergrad-uates in supporting the OCM project. We thank Dr. FaridaSadi-Chamberlain in A.S.N. Reddy’s laboratory for thekind gift of the Arabidopsis aneuploid cells. We thank Dr.David Marks for advice about trichomes and the glabrousmutant.
Received November 22, 1999; accepted February 8, 2000.
LITERATURE CITED
Barton MK, Poethig RS (1993) Formation of the shootapical meristem in Arabidopsis thaliana: an analysis ofdevelopment in the wild type and in the shootmeristemlessmutant. Development 119: 823–831
Baumal CR (1999) Clinical applications of optical coher-ence tomography. Curr Opin Ophthalmol 10: 182–188
Boppart S, Brezinski M, Bouma B, Tearney G, Fujimoto J(1997a) Investigation of developing embryonic morphol-ogy using optical coherence tomography. Dev Biol 177:54–63
Boppart S, Tearney G, Bouma B, Southern J, Brezinski M,Fujimoto J (1997b) Noninvasive assessment of the devel-oping Xenopus cardiovascular system using optical co-herence tomography. Proc Natl Acad Sci USA 94:4256–4261
Boppart SA, Bouma BE, Pitris C, Southern JF, BrezinskiME, Fujimoto JG (1998a) In vivo cellular optical coher-ence tomography imaging. Nat Med 4: 861–865
Boppart SA, Bouma BE, Pitris C, Tearney GJ, Southern JF,Brezinski ME, Fujimoto JG (1998b) Intraoperative as-sessment of microsurgery with three-dimensional opticalcoherence tomography. Radiology 208: 81–86
Boppart SA, Brezinski ME, Pitris C, Fujimoto JG (1998c)Optical coherence tomography for neurosurgical imag-ing of human intracortical melanoma. Neurosurgery 43:834–841
Boppart SA, Herrmann J, Pitris C, Stamper DL, BrezinskiME, Fujimoto JG (1999) High-resolution optical coher-ence tomography-guided laser ablation of surgical tis-sue. J Surg Res 82: 275–284
Chauhan DS, Marshall J (1999) The interpretation of op-tical coherence tomography images of the retina. InvestigOphthalmol Vis Sci 40: 2332–2342
Davis KR, Ausubel FM (1989) Characterization of elicitor-induced defense responses in suspension-cultured cellsof Arabidopsis. Mol Plant-Microbe Interact 2: 363–368
Dolan L, Janmaat K, Willemsen V, Linstead P, Poethig S,Roberts K, Scheres B (1993) Cellular organisation of theArabidopsis thaliana root. Development 119: 71–84
Drezek R, Dunn A, Richards-Kortum R (1999) Light scat-tering from cells: finite-difference time-domain simula-tions and goniometric measurements. Appl Optics 38:3651–3661
Dunn A, Richards-Kotum R (1996) Three-dimensionalcomputation of light scattering from cells. IEEE J SelTopics Quantum Electron 2: 898–905
Faust M, Wang PC, Maas J (1997) The use of magneticresonance imaging in plant science. Hortic Rev 20:225–266
Fercher AF (1996) Optical coherence tomography. J BiomedOptics 1: 157–173
Fujimoto JG, Bouma B, Tearney GJ, Boppart SA, Pitris C,Southern JF, Brezinski ME (1998) New technology forhigh-speed and high-resolution optical coherence to-mography. Ann NY Acad Sci 838: 95–107
Gausman HW (1977) Reflectance of leaf components: re-mote sensing of environment. Remote Sens Environ 6:1–9
Gilbert SF (1998) Development Biology, Ed 5. SinauerAssociates, Sunderland, MA
Gurses-Ozden R, Ishikawa H, Hoh ST, Liebmann JM,Mistlberger A, Greenfield DS, Dou HL, Ritch R (1999)Increasing sampling density improves reproducibility ofoptical coherence tomography measurements. J Glau-coma 8: 238–241
Haseloff J (1999) GFP variants for multispectral imaging ofliving cells. Methods Cell Biol 58: 139–151
Herrmann JM, Brezinski ME, Bouma BE, Boppart SA,Pitris C, Southern JF, Fujimoto JG (1998) Two- andthree-dimensional high-resolution imaging of the humanoviduct with optical coherence tomography. Fertil Steril70: 155–158
Hoeling BM, Fernandez AD, Haskell RC, Myers WR,Petersen DC, Ungersma SE, Wang R, Williams ME(2000) An optical coherence microscope for three-dimensional imaging in developmental biology. OpticsExpress 6: 136–147
Izatt JA, Kulkarni MD, Wang H-W, Kobayashi K, SivakMV Jr (1996) Optical coherence tomography and micros-copy in gastrointestinal tissues. IEEE J Sel Topics Quan-tum Electron 2: 1017–1028
Long JA, Moan EI, Medford JI, Barton MK (1996) A mem-ber of the KNOTTED class of homeodomain proteinsencoded by the STM gene of Arabidopsis. Nature 379:66–69
Lyndon RF (1990) The Cellular Basis. In M Black, J Chap-man, eds, Plant Development. Unwin Hyman, Winches-ter, MA
Masters BR (1999) Early development of optical low-coherence reflectometry and some recent biomedical ap-plications. J Biomed Optics 4: 236–247
Hettinger et al.
14 Plant Physiol. Vol. 123, 2000 www.plantphysiol.orgon December 20, 2018 - Published by Downloaded from Copyright © 2000 American Society of Plant Biologists. All rights reserved.

McHale NA (1993) LAM-1 and FAT genes control devel-opment of the leaf blade in Nicotiana sylvestris. Plant Cell5: 1029–1038
Medford JI, Behringer FJ, Callos JD, Feldmann KA (1992)Normal and abnormal development in the Arabidopsisvegetative shoot apex. Plant Cell 4: 631–643
Paddock SW (1999) Confocal laser scanning microscopy.Biotechniques 27: 992–1004
Parisi V, Manni G, Spadaro M, Colacino G, Restuccia R,Marchi S, Bucci MG, Pierelli F (1999) Correlation be-tween morphological and functional retinal impairmentin multiple sclerosis patients. Investig Ophthalmol VisSci 40: 2520–2527
Poethig RS, Sussex IM (1985) The cellular parameters ofleaf development in tobacco: a clonal analysis. Planta165: 170–184
Ripandelli G, Coppe AM, Capaldo A, Stirpe M (1998)Optical coherence tomography. Semin Ophthalmol 13:199–202
Running MP, Clark SE, Meyerowitz EM (1995) Confocalmicroscopy of the shoot apex. Methods Cell Biol 49:217–229
Steeves TA, Sussex IM (1989) Patterns in Plant Develop-ment, Ed 2. Cambridge University Press, New York
Tearney GJ, Brezinski ME, Bouma BE, Boppart SA, PitrisC, Southern JF, Fujimoto JG (1997) In vivo endoscopicoptical biopsy with optical coherence tomography. Sci-ence 276: 2037–2039
Tsuge T, Tsukaya H, Uchimiya H (1996) Two independentand polarized processes of cell elongation regulate leafblade expansion in Arabidopsis thaliana (L.) Heynh. De-velopment 122: 1589–1600
van den Berg C, Willemsen V, Hage W, Weisbeek P, ScheresB (1997a) Cell fate in the Arabidopsis root meristem deter-mined by directional signaling. Nature 378: 62–65
van den Berg C, Willemsen V, Hendriks G, Weisbeek P,Scheres B (1997b) Short-range control of cell differentia-tion in the Arabidopsis root meristem. Nature 390: 287–289
Optical Coherence Microscopy. A Rapid, in Vivo, Non-Destructive Imaging Technology
Plant Physiol. Vol. 123, 2000 15 www.plantphysiol.orgon December 20, 2018 - Published by Downloaded from Copyright © 2000 American Society of Plant Biologists. All rights reserved.
Related Documents