Optical Classification of Red Optical Classification of Red Tide Organism Tide Organism Karenia Karenia brevis brevis in the Coastal Waters in the Coastal Waters of Gulf of Mexico of Gulf of Mexico Optical Remote Sensing Lab, NOAA CREST, The City College of the City University of New York Ruhul Ruhul Amin Amin

Welcome message from author
This document is posted to help you gain knowledge. Please leave a comment to let me know what you think about it! Share it to your friends and learn new things together.
Transcript
Optical Classification of Red Optical Classification of Red Tide Organism Tide Organism KareniaKarenia
brevisbrevis in the Coastal Waters in the Coastal Waters of Gulf of Mexico of Gulf of Mexico
Optical Remote Sensing Lab, NOAA CREST,The City College of the City University of New York
RuhulRuhul
AminAmin
IntroductionWhy do we need Satellite?Objectives of this studyOptical and Physiological behavior of Karenia brevis (K. brevis)Satellite detection techniques for K. brevis bloomsOur detection and classification techniqueOur technique vs. other techniques
backscattering/chlorophyll ratio Chlorophyll anomalyFLH
Impacts of atmospheric correctionsApplication to regional watersTracing of the K. brevis blooms
With MODIS imageryWith MERIS imagery
Advantages and disadvantages of our techniquesConclusion
OutlineOutline
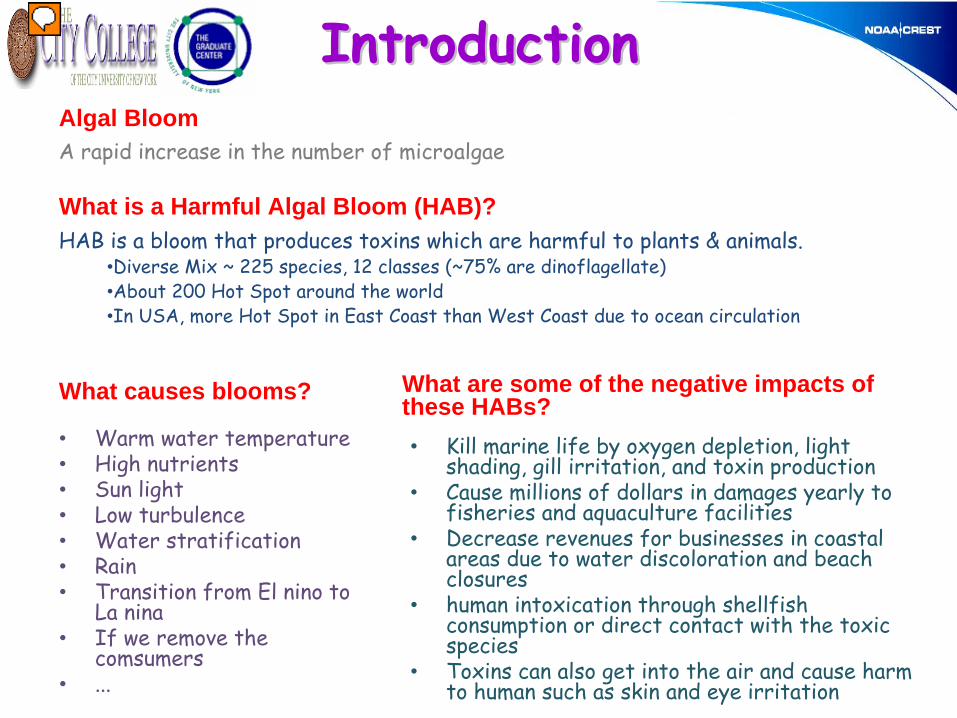
IntroductionIntroduction
•
Warm water temperature•
High nutrients•
Sun light•
Low turbulence•
Water stratification•
Rain•
Transition from El nino
to La nina
•
If we remove the comsumers
•
...
•
Kill marine life by oxygen depletion, light shading, gill irritation, and toxin production
•
Cause millions of dollars in damages yearly to fisheries and aquaculture facilities
•
Decrease revenues for businesses in coastal areas due to water discoloration and beach closures
•
human intoxication through shellfish consumption or direct contact with the toxic species
•
Toxins can also get into the air and cause harm to human such as skin and eye irritation
What is a Harmful Algal Bloom (HAB)?HAB is a bloom that produces toxins which are harmful to plants & animals.
•Diverse Mix ~ 225 species, 12 classes (~75% are dinoflagellate)•About 200 Hot Spot around the world•In USA, more Hot Spot in East Coast than West Coast due to ocean
circulation
Algal BloomA rapid increase in the number of microalgae
What are some of the negative impacts of these HABs?What causes blooms?
Presenter�
Presentation Notes�
More than 60,000 people in USA get sick due to poisoned fish every year�
http://research.myfwc.com/
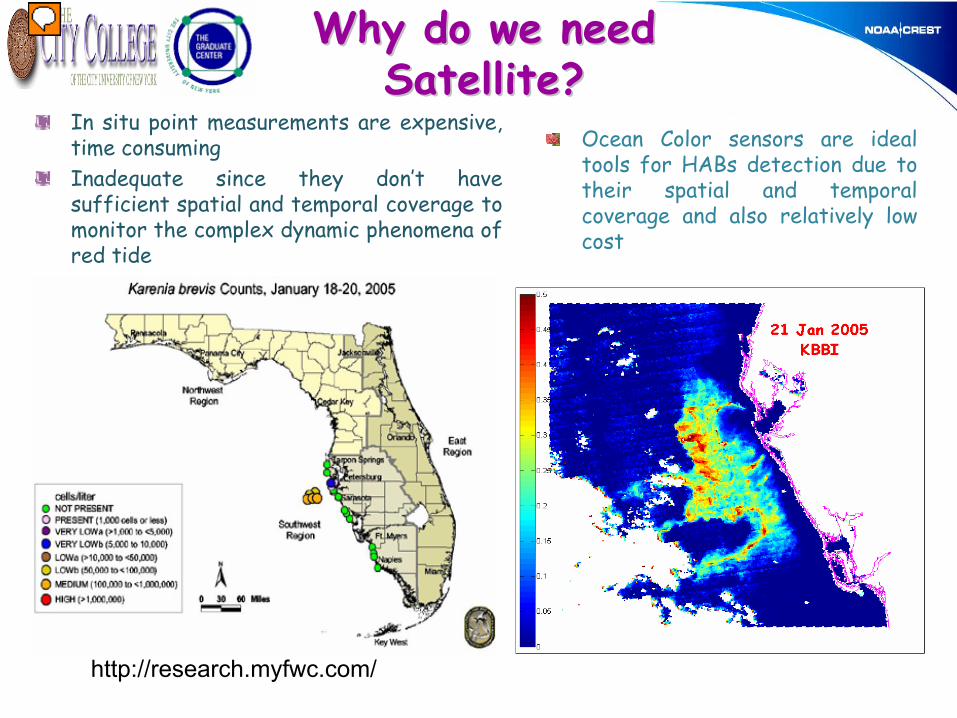
In situ point measurements are expensive, time consumingInadequate since they don’t have sufficient spatial and temporal coverage to monitor the complex dynamic phenomena of red tide
Ocean Color sensors are ideal
tools for HABs
detection due to their spatial and temporal coverage and also relatively low cost
Why do we need Why do we need Satellite?Satellite?
Presenter�
Presentation Notes�
Traditional monitoring programs by in situ point measurements are expensive, time consuming and inadequate since they do not have sufficient spatial and temporal coverage to monitor the complex dynamic phenomena occurring during a red tide episode. Satellite remote sensing measurement of ocean color provides a feasible complementary tool for red tide monitoring, due to its sypnotic coverage, frequent revisit capability and relatively low cost. Terra (morning passes), Aqua (afternoon passes) Florida Fish and Wildlife Research Institute (RWRI). Field data detects blooms close to Tampa bay and the other bay is Charlotte harbor.�
Should be less sensitive to the atmospheric correctionShould use bands with maximal signal-to-noise ratios (SNR)Should be applicable to multiple ocean color sensors to reduce cloud coverageEliminate errors due to retrieval algorithmsShould be able to discriminate K. brevis
blooms
from other bloom like features such as CDOM plumes, sediment plumes, and bottom reflectance
Using modeled data develop a bloom detection and a classification technique for K. brevis blooms which
Objectives of this Study
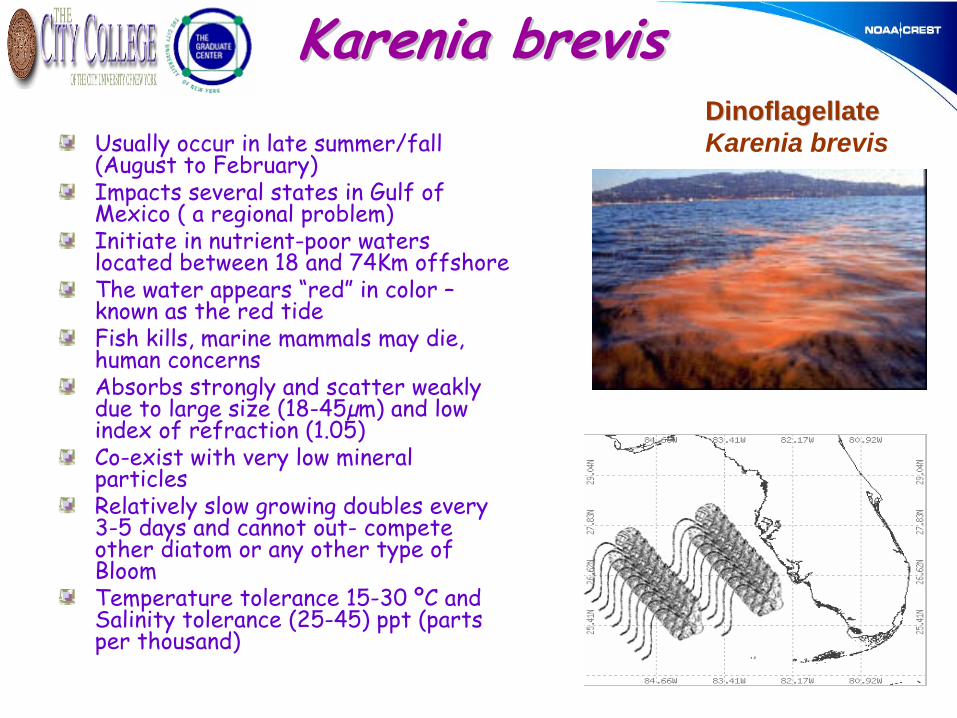
Usually occur in late summer/fall (August to February)Impacts several states in Gulf of Mexico ( a regional problem)Initiate in nutrient-poor waters located between 18 and 74Km offshore The water appears “red”
in color –
known as the red tideFish kills, marine mammals may die, human concernsAbsorbs strongly and scatter weakly due to large size (18-45µm) and low index of refraction (1.05)Co-exist with very low mineral particlesRelatively slow growing doubles every 3-5 days and cannot out-
compete other diatom or any other type of BloomTemperature tolerance 15-30 ºC and Salinity tolerance (25-45) ppt
(parts per thousand)
DinoflagellateDinoflagellateKarenia brevis
KareniaKarenia brevisbrevis
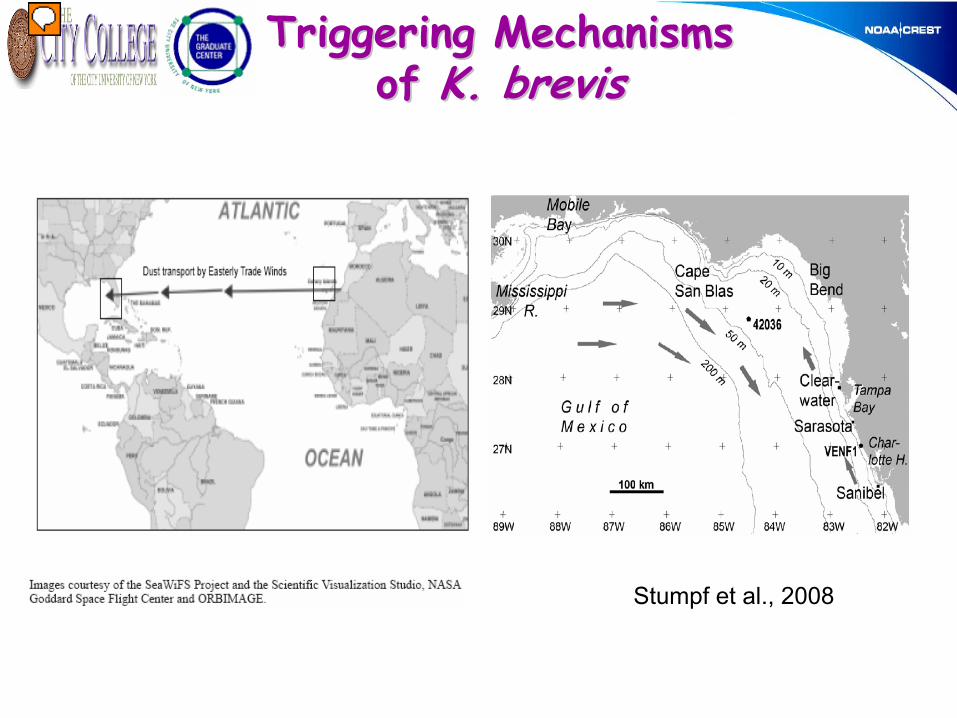
Stumpf
et al., 2008
Triggering Mechanisms Triggering Mechanisms of of K. K. brevisbrevis
Presenter�
Presentation Notes�
Nitrate (NO3-), nitrite (NO2-), ammonium (NH4+), and urea. These are some of the nitrogen sources (dissolved nitrogen (DN)). There are two popular hypothesis about what causes K. brevis to bloom. [Stumpf et al., 2007] claimed that in the summer, northward winds produce a net flow east and southeast brings water and nutrient from the Mississippi River plume onto the WFS and this nutrient eventually promote K. brevis bloom. On the other hand, [Walsh and Steidinger, 2001] argued that wet deposition of Saharan aerosols in the eastern Gulf of Mexico may promote K. brevis bloom by first promoting plant-like bacteria, called Trichodesmium, growth which process the iron from dust and release nitrogen in the water, and the increase of nitrogen in the water promotes K. brevis bloom. �
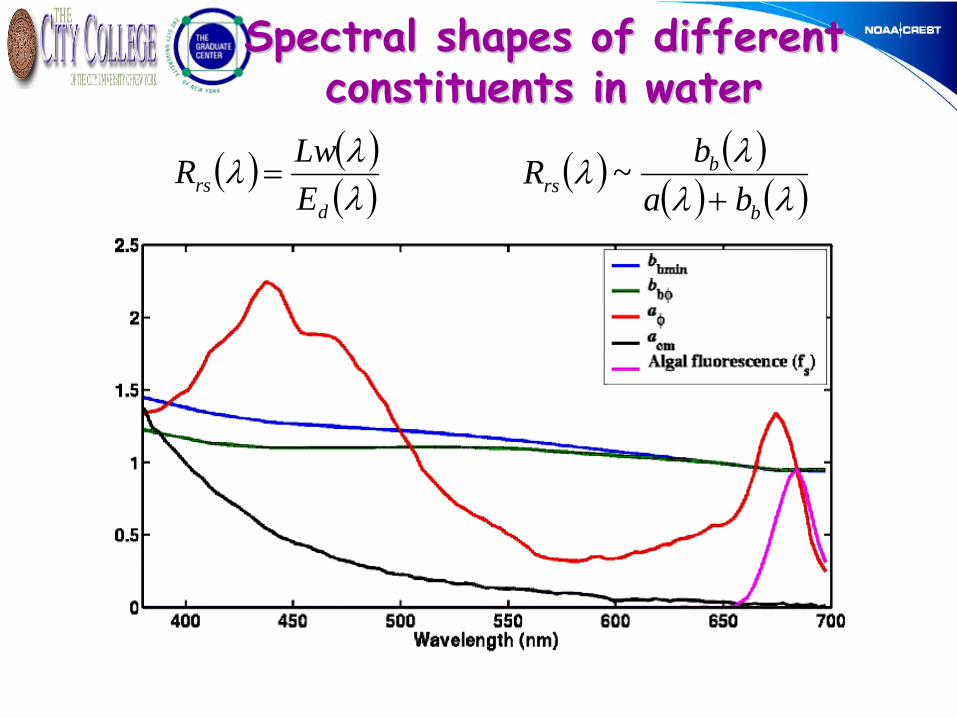
( ) ( )( )λλλ
drs E
LwR = ( ) ( )( ) ( )λλ
λλb
brs ba
bR+
~
Spectral shapes of different Spectral shapes of different constituents in waterconstituents in water
Blue-green spectral region:Strong reflection from inorganic particles and shallow bottom Phytoplankton and CDOM absorbs blue and blue-green light and CDOM don’t correlate with phytoplankton in coastal waters so it is hard to tell which caused lower reflectanceUncertainty due to inappropriate atmospheric correction is higherChlorophyll retrieval for extreme blooms ( > ) may often be inaccurate due to signal-to-noise errors
BlueBlue--green vs. red green vs. red spectral regionspectral region
3/100 mmg
Red spectral region:CDOM absorption is negligible Chlorophyll has a absorption peakFluorescence emission of chlorophyllPure seawater absorption (well known)High Signal-to-Noise (SNR) ratio
Backscattering/Chl ratio :
Chlorophyll concentrations greater than 1.5 mg/m^3 and bbp(550) values less than the modeled Case 1 relationship (Morel, 1988)
Disadvantages:False positive bloom detection in CDOM rich waters Uncertainty due to retrieval and atmospheric correction algorithms
Chlorophyll anomaly:[Chl]0
-
[2 Mo. Mean Chl]t-
2wks
> 1mg/m^3 Disadvantages:
False positive/negative bloom detected due to chlorophyll retrieval algorithmsUncertainty due to atmospheric correction, interference form organic and in organic matters, and shallow bottom reflection
Stumpf
et al., 2003Cannizzaro
et al., 2004
Some satellite detection Some satellite detection techniques for techniques for K. K. brevisbrevis
Presenter�
Presentation Notes�
For chlorophyll anomaly waters near river mouths or in very shallow (<10m) areas are excluded since satellite data are subject to larger uncertainties in these regions due primarily to imperfect algorithms. Huge data volume. Effective in new bloom detection but not for bloom that stays for months.�

Red Band Difference (RBD) Karenia brevis Bloom Index (KBBI)
Detection Algorithm: Classification Algorithm:
)()( 12 λλ nLwnLwRBD −=)()()()(
12
12
λλλλ
nLwnLwnLwnLw
KBBI+−
=
λ1
= 667nm for MODIS and 665nm for MERISλ2
= 678nm for MODIS and 681nm for MERIS
λ1 λ2 λ1 λ2
RBD and KBBIRBD and KBBI
Presenter�
Presentation Notes�
What makes these technique work is not only the low backscattering of the specie it-self but also the environment inhabited by them.�

K. brevis
simulated according to [Cannizzaro
et. al 2004] and non-K. brevis
simulated using standard bio-
optical model assuming background concentration of NAP = 2 mg/l.Chlorophyll ranges between 1 and 100 mg/m^3
Particulate backscattering for K. brevis and non-K. brevis blooms are modeled based on the cell concentrations of K. brevis
according to [Cannizzaro
et. al 2004]
Classification of Classification of K. K. brevisbrevis with KBBIwith KBBI
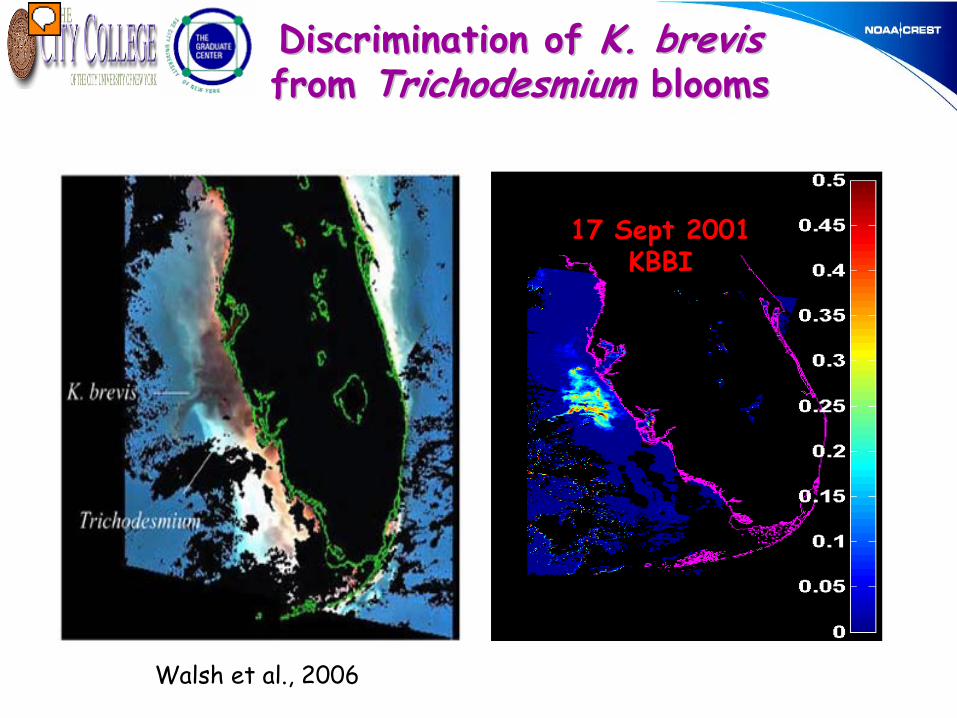
Discrimination of Discrimination of K. K. brevisbrevis from from TrichodesmiumTrichodesmium bloomsblooms
17 Sept 2001KBBI
Walsh et al., 2006
Presenter�
Presentation Notes�
A SeaWiFS satellite estimate of red tides and diazotrophs within the eastern Gulf of Mexico during 17 September 2001. Based upon a backscatter algorithm, the reddish-black color is a red tide of Karenia brevis and the pale blue color is co-occurring nitrogen fixers at depth, i.e. Trichodesmium within offshore waters. The yellowwhite regions depict suspended sediments and bottom reflectance effects within the south central region of the West Florida shelf. �
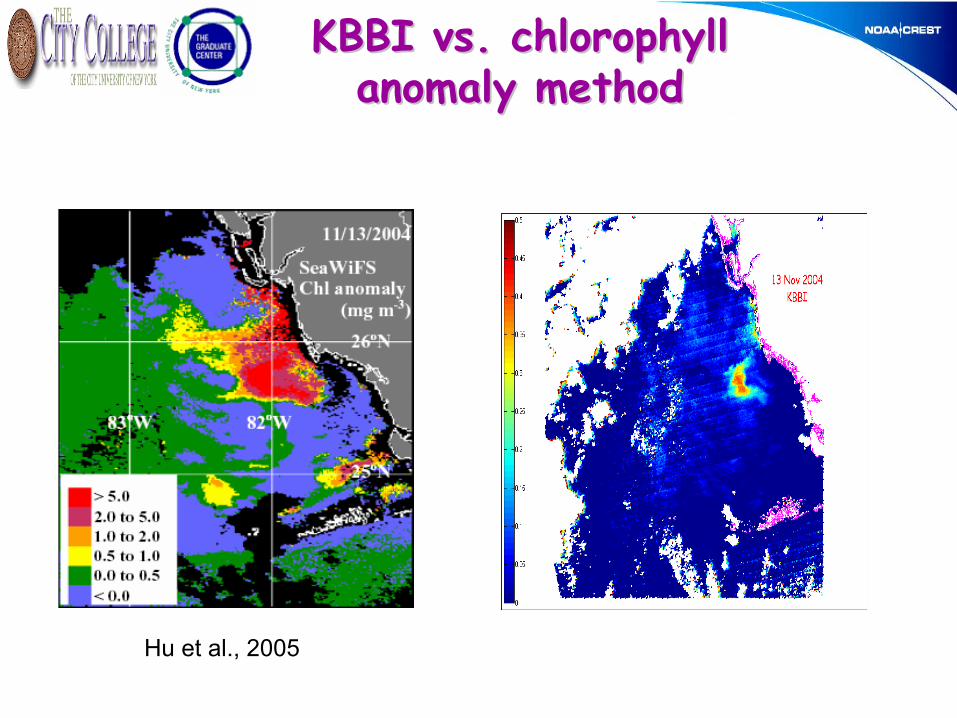
Hu
et al., 2005
KBBI vs. chlorophyll KBBI vs. chlorophyll anomaly methodanomaly method
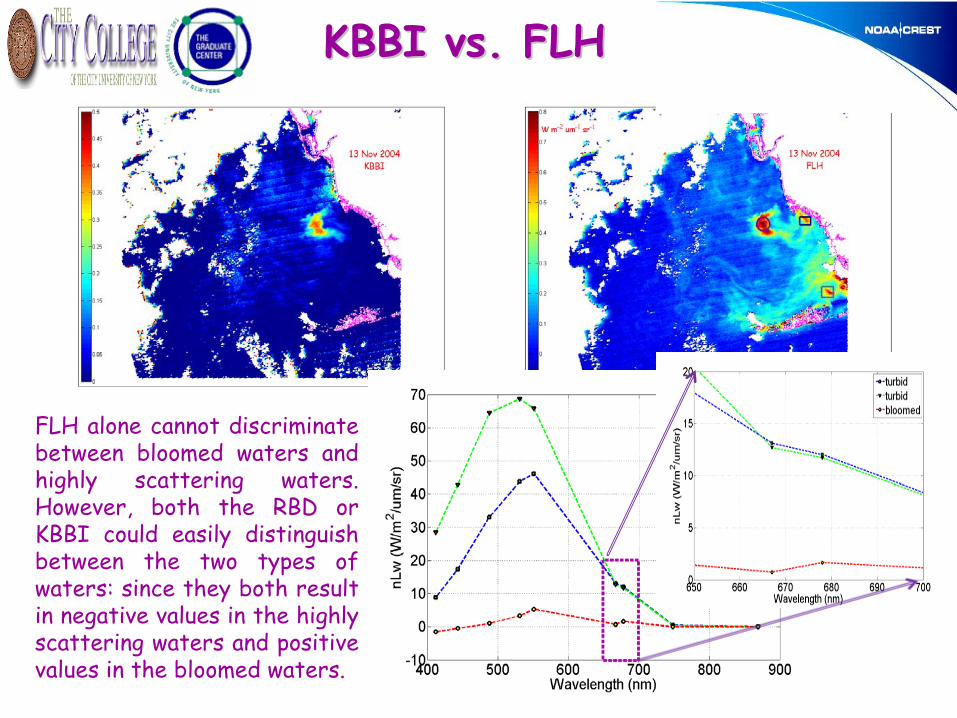
KBBI vs. FLHKBBI vs. FLH
FLH alone cannot discriminate between bloomed waters and highly scattering waters. However, both the RBD or KBBI could easily distinguish between the two types of waters: since they both result in negative values in the highly scattering waters and positive values in the bloomed waters.

Impacts of NIR and SWIR Impacts of NIR and SWIR atmospheric correctionsatmospheric corrections
The RBD technique gives similar results with either atmospheric correction algorithm because
We are using the difference in magnitude of the reflectance signal at two
adjacent red bandsThese two bands are relatively close spectrally 667nm and 678nm,
the magnitude of the optical impact of the atmosphere will be very nearly the same on either band, and thus will have no impact on the difference of the two magnitudes
RBD

Application to regional Application to regional waterswaters
Florida Texas
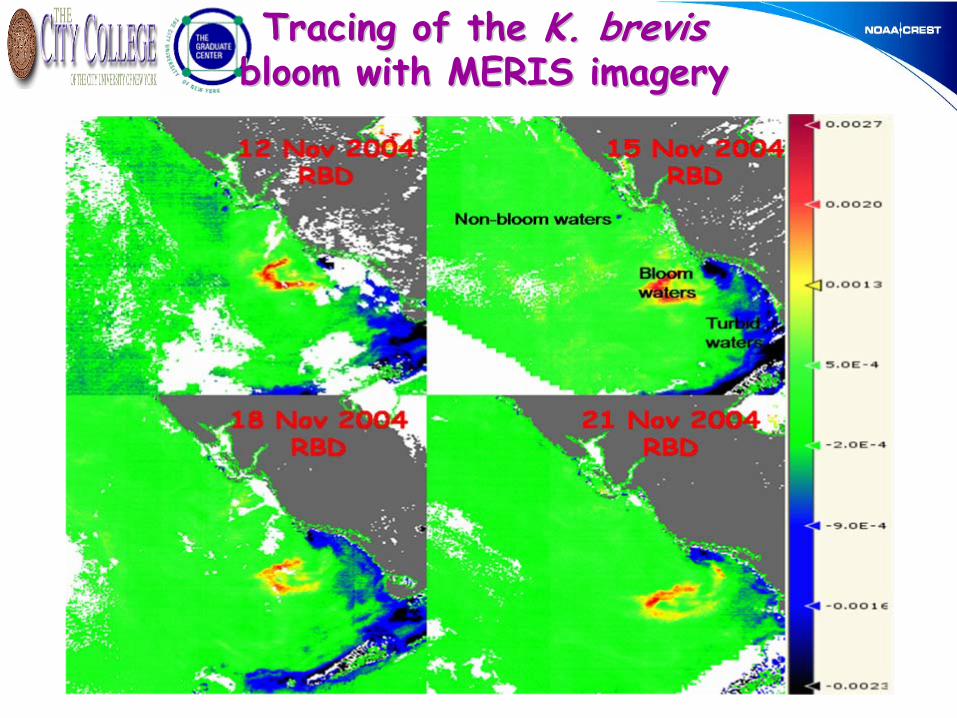
Tracing of the Tracing of the K. K. brevisbrevis bloom with MERIS imagerybloom with MERIS imagery
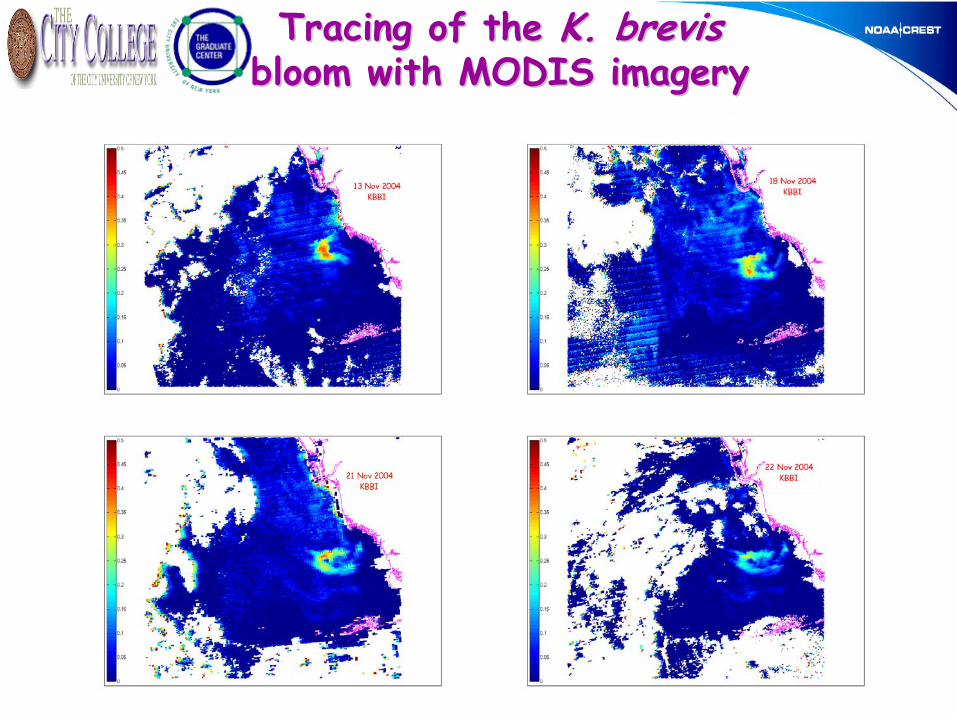
Tracing of the Tracing of the K. K. brevisbrevis bloom with MODIS imagerybloom with MODIS imagery
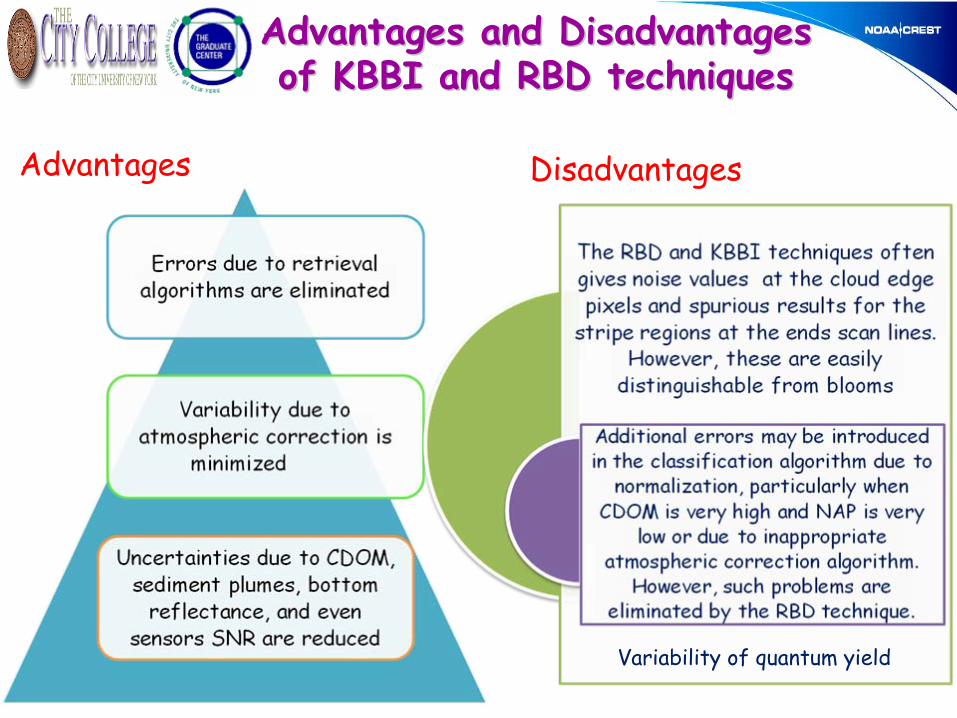
Advantages Disadvantages
Advantages and Disadvantages Advantages and Disadvantages of KBBI and RBD techniquesof KBBI and RBD techniques
Variability of quantum yield
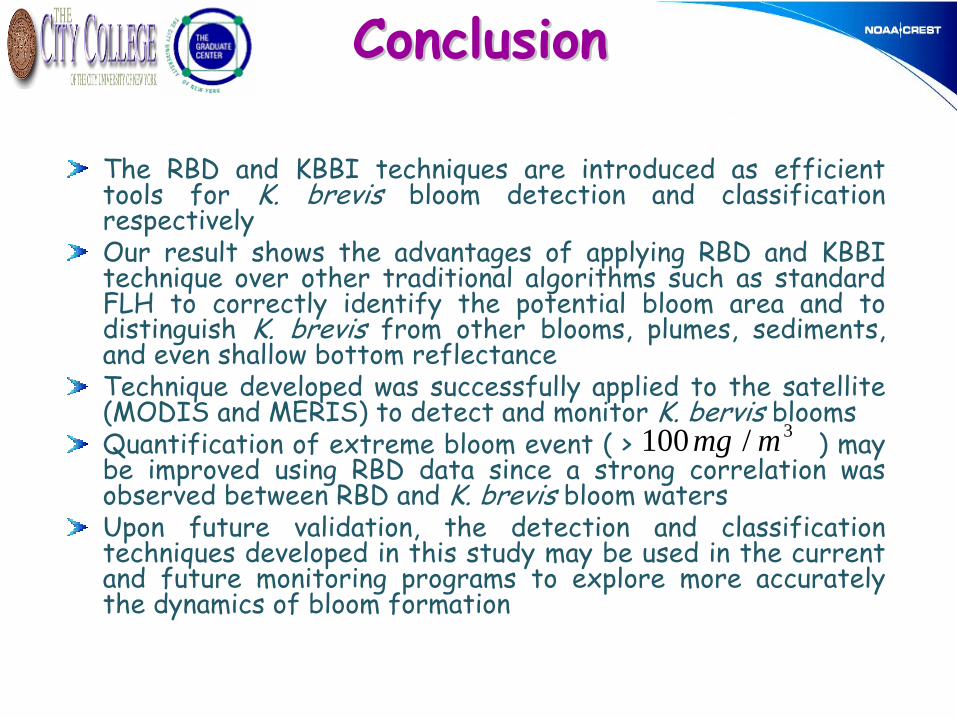
ConclusionConclusion
The RBD and KBBI techniques are introduced as efficient tools for K. brevis
bloom detection and classification respectivelyOur result shows the advantages of applying RBD and KBBI technique over other traditional algorithms such as standard FLH to correctly identify the potential bloom area and to distinguish K. brevis
from other blooms, plumes, sediments, and even shallow bottom reflectanceTechnique developed was successfully applied to the satellite (MODIS and MERIS) to detect and monitor K. bervis blooms Quantification of extreme bloom event ( > ) may be improved using RBD data since a strong correlation was observed between RBD and K. brevis bloom waters Upon future validation, the detection and classification techniques developed in this study may be used in the current and future monitoring programs to explore more accurately the dynamics of bloom formation
3/100 mmg

This work was supported by NOAA
AcknowledgmentsAcknowledgments
Related Documents