OpsDog Customized Benchmarking Report www.opsdog.com [email protected] 844.650.2888 Prepared for J. Smith Supply Chain Management Benchmarks, KPI Definitions & Measurement Details ABRIDGED SAMPLE Looking for customized research data? Contact us - we’re ready to help. Call: 844-650-2888 Email: [email protected]

Welcome message from author
This document is posted to help you gain knowledge. Please leave a comment to let me know what you think about it! Share it to your friends and learn new things together.
Transcript
OpsDog Customized Benchmarking Report
www.opsdog.com [email protected] 844.650.2888 Prepared for J. Smith
Supply Chain ManagementBenchmarks, KPI Definitions & Measurement Details
ABRIDGED SAMPLE
Looking for customized research data? Contact us - we’re ready to help.
Call: 844-650-2888Email: [email protected]
opsdog-kpi-report-bundle.custom.sample 2017 Edition | © OpsDog, Inc.
1
SAMPLE
Table of ContentsCustomized Report: Supply Chain Management
Supply Chain KPIs � � � � � � � � � � � � � � � � � � � � � � � � � �4Lost Time Case Rate (LTC) � � � � � � � � � � � � � � � � � � � � � � � � � � � � � 5Supply Chain Expense as a Percentage of Total Revenue � � � � � � � � � � 7Total Recordable Incident Rate (TRIR) � � � � � � � � � � � � � � � � � � � � � � � 9
Procurement KPIs � � � � � � � � � � � � � � � � � � � � � � � � � 11On-time Supplier Delivery Rate � � � � � � � � � � � � � � � � � � � � � � � � � � � 12Spend Under Management (SUM) � � � � � � � � � � � � � � � � � � � � � � � � � 14Supplier Order Documentation Accuracy Rate � � � � � � � � � � � � � � � � � � 16
Materials Management KPIs � � � � � � � � � � � � � � � � � 18Days Inventory Outstanding � � � � � � � � � � � � � � � � � � � � � � � � � � � � 19Days on Hand: Finished Goods � � � � � � � � � � � � � � � � � � � � � � � � � � 21Days on Hand: Raw Materials � � � � � � � � � � � � � � � � � � � � � � � � � � 23Honeycomb Percentage � � � � � � � � � � � � � � � � � � � � � � � � � � � � � � 25Inventory Accuracy (Dollars) � � � � � � � � � � � � � � � � � � � � � � � � � � � 27Inventory Accuracy (Location) � � � � � � � � � � � � � � � � � � � � � � � � � � 29Inventory Shrinkage � � � � � � � � � � � � � � � � � � � � � � � � � � � � � � � � 31Inventory Turnover � � � � � � � � � � � � � � � � � � � � � � � � � � � � � � � � � 33Material Handling Damage � � � � � � � � � � � � � � � � � � � � � � � � � � � � 35Peak Warehouse Space Utilization � � � � � � � � � � � � � � � � � � � � � � � � 37Percentage of Customer Orders with Correct Documentation � � � � � � � 39Stocking Cycle Time � � � � � � � � � � � � � � � � � � � � � � � � � � � � � � � � 41Warehouse Equipment Utilization Rate � � � � � � � � � � � � � � � � � � � � � 43Warehouse Space Utilization � � � � � � � � � � � � � � � � � � � � � � � � � � � 45
Sales & Operations Planning KPIs � � � � � � � � � � � � � � 47Customer Backorder Rate � � � � � � � � � � � � � � � � � � � � � � � � � � � � � 48Percentage of Backorder Dollars � � � � � � � � � � � � � � � � � � � � � � � � 50Percentage of Backorder Lines � � � � � � � � � � � � � � � � � � � � � � � � � 52Percentage of Sales Lost Due to Supply Issues� � � � � � � � � � � � � � � � 54
Order Management KPIs � � � � � � � � � � � � � � � � � � � � 56Customer Order Fill Rate � � � � � � � � � � � � � � � � � � � � � � � � � � � � � 57Customer Order Line Item Fill Rate � � � � � � � � � � � � � � � � � � � � � � � 59On-time Shipment Readiness � � � � � � � � � � � � � � � � � � � � � � � � � � 61Perfect Customer Order Rate � � � � � � � � � � � � � � � � � � � � � � � � � � � 63
Distribution KPIs � � � � � � � � � � � � � � � � � � � � � � � � � � 65Distribution Center Expense as a Percentage of Revenue � � � � � � � � � 66Distribution Center Expense per Case � � � � � � � � � � � � � � � � � � � � � 68Distribution Expense as a Percentage of COGS � � � � � � � � � � � � � � � � 70Distribution Expense as a Percentage of Total Revenue� � � � � � � � � � � 72Management and Overhead Expense per Case � � � � � � � � � � � � � � � � 74On-time Customer Order Delivery Rate � � � � � � � � � � � � � � � � � � � � � 76Order Picking Accuracy � � � � � � � � � � � � � � � � � � � � � � � � � � � � � � 78Order Shipment Cycle Time � � � � � � � � � � � � � � � � � � � � � � � � � � � � 80Proof of Delivery Rate � � � � � � � � � � � � � � � � � � � � � � � � � � � � � � � 82Transportation Expense as a Percentage of Total Revenue � � � � � � � � � 84Undamaged Customer Order Rate� � � � � � � � � � � � � � � � � � � � � � � � 86Undamaged Supplier Shipment Rate � � � � � � � � � � � � � � � � � � � � � � 88

opsdog-kpi-report-bundle.custom.sample 2017 Edition | © OpsDog, Inc.
2
SAMPLE
© 2017 OpsDog, Inc.
The OpsDog Benchmarking Reports and their contents are protected by copyright laws, contain
the trademark OpsDog, Inc., and are OpsDog’s proprietary information. No part of this book shall
be reproduced, stored in a retrieval system, or transmitted by any means, electronic, mechanical,
photocopying, recording or otherwise, without written permission from OpsDog, Inc.
OpsDog, Inc. assumes no liability with respect to the use of the information contained herein
which is provided “as is” and there are no warranties of any kind provided by OpsDog with
respect to this report. OpsDog assumes no responsibility for errors or omissions and will not be
liable for any damages resulting from the use of the information contained herein.
OpsDog, Inc.
1502 Augusta Dr., Suite 200
Houston, TX 77057
Tel: 844-650-2888
Benchmarking Report Terms & ConditionsCustomized Report: Supply Chain Management
opsdog-kpi-report-bundle.custom.sample 2017 Edition | © OpsDog, Inc.
3
SAMPLE
Report Details & MethodologyCustomized Report: Supply Chain Management
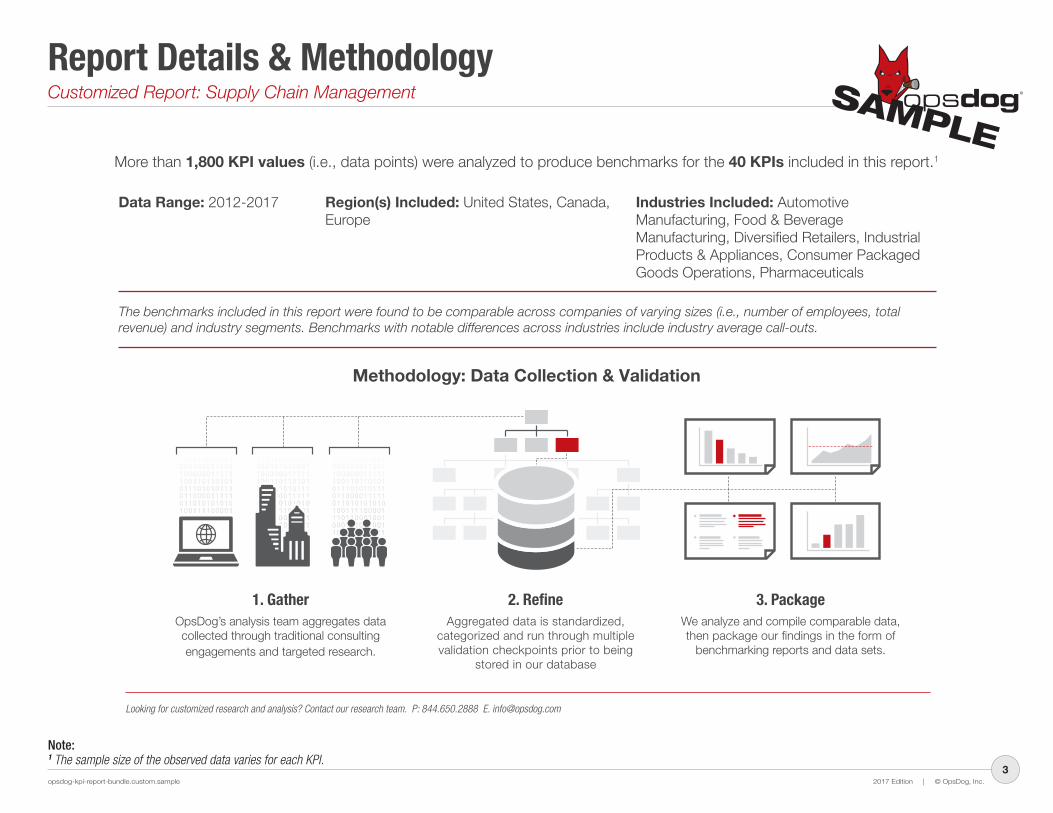
More than 1,800 KPI values (i.e., data points) were analyzed to produce benchmarks for the 40 KPIs included in this report.1
Methodology: Data Collection & Validation
The benchmarks included in this report were found to be comparable across companies of varying sizes (i.e., number of employees, total revenue) and industry segments. Benchmarks with notable differences across industries include industry average call-outs.
Looking for customized research and analysis? Contact our research team. P: 844.650.2888 E. [email protected]
1. GatherOpsDog’s analysis team aggregates data collected through traditional consulting engagements and targeted research.
2. RefineAggregated data is standardized,
categorized and run through multiple validation checkpoints prior to being
stored in our database
3. PackageWe analyze and compile comparable data, then package our findings in the form of
benchmarking reports and data sets.
Data Range: 2012-2017 Region(s) Included: United States, Canada, Europe
Note:1 The sample size of the observed data varies for each KPI.
100111100001110110001001000101011001100000011111100110110101011101010111011000011111011010101010100111100001110110001001000101011001100000011111100110110101011101010111011000011111011010101010
100111100001110110001001000101011001100000011111100110110101011101010111011000011111011010101010100111100001110110001001000101011001100000011111100110110101011101010111011000011111011010101010
100111100001110110001001000101011001100000011111100110110101011101010111011000011111011010101010100111100001110110001001000101011001100000011111100110110101011101010111011000011111011010101010
Industries Included: Automotive Manufacturing, Food & Beverage Manufacturing, Diversified Retailers, Industrial Products & Appliances, Consumer Packaged Goods Operations, Pharmaceuticals

4
Procurement
Materials Management
Order Management
Master Data Management
Production
Sales & Operations Planning
Distribution
Supply Chain
Supply ChainSupply Chain Operations refers to the groups, functions and processes involved in efficiently moving products from production facilities to end users and consumers. Effective supply chain management can be essential in providing a company with a competitive advantage, especially in markets where there is high competition and/or low consumer switching costs.
SAMPLE

opsdog-kpi-report-bundle.custom.sample 2017 Edition | © OpsDog, Inc.
5
SAMPLE
Lost Time Case Rate (LTC)Definition & Measurement Details
The number of Lost Time Cases recorded multiplied by 200,000, then divided by the total number of employee labor hours worked over a certain period of time.
Lost Time Case Rate (LTC) is an indicator of the diligence with which the company implements worker safety controls and procedures. High values for this KPI may be indicative of inadequate safety training programs, out of date or malfunctioning machinery or a lack of sufficient safety employees or inspectors within the company. LTC may be reduced if managers investigate worksites after accidents or near misses to identify the root cause of the problem and prevent future incidents from occurring as well as increasing the number of inspections prior to safety incidents.
Total Recordable Incident Rate (TRIR), OSHA Days Away from Work Cases Rate
(Number of Lost Time Cases * 200,000 / Total Employee Hours Worked in a Year)
Two values are used to calculate this KPI: (1) number of OSHA Lost Time Cases that occur in a year * 200,000, and (2) the total number of employee hours worked in a year. A Lost Time Case is an OSHA recordable incident in which an employee is not able to return to work or is assigned restricted work on the day or shift following the incident. The number of cases is multiplied by 200,000 to in order to calculate the number of incidents per 100 employees (100 employees * 40 hours per week * 50 weeks per year = 200,000 hours worked).
What is Lost Time Case Rate (LTC)?
Formula
Why should this KPI be measured? How is this KPI calculated?
Related KPIs
ABRIDGED CONTENT

opsdog-kpi-report-bundle.custom.sample 2017 Edition | © OpsDog, Inc.
6
SAMPLE
Lost Time Case Rate (LTC)Benchmarks & Characteristics of High Performers
Lost Time Case Rate (LTC)(Number of Lost Time Cases * 200,000 / Total Employee Hours Worked in a Year)
How to read this chart: This chart summarizes the performance gaps between high (Top 5%), mid
(Median) and low (Bottom 5%) performers for this Key Performance Indicator (KPI). For example, the
column labeled “Top 5%” represents a company that outperformed 95% of the peer group observed
for this metric.
Avg (XX)
Low PerformersHigh PerformersXX
XX
XX
XX
XX
XX
XX
XX
XX
XX
XX
XXXXXX
Sample Size: XX
KPI Type: XX
Unit: XX
Is High or Low Best?: XX
Characteristics of High Performers
• KPIs are well-defined, tracked and tied to performance reviews
• Robust self-service options for customer (online FAQs, etc.)
• Agents cross-trained to handle and resolve multiple call types
• KPIs are well-defined, tracked and tied to agent performance reviewsABRIDGED CONTENT

opsdog-kpi-report-bundle.custom.sample 2017 Edition | © OpsDog, Inc.
7
SAMPLE
Supply Chain Expense as a Percentage of Total RevenueDefinition & Measurement Details
The expense incurred through all supply chain processes and procedures (i.e., all costs related to distribution, logistics, procurement, materials management, etc.) divided by the total revenue generated by the company over the same period of time, as a percentage.
Supply Chain Expense as a Percentage of Total Revenue measures the expense incurred through all supply chain processes and procedures (i.e., all costs related to distribution, logistics, procurement, materials management, etc.) in relation to the total revenue generated by the company over the same period of time. A relatively high value for this metric is typically related to a few common factors, including highly manual (i.e., error and rework prone) supply chain processes and procedures (e.g., distribution, logistics, procurement, materials management, order management, etc. processes that are almost entirely managed through manual labor), overstaffing of one or all supply chain-related departments, general inefficiencies within supply chain processes (e.g., inaccurate demand forecasting methods, inefficient customer order documentation tracking, sub-par procurement policies, poor inventory management, etc.), and sub-par supply chain employee training and performance. While companies typically seek to streamline operations and employee positions to reduce expenses in their supply chain departments, great care should be taken when doing so as too many layoffs can have a negative impact on company morale and make it difficult to provide customers the products they ordered in a timely fashion.
Inventory Turnover (Finished Goods Only), Labor Expense as a Percentage of Total Supply Chain Expense, Distribution Expense as a Percentage of Total Revenue
(Supply Chain Expense Incurred / Total Company-Wide Revenue Generated) * 100
Two values are used to calculate this KPI: (1) the expense incurred through all supply chain processes and procedures, and (2) the total revenue generated by the company over the same period of time. Include labor (wages, salaries, commissions, benefits), overhead (occupancy, utilities, advertising, legal fees, travel costs, etc.), and technology (hardware, software, etc.) costs in the numerator. Include the expenses incurred through supply chain-related activities (i.e., all costs related to distribution, logistics, procurement, materials management, etc.). Do not include manufacturing expenses in this calculation.
What is Supply Chain Expense as a Percentage of Total Revenue?
Formula
Why should this KPI be measured? How is this KPI calculated?
Related KPIs
ABRIDGED CONTENT
opsdog-kpi-report-bundle.custom.sample 2017 Edition | © OpsDog, Inc.
8
SAMPLE
Supply Chain Expense as a Percentage of Total RevenueBenchmarks & Characteristics of High Performers
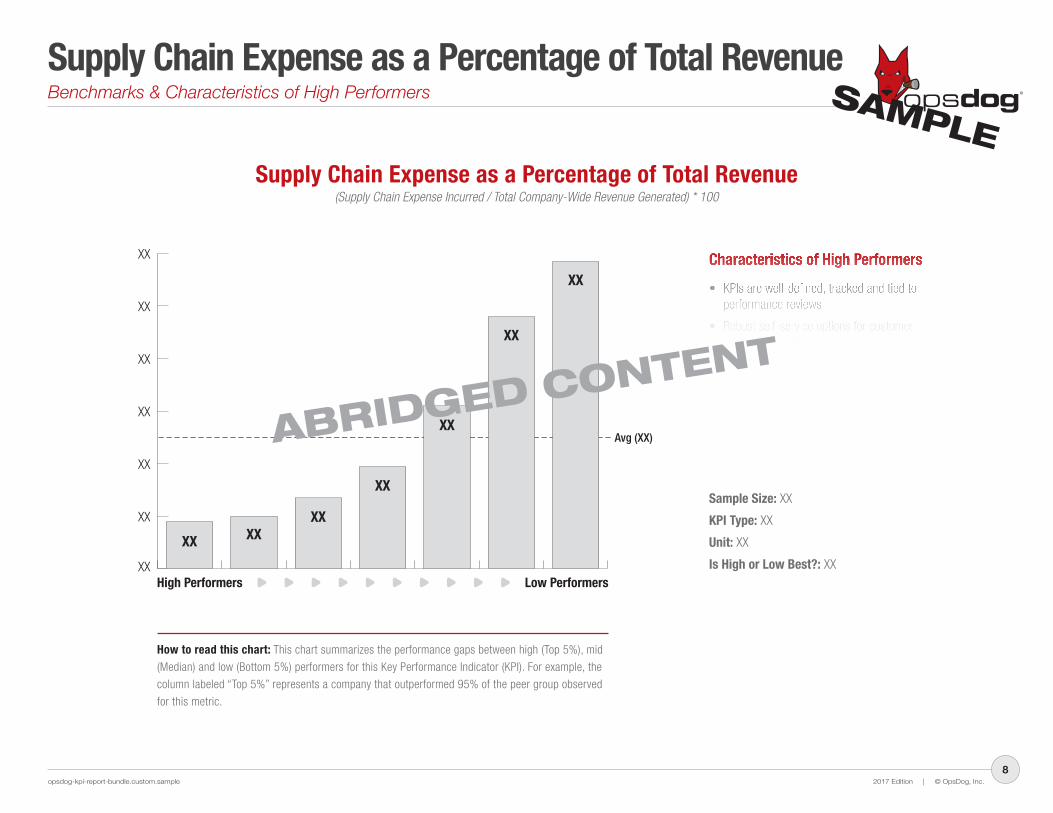
Supply Chain Expense as a Percentage of Total Revenue(Supply Chain Expense Incurred / Total Company-Wide Revenue Generated) * 100
How to read this chart: This chart summarizes the performance gaps between high (Top 5%), mid
(Median) and low (Bottom 5%) performers for this Key Performance Indicator (KPI). For example, the
column labeled “Top 5%” represents a company that outperformed 95% of the peer group observed
for this metric.
Avg (XX)
Low PerformersHigh PerformersXX
XX
XX
XX
XX
XX
XX
XX
XX
XX
XX
XXXXXX
Sample Size: XX
KPI Type: XX
Unit: XX
Is High or Low Best?: XX
Characteristics of High Performers
• KPIs are well-defined, tracked and tied to performance reviews
• Robust self-service options for customer (online FAQs, etc.)
• Agents cross-trained to handle and resolve multiple call types
• KPIs are well-defined, tracked and tied to agent performance reviewsABRIDGED CONTENT

opsdog-kpi-report-bundle.custom.sample 2017 Edition | © OpsDog, Inc.
9
SAMPLE
Total Recordable Incident Rate (TRIR)Definition & Measurement Details
The number of Occupational Safety and Health Administration (OSHA) recordable Injury and Illness cases recorded multiplied by 200,000, then divided by the total number of employee labor hours worked.
Total Recordable Incident Rate (TRIR) is an indicator of the diligence with which the company implements worker safety controls and procedures. High values for this KPI may be indicative of inadequate safety training programs, out of date or malfunctioning machinery or a lack of sufficient safety employees or inspectors within the company. TRIR may be reduced if managers investigate worksites after accidents or near misses to identify the root cause of the problem and prevent future incidents from occurring as well as increasing the number of inspections prior to safety incidents.
OSHA Incident Frequency, OSHA Days Away from Work Cases Rate (Number of OSHA Cases * 200,000 / Total Employee Hours Worked in a Year)
Two values are used to calculate this KPI: (1) number of OSHA recordable Injury and Illness cases that occur in a year * 200,000, and (2) the total number of employee hours worked in a year. A recordable incident is a work-related injury or illness that causes fatality, unconsciousness, lost work days, restricted work activity, job transfer, or medical care beyond first aid. The number of cases is multiplied by 200,000 to in order to calculate the number of incidents per 100 employees (100 employees * 40 hours per week * 50 weeks per year = 200,000 hours worked).
What is Total Recordable Incident Rate (TRIR)?
Formula
Why should this KPI be measured? How is this KPI calculated?
Related KPIs
ABRIDGED CONTENT
opsdog-kpi-report-bundle.custom.sample 2017 Edition | © OpsDog, Inc.
10
SAMPLE
Total Recordable Incident Rate (TRIR)Benchmarks & Characteristics of High Performers
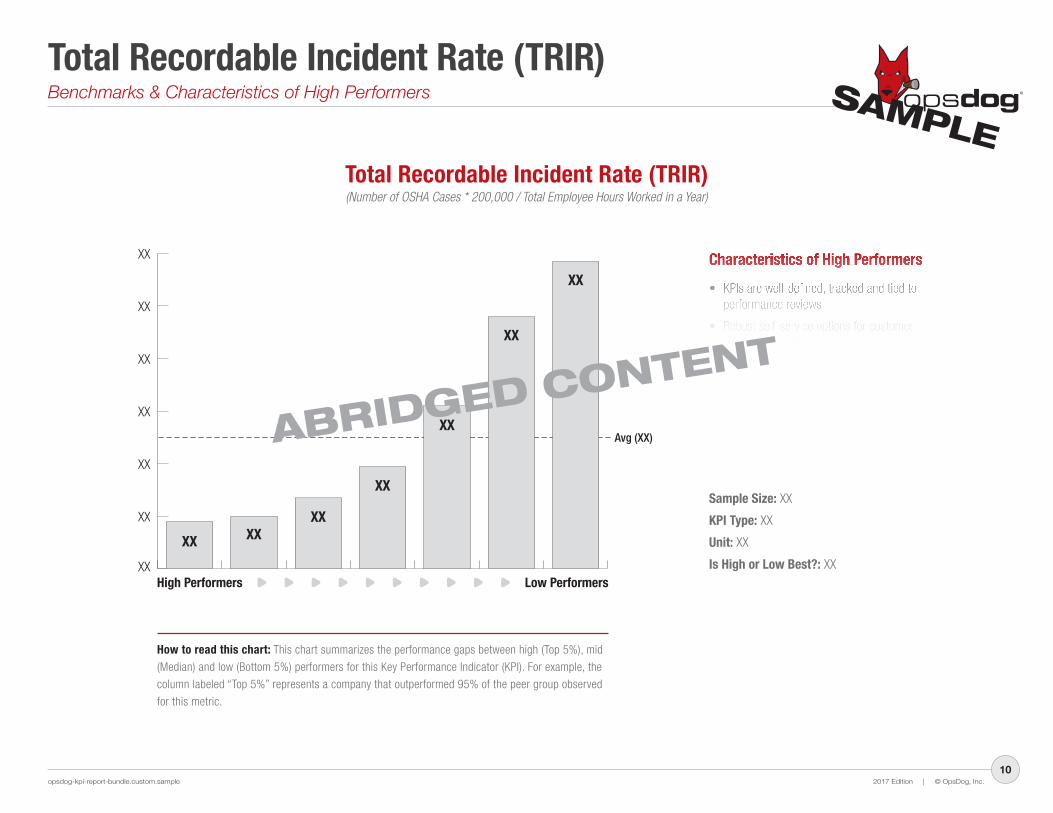
Total Recordable Incident Rate (TRIR)(Number of OSHA Cases * 200,000 / Total Employee Hours Worked in a Year)
How to read this chart: This chart summarizes the performance gaps between high (Top 5%), mid
(Median) and low (Bottom 5%) performers for this Key Performance Indicator (KPI). For example, the
column labeled “Top 5%” represents a company that outperformed 95% of the peer group observed
for this metric.
Avg (XX)
Low PerformersHigh PerformersXX
XX
XX
XX
XX
XX
XX
XX
XX
XX
XX
XXXXXX
Sample Size: XX
KPI Type: XX
Unit: XX
Is High or Low Best?: XX
Characteristics of High Performers
• KPIs are well-defined, tracked and tied to performance reviews
• Robust self-service options for customer (online FAQs, etc.)
• Agents cross-trained to handle and resolve multiple call types
• KPIs are well-defined, tracked and tied to agent performance reviewsABRIDGED CONTENT
Related Documents