The Concentration of Opioid Prescriptions by Providers and Among Patients in the Oregon Medicaid Program Hyunjee Kim, Ph.D., Daniel M. Hartung, Pharm.D., M.P.H., Reside L. Jacob, Sc.M., Dennis McCarty, Ph.D., K. John McConnell, Ph.D. Objective: This study examined the distribution of opioid prescribing across providers and patients and the extent to which concentrated distribution predicts opioid misuse. Methods: Using 2013 Oregon Medicaid claims and the Na- tional Provider Identifier Registry, this study identified pa- tients who filled at least one opioid prescription and providers who prescribed opioids for those patients (N=61,477 Medicaid beneficiaries). This study examined the distribution of opioid prescriptions by provider and patient, the extent to which high-volume opioid use was associated with potential opioid misuse, and how this association changed when patients received opioids from providers in the top decile of morphine-equivalent doses (MEQ) pre- scribed in 2013. This study used four indicators of opioid misuse: doctor and pharmacy shopping for opioid pre- scriptions, opioid prescription overlap, and opioid and ben- zodiazepine prescription overlap. Results: Opioid use and prescriptions were heavily con- centrated among the top 10% of opioid users and pre- scribers. Those high-volume opioid users and prescribers accounted for, respectively, 83.2% and 80.8% in MEQ of entire opioids prescribed. Patients’ increasing use of opioids (by MEQ) was associated with most measures of opioid misuse. Patients receiving opioids from high-volume pre- scribers had a higher probability of opioid prescription overlap and opioid and benzodiazepine prescription overlap compared with other patients, but the difference was sig- nificant only among patients who received high doses of opioids, and the size of the difference was modest. Conclusions: Whereas current policies emphasize reducing opioid prescriptions across all patients and providers, study results suggest that focusing policies on high-volume opioid users and prescribers may be more beneficial. Psychiatric Services in Advance (doi: 10.1176/appi.ps.201500116) Death rates from prescription opioid overdoses in the United States more than tripled between 1999 and 2012, creating an urgent need for policies that can effectively reduce the mor- tality and morbidity associated with opioid misuse (1). The effectiveness of policies may depend, in part, on how providers prescribe opioids. If, for example, providers are uniform in the ways in which they prescribe opioids, then policies that broadly apply to all providers may be warranted. On the other hand, if a majority of opioids are obtained through a relatively small number of providers or a certain provider specialty, tai- loring policy interventions to affect a narrower group of pro- viders may be more effective than a broad-based application. Opioid misuse is generally concentrated among patients who are prescribed higher volumes of opioids (2–5). How- ever, less is known about variations in provider prescribing patterns and their implications. Heavy prescribing could be a marker for inappropriate use. In a recent study, opioid- related deaths were concentrated among patients treated by physicians who prescribed high volumes of opioids for each patient, although this study did not control for patient characteristics that could affect patient health outcomes (6). On the other hand, high-volume providers could be associ- ated with lower rates of opioid misuse and better patient outcomes because they specialize in pain treatment. This study began with simple questions for which we had relatively little data: within a specified region and patient population, how concentrated are opioid prescribing and use, and does this concentration predict opioid misuse? Specifically, we sought to understand whether the top decile of providers and patients account for the majority of opioid prescriptions and tested the relationships of the opioid prescription concentration to indicators of opioid misuse. We focused on Medicaid enrollees in Oregon. Compared with privately insured individuals, Medicaid patients are more likely to receive opioid prescriptions, at higher doses, and for longer periods (7–9) and to have higher death rates from overdoses (10,11). Oregon has taken a progressive stance in providing access to opioids for treatment of pain. The Oregon Intractable Pain Act of 1995 allows physicians to prescribe opioids for treatment of chronic pain at levels that PS in Advance ps.psychiatryonline.org 1 ARTICLES

Welcome message from author
This document is posted to help you gain knowledge. Please leave a comment to let me know what you think about it! Share it to your friends and learn new things together.
Transcript
The Concentration of Opioid Prescriptions by Providersand Among Patients in the Oregon Medicaid ProgramHyunjee Kim, Ph.D., Daniel M. Hartung, Pharm.D., M.P.H., Reside L. Jacob, Sc.M., Dennis McCarty, Ph.D.,K. John McConnell, Ph.D.
Objective: This study examined the distribution ofopioid prescribing across providers and patients and theextent to which concentrated distribution predicts opioidmisuse.
Methods: Using 2013 Oregon Medicaid claims and the Na-tional Provider Identifier Registry, this study identified pa-tients who filled at least one opioid prescription andproviders who prescribed opioids for those patients(N=61,477 Medicaid beneficiaries). This study examined thedistribution of opioid prescriptions by provider and patient,the extent to which high-volume opioid use was associatedwith potential opioid misuse, and how this associationchanged when patients received opioids from providers inthe top decile of morphine-equivalent doses (MEQ) pre-scribed in 2013. This study used four indicators of opioidmisuse: doctor and pharmacy shopping for opioid pre-scriptions, opioid prescription overlap, and opioid and ben-zodiazepine prescription overlap.
Results: Opioid use and prescriptions were heavily con-centrated among the top 10% of opioid users and pre-scribers. Those high-volume opioid users and prescribersaccounted for, respectively, 83.2% and 80.8% in MEQ ofentire opioids prescribed. Patients’ increasing use of opioids(by MEQ) was associated with most measures of opioidmisuse. Patients receiving opioids from high-volume pre-scribers had a higher probability of opioid prescriptionoverlap and opioid and benzodiazepine prescription overlapcompared with other patients, but the difference was sig-nificant only among patients who received high doses ofopioids, and the size of the difference was modest.
Conclusions: Whereas current policies emphasize reducingopioid prescriptions across all patients and providers, studyresults suggest that focusing policies on high-volume opioidusers and prescribers may be more beneficial.
Psychiatric Services in Advance (doi: 10.1176/appi.ps.201500116)
Death rates from prescription opioid overdoses in the UnitedStates more than tripled between 1999 and 2012, creating anurgent need for policies that can effectively reduce the mor-tality and morbidity associated with opioid misuse (1). Theeffectiveness of policies may depend, in part, on how providersprescribe opioids. If, for example, providers are uniform inthe ways in which they prescribe opioids, then policies thatbroadly apply to all providers may be warranted. On the otherhand, if a majority of opioids are obtained through a relativelysmall number of providers or a certain provider specialty, tai-loring policy interventions to affect a narrower group of pro-viders may be more effective than a broad-based application.
Opioid misuse is generally concentrated among patientswho are prescribed higher volumes of opioids (2–5). How-ever, less is known about variations in provider prescribingpatterns and their implications. Heavy prescribing could bea marker for inappropriate use. In a recent study, opioid-related deaths were concentrated among patients treatedby physicians who prescribed high volumes of opioids foreach patient, although this study did not control for patient
characteristics that could affect patient health outcomes (6).On the other hand, high-volume providers could be associ-ated with lower rates of opioid misuse and better patientoutcomes because they specialize in pain treatment.
This study began with simple questions for which we hadrelatively little data: within a specified region and patientpopulation, how concentrated are opioid prescribing anduse, and does this concentration predict opioid misuse?Specifically, we sought to understand whether the top decileof providers and patients account for the majority of opioidprescriptions and tested the relationships of the opioidprescription concentration to indicators of opioid misuse.
We focused on Medicaid enrollees in Oregon. Comparedwith privately insured individuals, Medicaid patients aremore likely to receive opioid prescriptions, at higher doses,and for longer periods (7–9) and to have higher death ratesfrom overdoses (10,11). Oregon has taken a progressivestance in providing access to opioids for treatment of pain.The Oregon Intractable Pain Act of 1995 allows physicians toprescribe opioids for treatment of chronic pain at levels that
PS in Advance ps.psychiatryonline.org 1
ARTICLES

can trigger sanctions from state medical boards elsewhere inthe country (12). This law has been celebrated by advocatesconcerned about inadequate pain treatment. Nonetheless,Oregon’s death and hospitalization rates from prescriptionopioid overdose increased more than fivefold between 2000and 2011 (13), leading to calls for policies to limit opioidprescribing. Although there has been widespread specula-tion about the ways in which opioids are obtained andsubsequently abused, relatively little is known about thecharacteristics of the heavy user, and even less is knownabout different provider prescribing patterns. The goal ofthis study was to assess these patterns to provide insight forpolicies aimed at reducing opioid misuse in a vulnerablepopulation of Medicaid enrollees.
METHODS
DataWe used year 2013 data from Oregon Medicaid claims foropioid users’ demographic characteristics, health charac-teristics, and opioid use patterns, and we used NationalProvider Registry data for prescribers’ basic characteristics.We combined these two data sets with each provider’s Na-tional Provider Identifier, creating a patient-provider linkeddata set. We limited the sample to Medicaid beneficiarieswho filled opioid prescriptions at least once in 2013 and toproviders who prescribed an opioid for those beneficiaries.We further excluded patients whowere diagnosed as havingcancer at any time in 2013, who were not continuously en-rolled in Medicaid, and who were eligible for Medicare. Thefinal data set included 61,477 Medicaid beneficiaries.
Measures of Potential Opioid MisuseWe used four measures of potential opioid misuse to captureinappropriate opioid prescribing practices and patient be-haviors. Each measure indicates whether the respectivepractice or behavior occurred at least once in 2013. Twomeasures reflect illicit patient behaviors: doctor and phar-macy “shopping” for opioid prescriptions. We defined doc-tor shopping as having received opioid prescriptions fromsix or more providers during one year, and we definedpharmacy shopping as getting opioid prescriptions filledfrom eight or more pharmacies within one year (14). Pre-vious studies found that doctor and pharmacy shoppingwere associated with opioid overdose (14,15).
We also used two indicators of inappropriate opioidprescribing practices: opioid prescription overlap (that is, atleast one week of overlap for two prescriptions of the sameopioid drugs from one prescriber or multiple prescribers)and opioid and benzodiazepine prescription overlap (at leasta one-week overlap). All of the measures of prescribingpractices have been used in previous studies (16–19).
Concentration of Opioid PrescriptionsWe defined high-volume opioid users and prescribers aspersons in the top decile in morphine-equivalent doses
(MEQ) prescribed throughout the year (8). With this defi-nition, we used MEQ to make opioid doses comparableacross products. We preferred MEQ to number of pre-scriptions as the measure of concentration because opioiddoses differ across prescriptions. To calculate MEQ for eachprescription, the quantity of pills or patches dispensed wasmultiplied by the strength of each pill or patch. We thenmultiplied this by an MEQ conversion factor. [A conversiontable is available in the online supplement to this article.]Last, we summed the MEQ of all prescriptions writtenthroughout 2013 for each patient and prescriber.
Prescribers’ high annual MEQ could be attributable tomultiple factors. For example, high-volume prescriberscould prescribe a moderate amount of opioids for manypatients. Alternatively, they might prescribe high doses ofopioids for a moderate number of patients. To distinguishthese two groups, in our sensitivity analysis we used an al-ternative definition of high-volume opioid prescribers: thosein the top decile in annual MEQ prescribed per patient.
Other VariablesWe controlled for patient age, gender, rurality (20), and pain-related diagnoses (21,22). We also controlled for health con-ditions that often co-occur among opioid users, includingdepression, bipolar disorder, schizophrenia, alcohol-relatedproblems, and drug-related problems (23–26). [A table in theonline supplement lists these conditions by ICD-9-CM code.]For risk adjustment, we used the Chronic Illness and Dis-ability Payment System indicators, which have been validatedand used for risk adjustment in Medicaid populations (27).We also accounted for each provider’s gender, entity type(sole or group practice), and provider type or specialty. Last,we controlled for each patient’s Medicaid health plan (12).
Data AnalysisWe conducted two sets of regression analyses. First, to ex-amine to what extent high-volume opioid users were in-volved with opioid misuse, we estimated a patient-levelregression of four measures of opioid misuse, controlling fora patient’s MEQ decile group, demographic characteristics,comorbid conditions, and Medicaid health plan.
The second set of regressions controlled for prescribercharacteristics, including gender, entity type, and providertype or specialty.We also added an interaction term betweena patient’s MEQ decile group and a dummy variable in-dicating whether the patient’s provider was a high-volumeprescriber in the top MEQ decile. We considered this in-teraction term because opioid users’ experience of opioidmisuse could be influenced by whether they received aprescription from a high-volume prescriber. In the secondset of regressions, we did not examine doctor and pharmacyshopping as outcome variables because the number of doc-tors and pharmacies each patient visited for opioid pre-scription would be unlikely to be affected by the prescriber.
In the second set of regressions, we assigned one pre-scriber to each patient to take into account provider
2 ps.psychiatryonline.org PS in Advance
OPIOID PRESCRIPTION AND USAGE PATTERNS

characteristics in the patient-level regression analyses.Many patients (44%) had more than one prescriber, how-ever. For patients with multiple prescribers, we selected theprovider who prescribed opioids the most times andaccounted for at least one-third of the patient’s total numberof prescriptions. On the basis of this assignment rule, 11,712of the 61,477 patients (19%) were dropped from the originalsample because they did not have a provider who met thelisted condition. As a sensitivity analysis, we examined dif-ferent assignment rules.
All regressions used a linear probability model instead oflogit regressions to avoid a sample size reduction caused byperfect prediction. Standard errors were clustered at theprovider level. All analyses were conducted with Stata 13.
RESULTS
A relatively small share of providers accounted for amajorityof all opioids prescribed. The top 10% of providers accountedfor 80.8% of all MEQ provided to Oregon Medicaid bene-ficiaries. The top 1% of providers accounted for 43.4% ofMEQ prescribed. As shown in Figure 1A, a majority ofproviders (those under the top 10% reference line on they-axis) prescribed relatively low amounts of MEQ. The aver-age annual MEQ prescribed by providers in deciles 1–9 was7,267; providers in the top decile prescribed an average an-nual MEQ of 275,503. High-volume opioid prescribers in thetop decile also had prescription counts that were more thanfive times higher than the average counts of prescribers indeciles 1–9.
We found a similar concentration of opioid use amongpatients. The top 10% of patients accounted for 83.2% of allMEQ prescribed to Oregon Medicaid beneficiaries. The top
1% of patients accounted for 27.7% of MEQprescribed. As shown in Figure 1B, a major-ity of patients (those under the top 10%reference line on the y-axis) received rela-tively low volumes of MEQ. The averageannual MEQ prescribed to patients in dec-iles 1–9 was 863; patients in the top decileaveraged 38,368 annual MEQ and receivedeight times more prescriptions than thosein deciles 1–9.
Table 1 shows characteristics of Medicaidbeneficiaries who received no opioid pre-scriptions, opioid users in deciles 1–9 of MEQreceived, and those in the top MEQ decile.Almost one in five (18%) Medicaid benefi-ciaries received prescriptions for opioids.Compared with individuals who receivedno opioid prescriptions, individuals with anopioid prescription were older, more likely tobe female, and had higher rates of joint andback pain diagnoses as well as diagnoses ofdepression. The mean daily dose for individ-uals in the top decile was 87.6 mgMEQ, close
to the 100-mg level, where overdose risks dramatically in-crease (2,19). Users in the top decile were far more likely todoctor or pharmacy shop and to have overlapping opioidprescriptions or overlapping opioid and benzodiazepineprescriptions.
Table 2 shows characteristics of providers who did notprescribe opioids, who were in the lower nine deciles ofprescribing practice, and who were in the top decile of pre-scribing opioids. Two of three prescribers (66%) who wroteprescriptions for Medicaid patients prescribed opioids. Pro-vider type and specialty varied substantially across all threegroups. Lower-volume prescribers, or those in MEQ deciles1–9, were more likely to be physicians in family medicine,internal medicine, or emergency medicine or to be dentists.Among high-volume prescribers in the top decile, however,the proportions of physicians in emergency medicine anddentists were significantly lower (,1%). About 63% of high-volume prescribers were physicians in family or internalmedicine. High-volume prescribers had substantially differ-ent opioid prescription patterns. They prescribed opioids notonly for more patients but also at higher doses per patientcompared with lower-volume prescribers. About 96.8% and68.1% of high-volume prescribers ever prescribed more than100 mg and 200 mg MEQ per day for a patient.
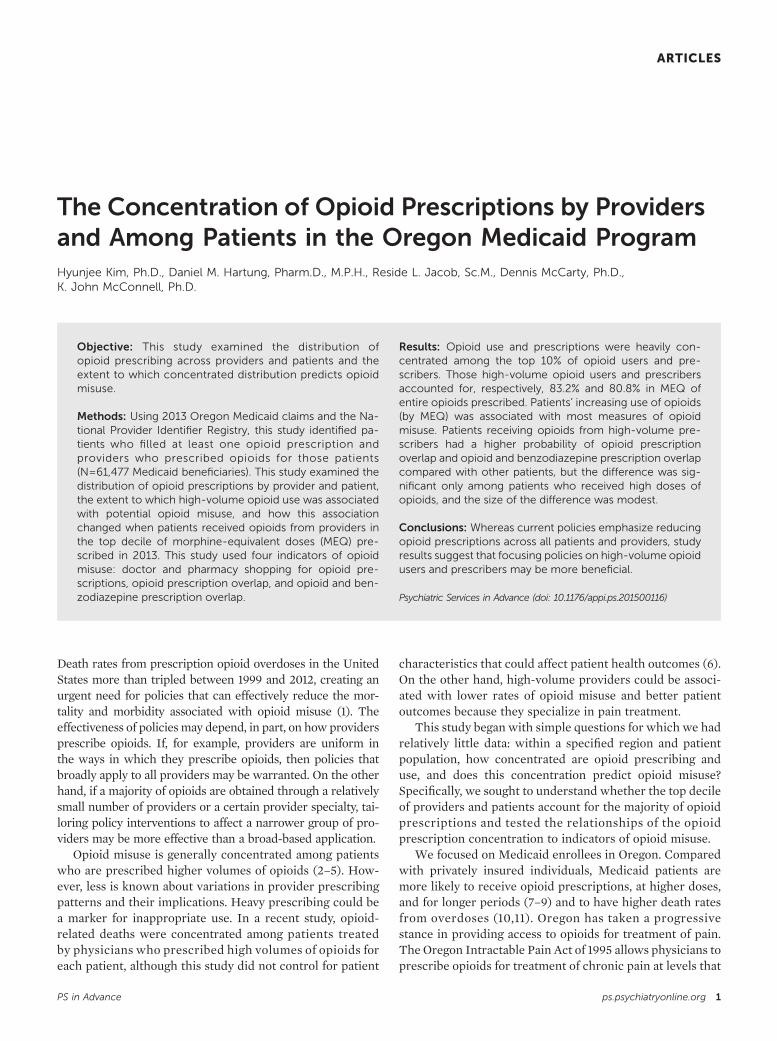
Table 3 shows regression results for our four outcomesof interest (physician shopping, pharmacy shopping, opioidprescription overlap, and opioid and benzodiazepine over-lap). Consistent with other studies (2–5), increasing MEQwas associated with most measures of opioid misuseafter adjustment for patient demographic characteristics,comorbid conditions, and Medicaid health plan. For opioidprescription overlap and overlap of opioid and benzodiaze-pine prescriptions, the coefficients tend to increase as the
FIGURE 1. Opioid use and prescription in the Oregon Medicaid systema
2
An
nu
al M
EQ
(in
mill
ion
s)
400
1 200
0 0
3 600
4 800
An
nu
al M
EQ
(in
th
ou
san
ds)
A B
0 500 1,000Annual opioid prescriptions
1,500 2,000 0 50 100Annual opioid prescriptions
Providers Patients
150 250200
a Annual morphine-equivalent doses (MEQ) and number of opioid prescriptions, by pro-viders (A) and among patients (B). The reference lines (top 10% cutoff) for the y-axis are at68,383 mg and 9,905 mg MEQ in A and B, respectively.
PS in Advance ps.psychiatryonline.org 3
KIM ET AL.

amount of MEQ each patient obtained increased, and theincrease becomes steeper among patients in MEQ deciles 9and 10. The probability of opioid prescription overlap forpatients in deciles 9 and 10 was 13.4 and 24.9 percentagepoints higher than for individuals in the first decile; theprobability of opioid and benzodiazepine prescription over-lap for patients in deciles 9 and 10 was 16.1 and 29.9 per-centage points higher compared with individuals in the firstdecile. Given the average probabilities of these measures (4.4%
and 6.9%), these discrepancies are relativelysubstantial. This suggests that high-volumeopioid users were more likely to experienceopioid prescription overlap and opioid andbenzodiazepine prescription overlap. Fordoctor shopping, the coefficient increasessteeply among patients in deciles 7 through9 but then declines in decile 10. [Full re-gression estimates are provided in the onlinesupplement.]
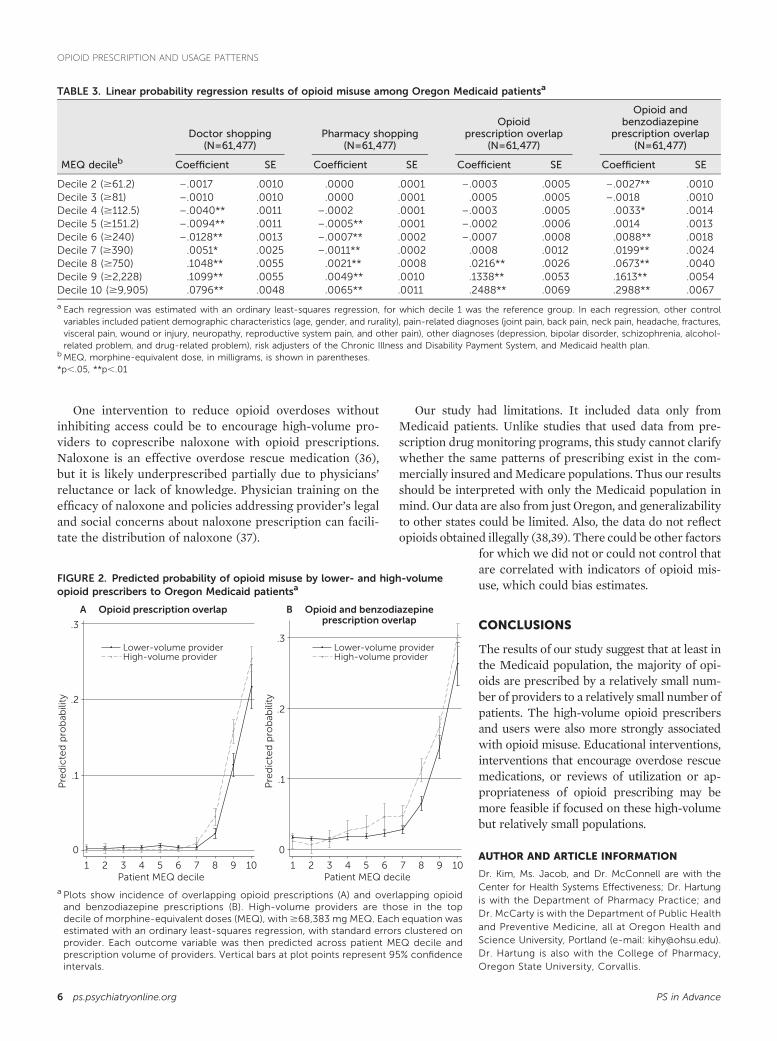
Figure 2 shows predicted probabilitiesof opioid misuse associated with obtainingprescriptions from lower-volume prescribers(deciles 1–9) and high-volume prescribers(decile 10). Patients receiving opioids fromhigh-volume prescribers had a higher prob-ability of overlap in opioid prescriptions andin opioid and benzodiazepine prescriptions,although the increase was significant onlyamong patients who received high amountsof opioids (patients in MEQ deciles 8 andhigher for overlap in opioid prescriptions anddeciles 6 and higher for overlapping opioidand benzodiazepine prescriptions). The sizeof the increase was relatively small: 2.3–4.5percentage points for overlap in opioid pre-scriptions and 2.5–5.3 percentage points foroverlapping opioid and benzodiazepine pre-scriptions. These numbers are smaller thanthe increases in the probability of opioidmisuse we found across patient MEQ group,but they are still significant. This result sug-gests that being treated by a high-volumeprovider was associated with higher proba-bilities of experiencing opioid misuse. [Achart of coefficients used to calculate thepredicted values in Figure 2 is available in theonline supplement.]
We defined high-volume prescribers asthose in the top decile in annual MEQ. As asensitivity analysis, we used a separate defi-nition wherein providers were categorized ashigh-volume prescribers if they were in thetop decile of annual MEQ per patient. Wefound similar results with this alternativedefinition (online supplement).
The analyses in Figure 2 required us toassign patients to a single provider according to our rule ofassigning the provider who prescribed the majority ofopioids and accounted for at least one-third of each pa-tient’s total number of prescriptions. This rule, however,resulted in dropping approximately 20% of our sample,which might have led to biased estimates. To address thisconcern, we conducted another sensitivity analysis usingthree additional assignment rules and found qualitativelysimilar results across the rules (online supplement).
TABLE 1. Characteristics and prescription opioid fill patterns among OregonMedicaid patients in 2013
Opioid usersa
Opioid Lower 9 Topnonusers MEQ deciles MEQ decile
Characteristic (N=280,660)a (N=55,332)b (N=6,145)c
DemographicAge group (%)
0–17 75.1 19.0 ,118–39 15.7 48.9 24.440–59 7.6 27.6 62.160–79 1.6 4.5 13.3$80 ,1 ,1 ,1
Male (%) 47.6 34.0 37.8Rurality of residence (%)
Isolated small rural town 2.2 2.3 2.7Small rural town 13.0 3.7 4.5Large rural town 3.2 13.9 12.6Urban 81.6 80.1 80.1
Pain-related diagnosis (%)Arthritis or joint pain 15.4 49.5 78.9Back pain 5.0 31.1 62.0Neck pain 2.0 12.2 26.2Headache or migraine 1.8 9.0 12.3Fractures 2.6 11.7 13.3Visceral pain 1.0 9.2 12.5Wound or injury 14.3 28.4 28.2Neuropathy .9 6.5 18.4Reproductive system pain 3.4 14.5 9.2Other pain .2 1.1 4.6
Other diagnosis (%)Depression 5.6 21.7 35.9Bipolar disorder .8 3.6 5.9Schizophrenia 1.0 2.2 2.6Alcohol problem 1.1 4.7 7.7Drug problem 1.1 4.4 7.6
Opioid fill patternN of opioid prescriptionsd — 3.3 18.8Daily dose (MEQ mg)e — 34.1 87.6
Opioid misuse (%)Doctor shopping — 3.1 9.2Pharmacy shopping — .1 .7Opioid prescription overlap — 2.0 26.2Opioid and benzodiazepine
prescription overlap— 3.7 32.7
a Patients who were not continuously enrolled in or eligible for Medicare were excluded.b Patients in deciles 1 through 9 in prescription of morphine-equivalent doses (MEQ)c Patients in the top decile were prescribed $9,905 mg MEQ.d The standard deviation for mean number of opioid prescriptions per patient was 4.0 for patientsin lower deciles and 10.5 for patients in the top decile.
e The standard deviation for daily dose was 22.2 mg MEQ for patients in lower deciles and 72.6 forpatients in the top decile.
4 ps.psychiatryonline.org PS in Advance
OPIOID PRESCRIPTION AND USAGE PATTERNS

DISCUSSION
Opioid prescriptionswere common amongOregonMedicaidbeneficiaries and their providers. Almost one in five bene-ficiaries filled at least one opioid prescription, and 66% ofproviders wrote at least one opioid prescription. Despite ahigh prevalence of opioid use amongMedicaid beneficiaries,opioid use and prescriptions were heavily concentratedamong the top 10% opioid users and prescribers. Those high-volume opioid users and prescribers accounted for 83.2%and 80.8% of MEQ of all opioids prescribed, respectively.This concentration of use among patients in Oregon ishigher than what was observed in a similar study of theArkansas Medicaid population, which found that patientsin the top decile were prescribed 62.9% of opioids (8). Theconcentration in prescription among Oregon providers,however, was slightly lower than the corresponding con-centration among the California workers’ compensationsystem (86.8%) (28).
High-volume prescribers were more likely to be physi-cians in family or internal medicine, nurse practitioners, or
physician assistants. They prescribed higherdaily doses of opioids for more Medicaidpatients. Among high-volume prescribers,96.8%had ever prescribed.100mgMEQperday, and 68.1% had ever prescribed .200 mgMEQ per day. Given that the risk of opioidoverdose death increases at 100 mg MEQ perday, the high percentage of providers pre-scribing daily doses of $100 mg may be ofconcern (19), although these high dosageamounts may be attributable to providerswho treat patients with health conditions thatrequire higher doses of opioids.
Overall, opioid misuse was more likelyto be found among high-volume opioid users.The probability of three types of misuse—opioid prescription overlap, overlap of opioidand benzodiazepine prescription, and phar-macy shopping—tended to increase with theamount of MEQ obtained by patients. Opioidusers’ probability of opioid misuse increasedwhen opioids were prescribed by a high-volume prescriber instead of a lower-volumeone, although this finding applied only to thegroup of patients receiving the highest amountof opioids. Although our analyses measuredassociation only, these findings suggest thatprovider prescribing patterns may be a riskfactor for patientswho obtain large amounts ofopioids. These results suggest potential gainsfrom interventions that target prescriptionpatterns among high-volume opioid users andprescribers.
Opioid policies frequently focus on patientbehavior. For example, prescription drug
monitoring programs to reduce opioid misuse, which cur-rently are used in 49 states, including Oregon (begun on June1, 2011), monitor patients’ opioid use within a state (29,30).This effort is valid given the substantial discrepancy we foundin probabilities of opioidmisuse across patients with differentMEQs. Many Medicaid agencies implemented patient lock-inprograms, limiting patients at a high risk of opioid misuse toone prescriber and pharmacy to prevent opioidmisuse (31,32).However, our results suggest that policies specifically focus-ing on providers also may be beneficial. In Oregon, severalorganizations have developed educational materials to im-prove opioid prescribing. For example, a group of providerscreated and disseminated opioid prescribing guidelines (33).The state government also hosted education sessions onsafe opioid prescription (12). Other educational interventions,such as provider profiling and academic detailing, may also beeffective at improving opioid prescribing (34,35). Regulatoryinterventions, such as monitoring for adherence to guidelines,might further reduce opioid misuse. Ideally, these policieswould not inhibit access to opioids that provide safe and re-liable pain management.
TABLE 2. Basic characteristics and opioid prescription patterns across providergroups in Oregon Medicaid
Opioid prescribers
OpioidProvidersin lower 9
Providersin top
nonprescribers MEQ deciles MEQ decileCharacteristic (N=5,153) (N=8,923)a (N=991)b
Male (%) 52.7 56.7 56.6Organization (%)Sole practice 19.7 16.5 14.4Group practice 80.3 83.5 85.6
Type of provider (%)M.D., family medicine 7.1 13.0 39.5M.D., internal medicine 20.6 13.7 23.4M.D., emergency medicine 2.9 9.0 .9M.D., obstetrics, gynecology 2.0 5.5 .3Nurse practitioner 11.6 8.2 14.4Physician assistant 4.5 8.7 9.5Dentist 4.6 10.6 .5Otherc 46.7 31.4 11.5
Opioid prescription patternN of Medicaid patients
prescribed opioidd— 17.4 42.5
Daily dose (MEQ mg) inprescriptione
— 46.3 77.7
Providers ever prescribing.100 mg MEQ per patientper day (%)
— 34.4 96.8
Providers ever prescribing.200 mg MEQ per patientper day (%)
— 8.2 68.1
a Providers in deciles 1 through 9 in morphine-equivalent doses (MEQ) prescribedb Prescribed $68,383 mg MEQc Includes 69 types of providers, including physicians in orthopedic surgery, neurology, andpediatrics
d The standard deviation was 31.5 patients of providers in the lower deciles and 47.0 patients ofproviders in the top decile.
e The standard deviation was 31.1 mg MEQ for opioid prescribers in the lower deciles and 49.9 mgMEQ for opioid prescribers in the top decile.
PS in Advance ps.psychiatryonline.org 5
KIM ET AL.
One intervention to reduce opioid overdoses withoutinhibiting access could be to encourage high-volume pro-viders to coprescribe naloxone with opioid prescriptions.Naloxone is an effective overdose rescue medication (36),but it is likely underprescribed partially due to physicians’reluctance or lack of knowledge. Physician training on theefficacy of naloxone and policies addressing provider’s legaland social concerns about naloxone prescription can facili-tate the distribution of naloxone (37).
Our study had limitations. It included data only fromMedicaid patients. Unlike studies that used data from pre-scription drug monitoring programs, this study cannot clarifywhether the same patterns of prescribing exist in the com-mercially insured andMedicare populations. Thus our resultsshould be interpreted with only the Medicaid population inmind. Our data are also from just Oregon, and generalizabilityto other states could be limited. Also, the data do not reflectopioids obtained illegally (38,39). There could be other factors
for which we did not or could not control thatare correlated with indicators of opioid mis-use, which could bias estimates.
CONCLUSIONS
The results of our study suggest that at least inthe Medicaid population, the majority of opi-oids are prescribed by a relatively small num-ber of providers to a relatively small number ofpatients. The high-volume opioid prescribersand users were also more strongly associatedwith opioid misuse. Educational interventions,interventions that encourage overdose rescuemedications, or reviews of utilization or ap-propriateness of opioid prescribing may bemore feasible if focused on these high-volumebut relatively small populations.
AUTHOR AND ARTICLE INFORMATION
Dr. Kim, Ms. Jacob, and Dr. McConnell are with theCenter for Health Systems Effectiveness; Dr. Hartungis with the Department of Pharmacy Practice; andDr. McCarty is with the Department of Public Healthand Preventive Medicine, all at Oregon Health andScience University, Portland (e-mail: [email protected]).Dr. Hartung is also with the College of Pharmacy,Oregon State University, Corvallis.
FIGURE 2. Predicted probability of opioid misuse by lower- and high-volumeopioid prescribers to Oregon Medicaid patientsa
.3
.2
.1
0
.3
.2
.1
0
Pre
dic
ted
pro
bab
ility
Pre
dic
ted
pro
bab
ility
1 2 3 4 5 6 7 8 9 10Patient MEQ decile
1 2 3 4 5 6 7 8 9 10Patient MEQ decile
Lower-volume providerHigh-volume provider
Lower-volume providerHigh-volume provider
B Opioid and benzodiazepineprescription overlap
A Opioid prescription overlap
a Plots show incidence of overlapping opioid prescriptions (A) and overlapping opioidand benzodiazepine prescriptions (B). High-volume providers are those in the topdecile of morphine-equivalent doses (MEQ), with$68,383 mg MEQ. Each equation wasestimated with an ordinary least-squares regression, with standard errors clustered onprovider. Each outcome variable was then predicted across patient MEQ decile andprescription volume of providers. Vertical bars at plot points represent 95% confidenceintervals.
TABLE 3. Linear probability regression results of opioid misuse among Oregon Medicaid patientsa
Doctor shopping(N=61,477)
Pharmacy shopping(N=61,477)
Opioidprescription overlap
(N=61,477)
Opioid andbenzodiazepine
prescription overlap(N=61,477)
MEQ decileb Coefficient SE Coefficient SE Coefficient SE Coefficient SE
Decile 2 ($61.2) –.0017 .0010 .0000 .0001 –.0003 .0005 –.0027** .0010Decile 3 ($81) –.0010 .0010 .0000 .0001 .0005 .0005 –.0018 .0010Decile 4 ($112.5) –.0040** .0011 –.0002 .0001 –.0003 .0005 .0033* .0014Decile 5 ($151.2) –.0094** .0011 –.0005** .0001 –.0002 .0006 .0014 .0013Decile 6 ($240) –.0128** .0013 –.0007** .0002 –.0007 .0008 .0088** .0018Decile 7 ($390) .0051* .0025 –.0011** .0002 .0008 .0012 .0199** .0024Decile 8 ($750) .1048** .0055 .0021** .0008 .0216** .0026 .0673** .0040Decile 9 ($2,228) .1099** .0055 .0049** .0010 .1338** .0053 .1613** .0054Decile 10 ($9,905) .0796** .0048 .0065** .0011 .2488** .0069 .2988** .0067
a Each regression was estimated with an ordinary least-squares regression, for which decile 1 was the reference group. In each regression, other controlvariables included patient demographic characteristics (age, gender, and rurality), pain-related diagnoses (joint pain, back pain, neck pain, headache, fractures,visceral pain, wound or injury, neuropathy, reproductive system pain, and other pain), other diagnoses (depression, bipolar disorder, schizophrenia, alcohol-related problem, and drug-related problem), risk adjusters of the Chronic Illness and Disability Payment System, and Medicaid health plan.
bMEQ, morphine-equivalent dose, in milligrams, is shown in parentheses.*p,.05, **p,.01
6 ps.psychiatryonline.org PS in Advance
OPIOID PRESCRIPTION AND USAGE PATTERNS

This research was funded by the Silver Family Foundation and by grantR01MH1000001 from the National Institute of Mental Health; grants282-98-0026 and 1U1CE002500-01 from the Centers for DiseaseControl and Prevention; and grants R33DA035640, R01 DA029716, R01DA 030431, UG1 DA015815, and P50 DA018165 from the National In-stitute on Drug Abuse.
Dr. McCarty has research service agreements with Alkermes, whichmakes extended-release naltrexone for the treatment of alcohol andopioid use disorders, and Purdue Pharma, which makes opioid anal-gesics. The other authors report no financial relationships with com-mercial interests.
Received March 23, 2015; revision received July 3, 2015; acceptedAugust 13, 2015; published online January 15, 2016.
REFERENCES1. Warner M, Hedegaard H, Chen L-H: Trends in Drug-Poisoning
Deaths Involving Opioid Analgesics and Heroin. Atlanta, Ga,Centers for Disease Control and Prevention, 2014
2. Dunn KM, Saunders KW, Rutter CM, et al: Opioid prescriptionsfor chronic pain and overdose: a cohort study. Annals of InternalMedicine 152:85–92, 2010
3. Paulozzi LJ, Kilbourne EM, Shah NG, et al: A history of beingprescribed controlled substances and risk of drug overdose death.Pain Medicine 13:87–95, 2012
4. Paulozzi LJ, Zhang K, Jones CM, et al: Risk of adverse healthoutcomes with increasing duration and regularity of opioidtherapy. Journal of the American Board of Family Medicine 27:329–338, 2014
5. Bohnert AS, Valenstein M, Bair MJ, et al: Association betweenopioid prescribing patterns and opioid overdose-related deaths.JAMA 305:1315–1321, 2011
6. Dhalla IA, Mamdani MM, Gomes T, et al: Clustering of opioidprescribing and opioid-related mortality among family physiciansin Ontario. Canadian Family Physician Medecin de FamilleCanadien 57:e92–e96, 2011
7. Ghate SR, Haroutiunian S, Winslow R, et al: Cost and comorbid-ities associated with opioid abuse in managed care and Medicaidpatients in the United Stated: a comparison of two recently pub-lished studies. Journal of Pain and Palliative Care Pharmacother-apy 24:251–258, 2010
8. Edlund MJ, Martin BC, Fan MY, et al: An analysis of heavyutilizers of opioids for chronic noncancer pain in the TROUPstudy. Journal of Pain and Symptom Management 40:279–289,2010
9. State Medicaid Interventions for Preventing Prescription DrugAbuse and Overdose: A Report for the National Association ofMedicaid Directors. Washington, DC, National Association ofMedicaid Directors, 2014. Available at medicaiddirectors.org/sites/medicaiddirectors.org/files/public/namd_rx_abuse_report_october_2014.pdf
10. Coolen P, Best S, Lima A, et al: Overdose Deaths InvolvingPrescription Opioid Among Medicaid Enrollees—Washington,2004–2007. Morbidity and Mortality Weekly Report 58(42):1171–1175, 2009
11. Whitmire JT, Adams GW: Unintentional Overdose Deaths in theNorth Carolina Medicaid Population: Prevalence, PrescriptionDrug Use, and Medical Care Services. Raleigh, NC, State Centerfor Health Statistics, 2010. Available at www.schs.state.nc.us/SCHS/pdf/SCHS_162_WEB_081310.pdf
12. McCarty D, Bovett R, Burns T, et al: Oregon’s strategy to confrontprescription opioid misuse: a case study. Journal of SubstanceAbuse Treatment 48:91–95, 2015
13. Oregon Prescription Drug Monitoring Program. Portland, OregonHealth Authority, 2013. Available at www.orpdmp.com/orpdmpfiles/PDF_Files/PDMP_FactSheet_2013_v1.0.pdf
14. Peirce GL, Smith MJ, Abate MA, et al: Doctor and pharmacyshopping for controlled substances. Medical Care 50:494–500,2012
15. Gwira Baumblatt JA, Wiedeman C, Dunn JR, et al: High-risk useby patients prescribed opioids for pain and its role in overdosedeaths. JAMA Internal Medicine 174:796–801, 2014
16. Logan J, Liu Y, Paulozzi L, et al: Opioid prescribing in emergencydepartments: the prevalence of potentially inappropriate pre-scribing and misuse. Medical Care 51:646–653, 2013
17. Liu Y, Logan J, Paulozzi L, et al: Potential misuse and in-appropriate prescription practices involving opioid anlgesics.American Journal of Managed Care 19:648–665, 2013
18. Paone D, Dowell D, Heller D: Preventing misuse of prescriptionopioid drugs. City Health Information 30:23–30, 2011
19. Opioid Dosing Guideline for Chronic Non-Cancer Pain. Olympia,Wash, Agency Medical Director’s Group, 2010. Available at www.agencymeddirectors.wa.gov/Files/OpioidGdline.pdf
20. Rural-Urban Commuting Area Codes. Seattle, Wash, Rural HealthResearch Center, 2007. Available at depts.washington.edu/uwruca/index.php
21. Sullivan MD, Edlund MJ, Fan MY, et al: Trends in use of opioidsfor non-cancer pain conditions 2000–2005 in commercial andMedicaid insurance plans: the TROUP study. Pain 138:440–449,2008
22. Seal KH, Shi Y, Cohen G, et al: Association of mental health dis-orders with prescription opioids and high-risk opioid use in USveterans of Iraq and Afghanistan. JAMA 307:940–947, 2012
23. Morden NE, Munson JC, Colla CH, et al: Prescription opioid useamong disabled Medicare beneficiaries: intensity, trends, and re-gional variation. Medical Care 52:852–859, 2014
24. Pletcher MJ, Kertesz SG, Kohn MA, et al: Trends in opioid pre-scribing by race/ethnicity for patients seeking care in US emer-gency departments. JAMA 299:70–78, 2008
25. Sullivan MD, Edlund MJ, Steffick D, et al: Regular use of pre-scribed opioids: association with common psychiatric disorders.Pain 119:95–103, 2005
26. Scherrer JF, Svrakic DM, Freedland KE, et al: Prescription opioidanalgesics increase the risk of depression. Journal of General In-ternal Medicine 29:491–499, 2014
27. Kronick R, Gilmer T, Dreyfus T, et al: Improving health-basedpayment for Medicaid beneficiaries: CDPS. Health Care FinancingReview 21:29–64, 2000
28. Swedlow A, Ireland J, Johnson G: Prescribing Patterns of Sched-ule II Opioids in California Workers’ Compensation. Sacramento,California Workers’ Compensation Institute, 2011
29. Prescription Drug Monitoring Frequently Asked Questions(FAQ). Boston, Prescription Drug Monitoring Program Train-ing and Technical Assistance Center, 2015. Available at www.pdmpassist.org
30. Rutkow L, Turner L, Lucas E, et al: Most primary care physi-cians are aware of prescription drug monitoring programs, butmany find the data difficult to access. Health Affairs 34:484–492,2015
31. Katz NP, Birnbaum H, Brennan MJ, et al: Prescription opioidabuse: challenges and opportunities for payers. American Journalof Managed Care 19:295–302, 2013
32. Werth SR, Sachdeva N, Roberts AW, et al: North Carolina Med-icaid recipient management lock-in program: the pharmacist’sperspective. Journal of Managed Care and Specialty Pharmacy 20:1122–1129, 2014
33. Opioid Prescribers Guidelines. Portland, Oregon Pain Guidance,2014. Available at www.oregonpainguidance.org
34. O’Brien M, Rogers S, Jamtvedt G, et al: Educational outreach visits:effects on professional practice and health care outcomes. CochraneDatabase of Systematic Reviews CD000409.pub2, 2007. Available atonlinelibrary.wiley.com/doi/10.1002/14651858.CD000409.pub2/abstract
PS in Advance ps.psychiatryonline.org 7
KIM ET AL.

35. Soumerai SB, Avorn J: Principles of educational outreach(‘academic detailing’) to improve clinical decision making. JAMA263:549–556, 1990
36. Jasinski DR, Pevnick JS, Griffith JD: Human pharmacology and abusepotential of the analgesic buprenorphine: a potential agent for treatingnarcotic addiction. Archives of General Psychiatry 35:501–516, 1978
37. Beletsky L, Ruthazer R, Macalino GE, et al: Physicians’ knowledgeof and willingness to prescribe naloxone to reverse accidental
opiate overdose: challenges and opportunities. Journal of UrbanHealth 84:126–136, 2007
38. Best S: PMP Use by Medicaid. Waltham, Mass, Brandeis Uni-versity, PDMP Center of Excellence, 2012. Available at www.pdmpexcellence.org/sites/all/pdfs/Best.pdf
39. Cepeda MS, Fife D, Chow W, et al: Opioid shopping behavior: howoften, how soon, which drugs, and what payment method. Journalof Clinical Pharmacology 53:112–117, 2013
8 ps.psychiatryonline.org PS in Advance
OPIOID PRESCRIPTION AND USAGE PATTERNS
Related Documents