Operator manual

Welcome message from author
This document is posted to help you gain knowledge. Please leave a comment to let me know what you think about it! Share it to your friends and learn new things together.
Transcript

Operator manualOperator manual

2 | GALILEI G4 Operator Manual © 2016 Ziemer Ophthalmic Systems AG Doc. No. CM3941-0081-03

GALILEI G4 Operator Manual | 3© 2016 Ziemer Ophthalmic Systems AG Doc. No. CM3941-0081-03
CONTENTS
INSTRUCTIONS FOR USE
1 General 91.1 About this Manual 91.2 How to use this Manual 101.3 Maintenance and Customer Service 101.4 Explanation of symbols 111.5 Terms and abbreviations 121.6 Safety Instructions 14
2 General system description 172.1 Intended use 172.2 Indications for use 172.3 System description 172.4 System Components 18
2.4.1 GALILEI system overview 182.4.2 System component details 202.4.3 Optional peripheral devices, accessories, and software packages 21
3 Operating the GALILEI 233.1 Setting up and installing equipment 23
3.1.1 Software installation 233.1.2 Connection to an existing network 233.1.3 Connecting supplementary equipment 233.1.4 Printer installation 243.1.5 Antivirus Software 243.1.6 Software installation on a separate PC (Remote Workstation) 243.1.7 Transport and storage 24
3.2 System startup and shutdown procedure 253.3 Taking a measurement 25
3.3.1 Preparations 253.3.2 Adjustment of the measurement head 263.3.3 Quality checking 283.3.4 Review images in Verify Panel 323.3.5 Different measurement settings 34
3.4 Quick Guide to taking GALILEI measurements 35
4 Database management 374.1 Patient database management 37
4.1.1 Exporting Patient Data 404.1.2 Importing Patient Data 424.1.3 Patient data and measurement pop-up 44
4.2 Backing up the GALILEI database 454.2.1 Backing up to a USB device 454.2.2 Patient data backup 454.2.3 Restore Patient data 46

4 | GALILEI G4 Operator Manual © 2016 Ziemer Ophthalmic Systems AG Doc. No. CM3941-0081-03
4.2.4 Backing up to a network drive 464.2.5 Data Export / Import from Vintage GALILEI to G4 systems 47
5 Care and Maintenance 495.1 Customer service information 495.2 Remote support 495.3 Cleaning and disinfection procedures 505.4 Replacement of fuses 505.5 Disposal 50
6 Technical Specifications 516.1 Technical data 516.2 Hardware interfaces 536.3 Manufacturer’s EMC Declaration 536.4 Appendix – Application related disclaimers 57
APPLICATION MANUAL
7 Settings 617.1 Global Settings 61
7.1.1 [Display] tab: Scan Settings 627.1.2 [Display] tab: Display settings 627.1.3 [Display] tab: Map Settings 637.1.4 [Display] tab: Index Settings 637.1.5 [General] tab: 647.1.6 [Licenses] tab: 657.1.7 [Scales] tab: 66
8 Glossary 698.1 Anterior Chamber dimensions 698.2 Axial vs. instantaneous curvature 718.3 Curvature vs. power 728.4 Ray Tracing 738.5 Total Corneal Power (TCP) (ray-traced) 74
8.5.1 Using Total Corneal Power 748.5.2 Definition of Total Corneal Power 758.5.3 Relationship to SimK and other calculations of corneal power 758.5.4 Using GALILEI Total Corneal Power 768.5.5 Related References 76
8.6 Keratoconus Probability 778.6.1 Keratoconus Prediction Index (KPI) 778.6.2 Keratoconus Probability Indicator (Kprob) 778.6.3 KPI / Kprob Facts 778.6.4 Clinical Validation for KPI Analysis 788.6.5 Cone Location and magnitude Index CLMI 798.6.6 Percent Probability of Keratoconus PPK (related to CLMI) 80
8.7 Wavefront Aberrations and Equivalent Defocus 818.7.1 Wavefront Aberrations 81

GALILEI G4 Operator Manual | 5© 2016 Ziemer Ophthalmic Systems AG Doc. No. CM3941-0081-03
8.7.2 Equivalent Defocus 828.7.3 Equivalent Defocus Maps 83
8.8 How does GALILEI treat data? 858.8.1 Significance of the red zones in the Manual Metrics tab 858.8.2 Dual Scheimpflug and accuracy 87
8.9 Central anterior curvature accuracy: Placido vs. SPF 888.10 How does GALILEI calculate Anterior Chamber Angle and Volume? 89
9 Analyzing the Results 919.1 Customizing the Layout of Results 91
9.1.1 Overlays 919.1.2 Color scales 929.1.3 Predefined and Personalized layout profile 94
9.2 Printing the results 949.3 Generating “Screenshots” 959.4 Application support 959.5 Standard Reports 97
9.5.1 Refractive Report 979.5.2 Keratoconus Report 1029.5.3 Wavefront Report 1079.5.4 IOL Power Report 1099.5.5 Santhiago PTA Report™ 1119.5.6 Z-LASIK Report 114
9.6 Display Options 1169.6.1 Overview Display 1169.6.2 Scheimpflug Image Display 1169.6.3 MapX1 Display 1189.6.4 MapX4 Display 1209.6.5 Five Custom reports 121
9.7 Diagnostic Tools 1229.7.1 Densitometry 1229.7.2 Eye metrics 1239.7.3 Comparing Maps 125
10 Optional Software Modules 12710.1 Overview of available Software Licenses 127
10.1.1 IOL Calculation Module 12710.1.2 Corneal Inlay Module 12710.1.3 Remote Workstation (RWS) 12710.1.4 Santhiago PTA (Percent Tissue Altered) Report™ 12710.1.5 Z-LASIK Report 12710.1.6 DICOM 12810.1.7 CSV Export 128
10.2 IOL Calculator 12810.2.1 Introduction 12810.2.2 IOL Database 12910.2.3 How to use the IOL Calculator 13010.2.4 Importing IOL data into the database 13310.2.5 Managing the IOL Database 134

6 | GALILEI G4 Operator Manual © 2016 Ziemer Ophthalmic Systems AG Doc. No. CM3941-0081-03
10.2.6 IOL power calculation formulas; literature references 13510.3 Corneal Inlay Module 136
10.3.1 Introduction 13610.3.2 How to use 136
10.4 Remote Workstation 13710.5 DICOM Connectivity 138
10.5.1 Exporting data to EMR 13910.5.2 Importing patient data via DICOM 140
10.6 CSV Data Export 14010.7 How to open an exported csv sheet 141

Instructions for UseInstructions for Use

8 | GALILEI G4 Operator Manual/IFU © 2016 Ziemer Ophthalmic Systems AG Doc. No. CM3941-0081-03-IFU

GALILEI G4 Operator Manual/IFU | 9© 2016 Ziemer Ophthalmic Systems AG Doc. No. CM3941-0081-03-IFU
1 GENERAL
We would like to thank you for your decision to purchase this Ziemer product.If the instructions in this Operator Manual are carefully followed we are confident that this prod-uct will give you reliable and trouble-free usage.
1.1 About this Manual
This Operator Manual describes the functioning and the operation of the GALILEI and its soft-ware, as well as the basics for the interpretation of analytical results generated with it.
Translations of the Operator Manual part “Instructions for Use” may be accessed in the “Customer Center” section of our website under “Downloads”: http://galilei.ziemergroup.com/customer-center.html. To access this section please create a personalized user account.
Title GALILEI™ G4 Dual Scheimpflug Analyzer – Operator ManualPart number REF 410.951.003Document number CM3941-0081Revision 03Release date 2016-03Product GALILEI™ G4 Dual Scheimpflug Analyzer
Throughout this Operator Manual, the device will be referred to as “GALILEI”.Author AWI / AKO / ROADisclaimer Please note that while every effort has been made to ensure that the data provided
in this document is accurate, it is the policy of ZIEMER to continuously improve the operating performance and overall quality of its medical devices. Accordingly, the information, figures, illustrations, tables, specifications and schematics herein are subject to change without notice.
Copyright Notice © 2016 Ziemer Ophthalmic Systems AG *)This Operator Manual contains proprietary information. All rights are reserved. This document may not in whole or in part be copied, photocopied, reproduced, trans-lated or reduced to any electronic medium or machine-readable form without prior consent in writing by Ziemer.
Trademarks GALILEI™ is a trademark of Ziemer Group *). Other trademark names are used in an editorial fashion only with no intention of infringement of the trademark of the respective owner.
Manufacturer SIS Surgical Instrument Systems AG *), a Ziemer Group CompanyAllmendstrasse 11, CH-2562 Port, Switzerland.
Licensee and distributor SIS Surgical Instrument Systems AG *), a Ziemer Group CompanyAllmendstrasse 11, CH-2562 Port, Switzerland. www.ziemergroup.com
*) Note: Throughout this Operator Manual, Ziemer Group and its subsidiaries, namely SIS Surgical Instrument Systems AG and Ziemer Ophthalmic Systems AG, will be collectively referred to as “Ziemer”.
Caution: Federal U.S. law restricts this device to sale by, or on the order of, a physician or practitioner.

10 | GALILEI G4 Operator Manual/IFU © 2016 Ziemer Ophthalmic Systems AG Doc. No. CM3941-0081-03-IFU
1.2 How to use this Manual
For your safety, it is essential that you read this Operator Manual carefully and that you famil-iarize yourself with its contents before you start using this device. In particular, please pay close attention to the Safety Instructions in section 1.6 Safety Instructions of this Operator Manual.This Operator Manual is about using the GALILEI and provides hints about interpreting the re-sults. It does not provide information about clinical decisions to be derived from GALILEI mea-surements. These remain the decision and sole responsibility of the physician.This Operator Manual is applicable for GALILEI G4 with software version 6.2.1 and higher.
1.3 Maintenance and Customer Service
No part of the GALILEI may be serviced by users. All service must be carried out by a Ziemer Customer Service specialist or an authorized service center. Do not implement any modifications on the GALILEI yourself. Only spare parts, components, accessories and disposables obtained from Ziemer may be used with the GALILEI. Use of any non-Ziemer parts will void all warranties.As your first point of contact for support we strongly recommend to always contact the distrib-utor from whom you purchased your instrument. The list of distributors can be found at http://www.ziemergroup.com/contact/distributors.html
Your contact address for installations in the USA and Canada:Ziemer USA, Inc. phone: 866-708-4472a Ziemer Group company e-mail: [email protected] E 3rd St.Alton, Illinois 62002, USA
Your international contact address for installations in Europe and anywhere else around the world:Ziemer Ophthalmic Systems AG phone: +41 848 943 637a Ziemer Group company e-mail: [email protected] Allmendsrasse 11CH-2562 Port (Switzerland) www.ziemergroup.com
For further details, also refer to section 5 Care and Maintenance.
Adjustments; product life; calibrationThe GALILEI G4 requires essentially no maintenance or adjustments by the user.
The GALILEI G4 system does not have a specified lifetime. After every year of operation or 10 000 measurements (whichever comes first), the device prompts the user to arrange for a mainte nance service. Upon successful maintenance and testing, the service technician will re-lease the sys tem for another cycle.

GALILEI G4 Operator Manual/IFU | 11© 2016 Ziemer Ophthalmic Systems AG Doc. No. CM3941-0081-03-IFU
1.4 Explanation of symbols
On product labeling and in manuals, certain icons (symbols) are used. Their meaning is explained below:
Symbol Description
Attention, or Read InstructionsWarning! Important information. Read instructions.
Follow instructions for use
Electrical shockType B patient-applied part
Do not dispose of in normal wasteWEEE (Waste from Electrical and Electronic Waste) Directive
Certification markTest symbol of CSA with approval for USA
Certification markEuropean certificate of conformity
ManufacturerName and address of the manufacturer
REF Catalogue NumberManufacturer's catalogue number
SN Serial NumberManufacturer's serial number
Mains Mains
Power Power
Fuse Fuse
WarningA warning indicates an action or procedure which, if not performed correctly, can result in injury or a safety hazard. Comply strictly with the instructions and proceed with care.

12 | GALILEI G4 Operator Manual/IFU © 2016 Ziemer Ophthalmic Systems AG Doc. No. CM3941-0081-03-IFU
1.5 Terms and abbreviations
The table below contains all abbreviations used in this Operator Manual, with a reference to a page where an explanation can be found or where the abbreviation is first used. For a more de-tailed Explanation of important terms, also refer to the Glossary (Application manual, section 8 Glossary).
Abbreviation Page ExplanationAA 105 Area Analyzed (an index used in Keratoconus prediction)AC 69 Anterior ChamberACA 70 Anterior Chamber AngleACD 70 Anterior Chamber DepthACV 70 Anterior Chamber VolumeACP 105 Average Central PowerAM 61 Application ManualANSI 92 American National Standards InstituteAQD 70 Aqueous DepthASL 63 Average Anterior Segment LengthBFA 93 Best Fit AsphereBFS 93 Best Fit SphereBFTA 93 Best Fit Toric AsphereCCT 69 Central Corneal ThicknessCGA 92 Alternate color scales (named after Carlos G. Arce, MD)CLMI 104 Cone Location Magnitude IndexCLMIaa 80 The CLMI index of the anterior axial curvature mapCSI 105 Central Surround IndexCSV 133 Comma-Separated Values (a data format used e.g. in Excel)DAN 95 Doctor’s Advisory NetworkDICOM 138 Digital Imaging and Communications in Medicine.
A standard communication protocol.
Symbol Description
NoteThis symbol indicates an action or procedure that, if not performed correctly, can have an in-direct effect on operation or trigger an unexpected response on the part of the instrument.
CautionThe caution symbol indicates an action or procedure that, if not performed correctly, can re-sult in incorrect operation or destruction of the device. Comply strictly with these instruc-tions.
HintsThe hints symbol highlights tips and tricks for a successful handling and interpretation of the device and its parameters.

GALILEI G4 Operator Manual/IFU | 13© 2016 Ziemer Ophthalmic Systems AG Doc. No. CM3941-0081-03-IFU
Abbreviation Page ExplanationDSI 105 Differential Sector Index. An index used for characterizing
Keratoconus.E 99 Corneal Shape FactorEMC 53 Electromagnetic CompatibilityEMR 128 Electronic Medical RecordESD 54 Electrostatic dischargeGEP 76 Gaussian Equivalent PowerHD 21 Hard Disk / Hard Disk DriveHOA 93 Higher Order Aberration(s)IAI 105 Irregular Astigmatism IndexIEC 14 International Electrotechnical ComissionIFU 8 Instructions for UseIOP 114 Intraocular PressureKCN 77 KeratoconusKPI 77 Keratoconus Prediction IndexKprob 77 Probability of Keratoconus, related to KPILim 32 Limbus and Pupil Edges displayOSI 105 Opposite Sector IndexPD1 / PD2 32 Placido Image 1 and 2 Display PPK 77 Percent Probability of Keratoconus, related to CLMIQ 99 AsphericityRF 53 Radio frequencyRMS 82 Root-Mean-Square (of e.g. wavefront error)ROI 82 Region Of InterestRWS 24 Remote WorkstationSAI 106 Surface Asymmetry IndexSC 32 Scheimpflug image displaySDP 106 Standard Deviation PowerSimK 17 Simulated Keratometry (central anterior power, Axial Curvature)SimKavg 98 Average SimK (of steep and flat axis)SimKf 98 SimK along flat meridianSimKs 98 SimK along steep meridianSPF 85 ScheimpflugSRI 106 Surface Regularity IndexTCP 63 Total Corneal PowerTV 32 Top View image of the corneaW 55 Wattε 99 (epsilon) Eccentricity indexη 73 (eta) Index of Refraction ηk 75 Keratometric Index

14 | GALILEI G4 Operator Manual/IFU © 2016 Ziemer Ophthalmic Systems AG Doc. No. CM3941-0081-03-IFU
1.6 Safety Instructions
Warning: To assure safe operation, it is imperative that the instrument is used according to the instructions in this Operator Manual. There-fore, you should be thoroughly familiar with the content of the instruc-tions for use before operating the system. The GALILEI system must therefore only be operated by trained personnel capable of using it properly on the basis of their training and knowledge of this Operator Manual, their expertise and practical experience.
Only operate the instrument with the original components supplied by Ziemer and when the instrument is in good working condition. Should the instrument be defective, do not operate it, and contact the supplier immediately.
Before maintenance and cleaning of the instrument, always carefully discon-nect the power cord from the wall socket to the GALILEI. Also disconnect all peripheral equipment attached to the GALILEI, for example, a printer.
When connecting the power cable, ensure that the pins and socket match. Al-ways use a three-pole power cable. Ensure that the grounding of the wall out-let is properly connected to the power network’s grounding. If there is any re-sistance and it is impossible to make a connection, then check whether the power cable plug pins fit into the socket. If you have any questions, contact your authorized dealer or our service department.
When disconnecting the electrical power cords, always grasp the outside of the plug end to disconnect and avoid pulling directly on the cables.
Supplementary equipment (e.g. printers) which is connected to the analog or digital interfaces of the instrument must comply with pertinent EN / IEC specifi-cations. All configurations must conform consistently to standard IEC 60601-1.
Do not operate the GALILEI • in areas with risk of explosion, • in areas with risk of standing water, or• in the presence of flammable liquids including anesthetics or volatile solvents.
Do not use or store the instrument in a damp room. Avoid placing the instru-ment in the vicinity of dripping, running or spraying water and ensure that no moisture can penetrate the instrument. For this reason, do not place any con-tainers filled with fluids near the instrument.
When cleaning the instrument, use a lightly damp cloth, be sure to dampen the cloth directly and clean the device so that no excess moisture enters it.

GALILEI G4 Operator Manual/IFU | 15© 2016 Ziemer Ophthalmic Systems AG Doc. No. CM3941-0081-03-IFU
Warning: Do not cover any computer ventilation holes in the table and com-puter housing. It is not permitted to touch electrical contacts of the sockets on the side of the PC housing and the patient at the same time.
The motor for lowering and raising the table has a 1 / 10 intermittent duty cycle (operating time 1 min, cooling time 9 min). It is not intended for continuous op-eration. When moving the table up or down, make sure that operator and pa-tient are clear of the column due to crushing hazard.
Please do not install any software without contacting Ziemer Customer Service. Any attempts to install third-party software without Ziemer’s consent will void any warranty.
This instrument is a high-quality technical product containing sophisticated op-tics. In order to assure accurate results, faultless and safe operation, service in-spections must be performed according to the service plan of Ziemer Ophthal-mic Systems AG.
Ocular examinations with the device should not be unnecessarily prolonged to avoid risks associated with prolonged intense light exposure that could affect the retina. While no acute optical radiation hazards have been identified for slit lamps, it is recommended that the amount of light directed into the patient’s eye be limited to the minimum level which is necessary for diagnosis. Infants, aphakes (subjects without an intraocular lens) and persons with diseased eyes will be at greater risk. The risk may also be increased if the person being exam-ined has had any exposure with the same instrument or any other ophthalmic instrument using a visible light source during the previous 24 hours. This will apply particularly if the eye has been subject to retinal photography.
To ensure that the measurement precision and repeatability is not affected, the GALILEI must be operated in an appropriate environment.The operating conditions regarding humidity and temperature are specified in section 6.1 Technical data.Regarding ambient light the operator has to ensure the following conditions:• The room should be darkened• External light sources should be minimized from shining directly into the pa-
tient side of the measurement head (e.g. a bright monitor, lamps, direct light from a door or window).
Warning: During a measurement with the GALILEI G4, the eye of the patient is exposed to various light sources emitted from the device. Maximum irradiation values to the eye as de fined in Standard EN-ISO 15004-2 must not be exceeded to ensure eye safety.Irradiation, as determined by measuring and normalizing the intensities of the various contin uous-wave and pulsed light sources in use during a GALILEI G4 measurement, are below max imum permissible levels described in Standard EN-ISO 15004-2, both when evaluating irradia tions from the light sources sepa-rately, and when evaluated in combination.Considering that the total, daily light energy delivered to the eye must be lim-ited to 10 J / cm2 (EN-ISO 15004-2).

16 | GALILEI G4 Operator Manual/IFU © 2016 Ziemer Ophthalmic Systems AG Doc. No. CM3941-0081-03-IFU

GALILEI G4 Operator Manual/IFU | 17© 2016 Ziemer Ophthalmic Systems AG Doc. No. CM3941-0081-03-IFU
2 GENERAL SYSTEM DESCRIPTION
2.1 Intended use
The GALILEI G4 is a device intended to take images of the anterior segment of the eye (including cornea, iris, pupil, anterior chamber, and crystalline lens), to evaluate and analyze
• Corneal shape• Lens shape• Pachymetry (thickness of the cornea)• Pupil size• Lens thickness • Condition of the lens
Location of cataracts (nuclear, subcapsular and or cortical), using Scheimpflug slit imaging with densitometry
State of the lens (opaque crystalline lens) • Condition and position of implants (e.g. IOLs, phakic IOLs, intracorneal rings) • Anterior chamber (size, volume and angle) • Scheimpflug Image • Position of the cornea relative to iris and lens
2.2 Indications for use
The GALILEI G4 may be used clinically for preoperative and postoperative evaluation of the anterior eye segment.
2.3 System description
The GALILEI is a noninvasive, noncontact optical diagnostic system designed for the analysis of the anterior segment of the eye, based on processed optical images from an integrated rotating Dual-Scheimpflug and Placido tomography system. The GALILEI device is intended to take images of the anterior segment of the eye, which includes the cornea, iris, pupil, limbus, anterior chamber and lens. These images are processed for the purpose of evaluating and analyzing the corneal shape, anterior and posterior corneal curvature, corneal elevation, corneal power, simulated keratometry (SimK), corneal wavefront, corneal thickness (pachymetry), pupil size, limbus diameter, anterior chamber distance and metrics, anterior chamber volume, anterior chamber angles, densitometry, keratoconus assessment, and detailed analysis of individual Dual-Scheimpflug and Placido images.
For each standard 3D scan, a threedimensional model of the anterior segment is generated by integrating the Placido and rotated Dual-Scheimpflug images. Enhanced image detection, patented iris-based eye-motion detection, and automatic realignment to the Purkinje reflection, are used in the image reconstruction to generate the 3D anterior segment model. From the 3D model, standard reports are automatically generated that contain maps of the anterior and posterior corneal curvature, corneal elevation, corneal power, simulated keratometry (SimK), corneal wavefront, corneal thickness (pachymetry) and biometry including pupil size, limbus diameter, anterior chamber distance and metrics, anterior segment length, anterior chamber volume, anterior chamber angles, and indices for keratoconus assessment. Various reports are provided for standard cataract and refractive evaluations, as well as specialized reports for detailed assessment

18 | GALILEI G4 Operator Manual/IFU © 2016 Ziemer Ophthalmic Systems AG Doc. No. CM3941-0081-03-IFU
for keratoconus and corneal wavefront assessment. Custom reports can also be created to suit your needs. Geometrical analysis of the raytraced anterior chamber model is also available using the Eye Metrics function.
Individual images may be analyzed. Eye metrics of the Scheimpflug image can be performed manually onscreen. Corneal and anterior chamber distances and angles, and corneal and lens densitometry can also be measured. The device also provides an overlay functionality to project a map onto the top view eye image with or without the numerical values and axis. There is also the option to recalculate a map with realignment to the pupil center, or to display maps from both left and right eyes for comparison. Comparison maps can be automatically realigned to compare differences between two examinations or fellow eyes for comparison. Individual images can also be examined and image enhanced for quantitative or qualitative analysis. Review individual image details to aid diagnosis or to verify the image quality and enhanced image detection.
Additional software licenses are available to extend the System’s capabilities. These include enhanced imaging with corneal inlays, IOL calculation, autopopulating a remote access workstation to review maps and images, options to export data and images, e.g. to EMR systems, and the Santhiago PTA report.
2.4 System Components
2.4.1 GALILEI system overview
• Table width: 900 mm• Table depth: 580 mm• Table height: 692 – 967 mm• Table weight: 75 kg (with Computer; without Measurement Unit)• Measurement Head unit weight: 13 kg
The GALILEI G4 consists of the following components:
• Measurement Unit, mounted on a height-adjustable instrument table with locking wheels• Headrest• Control Unit, containing PC and Power Supply• Widescreen Monitor• Keyboard• Wireless Mouse• System and analysis software• Power cable• Operator Manual

GALILEI G4 Operator Manual/IFU | 19© 2016 Ziemer Ophthalmic Systems AG Doc. No. CM3941-0081-03-IFU
Frontview1. Measurement head with builtin device monitor2. Measurement head locking bolt (front)3. Free standing system monitor4. Handle bars attached to the headrest5. OS / OD eye alignment guide6. Table cover (secured with 6 screws)7. Thumbwheel for immobilizing measurement head during transport / storage8. Height adjustable table column9. Keyboard10. Wireless Mouse11. Blockable wheels
Sideview12. Chinrest with disposable chinrest paper13. Headrest14. Forehead band15. Measurement locking bolts (left and right)16. Joystick for positioning the measurement unit17. USB connectors18. Heightadjustment switch for instrument table19. System ON / OFF and reset switches20. Housing for computer and cables
2
3
4
5
6 7
8
12
1314
15
16
17
18
1920
11
910
1

20 | GALILEI G4 Operator Manual/IFU © 2016 Ziemer Ophthalmic Systems AG Doc. No. CM3941-0081-03-IFU
2.4.2 System component details
2.4.2.1 Table and Computer housing
On the measurement table surface near the crossslide, there are two cross marks labeled “OD” and “OS”. They are intended to give you an approximate position for finding the patient’s left or right eye. If you move the slide so that the thumbwheel for immobilizing the crossslide is aligned with the appropriate mark; you should be able to easily align to the patient’s eye. You can now home in to the proper position for taking a wellfocused and centered exam as described in section 3.3 Taking a measurement, or follow the easy steps displayed on the auxiliary device monitor. The OS / OD label of the eye will be visible on the monitor once the eye is visible for measurement. Refer to the Quick Guide to Taking Successful Measurements (section 3.4 Quick Guide to taking GALILEI measurements).
On the computer housing, several switches are located: • Turn on the GALILEI with the green switch (on the inner side of the PC housing; item 19 on
Seite 19). The switch lights up when on. After a few seconds, the GALILEI system will boot. The indicator LED is illuminated.
• Use the black switch beneath the table and next to the green power switch (see item 19 on Seite 19) to (re)boot the PC if the indicator LED is blinking.
• A toggle switch for moving the table up and down is located on the inside of the computer housing (see item 18 on Seite 19).
2.4.2.2 Measurement Head and Device Monitor
The side facing the patient shows the Placido disk, which will rotate through 180 degrees during a measurement.The side facing the operator shows the Device Monitor. This monitor is used for aligning the measurement head to the patient’s eye. In addition, it displays a short checklist for the setup process (described in detail in section 3.3.2 Adjustment of the measurement head). The joystick serves for moving the crossslide and the measurement head leftright, forwardback, and updown (by turning the joystick).
Fig. 1 GALILEI G4 Measurement Head (left: operator side, right: patient side)

GALILEI G4 Operator Manual/IFU | 21© 2016 Ziemer Ophthalmic Systems AG Doc. No. CM3941-0081-03-IFU
2.4.2.3 System Monitor
The system monitor turns on automatically when the PC is powered up. Should it fail to do so, push the button on the lower right of the monitor frame.
2.4.2.4 Wireless Mouse
The wireless mouse delivered as the standard pointing device with the GALILEI has an on / off toggle switch on the bottom side. When “on”, an automatic battery life saving feature is activated that switches the mouse off after a period of inactivity. To reactivate the mouse, click it.Changing Batteries: The battery compartment is located on the bottom of the mouse. Use one AA battery.
2.4.2.5 Keyboard
A small-scale keyboard with US-layout is supplied with the device. If your keyboard is wireless, simply insert the batteries into the keyboard. If you received a wired keyboard, it must be plugged in to the back of the PC. The cable can be run through the cable duct in the table top.
2.4.3 Optional peripheral devices, accessories, and software packages
2.4.3.1 Printers
Printer drivers for a variety of USB printers are preinstalled in the GALILEI system software. For more details, see also section 3.1.4 Printer installation.
2.4.3.2 Exchangeable hard disk drive
An optional exchangeable hard disk drive (HD) for data storage and archiving is available as an optional accessory.
Exchanging the disk: The GALILEI must be turned off. Remove the screw beneath the front of the PC case. Slide the silver button to the right, then the HD holder will open. Carefully remove the HD and replace it with the replacement device. In devices with two exchangeable hard drives, the database disk is the lower one.
Caution: The hard drive must be configured by Ziemer Group in order to function. Replacement hard drives can be ordered separately.

22 | GALILEI G4 Operator Manual/IFU © 2016 Ziemer Ophthalmic Systems AG Doc. No. CM3941-0081-03-IFU
Note: With the GALILEI G4 Advanced configuration, all software licenses are included and pre-installed; the only exception being the Santhiago PTA Report™ module, which is not included in the G4 Advanced configuration.
2.4.3.3 Add-on software packages
For the GALILEI G4, several separately sold software packages are available. They require a separate software license. For details on available packages and on how to install, refer to Application manual, section 10 Optional Software Modules.

GALILEI G4 Operator Manual/IFU | 23© 2016 Ziemer Ophthalmic Systems AG Doc. No. CM3941-0081-03-IFU
3 OPERATING THE GALILEI
3.1 Setting up and installing equipment
The GALILEI will be set up and connected by Ziemer Customer Service or your authorized dealer. The following details are provided for assistance at the clinic location and planning.Installation of the device must consider access to power supply outlets, Ethernet connectivity for remote service access, surge protection (recommended), backup power supply (recommended) and an additional external hard drive for routine and frequent backup of data (recommended, refer to section 4.2 Backing up the GALILEI database).When selecting a location for your device, consider the room light, temperature and air flow conditions to optimize GALILEI measurements and success. First, the room should be able to be darkened and external light sources minimized from shining directly into the measurement head where the patient looks (e.g. avoid direct light sources behind the patient from another device, including a bright monitor, direct reflection of light from a mirror, or an open door or window). A dark room environment is ideal. Scanning in a dark room provides better image contrast, which can improve the image analysis algorithms that rely on the precise, high contrast optical im-ages. Second, the device should not be placed directly below an overhead air conditioning or heating unit, which may lead to condensation on the measurement head glass panel from the patient’s breath or affect the patient’s tear film.Before starting an exam, lock the brakes on the table’s rollers to stabilize the table. Verify that the table can be raised and lowered by testing the switch on the right side of the table. Select a chair or stool for the patient that provides a comfortable position, adjustable height that is within range of table height adjustment, stability when subject is sitting, and the ability to al-low patients to position their chin properly into the headrest.
3.1.1 Software installation
The GALILEI system is equipped with preinstalled current system and analysis software.
3.1.2 Connection to an existing network
The GALILEI can be connected to an existing network (intranet). Please contact Ziemer Customer Service for further instructions. Ziemer Customer Service may need to communicate directly with the local IT specialist for software permissions (for example, when working with a firewall) and for recommendations to minimize any software conflicts.
3.1.3 Connecting supplementary equipment
The operator of the GALILEI is responsible for compliance with the standard IEC 60601-1-1 when any supplementary equipment is connected to the analog or digital interfaces of the GALILEI system. Supplementary equipment may include a printer or external hard drive.
Note: Do not install any software without contacting Ziemer Customer Service. Any attempts to install third party software without Ziemer’s consent will void any warranty.

24 | GALILEI G4 Operator Manual/IFU © 2016 Ziemer Ophthalmic Systems AG Doc. No. CM3941-0081-03-IFU
Note: Do not uninstall any existing printers, including the PDF printer.
3.1.7 Transport and storage
The GALILEI is a precision optical device and should be handled with care. Do not subject it to vibrations, jolts, contamination or high temperatures.
3.1.4 Printer installation
A select number of printer drivers are preinstalled on the GALILEI G4.A PDF printer driver (labeled “ZIOS”) is also pre-installed and required for all printing. Do not re-move this printer driver nor any other pre-installed printer drivers. Printing using this PDF printer (labeled ZIOS) enables the user to preview and verify the report before it is printed. This print-ing process also helps to avoid over-spooling to the local printer.
3.1.4.1 Installing a local printer:Connect the printer to the device and turn the power ON. If the device recognizes the printer, you may then proceed to print. For further assistance to install a printer please contact your au-thorized dealer or Customer Service.
3.1.4.2 Installing a network printer:Installation of a network printer requires administrator-level assistance. Please contact your au-thorized dealer or Customer Service for assistance.
3.1.5 Antivirus Software
Microsoft Security Essentials is preinstalled and acticvated on the GALILEI. The GALILEI has not been tested with other antivirus software. If you wish to install a different virus protection soft-ware, you are doing so at your own risk.
3.1.6 Software installation on a separate PC (Remote Workstation)
The GALILEI analysis software features a remote workstation (RWS) capability for use through a separate networked PC. The Remote Workstation Software application allows read-only ac-cess to the software and database from a separate PC. The remote workstation allows full ac-cess and analysis of the measurements that are in the patient database of the GALILEI via a net-work connection. One can use the RWS while the master GALILEI is being used by a local user. One can also print reports from the RWS. The remote workstation may be useful for review of examinations, as well as instructional to the patient when projected through a large LCD mon-itor.The Remote Workstation is an optional accessory and requires a separate license. The remote workstation has options for multiple concurrently running remote workstations. For more infor-mation, or to purchase a license, please contact your authorized dealer or Ziemer Customer Ser-vice.

GALILEI G4 Operator Manual/IFU | 25© 2016 Ziemer Ophthalmic Systems AG Doc. No. CM3941-0081-03-IFU
For transport and storage conditions, see section 6.2 Hardware interfaces.
Warning: If you need to move the equipment to another location, please take special care when moving the Measurement Unit. The internal components are sensitive to any vibration, jarring or bumping, and re-calibration may be neces-sary after a move. To avoid this, ensure that the Measurement Unit is protected by using the packaging material it was originally shipped in, or ensure that it is well protected from physical mishandling, bumping or any similar shock. To move the device over a step, approach the step with the measurement head side first. Gently lift the table on or off the step. Approach the step with the back wheels and lift that side up or down, too.
3.2 System startup and shutdown procedure
To start using the GALILEI, simply use the ON / OFF switch located on the inside of the table. The computer will then start automatically and take you directly to the database management screen.If the green power switch is already on, use the black reset switch (next to the power switch) to startup the GALILEI.
To shut down the system, follow the procedure below:
1. Terminate the Galilei Software by clicking on the closing icon in the upper right corner.2. Shut down the computer by clicking “Start > Shut Down” in the lower left corner of the Win-
dows screen.3. After the computer is shut down, turn off the power switch located at the left side of the PC
casing (section 2.4.1 GALILEI system overview).
3.3 Taking a measurement
Caution: The following instructions can have a significant impact on your measurement success. Please read and then follow these instructions carefully. (Quick Guide to taking successful measurements (Ref. 410.931.016))
3.3.1 Preparations
In order to take a first measurement, ask the patient to firmly place the chin on the chinrest with the forehead against the headrest and chin touching the front edge of the chinrest. Adjust the table height to maximize patient’s comfort. Instruct the patient to close their mouth and bite their teeth for better stability and suggest holding onto the handle bars that are attached to the chinrest.

26 | GALILEI G4 Operator Manual/IFU © 2016 Ziemer Ophthalmic Systems AG Doc. No. CM3941-0081-03-IFU
Fig. 2 Device Monitor
The chinrest can be rotated to three distinct positions, allowing to rotate the patient’s head slightly to the right or left, in order to avoid a nose shadow on the Placido image. For this pur-pose, the chinrest is rotated to the left (relative to patient’s direction of view) when measuring the patient’s right eye, and vice versa.Upon moving the measurement head in front of either patient eye using the joystick, you will see the image shown below on the device monitor. “OD” or “OS” will be shown depending which eye the measurement head is centered on.Enter the patient’s refraction (spherical equivalent). Initially 0.0 will appear. Set the desired value using the mouse wheel, or by typing. Setting the correct refraction will help the patient to see the fixation target properly focused. Instruct the patient to focus on the red reference tar-get during the entire measurement session.
3.3.2 Adjustment of the measurement head
1. Align the patient’s lower lid to the black marker on the headrest post. Turn the headrest to the left to measure OD and to the right to measure OS.
2. Observe the TopView image. Align the red crosshair to the 4 white dots by rotating the joystick up or down for vertical alignment and move it left or right for horizontal alignment.
3. Looking at the lower part of the display, align the red reference line to the anterior surface of the cornea by moving the joystick forward or backward. The red line should not intersect the cornea, but only just touch it.
4. Ask the patient to blink once and keep the eyes open wide. The head and the eyes should stay in an upright and straight position, motionless until told to relax.
5. Activate the scan by clicking on the joystick button.

GALILEI G4 Operator Manual/IFU | 27© 2016 Ziemer Ophthalmic Systems AG Doc. No. CM3941-0081-03-IFU
Fig. 3 (Left) Device Monitor; (Right) Big screen image (System Monitor)
Prominent Nose: To improve measurement success in a patient with a promi-nent nose, turn the patient’s head slightly (or ask the patient to turn their head) in the direction away from the examined eye. For example, for a left eye exam the patient should turn their head slightly to the right. The result should be turning the patient’s head so their eye is more directly exposed to the imaging window.
Note: A reference guide entitled “Quick Guide to taking successful Measure-ments” is provided as a separate document with your GALILEI (Ref. 410.931. 016). This useful guide is a good reference when taking exams and can be dis-played near your device for easy reference. A copy of the Quick Guide is pro-vided as in section 3.4 Quick Guide to taking GALILEI measurements.
The patient should be encouraged to blink during the alignment process. In fact, the surface tear film of the cornea will be maintained and help improve the image quality of the Placido ring image and will be easier to focus. Thus a fast procedure when aligning is helpful and helps maintain the tear film.

28 | GALILEI G4 Operator Manual/IFU © 2016 Ziemer Ophthalmic Systems AG Doc. No. CM3941-0081-03-IFU
Fig. 4 Verify panel
The verify panel (Fig. 4) provides detailed information of the quality of the measurement. In the top left corner of this screen, you will see a short list of measurement quality percent ages. The user must choose to “Discard” or “Accept” to continue processing the images.
If the post-scan verification option “Verify Always” is checked in the Settings panel, then the complete verify panel will be displayed after each exam and the user must choose to “Discard” or “Accept” to continue processing the images. This option can be very useful during the train-ing phase to review exams and improve the measurement technique.If the “Verify when quality poor” option is checked in the Settings panel, then the verify panel is displayed only if one or more quality indicators are below the recommended value.
The Analysis Report with quality percentage information is accessible at any time when an examination is selected by clicking on [Examination] and [Analysis Report] in the top left corner of the screen.
3.3.3 Quality checking
After the examination is completed the image panel (shown below) can be reviewed by clicking on the [Verify] panel button on the left. This panel is shown until a new scan is initiated.

GALILEI G4 Operator Manual/IFU | 29© 2016 Ziemer Ophthalmic Systems AG Doc. No. CM3941-0081-03-IFU
[Motion Compensation] indicates how well the Eye Tracker system (a patented feature of the GALILEI) was able to follow the eye movement during the procedure. This important score should be higher than 85 %. Eye tracking is critical for combining all images and the data points of the different scans that are taken during one measurement. [Motion Distance] verifies motion in the z-direction and has slightly less importance so it can be as low as 70 %. [Placido] and [Scheimpflug] are also important indicators. They reflect the percentage of fitted data points relative to an expected number of points from an ideal scan. Finally the [Overall Quality] is provided for general information purposes only and it is not used in the “Quality OK” assess-ment.Note that to the left hand side of the measured percentages, icons are displayed to help with the quick recognition: is indicated when all is OK and is indicated when a quality percent-age is below the recommended threshold value. If one of the quality percentage indicators is below the recommended value it will be displayed on all screens and all printouts to prevent any misinterpretation due to inadequate quality of a particular scan.
Fig. 5 Access of Analysis Report
Fig. 6 Analysis report (left: measurement with acceptable quality; right: measurement with reduced quality)

30 | GALILEI G4 Operator Manual/IFU © 2016 Ziemer Ophthalmic Systems AG Doc. No. CM3941-0081-03-IFU
Fig. 7 Nose shadow Fig. 8 Eye lashes
Shadow of the upper lid and eye lashes:One thing you should already be able to see during the alignment of the GALILEI (see picture be-low on the right) are nose shadows or shadows of eye lashes. These shad ows can be seen on the topview image. Also you will notice that the top Scheimpflug image on the large screen will be much darker than the bottom one. To resolve this, ask the patient to open the eye extra wide right before you take the measurement or adjust the patients head and headrest if the nose is covering the images.
Note: The quality percentages of the Analysis Report provide an overall quality indication. It is recommended that you also inspect the individual images for more detailed information; particularly when one of the quality percentage indi-cators is below the recommended minimum.
Note: The minimum percentage limits are approximated, recommended values. Slightly lower values may still yield useful measurements.

GALILEI G4 Operator Manual/IFU | 31© 2016 Ziemer Ophthalmic Systems AG Doc. No. CM3941-0081-03-IFU
Tear film break up:Indications of tear film break up can be failed measurements and often low Placido quality scores. Also when looking at the Top View, you will be able to see a blurry spot where the Placido rings are interrupted. Using the false-color display option in the Verify display, the tear film break up can be clearly seen.Please note in the image on the right that the two blue oval shapes highlight the two blurry spots indicating the tear film break-up in the false-colorized top view image (below).
Fig. 9 False color display revealing tear film break up
To avoid tear film break up, encourage the patient to blink during initial aligning. This will keep the tear film intact. When you have aligned the measurement unit, ask the patient to blink once more and then keep the eye wide open. Now it is a question of getting the last alignment corrections in quickly and starting the scan with minimal delay.
In severe dry eye cases, apply a drop of sterile, medium or low viscosity, aque-ous artificial tears to the eye. Avoid excessive drops and allow time for the tear film to stabilize. It is recommended to wait a few minutes (5 min) for the tear film to stabilize then take the measurement. Repeat the measurement after wicking away excessive tear pooling. To avoid using artificial tears, you may also have patient sit for a few minutes with their eyes closed, then take the measurement.

32 | GALILEI G4 Operator Manual/IFU © 2016 Ziemer Ophthalmic Systems AG Doc. No. CM3941-0081-03-IFU
3.3.4 Review images in Verify Panel
To review Scheimpflug images, click on [SC] To review Top View images, click on [TV]For a TV image with Purkinje dots and computed limbus and pupil edges, click on [Lim]. (“Show Purkinje dots” must be activated in the Settings panel)To review the Placido images, click on [PD1] and [PD2][Overview] is the all-in-one page with all the images. This is only available immediately after taking a new scan.
The following are examples of the SC, TV, Lim, and PD1 Verify panel images.
Excessive or pooled tears:Although it is more common to have insufficient tears, excessive tears can accumulate in the lower lid region and could possibly affect the inferior region of the curvature map.
Carefully wick away excess tears. One can observe these excess tears in the TopView image shown in the Verify panel > Lim display. Any significant effects should be reflected in a false inferior asymmetry as observed in the anterior cur-vature map.
If the Placido image quality was low, make sure to align the eye quickly allow-ing the patient to blink (the procedure improves significantly with practice). Then ask the patient to open his / her eyes wide and watch the target. The tear film is important for reflectivity of the Placido image. Faster alignment and fewer ex-aminations improve tear film quality. If the Placido tear film is reduced, you may choose to wait a few minutes with the patient’s eyes closed to allow the tear film to improve.
If the measurement failed, look at the shadows cast by eyelashes in the top view image. If the lashes appear to be in better focus than the Placido rings, then you are too far from the cornea. The red reference line will likely be far from the cornea. Move closer to the cornea and make sure sharpest focus is on the Placido rings.

GALILEI G4 Operator Manual/IFU | 33© 2016 Ziemer Ophthalmic Systems AG Doc. No. CM3941-0081-03-IFU
Fig. 10 Examples of Verify panel images
Scheimpflug images (SC)
Limbus and pupil edges (Lim), with Purkinje reflex.
Top View image (TV)
One of two Placido images (PD1)

34 | GALILEI G4 Operator Manual/IFU © 2016 Ziemer Ophthalmic Systems AG Doc. No. CM3941-0081-03-IFU
3.3.5 Different measurement settings
You have a number of options when taking a measurement. These are available under the [Mea-sure] tab. On the bottom center you can change the proportions of the two Scheimpflug images and the Top View and the size of the red target circular line by means of two slider bars. It is recommended that you increase the size of the Top View as is shown below (default setting).
Fig. 11 Measurement Settings
There are three choices for the resolution of the scan: Standard (15), Enhanced (30) and Custom (or user defined). It is recommended to take routine measurements in Standard mode (15 scans); this will give good results in the majority of cases.Also, the focus for the fixation target [Patient Refraction [D]] can be manually adjusted by mov-ing the slider according to the patient’s preference or entering the patient’s RX directly in Diop-ters (within the range -20.0D to +20.0D).

GALILEI G4 Operator Manual/IFU | 35© 2016 Ziemer Ophthalmic Systems AG Doc. No. CM3941-0081-03-IFU
3.4 Quick Guide to taking GALILEI measurements
This instruction sheet is provided as a separate document with the GALILEI. A reprint of the guide is shown below.
1. Position PatientAdjust table height to maximize patient’s comfort. Patient's head should be straight, positioned centrally with forehead against the headrest and chin touching the front edge of the chinrest.
6. CenterAlign the red crosshair to the 4 white dots in the top view image by rotating the joystick.
2. Adjust HeadrestAlign patient's lower lid to black marker on the headrest post. Turn the headrest to the left to measure OD and to the right to measure OS.
7. Fine AlignmentAlign the red reference line to the anterior surface of the cornea by moving the joystick forward or back-ward. The red line should not intersect the cornea, but just touch it.
3. Dim Room Lights Dim lighting in the room to prevent interfering light reflections during the capture.
8. Blink and Open WideAsk the patient to blink and keep the eye open wide.
4. Gross Alignment Enter scan mode.
a. Move the device to the OS or OD sign on the table (consider the correct position of your headrest, see 2.)
b. Using the joystick, align the measurement head so that the horizontal blue light from the slit lamp is centered on the patient's pupil.
c. Move the joystick right or left for horizontal and rotate up or down for vertical alignment. Move forward or backward to put the eye into focus.
9. Scan Press the scan button on the joystick.
5. Fixate TargetAsk patient to fixate on visible red bull's eye target.
Quick Guide to taking successful Measurements
OFF
SupportFirst contact your local service provider.Ziemer Customer Support+41 848 943 637 all countries except USA and Canada 866-708-4472 for USA and Canadawww.ziemergroup.com/services/support
Doc.-Nr. 3941-0126-03Ref. 410.931.016
GALILEI_G4_Measurement_and_Quality_Check_Guide_A4.indd 2 10.04.14 16:13

36 | GALILEI G4 Operator Manual/IFU © 2016 Ziemer Ophthalmic Systems AG Doc. No. CM3941-0081-03-IFU
(GALILEI G4 Quick Guide; page 2)The Guide is also availavle as a printable file on the GALILEI system at [C / Documents].
Check quality of Scheimpflug/ Placido ring images
A Good quality measurement: measurement is centered and cornea aligned to the red reference line
B Poor quality measurement: nose shadow, here at the bottom right, is covering the eye
C Poor quality measurement: eye lashes or lid are covering the eye
Quality Check Guide
A Good quality measurement: cornea is touching the red reference line
B Poor quality measurement: cornea is intersecting the red reference line
C Poor quality measurement: cornea is too far from the red reference line
A Head should be straight, positioned centrally with forehead against the headrest and chin touching the front edge of the chinrest. Patient is focu-sing well on the red reference target.
B Head is not positioned correctly: head is tilted, forehead is not touching the headrest, chin is not touching the front edge of the chinrest. Patient is not focusing well on the red refe-rence target. Adjust height of table and chinrest to correct your patient's position.
B C
A B C
A B
A
GALILEI_G4_Measurement_and_Quality_Check_Guide_A4.indd 3 10.04.14 16:13

GALILEI G4 Operator Manual/IFU | 37© 2016 Ziemer Ophthalmic Systems AG Doc. No. CM3941-0081-03-IFU
4 DATABASE MANAGEMENT
4.1 Patient database management
After switching the system ON, the software will open directly to the Patient Database screen*. This screen features an upper panel for viewing and working with the patients listed in the da-tabase, and a lower panel for viewing and working with the exam files that exist for the pa-tient selected in the upper panel.
Fig. 12 Patient Database screen display
upper panel
lower panel
*fictitious names were used for this database.

38 | GALILEI G4 Operator Manual/IFU © 2016 Ziemer Ophthalmic Systems AG Doc. No. CM3941-0081-03-IFU
To create a new patient in the database and before taking a first examination, enter the pa-tient’s personal data directly into the section in the upper-right corner (Fig. 13). First click on [New]. Then type in the Patient ID, Last Name, First Name, Sex and Date of birth of the patient.
To avoid having two separate patient entries for the same individual, you can search for an existing patient entry in the database. To search for a patient, use the search tool located above the list of patient names. In the field next to “Search for”, enter the Last Name, First Name or Patient ID of the patient.
Fig. 13 Patient Database screen, detail: new patient entry
Fig. 14 Patient Database screen, detail: date of birth entry
The search field can search the Patient ID, Last Name, First Name, or the Notes section. Use the Notes field to identify cases to review later; e.g. label note “review” or “Dr. X”.
A fast method to enter the date of birth is to click the calendar tool button on the right (Fig. 14). Type in the Year of birth, and then select the Month and then Day of birth. To complete the date entry, click on [Save]. The date of birth can also be entered directly as MM, DD, YYYY.

GALILEI G4 Operator Manual/IFU | 39© 2016 Ziemer Ophthalmic Systems AG Doc. No. CM3941-0081-03-IFU
To Begin an Examination. After creating a new patient or selecting an existing patient, go directly to the Scan screen by double clicking on the patient name in the database, or by single clicking the [Examine] bar.
Reviewing a Previous Examination. Directly from the database display, highlight the pa-tient in the upper panel (as shown above), then double click on a particular examination in the lower panel or single click the [Display] bar (as shown below).
Fig. 15
Fig. 16 Selecting a stored examination for reviewing
Notes and labels can be added to each patient entry and to each examination. To store a note or label an examination, highlight the individual examination on the left, click the lower [Edit] button to enter Notes or Label, then Click [Save] to store. Notes and exam labels can be edited and resaved.

40 | GALILEI G4 Operator Manual/IFU © 2016 Ziemer Ophthalmic Systems AG Doc. No. CM3941-0081-03-IFU
Fig. 17 Notes section of database screen, with example entries
In the lower right corner of the Database screen (Fig. 17), additional data obtained from the PAS-CAL dynamic contour tonometer, and planned patient treatment data for the LDV Femtosecond laser may be entered optionally.Examples of additional examination notes sections available on the Database screen are shown in Fig. 17.
4.1.1 Exporting Patient Data
There are multiple options to export patient data. The examination(s) of one patient or multiple patients can be exported directly to a hard drive, including an external USB drive or memory stick. You can specify in the drop down menu of the window where the files should be exported. Select your external USB drive. The exported files will be placed in a folder that can then be im-ported to another GALILEI for review or consultation.Each individual examination file is approximately 6 MB in size. The file is half the size when no images are included in the file (by not selecting “Images” in the export options); however, fur-ther analysis (e.g., eye metrics) of the examination images is then limited.To export all examination files of one patient, use the upper panel. Highlight the particular pa-tient, then Click [Export] under the [Patient’s personal data] section and you will export all ex-isting examinations of that patient by clicking [GALILEI to GALILEI]. The patient data can be ex-ported anonymously and / or with all images, by clicking the appropriate boxes.To export all examinations of multiple patients, use the upper panel. Hold down the [CTRL] or [SHIFT] key on the keyboard and highlight multiple patient names. Follow the export procedure above. To export one or multiple examination files of one patient, use the lower panel. Highlight the particular patient, then in the lower panel, highlight one examination (or hold [CTRL] or [SHIFT] to select multiple exams). Click [Export] under the [Examinations of Last name, First name] sec-tion and you will export the selected examination(s) of that patient by clicking [GALILEI to GAL-ILEI]. The patient data can be exported anonymously and / or with all images, by clicking the ap-propriate boxes.
Note: When there are a large number of examinations to export, the export can take some time to finish and the file size can be large.

GALILEI G4 Operator Manual/IFU | 41© 2016 Ziemer Ophthalmic Systems AG Doc. No. CM3941-0081-03-IFU
Fig. 18 Selecting patient or examination data for export
Fig. 19 Export options pop-up
In this example, one examination of the right eye (OD) taken on June 1, 2012 at 07:07 will be exported. You can select more than one patient or measurement using the [CTRL] or [SHIFT] key.After clicking [Export], the following pop-up (Fig. 19) will appear containing Export options:

42 | GALILEI G4 Operator Manual/IFU © 2016 Ziemer Ophthalmic Systems AG Doc. No. CM3941-0081-03-IFU
Fig. 20 Importing patient data
The following Additional Export Options are available:
Export anonymous data. To export the patient examinations anonymously (without identifi-able names), select the checkbox [Anonymous] before exporting (refer to Fig. 19 above). When anonymous, the exported filename “Last name, First name” will be replaced with “patient, anon-ymous.” When the patient data are imported, the “Last name, First name” in the database will be replaced with “patient, anonymous.” When this box is not checked (as shown above), the file names will appear in the exported file.
Export all maps and images. To export the patient examination maps and indices for trans-fer to another GALILEI device, select the option [GALILEI to GALILEI] before exporting. To export all individual images in addition to the maps, select [Images]. As mentioned, the file size will be larger, however all images including the Scheimpflug images and top view with Placido and pu-pil alignment can be reviewed when imported.
Any user can export files that can be imported to another GALILEI device or software.
For research purposes, numerical data (indices or maps) can be exported to a comma-sepa-rated (CSV) file. This option requires a software license. See Application manual, section 10.7 How to open an exported csv sheet for a detailed description and Application manual, section 7.1.6 [Licenses] tab: for license activation procedures.
4.1.2 Importing Patient Data
To Import GALILEI patient examination data, first connect the USB drive or memory stick con-taining the exported GALILEI examination folder(s) to the GALILEI. You can import examinations under [Patient’s personal data] for new patients using the [Import] button (1) (Fig. 20); or you can import examinations under [Examinations of patient] to import examinations to an existing pa-tient using the [Import] button (2).

GALILEI G4 Operator Manual/IFU | 43© 2016 Ziemer Ophthalmic Systems AG Doc. No. CM3941-0081-03-IFU
Locate the drive and the appropriate folder containing the zipped examination file using the drop down menu. (Note: If the main folder was compressed (zipped), you will not see the file and will have to first un-compress (unzip) the file on your external drive). You can import anonymous or named patient examinations from another GALILEI device. The anonymous patient examinations will be labeled “patient, anonymous” (as shown). Importing an anonymous examination from another clinic via the DAN – Doctor’s Advisory Network – re-quires that the examination file (.xam file) be attached. The DAN export option to attach the ex-amination file (.xam) must have been checked.
With a single click on the appropriate [Import] in the examinations panel, select the file(s) you would like to import within the pop-up (Fig. 22) that appears with the file structure of the com-puter. Then click on [Import Patients] or [Import Examination] to execute.
Fig. 21 DAN export
Fig. 22 Data import pop-up

44 | GALILEI G4 Operator Manual/IFU © 2016 Ziemer Ophthalmic Systems AG Doc. No. CM3941-0081-03-IFU
Fig. 24 Patient and measurement details
Now you can see the details (Measurement, Patient, and Measurement ID) of the specific pa-tient and the selected measurement as illustrated below (Fig. 24).
Fig. 23 About Examination pop-up
In summary, you can import a patient or a measurement using the appropriate import option un-der [patient’s personal data] or under [Examinations]. If you want to import several patients or measurements you have to select the folder where the patients or the measurements are lo-cated instead of the single file.Be aware that imports are backward compatible. However, it is not possible to import examina-tions taken with newer software into older versions of GALILEI software.
4.1.3 Patient data and measurement pop-up
At all times the patient data and measurement details of a selected patient can be viewed in a pop-up window called “About Examination” (Fig. 23). To proceed, go to the top bar of the main database screen and click [Examination] and then [About Examination].

GALILEI G4 Operator Manual/IFU | 45© 2016 Ziemer Ophthalmic Systems AG Doc. No. CM3941-0081-03-IFU
4.2 Backing up the GALILEI database
4.2.1 Backing up to a USB device
The backup is optional and it is completely up to the user to make regular backups and to man-age the USB device with the backup files on it. It is also the user’s responsibility that there is enough space left on the USB Device. This USB device can be any Windows compatible porta-ble hard disk with a USB connection that is compatible with Windows backup tools. Please check with the USB device supplier for compatibility.
Please perform a database backup immediately after any Software update.
Please note that making a backup can take a long time, therefore it is recommended that you do this backup overnight or during the weekend. If you start a backup on a new USB hard disk, you have to create a full backup as described in this chapter.
4.2.2 Patient data backup
Go on the Directory D:\ and copy the entire “Database” folder to an external hard drive
Note: We recommend that you routinely and regularly back up your database, according to the instructions in section 4.2 Backing up the GALILEI database.
Note: Please read this section in its entirety before starting a backup or a restore.

46 | GALILEI G4 Operator Manual/IFU © 2016 Ziemer Ophthalmic Systems AG Doc. No. CM3941-0081-03-IFU
4.2.3 Restore Patient data
Paste the stored “Database” folder into the directory D:\.
4.2.4 Backing up to a network drive
Alternatively to backing up to a USB device, a backup may also be performed to a network drive. The procedure is similar to the USB backup procedure described in section 4.2.1 Backing up to a USB device above. Simply choose a network drive instead of the USB drive to back up to.
Depending on the host network, it may be necessary to map the network drive in admin mode first. Also, the network administrator may have to set up a network drive for GALILEI backups first.
Mapping a network drive:
1. Click “Windows”, right-click “My Computer” and choose “Map Network Drive”
2. Choose a letter for the network drive and enter the path or browse it on the network

GALILEI G4 Operator Manual/IFU | 47© 2016 Ziemer Ophthalmic Systems AG Doc. No. CM3941-0081-03-IFU
3. Now the network drive can be chosen in the backup routine. It may be necessary to enter the network password.
4. Restoring the backup to the GALILEI works the same way as from a USB drive, as described in section 4.2.1 Backing up to a USB device above.
4.2.5 Data Export / Import from Vintage GALILEI to G4 systems
Please contact Ziemer Customer Support to obtain instructions on backup and transfer of data to your new GALILEI G4 system.

48 | GALILEI G4 Operator Manual/IFU © 2016 Ziemer Ophthalmic Systems AG Doc. No. CM3941-0081-03-IFU

GALILEI G4 Operator Manual/IFU | 49© 2016 Ziemer Ophthalmic Systems AG Doc. No. CM3941-0081-03-IFU
5 CARE AND MAINTENANCE
5.1 Customer service information
For Customer Service information, refer to section 1.3 Maintenance and Customer Service.
5.2 Remote support
Each GALILEI is equipped with a software tool that allows remote access through the Internet so that a support engineer can resolve issues quickly and efficiently to reduce device down time.
The Remote support tool requires that the GALILEI can be connected to the Internet. An Ether-net cable plug connection is located on the side of the computer box, directly below the table. The device can be connected to a network or directly to a cable / ADSL modem.
When connected to the Internet, start the Team Viewer software. You can locate the software by left clicking on the Windows Start Menu on your GALILEI.
When the TeamViewer software is started, the pop-up displayed above will appear. Please re-cord the TeamViewer Session number that appears. You will need to communicate this number to the Service engineer. You will have to leave the device on and have the Team Viewer soft-ware running during the remote support process. The Ziemer or distributor’s service engineer will guide you through the rest of the process.

50 | GALILEI G4 Operator Manual/IFU © 2016 Ziemer Ophthalmic Systems AG Doc. No. CM3941-0081-03-IFU
5.3 Cleaning and disinfection procedures
All patient contact surfaces can be disinfected by users and operators according to the follow-ing directions and methods:
It is recommended to use a new standard chinrest paper (available from ophthalmic disposables suppliers) for every patient.
5.4 Replacement of fuses
Before removing the fuses, disconnect the system from the mains plug.
The system is equipped with two fuses of the same kind. To access the fuse holders, unplug the power cable from the system plug.
Using a screwdriver, remove the fuse holder. Remove the fuses from the holder and identify the broken fuses. Replace the broken fuses with new ones.
Fuse type: T 6.3A H
5.5 Disposal
GALILEI systems must be returned to the distributor or manufacturer for disposal.Contact customer service for further instructions.
Purpose The purpose of this procedure is to establish a consistent method by which users may clean and disinfect the patient contact surfaces as a routine operation to help reduce the potential of cross infection.
Materials required
• Disinfecting agent such as an anti-germicide or isopropyl alcohol.• Cloth or cleaning towels
Procedure • Locate the patient brow rest• Soak the cleaning cloth or towel in disinfecting agent and wipe the surfaces that come in
contact with the patient• Locate the patient chinrest• Take the cleaning cloth used in the previous step and wipe the exposed surfaces of the chin
rest.• The Placido disc is best cleaned with pure alcohol without any additives.
Frequency • Repeat this procedure following each exam.

GALILEI G4 Operator Manual/IFU | 51© 2016 Ziemer Ophthalmic Systems AG Doc. No. CM3941-0081-03-IFU
6 TECHNICAL SPECIFICATIONS
6.1 Technical data
Classification according to IEC 60601-1:
• Type of protection against electric shock Protection: Class 1• Degree of protection against electric shock: Type B Applied part• Degree of protection against damaging penetration of water: IP20
Electrical Conditions:
• Mains: 100–240 V,50…60 Hz• Power: 400 W• Fuse: 2xT6,3AH,250 V
Optical characteristics:
• Number of measurement Placido disc: 20 rings
• Measurementtime: 60imagesinlessthan1second• Number of measurement
points–Scheimpflug/Placido: upto100000measurementpoints• Displayedmapcoverage: max.1 mm• Keratometry: 25–75 D(4-5-13.5mm)• CentralCornealThickness: 250–800 µm• White-to-White: 6–14 mm• Pupillometry: 0.5–10 mm• AnteriorChamberDepth: 1.5–6.5 mm
Units of measured parameters:
• Curvature: Diopters [D]• Pachymetry,Elevation: microns[µm]• Pupil,WTW,AxialLength,
ACD,LT: millimeters[mm]
Operating conditions:
• Temperature: +15°Cto+35°C• Relativehumidity: 30%to75%nocondensation
Transport and storage conditions:
• Ambienttemperature: 0°Cto+50°C,32°Fto+122F• Relativehumidity: 10%to95%nocondensation• HalfsinusShock: 30 g,duration6 ms• HalfsinusShock,continuous: 10 g,duration6 ms• Vibrations: 10–500 Hz0.5 g/Hz

52 | GALILEI G4 Operator Manual/IFU © 2016 Ziemer Ophthalmic Systems AG Doc. No. CM3941-0081-03-IFU
Product life:
The GALILEI G4systemhasaspecifiedlifetimeof5years.Aftereveryyearofoperationor10’000measurements(whichevercomesfirst),thedevicepromptstheusertoarrangeforamain-tenanceservice.Uponsuccessfulmaintenanceandtesting,theservicetechnicianwillreleasethe system for another cycle.
Measurement unit characteristics:
• Measuringprinciple: RotationalscanofDual-Scheimpflugslitimages combined with Placido and top view images
• Observationillumination: InfraredLED810 nm• FlashOutputillumination: BlueLEDLight(UV-free)470 nm• Cameras: Three CCD Cameras• Numberofimagesperscan: 7–30
Measurement precision and in-vivo repeatability (for software V6.2.0 and higher):
The repeatability specifications quoted above are based on a clinical study of follow-ing design:
• Internalstudyof24normaleyesin12subjects,agerange26–53years(mean=38years).• Repeatability as estimated by the mean standard deviation of consecutive measurements av-
eraged over all subjects and eyes.
Abbreviations:
• SDspecified: Specifiedrepeatabilityasdefinedbythemeanstandarddeviation• SD measured: Measured repeatability as estimated by the mean standard deviation• CCT: Central corneal thickness• ACD: Anterior chamber depth• WTW: Whitetowhite• SimK: Keratometrycornealcurvatureovercentralareaofdiameter4 mm
Parameter SD specified SD measured
CCT ≤ 3.00 μm 1.2 μm
ACD ≤ 50 μm 15 μm
WTW ≤ 50 µm 16 µm
Pupillometry ≤ 50 µm 6 µm(inanartificialeye)
SimK ≤ 0.25 D 0.05 D
Angleofflattestmeridian ≤ 10°forastigmatism>0.5 D 2.9°

GALILEI G4 Operator Manual/IFU | 53© 2016 Ziemer Ophthalmic Systems AG Doc. No. CM3941-0081-03-IFU
6.2 Hardware interfaces
USB connectors are provided on the inside panel of the measurement table to connect external hard drives. A USB keyboard and a wireless mouse are provided.
Note: TheoperatoroftheGALILEIisresponsibleforthecompliancewiththestandardIEC60601-1ifsupplementaryequipmentisconnectedtotheanalogordigitalinterfacesoftheGALILEIsystem.
6.3 Manufacturer’s EMC Declaration
Electromagnetic Compatibility (EMC)
ChangesormodificationstothissystemnotexpresslyapprovedbySIScouldcauseEMCissueswiththisorotherequipment.Thissystemisdesignedandtestedtocomplywithapplicablereg-ulationsregardingEMCandneedstobeinstalledandputintoserviceaccordingtotheEMCin-formation stated in the tables below.
Guidance and manufacturer’s declaration – electromagnetic emissions
TheGALILEIisintendedforuseintheelectromagneticenvironmentspecifiedbelow.Thecus-tomerortheuseroftheGALILEIshouldassurethatitisusedinsuchanenvironment.
Emissions test Compliance Electromagnetic environment – guidance
RF emissions CISPR 11
Group 1 GALILEIusesRFenergyonlyforitsin-ternalfunction.Therefore,itsRFemis-sions are very low and are not likely to cause any interference in nearby elec-tronicequipment.
RF emissions CISPR 11
Class B GALILEIissuitableforuseinallestab-lishments other than domestic and those directly connected to the public low-voltagepowersupplynetworkthatsupplies buildings used for domestic purposes
Harmonicemissions IEC61000-3-2
Class A
Voltagefluctuations/flicker emissionsIEC61000-3-3
Complies

54 | GALILEI G4 Operator Manual/IFU © 2016 Ziemer Ophthalmic Systems AG Doc. No. CM3941-0081-03-IFU
Guidance and manufacturer’s declaration – electromagnetic immunity
GALILEIisintendedforuseintheelectromagneticenvironmentspecifiedbelow.ThecustomerortheuseroftheGALILEIshouldassurethatitisusedinsuchanenvironment.
Immunity tests IEC 60601 Test level Compliance level Electromagnetic envi-ronment – guidance
Electrostaticdischarge(ESD)IEC61000-4-2
+/-6kVcontact +/-8kVair
+/-6kVcontact +/-8kVair
Floorsshouldbewood,concrete or ceramic tile. If floorsarecoveredwithsyn-theticmaterial,therelativehumidity should be at least 30%.
Electricalfasttransient/ burstIEC61000-4-4
+/-2kVforpowersupplylines +/-1kVforinput/outputlines
+/-2kVforpowersupplylines +/-1kVforinput/outputlines
Mainspowerqualityshould be that of a typical commercial or hospital en-vironment.
SurgeIEC61000-4-5 +/-1kVdifferentialmode +/-2kVcommonmode
+/-1kVdifferentialmode +/-2kVcommonmode
Mainspowerqualityshould be that of a typical commercial or hospital en-vironment.
Voltagedips,shortinter-ruptions and voltage varia-tions on power supply input linesIEC61000-4-11
<5%UT(>95%dipinUT)for0,5cycle
40%UT(60%dipinUT)for5cycles
70%UT(30%dipinUT)for25cycles
<5%UT(>95%dipinUT)for5sec
<5%UT(>95%dipinUT)for0,5cycle
40%UT(60%dipinUT)for5cycles
70%UT(30%dipinUT)for25cycles
<5%UT(>95%dipinUT)for5sec
Mainspowerqualityshould be that of a typical commercial or hospital en-vironment.
IftheuseroftheGALILEIrequirescontinuedopera-tion during power mains in-terruptions,itisrecom-mendedthattheGALILEIbe powered from an unin-terruptible power supply or a battery.
Note: UT is the a.c. mains voltage prior to application of the test level.

GALILEI G4 Operator Manual/IFU | 55© 2016 Ziemer Ophthalmic Systems AG Doc. No. CM3941-0081-03-IFU
Guidance and manufacturer’s declaration – electromagnetic immunity
TheGALILEIisintendedforuseintheelectromagneticenvironmentspecifiedbelow.Thecus-tomerortheuseroftheGALILEIshouldassurethatitisusedinsuchanenvironment.
PortableandmobileRFcommunicationsequipmentshouldbeusednoclosertoanypartoftheGALILEI,includingcables,thantherecommendedseparationdistancecalculatedfromtheequa-tionapplicabletothefrequencyofthetransmitter.
wherePisthemaximumoutputpowerratinginthetransmitterinwatts(W)accordingtothetransmittermanufactureranddistherecommendedseparationdistanceinmeters(m).FieldstrengthsfromfixedRFtransmitters,asdeterminedbyanelectromagneticsitesurveya,shouldbelessthanthecompliancelevelineachfrequencyrangeb.
Immunity tests IEC 60601 Test level Compliance level Recommended separa-tion distance
Conducted RF IEC61000-4-6
3Vrms 150kHzto80MHz outside ISM bands
3Vrms d=1.2√P
Radiated RF IEC61000-4-3
3V/m 80MHzto2.5GHz
3V/m d=1.2√P80MHzto800MHz d=2.3√P800MHzto2,5GHz
Note: At80MHzand800MHz,thehigherfrequencyrangeapplies.
Note: Theseguidelinesmaynotapplyinallsituations.Electromagnetic propagationisaffectedbyabsorptionandreflectionfromstructures,objectsand people.
aFixedstrengthsfromfixedtransmitters,suchasbasestationsforradio(cellular/cordless)telephonesandlandmobileradios,amateurradio,AMandFMradiobroadcastandTVbroadcastcannotbepredictedtheoreticallywithaccuracy.ToaccesstheelectromagneticenvironmentduetofixedRFtransmitters,andelectromagneticsitesurveyshouldbeconsidered.Ifthemea-suredfieldstrengthinthelocationinwhichtheGALILEIisusedexceedstheapplicableRFcompliancelevelabove,theGALILEIshouldbeobservedtoverifynormaloperation.Ifabnormalperformanceisobserved,additionalmeasuresmaybenecessary,suchasreorientingorrelocatingtheGALILEI.
boverthefrequencyrange150kHzto80MHz,fieldstrengthsshouldbelessthan3V/m
Interferencemayoccurinthevicinityofequipmentmarkedwiththefollowingsymbol:

56 | GALILEI G4 Operator Manual/IFU © 2016 Ziemer Ophthalmic Systems AG Doc. No. CM3941-0081-03-IFU
Recommended separation distances
betweenportableandmobileRFcommunicationsequipmentandtheGALILEI:
TheGALILEIisintendedforuseinanelectromagneticenvironmentinwhichradiatedRFdistur-bancesarecontrolled.ThecustomerortheuseroftheGALILEIcanhelppreventelectromagnetinterference by maintaining a minimum distance between portable and mobile RF communica-tionsequipment(transmitters)andtheGALILEIasrecommendedbelow,accordingtothemax-imumoutputpowerofthecommunicationsequipment.
Fortransmittersratedatamaximumoutputpowernotlistedabove,therecommendedsepara-tiondistancedinmeters(m)canbeestimatedusingtheequationapplicabletothefrequencyofthetransmitter,wherePisthemaximumoutputpowerratingofthetransmitterinwatts(W)accordingtothehigherfrequencyrangeapplies.
Rated maximum output power of transmitter (P)
Separation distance according to frequency of transmitter m150 kHz to 80 MHz 80 MHz to 800 MHz 800 MHz to 2.5 GHz
W d=1.2*√P d=1.2*√P d=2.3*√P
0.01 0.12 0.12 0.23
0.1 0.38 0.38 0.73
1 1.2 1.2 2.3
10 3.8 3.8 7.3
100 12 12 23
Note: At80MHzand800MHz,theseparationdistanceforthehigherfre-quencyrangeapplies.
Note: Theseguidelinesmaynotapplyinallsituations.Electromagneticpro-pagationisaffectedbyabsorptionandreflectionfromstructures,objectsandpeople.

GALILEI G4 Operator Manual/IFU | 57© 2016 Ziemer Ophthalmic Systems AG Doc. No. CM3941-0081-03-IFU
Note: KPI and related indices are currently not available in the U.S.
6.4 Appendix – Application related disclaimers
PTADisclaimer(relatedtotheSanthiagoPTAReport™,anewtooltopredicttheprobabilityofpost-LASIKectasia):
IOLCalculationDisclaimers(relatedtotheIOLCalculator,theIOLEditorandtheIOLConstantDatabase):
KeratoconusIndicesDisclaimer(relatedtotheKeratoconusindicesdisplayedinthedevice):
Caution: The prediction of ectasia is controversial. PTA values can vary and ac-cordingtoseveralpublicationsthereareotherriskfactorsforpost-LASIKecta-sia.ThePTAmethodwasdevelopedbyMarconyR.Santhiago,MD,PhD(AmJOphthalmol2014;158:87-95)andisbasedoneyeswithnormalpreoperativetopography. Ziemer Ophthalmic Systems and the authors cannot be held re-sponsible for patients that develop ectasia in any case.
Caution: ThecalculationoftoricIOLpowerandaxishasnotbeenclinicallyval-idatedusingthisdevice.TheusershouldfollowIOLmanufacturerrecommen-dationsforpowercalculationsofspecifictoricIOLmodels.
Caution: Lensconstantsmaydependonthetypeofequipmentusedforaxiallengthmeasurement,individualsurgicaltechniqueandotherfactors.Foropti-malresults,theusermaywishtoadjustlensconstantsintheIOLdatabase.
Caution: Whenimportingfilesorediting/addingIOLdatamanually,allvaluesmustbeverified.AddnewentriestotheIOLdatabase,ormodifyfactoryset-tings at your own risk. Ziemer does not accept any responsibility for manually entered or altered ranges and values.
Caution: GalileiTCPisnotintendedfordirectinsertionintoexistingIOLpowerformulas,whicharedesignedforSimK.SimKshouldbeusedinIOLpowerfor-mulaedevelopedforSimK,whileTCPshouldbeusedinformulaedevelopedforTCP.
Caution: Keratoconus indices are designed to be an adjunct to a clinical exam-ination and should never be used as a sole assessment tool in the diagnosis of keratoconus.

58 | GALILEI G4 Operator Manual/IFU © 2016 Ziemer Ophthalmic Systems AG Doc. No. CM3941-0081-03-IFU
Application manualApplication manual

60 | GALILEI G4 Operator Manual/AM © 2016 Ziemer Ophthalmic Systems AG Doc. No. CM3941-0081-03-AM

GALILEI G4 Operator Manual/AM | 61© 2016 Ziemer Ophthalmic Systems AG Doc. No. CM3941-0081-03-AM
Fig. 25 Settings Panel, [Display] tab
7 SETTINGS
7.1 Global Settings
All global settings for display options and data treatment options are displayed in the Settings Panel (bottom tab on the left hand side of the GALILEI window; Fig. 25). The Settings tab has four sub-tabs: [Display], [General], [Licenses], and [Scales]. These tabs will be described in the following paragraphs. To change any of the settings of the [Display] tab, click on [Enable change of settings]. Use the [Reset] button to restore the factory (default) settings. All available options are described be-low.

62 | GALILEI G4 Operator Manual/AM © 2016 Ziemer Ophthalmic Systems AG Doc. No. CM3941-0081-03-AM
7.1.1 [Display] tab: Scan Settings
Surface Alignment: This tool is always on by default. It helps to obtain a well-centered mea-surement. In the verify panel, you will see the difference (delta) from your measurement to the aligned position. Activate “Indicate detected Purkinje dots” to indicate the four detected Pur-kinje dots in the verify screen.
7.1.2 [Display] tab: Display settings
In the column “Display Settings”, all available GALILEI reports are listed. To avoid unwanted complexity, you may deselect any of the report types that you will most likely never use (they can be re-activated at any time).The items “MapX4 1” through “MapX4 5” are reserved for custom reports created by the user in a separate profile. If customer reports have been defined, they will appear in this position with their given names.
By clicking one of the radio buttons, the user may specify which report shall be displayed first upon completed data processing. With the option “don’t switch after measurement”, the report last used will be displayed after a measurement.

GALILEI G4 Operator Manual/AM | 63© 2016 Ziemer Ophthalmic Systems AG Doc. No. CM3941-0081-03-AM
7.1.3 [Display] tab: Map Settings
If tagging is activated, map data obtained by extrapolation will be marked (shaded with black dots) on all displayed and printed maps. This feature may be turned on or off:
a) Do not tag extrapolated data (tagging deactivated)b) Tag extrapolated data (tagging activated by default)
Fig. 26 Tagged extrapolated data
Note: When extrapolated data is not tagged, this does not mean that data has not been extrapolated in the map. This setting option is only to make extrapolated data visible as such.
7.1.4 [Display] tab: Index Settings
Under Index Settings you can choose your preferred option for the anterior segment length ASL, anterior chamber depth (ACD / AQD) and total corneal power (TCP). Refer to section 8.1 Ante-rior Chamber dimensions and 8.5 Total Corneal Power (TCP) (ray-traced) in this document for de-tailed information.

64 | GALILEI G4 Operator Manual/AM © 2016 Ziemer Ophthalmic Systems AG Doc. No. CM3941-0081-03-AM
7.1.5 [General] tab:
Under the [General] tab, some general options may be specified (Fig. 27), specifying the appear-ance of printed reports and the storage of raw data:
Fig. 27 Settings Panel, [General] tab
Define Logo on printouts: You can customize your printed reports by adding your institution’s logo in the [Profile] tab. For use in the GALILEI, a jpg or gif file of approximately 100 x 150 pix-els is recommended. Simply upload your logo by clicking on [Download] and then navigating to the location of the desired file. The logo image will then be displayed here and on each printed report.For more information on how to create your personalized layout of maps and reports, please go to section 9.1 Customizing the Layout of Results.
Ziemer Support Data: Support data is raw data that normally is discarded; however in extraor-dinary circumstances (e.g. for troubleshooting purposes by Ziemer Customer Service) it might be necessary to save them. There are three settings: [Save_NONE] will result in none of the raw data being kept. [Save_LAST_100] is the default setting where the raw data of the last 100 measurements with insufficient quality are kept and any older raw data is automatically overwritten. The last setting is [Save_ALL]. This setting should only be selected when instructed to do so by a Ziemer service engineer.
Note: Disk space can run out rapidly when [Save_ALL] is selected. It is there-fore important to only select this check box after the explicit instructions to do so by Ziemer Customer Service.

GALILEI G4 Operator Manual/AM | 65© 2016 Ziemer Ophthalmic Systems AG Doc. No. CM3941-0081-03-AM
7.1.6 [Licenses] tab:
7.1.6.1 Types of Software Licenses
Certain features and functionalities of GALILEI software require a special license to be accessed and used. Some of these licenses are free, while some others may require a license fee to be purchased before they can be activated. Available licensable modules are described in sec-tion 10 Optional Software Modules. License keys are requested from, and issued and activated by Ziemer Customer Support or by authorized distributors. With the “Advanced” configuration of the GALILEI G4, all current licenses, with the exception of the Santhiago PTA Report module (sections 10.1.4 Santhiago PTA (Percent Tissue Altered) Report™ and 9.5.5 Santhiago PTA Re-port™), are pre-installed and activated.
7.1.6.2 Obtaining a license
Each GALILEI has a unique License Request Number. The user (or the distributor) must obtain this number and submit it to Ziemer Customer Support with the request to be issued a License Key.
Proceed as follows:
• From the GALILEI software, read and copy the license request number in the [Settings] panel, select [Licenses] and copy the License Request Number that will be displayed.
• Contact Customer Support, requesting a License Key for one or several components, and men-tion the License Request Number and the Serial Number of your device (located on a sticker on the table).
• As directed by Customer Support, initiate a purchase order for the desired items, and issue payment.
• Customer Support will generate a License Key and send it to you by e-mail upon receipt of payment.
Fig. 28 License request procedure
66 | GALILEI G4 Operator Manual/AM © 2016 Ziemer Ophthalmic Systems AG Doc. No. CM3941-0081-03-AM
7.1.6.3 Activating a purchased License
With the specific License Key provided by Customer Service, the requested software package can now be activated on your GALILEI. To activate, go to the [Settings] and then [Licenses] tabs. Click on [Add new license key] and enter the License Key character sequence in the pop-up win-dow. The requested modules are now activated, and the corresponding functionalities will be active.
7.1.7 [Scales] tab:
This section provides information for creating your own custom color scales and step sizes. Once a new color scale is created it can be selected like the other types of color scales as described in section 9.1 Customizing the Layout of Results.
Fig. 29 Creating a custom scale (step 1)
To create your custom scale, first click on [New]; then click on [Create].Click on the dropdown list to select the [Associated Map] for your color scale. Next, type in the preferred reference value and the color scale step size. The color scale setting of Default, ANSI, German or American can then be made in the corresponding Report and Profile settings (see section 9.1 Customizing the Layout of Results).
Fig. 30 Creating a custom scale (step 2)

GALILEI G4 Operator Manual/AM | 67© 2016 Ziemer Ophthalmic Systems AG Doc. No. CM3941-0081-03-AM
In order to see the effects of your selection on the scale on the right hand side, select [inverse scale] twice if you want normal scale order, or once if you want inverse scales. Final step is to give your custom scale a short name [Scale name] and click on [Save]. The saved color scale is now visible in the list on the left hand side.
Note: A new scale will not be available until a new examination is reloaded from the database.
An example: go to [Settings] and click on [create scale]. Choose [Pachymetry]. Set the reference value (that corresponds to the 2nd green going down) to 560 and set the step size to 20. Save the setting under a filename of your choice. Open an examination from the database. Select [Map × 1 report] and then [Pa-chymetry map]. Next right-click on the color scale, select [ANSI] and click on [inverse] once. You will see that the 500-micron level is indeed in the 2nd yel-low.

68 | GALILEI G4 Operator Manual/AM © 2016 Ziemer Ophthalmic Systems AG Doc. No. CM3941-0081-03-AM

GALILEI G4 Operator Manual/AM | 69© 2016 Ziemer Ophthalmic Systems AG Doc. No. CM3941-0081-03-AM
8 GLOSSARY
8.1 Anterior Chamber dimensions
Dimensions of the Anterior Chamber AC are defined by several parameters, namely Anterior Segment Length ASL, Anterior Chamber Depth ACD and Aqueous Depth AQD, Anterior Cham-ber Volume ACV, and Anterior Chamber angle ACA. The definitions of these parameters are de-tailed below.
ASLendo is the central distance between the posterior surface of the cornea (endothelium) and the posterior surface of the lens. The direction of the distance measurement is normal to the lens surface. The distance is averaged over all measured Scheimpflug scans, which have been corrected for optical effects.
ASLepi is the central distance between the anterior surface of the cornea (epithelium) and the posterior surface of the lens. The direction of the distance measurement is normal to the lens surface. The distance is averaged over all measured Scheimpflug scans, which have been cor-rected for optical effects.
GALILEI software measures and displays either ASLendo or ASLepi depending on user prefer-ence. Set your preference in the Global Settings screen (section 7.1 Global Settings).
Note: ASLepi can only be measured with a dilated pupil.
Fig. 31 Definitions of Anterior Chamber dimension indices; (a) length and depth.
AL Axial Length (not measured by GALILEI)
ASLepi Anterior Segment Length from epithelium to posterior lens surface
ASLendo Anterior Segment Length from endothelium to posterior lens surface
ACD Anterior Chamber Depth from epithelium to anterior lens sur-face
AQD Aqueous Depth from endothe-lium to anterior lens surface
CCT Central Corneal Thickness
ASLepi
= ASLendo
+ CCT

70 | GALILEI G4 Operator Manual/AM © 2016 Ziemer Ophthalmic Systems AG Doc. No. CM3941-0081-03-AM
ACD is the distance between the crystalline lens and the anterior cornea (epithelium). The av-erage anterior chamber depth is measured along the central normal line between the outer iris endpoints. The displayed value is the average of valid measurements for all Scheimpflug im-ages.
AQD is the distance between the crystalline lens and the posterior cornea (endothelium). The average anterior chamber depth is measured along the central normal line between the outer iris endpoints. The displayed value is the average of valid measurements for all Scheimpflug im-ages.
ACD = AQD + CCT
GALILEI software measures and displays either ACD or AQD depending on user preference. Set your preference in the Global Settings screen (section 7.1 Global Settings).
Note: The IOL Calculator / Selector performs all calculations with the value ACD.
ACV is the volume of the anterior chamber, defined by the posterior surface of the cornea (ap-proximated by a circular fit, along each Scheimpflug segment, to the detected posterior edges) and the anterior edge of the iris (approximated by a circular fit to the detected edges).
Fig. 32 Definitions of Anterior Chamber dimension indices; (b) volume and angle.
ACV Anterior Chamber VolumeRc Radius of circular fit to posterior
cornea surface (green circle seg-ment)
Ri Radius of circular fit to anterior iris border (red circle segment)
ACA Anterior Chamber Angle (angle of intersection between green and red circle segments); equal to angle between Rc and Ri)
ACA is the angle formed by the posterior surface of the cornea and the anterior edge of the iris at the intersection point of the two lines.
For details on the methods of computation for ACV and ACA, see section 8.10 How does GALI-LEI calculate Anterior Chamber Angle and Volume?.

GALILEI G4 Operator Manual/AM | 71© 2016 Ziemer Ophthalmic Systems AG Doc. No. CM3941-0081-03-AM
Note: Axial curvature is sometimes named sagittal. Instantaneous is also known as tangential.
8.2 Axial vs. instantaneous curvature
Curvature is mathematically defined as the rate of change of the tangent vector to the curve with respect to the arc length of the curve.
Arc length Tangent Vector
K = curvaturex,y = 2D plane of the curve
I1
C1
A1
A2C2
I2
Reference Axis
C1 and C2 are the centers of curvature of the respective points where the red lines intersect with the curve.Axial curvature is calculated using the axial length that runs perpendicular from the intersec-tion point I to the reference axis. Axial curvature is therefore dependent on the position of the reference axis. Instantaneous curvature is calculated using the actual radius of the curvature at intersection point I. Axial curvature gives a more global description of shape and will underestimate areas of rela-tive high curvature (I
1) and overestimate areas of relative lower curvature (I
2).
Instantaneous curvature can give a more detailed description of local curvature. However, small features can appear exaggerated, and the map may appear more “noisy”.
K =d
2y
dx
2
[1 + ( dydx
2]32

72 | GALILEI G4 Operator Manual/AM © 2016 Ziemer Ophthalmic Systems AG Doc. No. CM3941-0081-03-AM
8.3 Curvature vs. power
The direct correlation between corneal curvature and power with which clinicians are familiar is not valid in the peripheral regions measured by topographic devices. Topographic devices measure curvature, which should not be interpreted as corneal power except in the central re-gion1.
Construction for specifying refractive power. For an off-axis ray at height y, the focal length f’ is calculated from ray-tracing using Snell’s Law. The distance z represents the corneal sagittal depth.
For each point on the Total Corneal Power map the angle of incidence is calculated relative to the anterior surface normal for incoming parallel rays. The angle of refraction is calculated us-ing Snell’s law with ηair =1.0 and ηcornea =1.376
This angle of refraction is used to determine the nonparallel direction of incoming rays relative to the posterior surface normal and is used to calculate the angle of incidence for the posterior surface. A new angle of refraction is calculated for the posterior surface using Snell’s law with ηcornea =1.376 and ηaqueous =1.336.
This final angle of refraction is used to calculate the intersection of the ray along the (0,0) axis. This is the resultant focal length that is used to determine Total Corneal Power (cf. section 8.5 Total Corneal Power (TCP) (ray-traced)) for that point on the map, relative to the corneal first sur-face.
Take note that you cannot take the sum of the central anterior K value (SimK * 376 / 337.5) and the central posterior K value to calculate the central total corneal power: SimK approximates the posterior cornea based on Gullstrand’s eye model, while Total Corneal Power uses the ex-act pachymetry and posterior surface to ray-trace through the entire cornea. SimK (anterior) and K (posterior) are “powers” in the center assuming parallel rays are coming from infinity. After ray-tracing through the anterior surface, the rays are not parallel for the posterior surface. They have been refracted by the anterior surface. Also, the axes for SimK (anterior) steep and K (pos-terior) steep may be different.
z
yF'
f'
1 Roberts C. The accuracy of “power” maps to display curvature data in corneal topography systems. Invest Ophthalmol Vis Sci. 1994; 35:3525-3532.

GALILEI G4 Operator Manual/AM | 73© 2016 Ziemer Ophthalmic Systems AG Doc. No. CM3941-0081-03-AM
8.4 Ray Tracing
Light rays are refracted while passing the border between two different media. Accurate scal-ing of the apparent image can be challenging as a result. Therefore, to ensure accurate manual measure-ments of Scheimpflug images, Anterior Chamber ray-tracing is required to take into account the refraction due to the anterior and posterior corneal surfaces and pachymetry of the cornea.
Ray tracing is a method of modeling the power of a lens by tracing incident parallel rays of light through an optical system, e.g. the cornea. Ray tracing considers the shape of the cornea and the difference in indices of refraction at each surface, which affect how the rays of light are re-fracted (and equates to the total power of the cornea).
The figure below illustrates how the incident rays of light are refracted through the cornea.
η1 Index of refraction (air): ηair = 1.0η2 Index of refraction (cornea): ηcornea = 1.376η3 Index of refraction (aqueous): ηaqueous = 1.336

74 | GALILEI G4 Operator Manual/AM © 2016 Ziemer Ophthalmic Systems AG Doc. No. CM3941-0081-03-AM
8.5 Total Corneal Power (TCP) (ray-traced)
8.5.1 Using Total Corneal Power
This description is intended to provide a theoretical and functional explanation of Total Corneal Power, referred to as “TCP”. It describes how Total Corneal Power is calculated and how TCP relates to other corneal power maps and values, such as SimK.
Note: Software version 6.0 offers a new TCPIOL that is different from TCP values in earlier software versions. Since different definitions for TCP are in use among the user community, GALILEI software allows for the preferred defini-tion to be set in the Global Settings screen. Confirm that you are using the cor-rect TCP for your purpose.
Caution: GALILEI TCP is not intended for direct insertion into existing IOL power formulas, which are designed for SimK. Refer to sections 8.5.3 Relation-ship to SimK and other calculations of corneal power and 8.5.4 Using GALILEI Total Corneal Power. SimK should be used in IOL power formulae developed for SimK, while TCP should be used in formulae developed for TCP.
TCP1 (used in v5.2.0 and previous software versions): is calculated using the corneal index of refraction (ηcornea=1.376). To determine the focal length, the defined reference plane is the ante-rior corneal surface. TCP2 (added in version v5.2.1): is calculated using the aqueous index of refraction (ηaqueous = 1.336). To determine the focal length, the defined reference plane is also the anterior corneal surface. TCPIOL (new in v6.0 software): is calculated using the aqueous index of refraction (ηaqueous = 1.336). To determine the focal length, the defined reference plane is the posterior corneal surface.

GALILEI G4 Operator Manual/AM | 75© 2016 Ziemer Ophthalmic Systems AG Doc. No. CM3941-0081-03-AM
8.5.2 Definition of Total Corneal Power
The total corneal power (TCP) is the actual power of the cornea and includes both the central and peripheral region of the cornea, as well as the anterior and posterior surfaces. The TCP in-dices and map are calculated by tracking the path of incident rays of light through the 3-dimen-sional (3-D) shape of the cornea using ray tracing (see section 8.4 Ray Tracing).For the cornea, its 3-D shape is defined by the anterior surface, the corneal thickness (pachym-etry), and the posterior surface from limbus to limbus. To calculate the total corneal power, we consider the actual indices of refractions (η) of each medium within the optical system, which are air (η=1), cornea (η=1.376) and the aqueous η=1.336). TCP is calculated by the formula
TCP = η / f
where f is the focal length relative to a defined reference plane and η is the index of refraction. The focal length is the distance from a defined reference plane to where the ray intersects the central axis.Mean TCP, as displayed in the indices section, is the arithmetic average of the steep and flat axis (TCP steep / flat).Flat TCP and Steep TCP are calculated from the pair of meridians 90° apart with the greatest difference in total corneal power, from 0.5 to 2.0 mm radius, similar to flat and steep SimK.
8.5.3 Relationship to SimK and other calculations of corneal power
SimK, or the central anterior power, is the approximated power of the cornea based on the flat and steep meridians of the anterior axial curvature and is limited to the central region of the cornea. The anterior refractive power is calculated by assuming a single refracting surface. TCPIOL and SimK are both referenced to the posterior corneal surface. SimK power is calculated using the keratometric index of refraction (η=1.3375) and a constant corneal thickness of 500 microns since it is based on anterior surface curvature data only. TCPIOL calculates the corneal refractive power using true corneal pachymetry data.
In the central region of the corneal topography, the power is directly proportional to the curva-ture. If the curvature increases, the power increases as well, and vice versa. The dioptric value for any given point in this central region can be approximated as
D = (ηk − 1) / R
where R is the instantaneous radius of curvature in meters, 1 is the index of refraction of air, and ηk is the keratometric index (ηk =1.3375), which is a modified index of refraction, and not the index of refraction of the cornea. The keratometric index attempts to model the whole cor-nea as a single refractive surface taking into account the negative power of the posterior sur-face by assuming a specific relationship between the posterior and anterior curvatures. SimK is limited to the central region where the small-angle approximation is valid (also known as the paraxial assumption).
In paracentral and peripheral regions this relation is no longer valid and the corneal power is no longer proportional to the curvature. This is caused by the fact that the angle of incidence of in-coming light rays is no longer small, and thus the small angle approximation is no longer valid.

76 | GALILEI G4 Operator Manual/AM © 2016 Ziemer Ophthalmic Systems AG Doc. No. CM3941-0081-03-AM
Caution: GALILEI TCP is not intended for direct insertion into existing IOL power formulas, which are designed for SimK. Refer to section 8.5.5 Related References. SimK should be used in IOL power formulae developed for SimK, while TCP should be used in formulae developed for TCP.
8.5.4 Using GALILEI Total Corneal Power
For eyes with prior refractive surgery, total corneal power takes into account the refractive ef-fect of the difference in curvatures between the anterior and posterior surfaces. The ASCRS website (http://iol.ascrs.org) offers a formula to calculate the post-refractive IOL power using GALILEI Total Corneal Power. The average of the total corneal power can be calculated over any zone. The ASCRS formula was developed for the value of the average central TCP, defined as the central 0- to 4-mm zone and specific software version (Version 5.2.1 or later / Version 5.2 or earlier). Refer to the definitions of TCP1, TCP2, and TCPIOL in section 8.5.1 Using Total Corneal Power.
For normal or non-post-refractive corneas, the GALILEI SimK values can be used in standard IOL formulae that were developed based on regression analyses of SimK data.
The absolute power associated with TCP is a matter of convention and choice of reference plane and index of refraction. TCP and SimK’s use different reference planes and indices of refraction in their models.
In terms of the reference plane, SimK is referenced to the posterior corneal surface, based on the Gullstrand Eye Model with: anterior radius of curvature = 7.7 mm, posterior radius of curva-ture = 6.8 mm, and pachymetry = 0.5 mm. This is the source of the derivation of the keratomet-ric index of refraction, ηk =1.3375, to model the eye as a single refracting surface. The kerato-metric index is based on the dimensions of this model. On the other hand, the Gaussian equivalent power (GEP, used by other devices) formula for a thick lens, is referenced to the first principal plane, which is an optics construction, so it is not easy to use it in anterior segment measurements. It would require an additional calculation to determine the proper location. Ziemer has chosen to designate the posterior surface of the cornea as the reference plane for TCPIOL.
Current data show that there are differences between SimK’s and both GEP and TCP, when ad-justed to the posterior surface for comparison, referred to as adjGEP and adjTCP, respectively. The difference between either TCP or GEP, and SimK’s depends on how much an individual eye deviates from Gullstrand’s dimensions. After refractive surgery, the deviation is greater and the influence on TCP is expected to be greater. Studies are underway to quantify this.
8.5.5 Related References
Wang, Li, Ashraf Mahmoud, Betty Anderson, Douglas Koch, Cynthia Roberts. Total corneal power estimation: Ray tracing method vs. Gaussian optics formula. Invest. Ophthalmol & Vis. Sci., No-vember 2010, http://www.iovs.org.The ASCRS website to Calculate IOL Power in Eyes with Prior Refractive Surgery (http://iol.as-crs.org)

GALILEI G4 Operator Manual/AM | 77© 2016 Ziemer Ophthalmic Systems AG Doc. No. CM3941-0081-03-AM
8.6 Keratoconus Probability
GALILEI uses two indices to aid the user in assessing Keratoconus probability: the Keratoconus Prediction Index KPI and associated Probability of Keratoconus (Kprob), and the Cone Location and Magnitude Index CLMI and associated Percent Probability of Keratoconus PPK.
8.6.1 Keratoconus Prediction Index (KPI)
The keratoconus prediction index is a compilation index of DSI, OSI, CSI, SAI, SimK1, SimK2, IAI, and AA, based on the anterior axial curvature map. It is simulated on the GALILEI as a per-cent probability based on a 100-point scale. The mathematical formula (according to Maeda et al.1) for the simulated KPI, using simulated component indices, is described below:
KPI = 4.62*[0.30 + 0.01 (-41.23 – 0.15*DSI + 1.18*OSI + 1.49*CSI + 4.13*SAI – 0.56*SimKs + 1.08*SimKf – 3.74*IAI + 0.10*AA)] – 60.25
8.6.2 Keratoconus Probability Indicator (Kprob)
The Keratoconus Probability (Kprob) is the probability of Keratoconus associated with KPI. It as-sists the user in interpreting KPI. Kprob is the probability that a keratoconic pattern was cor-rectly detected, based on anterior surface axial curvature. The cut-off range was determined from GALILEI data of normal and keratoconic subjects. The plot shown below is useful when interpreting GALILEI KPI and Kprob. Use this graph to com-pare where the patient’s KPI and Kprob values fall along the plot of normal and keratoconus pa-tients from the validation study (described below). The steep region between these two groups indicates the more ambiguous keratoconus suspect cases.
8.6.3 KPI / Kprob Facts
• KPI, Keratoconus Prediction Index, is based on anterior axial curvature (range 0 to 100 %).• Kprob, Probability of Keratoconus, (range 0 to 100 %), associated with KPI and based on one
GALILEI dataset of keratoconus and normal cases.• KPI was validated using GALILEI-specific data in v5.2 and a GALILEI-specific Kprob was added.• Kprob has an accuracy of 94.4 %. • Kprob has a maximum specificity / sensitivity of 95.5 % / 92.7 % to identify keratoconic eyes.• Kprob has a negative predictive value of 95.5 % to identify normal, non-keratoconus eyes.• Eyes with low KPI and low Kprob may still be keratoconic (based on the current dataset).• If a different data set is used, or if poor quality data are used, this probability function may
change.
Note: KPI and related indices are currently not available in the U.S.
Caution: Keratoconus indices are designed to be an adjunct to a clinical exam-ination, and should never be used as a sole assessment tool in the diagnosis of Keratoconus.

78 | GALILEI G4 Operator Manual/AM © 2016 Ziemer Ophthalmic Systems AG Doc. No. CM3941-0081-03-AM
8.6.4 Clinical Validation for KPI Analysis
The Keratoconus Prediction Index (KPI) was originally developed on a different Placido-based topography device2. Therefore, an internal study was conducted to validate the KPI index using data acquired with the GALILEI (software version 5.2).Three exams of the right eyes of 41 Keratoconic (KCN) subjects, and 67 Normal (NRM) subjects were acquired on the GALILEI. The KPI values were recorded from the GALILEI and the 3 values were averaged for each subject to produce a mean KPI. Mean KPI data from NRM and KCN groups were analyzed using a logistic regression to separate groups, including a sensitivity and specificity analysis.Sensitivity is an indication of the correct classification of KCN subjects and specificity is an in-dication of the correct classification of normal subjects. The classification table is given below, and shows the probability level we have chosen (0.3) to maximize sensitivity (92.7 %) without degrading specificity (95.5 %) too much. Note that this is a subjective determination. If you wish 100 % specificity, so that no KCN subjects are missed, you have 0 % sensitivity, since all nor-mal subjects would also be included.
The logistic plot of KPI and Kprob (Probability) for the validation data set is shown below, plot-ting KPI and Kprob between the KCN (keratoconus) and NRM (normal) groups. Note the 3 red X marks, denoting KCN, all below a KPI value of 10. Use this plot to compare the KPI and Kprob of your patient. The suspect reason is along the part of the curve with the steepest slope.
Correct Incorrect Percentages
Prob. Level
Event Non-Event Event Non-Event Correct Sensitivity Specificity False Pos
False Neg
0.000 41 0 67 0 38.0 100.0 0.0 62.0 .
0.100 38 58 9 3 88.9 92.7 86.6 19.1 4.9
0.200 38 60 7 3 90.7 92.7 89.6 15.6 4.8
0.300 38 64 3 3 94.4 92.7 95.5 7.3 4.5
0.400 37 66 1 4 95.4 90.2 98.5 2.6 5.7
0.500 37 66 1 4 95.4 90.2 98.5 2.6 5.7
0.600 37 67 0 4 96.3 90.2 100.0 0.0 5.6
0.700 37 67 0 4 96.3 90.2 100.0 0.0 5.6
0.800 36 67 0 5 95.4 87.8 100.0 0.0 6.9
0.900 33 67 0 8 92.6 80.5 100.0 0.0 10.7
1.000 0 67 0 41 62.0 0.0 100.0 0.0 38.0
Table 1 KPI Classification Table
2 Maeda N, Klyce SD, Smolek MK, Thompson HW. Automated keratoconus screening with corneal topography analysis. Invest Ophthalmol Vis Sci 1994;35:2749 – 57.

GALILEI G4 Operator Manual/AM | 79© 2016 Ziemer Ophthalmic Systems AG Doc. No. CM3941-0081-03-AM
Fig. 33 Logistic plot of KPI and Kprob
Fig. 34 Graphic showing CLMI index search routine
8.6.5 Cone Location and magnitude Index CLMI
The Cone Location and Magnitude Index (CLMI) is an index that supports detecting the presence or the absence of a keratoconic pattern.3, 4, 5
The Cone Location and Magnitude Index was implemented using The Ohio State University Cor-neal Topography Tool, which is a software tool for the processing and display of topographic data. Please refer to section 9.5.2.1.2 Cone Location Magnitude Index (CLMI) for a more detailed description of the search routine of this index.
3 Mahmoud AM, Roberts CJ, Lembach RG, Twa MD, Herderick EE, McMahon TT and the CLEK Study Group. CLMI: The Cone Location and Magnitude Index. Cornea 2008; 27(4): 480-487.
4 Mahmoud AM, Nuñez MX, Blanco C, Koch DD, Wang L, Weikert PM, Frueh BE, Tappheimer C, Twa MD, Roberts CJ. Expanding the Cone Location and Magnitude Index to include Corneal Thickness and Posterior surface information for the detection of Keratoconus. Am J Ophthalmol 2013; 156: 1102-1111).
5 Mauger TF, Mahmoud AM, Roberts CJ, Chheda LV, Kuennen RA, Hendershot AJ, Lembach RG. Comparison of Placido, Scheimpflug and Combined Dual Scheimpflug Placido Technologies in Evaluating Anterior and Posterior CLMI, SimK’s as well as Kmax, in Keratoconus and Postrefractive Surgery Ectasia. Int J Keratoco Ectatic Corneal Dis. 2012; 1(1): 44-52.

80 | GALILEI G4 Operator Manual/AM © 2016 Ziemer Ophthalmic Systems AG Doc. No. CM3941-0081-03-AM
The CLMIaa is the CLMI applied to the anterior axial curvature map. The magnitude of the in-dex is used to determine the probability of keratoconus (PPK, described below) based on a GAL-ILEI dataset of normal and keratoconus cases. CLMIaa is specific to GALILEI anterior axial cur-vature data.The CLMI search routine finds the area-corrected average steepest 2mm diameter circle pres-ent on the axial curvature map. The CLMI circle or spot can be displayed on the corresponding map. The CLMI routine uses the data displayed on the device, thus it relies on “good quality” exam data and images. Results may be affected by very poor quality data or misaligned maps.The CLMIaa index is related to the average value within the spot, however it is not equal to the total average value within the spot.
8.6.6 Percent Probability of Keratoconus PPK (related to CLMI)
The Percent Probability of Keratoconus (PPK %) is a measure derived from the Cone Location Magnitude Index (CLMI) and denotes a probability that a patient may have keratoconus. In a ret-rospective study of 286 eyes (152 normal eyes and 134 keratoconic eyes) it was found that with a PPK of 10 %, keratoconus detection sensitivity and specificity were 87 % and 88 % respec-tively while with a PPK of 20 %, detection sensitivity and specificity were 82 % and 100 % re-spectively.
Caution: Keratoconus indices are designed to be an adjunct to a clinical exam-ination, and should never be used as a sole assessment tool in the diagnosis of keratoconus.

GALILEI G4 Operator Manual/AM | 81© 2016 Ziemer Ophthalmic Systems AG Doc. No. CM3941-0081-03-AM
8.7 Wavefront Aberrations and Equivalent Defocus
8.7.1 Wavefront Aberrations
The wavefront aberration of an eye is the optical path-length between a plane wavefront in the eye’s entrance pupil and the wavefront of light exiting the eye from a point source on the ret-ina. Because wavefront aberrations are path-length differences, their dimension is a length, nor-mally expressed in µm. On the left part of the GALILEI wavefront panel under the title “Total Corneal Wavefront”, the measured wavefront aberrations are depicted as a map, representing the path-length differences at a given position in µm.
Wavefront aberrations are also represented as a Zernike expansion, which is a weighted sum of Zernike polynomials Z mn (r,j), where the weight C mn applied to each polynomial is the corre-sponding aberration coefficient. n is the radial order and m is the angular frequency. The GALI-LEI wavefront panel depicts some important aberration coefficients for Zernike orders 2 to 8 on the upper left.

82 | GALILEI G4 Operator Manual/AM © 2016 Ziemer Ophthalmic Systems AG Doc. No. CM3941-0081-03-AM
Equivalent Defocus can be expressed in an explicit formula, because the absolute value of any Zernike coefficient may be interpreted as the root-mean-squared (RMS) wave-front error pro-duced by the corresponding aberration mode:
Ap is the pupil area and C mn some selected normalized Zernike coefficients of the wavefront er-ror. If both, the pupil radius and the RMS error are measured in mm, the value for equivalent de-focus will be in diopters [D]. The pupil area may be replaced by the area pR2 of a circle with the radius R (in mm) of the region of interest (ROI) of the Zernike expansion, which results in
In the upper part of the right wavefront panel of the GALILEI, these equivalent defocus values for some interesting Zernike coefficients are depicted. Note that on this panel the diameter of the ROI and not its radius R is depicted:
Note: “Equivalent Defocus” is different from the often used “Total (Ocular) De-focus”. The latter requires knowing the Axial Length.
8.7.2 Equivalent Defocus
The idea of an equivalent defocus has been proposed in (6) in order to help interpret the magni-tude of higher order wavefront aberrations. Equivalent defocus has been defined to as the amount of defocus required to produce the same wave-front variance as produced by one or more high-er-order Zernike modes.
Me = 4⇡p3RMS
Ap=
4⇡p3
Ap
sX
m,n
(cmn )2, [D]
Me =4p3
R2
sX
m,n
(Cmn )2, [D]
6 Thibos LN, Hong X, Bradley A, Cheng X., Statistical variation of aberration structure and image quality in a normal population of healthy eyes, J Opt Soc Am A Opt Image Sci Vis. 2002 Dec;19(12):2329-48.

GALILEI G4 Operator Manual/AM | 83© 2016 Ziemer Ophthalmic Systems AG Doc. No. CM3941-0081-03-AM
The following equations explain the indices for the equivalent defocus on this panel:
The last three indices consist of oriented Zernike polynomials and therefore it is possible to com-pute an orientation of the index. The following equations explain the computation of this angle (atan2 is a function that computes the four-quadrant inverse tangent):
Astigmatism: φA = { [atan2(C2-2,C2
2) / π+180] modulo 360 } / 2 [°]Coma: φC = { [atan2(C3
-1,C31) / π+180] modulo 360 } [°]
Trefoil: φT = { [atan2(C3-3,C3
3) / π+180] modulo 360 } / 3 [°]
8.7.3 Equivalent Defocus Maps
The definition of equivalent defocus is converted to a new form to transform the optical path-length differences of the wavefront aberrations into diopters. It takes no more the variance as argument but directly the wavefront path-difference d.
Defocus
Spherical
Astigmatism(2nd order)
Coma(3rd order)
Trefoil(3rd order)
Me =4p3
R2d, [D]
C02 Me =
4p3
R2
qC0
2
C04 Me =
4p3
R2
qC0
4
C22
C22 Me =
4p3
R2
q(C2
2 )2 + (C22 )
2
C13 C1
3 Me =4p3
R2
q(C1
3 )2 + (C13 )
2
C33 C3
3 Me =4p3
R2
q(C3
3 )2 + (C33 )
2

84 | GALILEI G4 Operator Manual/AM © 2016 Ziemer Ophthalmic Systems AG Doc. No. CM3941-0081-03-AM
Every point on the “Total Corneal Wavefront” map is transformed into diopters, using this equa-tion. The result is depicted on the right bottom part of the GALILEI wavefront panel:

GALILEI G4 Operator Manual/AM | 85© 2016 Ziemer Ophthalmic Systems AG Doc. No. CM3941-0081-03-AM
8.8 How does GALILEI treat data?
1. The scanning process acquires a series of Scheimpflug (SPF) images (meridians) and two Placido Top View images at 90 degrees apart.
2. From the SPF images the edges are detected (anterior cornea, posterior cornea, anterior lens and iris). On the Placido images the ring edges are detected. In a separate process, the lim-bus and pupil are detected from a top view image. The limbus and pupil do not influence any of the other calculations
3. From the SPF edges, height data is determined. The slope data from the Placido images are transformed into conforming height data. Now the data are ready to be merged.
4. The combined height data are then used to create a surface fit.5. From that surface fit, indices are calculated and maps are generated.
8.8.1 Significance of the red zones in the Manual Metrics tab
The red zones indicate those areas where ray tracing was not possible, and therefore where the manual measurements done by the user may be unreliable. To warn the user of this, we artifi-cially insert this red zone. How much of a particular SPF image will be covered depends on what edges have (not) been detected. Both Scheimpflug images must be of good quality for proper Dual Scheimpflug calculations. This is illustrated below.
Three typical “red zone” situations are depicted in the top row of the above figure, and in the bottom row are the corresponding SPF images from the Verify screen. Situation 1 has a minimal red zone and the edges have been detected correctly except for the bottom part of the cornea in the right SPF image (marked with a blue dot in the upper left corner) – this explains why the red zone covers more of the chamber angle on the bottom than on the top of the image.
In situation 2, the lens is unavailable for manual measurements. This is because the lens edge has not been recognized in the left (“yellow dot”) SPF image.
The third example is completely red because in the right (“blue dot”) SPF image, the corneal edges have not been found at all because of eyelashes in the Scheimpflug view.
1 2 3

86 | GALILEI G4 Operator Manual/AM © 2016 Ziemer Ophthalmic Systems AG Doc. No. CM3941-0081-03-AM
If we look at the quality percentages for Situation 3 we see that SPF is just above the limit, but that the Placido image is under the threshold level. It is recommended to discard and redo such measurements.

GALILEI G4 Operator Manual/AM | 87© 2016 Ziemer Ophthalmic Systems AG Doc. No. CM3941-0081-03-AM
The image above illustrates how eye motion during a measurement can affect the “apparent image” or elevation measured from the posterior surface (which also affects pachymetry). When the slit light is centered on the apex and when there is no motion, both left and right cameras view the same thickness (the blue or green line in the cornea). When the eye moves, the two cameras shift to the left or right side. In this configuration, the left and right viewing camera will see a different apparent thickness. Refer to the difference in separation of the blue and green line pairs depending on the angle of the camera and the direction of displacement from the center of the cornea.
Combining the two camera views using Ziemer’s patented Dual Scheimpflug solution, the sys-tematic error in the original captured image is automatically corrected by averaging the two op-posed camera images. Averaging the two images corrects the decentration error caused by eye motion or misalignment, makes the measurement of the posterior edge independent of eye mo-tion, and furnishes accurate pachymetry and elevation data.
In fact, accurate anterior surface calculations would require only one of the two SPF images, along with the Placido. But for posterior surfaces, both SPF images are needed to compensate for decentration due to eye motion. Therefore, corneal pachymetry, anterior chamber depth and posterior curvature require complete dual SPF images. Loss of one of the two means that the corresponding frame will be discarded and the Scheimpflug quality percentage will drop accord-ingly.
8.8.2 Dual Scheimpflug and accuracy
Fig. 35 Eye motion affecting the apparent image seen by a Scheimpflug camera.

88 | GALILEI G4 Operator Manual/AM © 2016 Ziemer Ophthalmic Systems AG Doc. No. CM3941-0081-03-AM
8.9 Central anterior curvature accuracy: Placido vs. SPF
Placido topography is the gold standard for central anterior curvature because it measures slope directly. To transform slopes into curvatures is straightforward. However, it can be argued that any Placido system has a hole in the middle for the top view camera. Then again, it is import-ant to realize that this hole is much smaller when projected onto the anterior surface of the cor-nea; In GALILEI’s case, the projected size of the first ring is approximately 1 mm in diameter onto the cornea.
Scheimpflug systems measure elevation data directly and the transformation of elevation data to curvature data has extreme resolution requirements. The example below has been developed by Dr. Cynthia Roberts7 with a similar approach by Dr. Steven Klyce.
The industry standard for corneal topographers dictates that they should be able to detect a 0.25 Diopter curvature difference. The image above provides a schematic simulation of two curves, with curve 2 (grey) being 0.25 D flatter than curve 1 (black). The table indicates the elevation difference between the two curves at the edge of the indicated central diameter. It shows that even at 5 mm diameter, the elevation difference is only 2.5 µm. For a diameter of 3 mm, which is analogous to keratometry measurements, the elevation difference is less than one micron. This puts unrealistically high demands on the accuracy of any SPF based system. SPF derived curvatures are more accurate in the periphery of the cornea where the elevation differences are greater. However, it is critical to accurately measure central curvature over the pupil, where rays that pass through the cornea contribute to visual acuity.
45.0 D vs. 45.25 D curves 7.5mm (R2) vs. 7.46 mm (R1)
d h
1 mm 0.1 µm
2 mm 0.4 µm
3 mm 0.9 µm
4 mm 1.6 µm
5 mm 2.5 µm
7 Roberts C: “The Resolution Necessary for Surface Height Measurements of the Cornea” Optical Society of America Annual Meeting, October 2-7, 1994.

GALILEI G4 Operator Manual/AM | 89© 2016 Ziemer Ophthalmic Systems AG Doc. No. CM3941-0081-03-AM
8.10 How does GALILEI calculate Anterior Chamber Angle and Volume?
Due to Scheimpflug imaging limitations, the sulcus cannot be precisely detected (cf. section 8.8.1 Significance of the red zones in the Manual Metrics tab). For calculations of Anterior Cham-ber Angles, the posterior corneal surface (green line) and the smoothed surface of the iris (red line), are extrapolated to the point where the two curves intersect. The angle of intersection is determined and is taken as the Anterior Chamber Angle (Mean Angle). This process is repeated for all Scheimpflug images at all available meridians.
The Anterior Chamber Volume is computed from the area between the two fitted circular lines at each meridian. If the intersection points are spaced more than 12 mm apart, then the volume calculation will be truncated at 12 mm.
The computed values for ACV and Mean Angle are displayed in the index section of the Eye Metrics display.
Fig. 36 Illustration of computation of Anterior Chamber angle and volume.

90 | GALILEI G4 Operator Manual/AM © 2016 Ziemer Ophthalmic Systems AG Doc. No. CM3941-0081-03-AM

GALILEI G4 Operator Manual/AM | 91© 2016 Ziemer Ophthalmic Systems AG Doc. No. CM3941-0081-03-AM
9 ANALYZING THE RESULTS
To help you with the analysis, the GALILEI system offers many different ways of displaying the data that has been gathered during the measurement. There are four standard reports that give all the information a cataract and / or refractive surgeon needs. For more detailed analysis there are a number of additional display options. For example, the Z-LASIK (licensable) report provides essential information needed for planning a Z-LASIK procedure with the Ziemer FEMTO LDV femtosecond laser.
• For anterior curvature maps, you can select here the refractive index used to calculate them. The choice is between the keratometric index (1.3375) and the actual refractive index of the cornea (1.376). The keratometric index (default setting) is associated with Simulated Ker-atometry and will be most commonly used. Changing the index affects also the correspond-ing indices in the list of parameters.
• [Numeric values], if selected, are displayed on the map along 3 concentric rings, plus one central value.
• �The�[thinnest�location]�is�indicated�on�the�map.�In�the�list�of�parameters,�you�can�also�find�the location and the thinnest value described.
• [Pupil] will display the pupil edge and also indicates the pupil center.• �[Axis]�will�display�an�overlay�of�the�steepest�(red)�and�the�flattest�(blue)�meridian�on�curva-
ture maps.• �With�[Avg.�d1]�and�[Avg.�d2]�you�can�define�an�inner�(d1)�and�outer�(d2)�diameter�of�the�zone�
over which the average will be calculated. This average will then be displayed on the top right hand side of the map and two circles are displayed on the map with diameters d1 and d2. For example, if you want to know the average value within the central 3 mm diameter, in the pop-up, type in 0 for d1 and 3 for d2 and hit enter.
9.1 Customizing the Layout of Results
9.1.1 Overlays
When you right-click on any map, anywhere in the GALILEI software, you are offered a number of options as overlays:
Note: The Z-LASIK Report is not avail-able in the US.

92 | GALILEI G4 Operator Manual/AM © 2016 Ziemer Ophthalmic Systems AG Doc. No. CM3941-0081-03-AM
9.1.2 Color scales
In any map with a color scale anywhere in the GALILEI software, you have a choice of four dif-ferent color scales: Default, ANSI, “German”, or “American”. Default is based on the color schemes as recommended by Drs. Klyce and Wilson. Default style has only one yellow and 6 green�steps.�ANSI�style�has�two�yellow�and�3�green�steps.�“German�style”�has�been�defined�to�resemble�graphics�conventions�used�by�a�commonly�used�Germany-made�single�Scheimpflug�device.�German�style�has�one�yellow�and�7�green�steps.�“American�style”�has�been�defined�to�resemble graphics conventions used by a commonly used US-made slit scan / Placido topogra-pher. American style has 3 yellow and only one green step. The appearance of the four system color scales is illustrated in Table 2.You�can�also�change�the�color�step�size�or�the�minimum�and�maximum�values�of�the�scale.�You�do this by placing the mouse pointer over the color scale next to the map and right clicking the mouse. This will pull up the following context menu:
It�is�possible�to�let�the�software�define�the�value�range�of�a�scale�automatically.�The�range�is�then�defined�by�the�lowest�and�highest�value�occurring�in�the�corresponding�map�data.�By�de-fining�a�minimum�and�maximum�value�you�can�fix�the�value�range�of�a�scale.�You�do�this�by�typ-ing the min and max value in the boxes in the pop up menu shown above and then pressing [EN-TER]. Only by pressing [ENTER] will the values be stored. For example, if there is an outlier in a measurement, it can lead to confusing scales, since a single (very high or very low value) can spread the automatic scale dramatically. In such cases it is recommended not to use the auto-matic�scale�but�a�customized�scale�or�Type�I�to�IV�instead.
Since�the�CGA�distribution�of�colors�is�relative�to�an�accepted,�still�normal,�borderline�value�fixed�on a yellow step of each color style it allows easier interpretation of maps. The green range is used for normal values. The yellow step is used for borderline values still within normal range. Orange and red steps are used for values outside the normal range representing risk factors for refractive�surgery.�Blue�steps�are�used�for�values�that�are�not�risk�factors�but�usually�mean�an�uncommon�or�modified�pattern.�The�table�summarizes�these�color�options.

GALILEI G4 Operator Manual/AM | 93© 2016 Ziemer Ophthalmic Systems AG Doc. No. CM3941-0081-03-AM
Table 2 Examples of the 4 system color scales
Default Scale ANSI Scale German Scale American Scale
Pachymetry maps from identical data; 4 different scales:
Elevation maps from identical data; 4 different scales:
Table 3 Standard�Profile:�Recommended�color�scales�for�various�types�of�maps�(courtesy�of�Carlos�G.�Arce,�MD,�Brazil)
MAP AnteriorAxial Curvature
AnteriorInstant.Curvature
Posterior Axial or Posterior Instant. Curvature
Pachymetry BFSBFABFTA Elevation
Wave Front
SuggestedScale
Style Default Default Default German ANSI American
Step CGA 1.0 D CGA 1.50 D CGA 0.25 D CGA�20�μm CGA�5�μm 5�μm�or 0.5 D
Trend Steeper Steeper Steeper Thinner Elevated Aberrated
Color Meaning
Red 50.00 Dto 61.00 D
51.50 Dto 68.00 D
-7.50 Dto -10.25 D
440�μmto�200�μm
>�30�μmto�80�μm
PositiveHOAOrange 48.00 D
to 49.00 D48.50 D
to 50.00 D-7.00 D
to -7.25 D480�μm�
to�460�μm20�μm
to�30�μm
Yellow 47.00 D 47.00 D -6.75 D 500�μm 10�μmto�15�μm
Green 46.00 D to 41.00 D
45.50 D to 38.00 D
- 6,50 D to -5.25 D
520�μm�to�640�μm ±�5�μm Zero
(Focused)
Blue 40.00 Dto 36.00 D
36.50 Dto 30.50 D
-5.00 Dto -4.00 D
660�μmto�800�μm
≤�-10�μmto�90�μm
NegativeHOA
Trend Flatter Flatter Flatter Thicker Depressed Aberrated

94 | GALILEI G4 Operator Manual/AM © 2016 Ziemer Ophthalmic Systems AG Doc. No. CM3941-0081-03-AM
9.1.3 Predefined and Personalized layout profile
In�the�predefined�Ziemer�Default�Profile,�the�color�scales�and�step�sizes�for�each�map�have�been�preselected as described in the previous section.
A�custom�profile�option�allows�you�to�create�your�own�profile.�To�preserve�the�preferred�look�and�feel�of�the�GALILEI�software,�the�Ziemer�Default�Profile�cannot�be�modified�or�deleted.�To�create�a�new�custom�profile,�go�to�the�menu�at�the�top�of�the�screen,�select�[Options]�then�[Pro-file]�and�finally�[New�Profile].�Name�the�new�profile�at�your�discretion.�After�creating�your�custom�profile,�change�the�layout�of�the�maps,�change�the�layout�of�your�maps�to�your�preferred�settings�and�once�this�is�done,�return�to�[Options]�and�[Profile]�and�now�click�on�[Save�Selected�Profile].�Next�time�the�GALILEI�is�started,�all�you�need�to�do�is�select�your�profile�to�display�all�your�preferred�settings�for�your�maps.
9.2 Printing the results
In the top-left corner of any screen of the GALILEI software, select [File] and [Print].
Alternatively, you can click on the print icon in the top right hand corner of each screen. This will�give�you�the�option�to�print�a�report�on�paper�using�your�printer�or�create�a�PDF�file�with�the�pre-installed PDF writer.See also section 7.1.5 [General] tab: on how to add your logo and text to any printed report.Example printouts are shown in through on the pages below (an example logo “my company” is shown at the top left as a placeholder for the user’s logo or text).

GALILEI G4 Operator Manual/AM | 95© 2016 Ziemer Ophthalmic Systems AG Doc. No. CM3941-0081-03-AM
Fig. 37 MapX1 Report printout: Pachymetry map; overlay over top view image
9.3 Generating “Screenshots”
Creating higher resolution images for presentations or publications: After launching the “MWSnap” application in your Windows Start menu, you can create screenshots at any point by pressing [Shift]+[Ctrl]+[D] for a screenshot of the full desktop or [Shift]+[Ctrl]+[A] for a se-lected�area�of�the�screen.�Save�the�screenshot�as�a�.jpg,�.tiff,�.png�etc.�format�to�a�file�for�export�to�a�USB�stick.�This�is�a�useful�tool�for�including�images�in�a�presentation�or�publication.
9.4 Application support
Sometimes�clinical�interpretation�can�be�difficult�and�in�such�circumstances�getting�a�second�opinion can be helpful. DAN stands for Doctor’s Advisory Network, created for those ambigu-ous cases. Clicking the DAN button, found in the top right-hand corner of each screen, will cre-ate�an�anonymized�screenshot�from�which�patient�name�and�details�have�been�removed.�

96 | GALILEI G4 Operator Manual/AM © 2016 Ziemer Ophthalmic Systems AG Doc. No. CM3941-0081-03-AM
This�anonymous�screenshot�can�be�attached�to�an�email,�or�saved�to�a�USB�stick.�Add�notes�and�highlight areas in the maps with the square overlays (left mouse click on the screenshot) to ex-plain your query. It is important to use your correct email address since this is the means by which your DAN will be communicated and responded to. As�a�recommended�alternative,�you�can�export�the�complete�anonymized�measurement�data�by�selecting [Attach GALILEI measurement]. This allows the recipient to review the entire measure-ment, including measurement quality, on another GALILEI system.
Fig. 38 Doctor’s Advisory Network screen
For technical support by Ziemer Customer Service.

GALILEI G4 Operator Manual/AM | 97© 2016 Ziemer Ophthalmic Systems AG Doc. No. CM3941-0081-03-AM
9.5 Standard Reports
9.5.1 Refractive Report
...37.0038.0039.0040.0041.0042.0043.0044.0045.0046.0047.0048.0049.0050.0051.0052.0053.0054.0055.0056.0057.0058.0059.0060.00
D
N
OD
T
9mm
44.0
44.6 44.4
43.5
42.3
41.8
43.5
43.9
43.2
44.143.944.2
44.2
44.7
43.6
45.0
44.1
44.041.6
42.342.1
42.0
43.2 43.8
43.7
42.9 43.8
43.1
42.7
44.8
42.8
44.7
42.4
44.5
42.3
44.3
42.9
43.6
44.4
44.4
44.243.8
44.2
43.3
9060
30
0
1240
210
2
150
3
120
4
330
300
0
-2
-1
-4
-3
1
2
3
4
-3 -2 -1 0-4 ...33.0034.0035.0036.0037.0038.0039.0040.0041.0042.0043.0044.0045.0046.0047.0048.0049.0050.0051.0052.0053.0054.0055.0056.0057.0058.0059.0060.0061.00
D
N
OD
T
9mm
43.2
43.6 43.5
42.7
44.1
43.4
45.6
43.1
45.0
46.146.046.2
46.3
43.8
45.7
43.9
46.4
43.143.4
44.344.1
43.7
45.4 44.1
44.0
44.9 44.0
45.1
44.4
44.9
44.8
44.9
44.5
44.6
44.3
44.6
43.1
43.8
44.5
44.6
44.344.1
44.4
43.5
9060
30
0
1240
210
2
150
3
120
4
330
300
0
-2
-1
-4
-3
1
2
3
4
-3 -2 -1 0-4
...-4.25-4.50-4.75-5.00-5.25-5.50-5.75-6.00-6.25-6.50-6.75-7.00-7.25-7.50-7.75-8.00-8.25-8.50-8.75-9.00-9.25-9.50-9.75
-10.00D
N
OD
T
9mm
-6.1
-6.4 -6.3
-6.0
-5.8
-5.7
-6.0
-6.1
-5.9
-6.2-6.1-6.2
-6.2
-6.3
-6.0
-6.5
-6.1
-6.2-5.7
-5.7-5.6
-5.7
-5.9 -6.1
-6.0
-5.9 -6.2
-5.9
-5.9
-6.3
-5.9
-6.3
-5.6
-6.3
-5.7
-6.1
-5.9
-6.0
-6.2
-6.2
-6.3-6.0
-6.1
-5.9
9060
30
0
1240
210
2
150
3
120
4
330
300
0
-2
-1
-4
-3
1
2
3
4
-3 -2 -1 0-4 ...-85-80-75-70-65-60-55-50-45-40-35-30-25-20-15-10
-505
1015202530354045505560657075
µm
N
OD
T
9mm
8
1 -1
2
31
49
-6
4
9
-33-23-11
-24
-5
23
-6
8
351
1635
46
34 13
11
22 -4
36
-15
-19
6
-16
9
-3
-4
8
10
3
-28
-8
-21-7
-22
4
9060
30
0
1240
210
2
150
3
120
4
330
300
0
-2
-1
-4
-3
1
2
3
4
-3 -2 -1 0-4
Muster Max 1956 Aug 25 12345
2015 Apr 23 - 13:10, 3d Scan (15/2) (Surf. Align.: On)
ODRefractive Report
SW V6.2.0beta6
Anterior Axial Curvature [D] n 1.3375
Posterior Axial Curvature [D]
Total Corneal Power IOL (Ray Traced) [D]
Post. Elevation BFS [µm] Fit Zone 8.0 mm | RadiusBFS 6.54 mm
SimK n 1.3375SimK 44.30D R 7.62mm
Flat SimK 43.70D 0° R1 7.72mmSteep SimK 44.90D 90° R2 7.52mm
Astig 1.20D 90° e² (-Q) 0.16Anterior Axial Curvature Zones n 1.3375
Central 44.32D 7.61mmMid 43.98D 7.67mm
Periph 42.76D 7.89mmKmax 45.17D 7.47mm location x,y 0.04mm 1.20mm
Posterior Axial CurvatureMean K -6.29D R 6.36mm
Flat K -6.09D 7° R1 6.57mmSteep K -6.48D 97° R2 6.17mm
Astig -0.39D 97° e² (-Q) 0.32Pachymetry
o Thinnest 495µm location x,y -0.39mm -0.31mmCentral 506µm CCT 497µm
Mid 551µmPeriph 622µm Corneal Vol. 28.87mm³
Total Corneal Power IOL (Ray Traced)Mean TCPIOL 43.35D Central 43.30D
Flat TCPIOL 42.86D 177° Mid 44.22DSteep TCPIOL 43.83D 87° Periph 44.93D
Astig 0.97D 87°Anterior Chamber and Biometry
WTW, N-T 12.41mm Mean Angle 38.9°ACV 172mm³ Kappa Dist 0.06mmAQD 3.69mm ASL endo n/a
+ Pupil Diam 3.68mm location x,y 0.06mm -0.03mmKeratoconus Probability
KPI 0.6% Kprob 2.3%CLMIaa 0.30D PPK 0.3%
Exam Label and Notes |
Fig. 39 Standard Refractive Report screen display
Fig. 40 Refractive Report printout (cf. screen display above).

98 | GALILEI G4 Operator Manual/AM © 2016 Ziemer Ophthalmic Systems AG Doc. No. CM3941-0081-03-AM
The�refractive�report�consists�of�4�fixed�maps�and�a�set�of�parameters�that�provide�a�compre-hensive overview of the cornea.
• Anterior Axial Curvature map• Corneal Pachymetry map• Anterior�Elevation�(Best�Fit�Sphere)�map• Posterior�Elevation�(Best�Fit�Sphere)�map
9.5.1.1 Refraction Parameters
Note: For your convenience, clicking on any value at the right hand side of the display will open a help text menu.
SimK parameters (Anterior Curvature) are calculated with the so-called keratometric index, which is known from Placido topographers, and is equal to 1.3375. This does not correspond to the actual index of refraction of the cornea (1.376) since it takes into account the posterior surface parameters. Parameters calculated with the keratometric index are called simulated (SimKf, SimKs …).Posterior parameters (Posterior Curvature) are calculated with the indices of refraction of the cornea (1.376) and aqueous humor (1.336).
9.5.1.1.1 Anterior Axial Curvature: SimKavg or SimK
This�parameter�(also�shown�as�“SimK”)�is�the�arithmetic�mean�or�average�of�the�steep�and�flat�axis (SimKf, SimKs) and is being calculated as:
The axis or angle of each meridian is displayed in degrees.
9.5.1.1.2 Anterior Curvature: SimKf and SimKs
SimK�steep�(SimKs)�and�SimK�flat�(SimKf)�are�calculated�from�the�pair�of�meridians�90°�apart�with the greatest difference in average power, from 0.5 to 2.0 mm distance from the center.

GALILEI G4 Operator Manual/AM | 99© 2016 Ziemer Ophthalmic Systems AG Doc. No. CM3941-0081-03-AM
This�maximizes�the�Astigmatism�parameter,�which�is�the�difference�between�SimKf�and�SimKs.�The corresponding radii of curvature values (in mm) are displayed to the right for each dioptric value.Curvatures converted into Diopters, in general, are calculated as:
η1�=�index�of�refraction�of�the�first�medium�(air,�n1=1)�η2 = index of refraction of the second medium (keratometric index for simulated anterior curva-
tures)r = Radius of Curvature in mm
9.5.1.1.3 Anterior Curvature: Astigmatism (or Astig)
As mentioned above, the astigmatism value is the difference between SimKs and SimKf.
9.5.1.1.4 Anterior Curvature: Axis
The axis parameter is the direction of the meridian of the steepest axis (SimKs), and therefore shows the orientation of the Astigmatism. The axis is displayed to the right of the astigmatism, in degrees.
9.5.1.1.5 Anterior and Posterior Curvature: Eccentricity
Eccentricity ε is reported as its square ε2. This term is one of four parameters by which the shape of a conic section can be described: Q (asphericity), p value and E (corneal shape factor) are the others. These terms are mathematically related by the following equation:
✏2 = E = 1 p = Q
Eccentricity can also be directly calculated:
R = Instantaneous Radius of CurvatureR0 = Average central Instantaneous Radius of CurvatureX = Radial position
GALILEI calculates the eccentricity ε2 (-Q) of the surface within a central diameter of 8 mm av-eraged over all meridians. This is done for the anterior and posterior surface.
✏
2 =(R ·R2
0)23 R
20
x
2

100 | GALILEI G4 Operator Manual/AM © 2016 Ziemer Ophthalmic Systems AG Doc. No. CM3941-0081-03-AM
9.5.1.1.6 Posterior Curvature: Kavg, Kf, Ks, Cylinder, Axis, Eccentricity
These parameters are basically the same as the ones from the anterior surface. The only differ-ence is that the K values are not simulated, but calculated with the real indices of refraction of the cornea and the aqueous humor.
9.5.1.1.7 Kmax and location
Kmax is the maximum curvature from the anterior axial curvature map. The value is determined from�within�the�maximum�curvature�spot�zone�defined�by�the�Cone�Location�Magnitude�Index�CLMIaa (section 9.5.2.1.2 Cone Location Magnitude Index (CLMI)). The location of Kmax is dis-played in x,y coordinates relative to the center of the map (0,0). Kmax can be used to describe the severity of Keratoconus and to monitor progression.
9.5.1.1.8 Central, Mid (paracentral) and Periph (peripheral) zones
Central�zone�diameter�=�� 0�–�4�mmParacentral�zone�diameter�=�� 4�–�7�mmPeripheral�zone�diameter�=�� 7�–�10�mm�
9.5.1.1.9 Total Corneal Power TCP
Total Corneal (Refractive) Power is calculated by ray-tracing through the anterior surface and posterior surface using Snell’s Law and the thin lens equations. The indices of refraction used are η = 1.0 for air, η = 1.376 for cornea, and η = 1.336 for aqueous. Pachymetry data is used for thicknesses�in�the�ray�tracing.�The�mean�TCP,�flat�TCP,�steep�TCP�and�astigmatism�with�axis�are�displayed. For more detail on TCP, see section 8.5 Total Corneal Power (TCP) (ray-traced).
MeanPower =Flat+ Steep
2
9.5.1.1.10 Pachymetry, thinnest and central (CCT)
The thinnest pachymetry value (in µm) and location in x,y coordinates relative to the map cen-ter are displayed. The location can be overlaid on the map as a small circle. The average cen-tral�corneal�thickness�(CCT)�is�calculated�across�the�central�2�mm�zone.
9.5.1.1.11 Corneal Volume
The corneal volume is calculated over a diameter of 8mm.
9.5.1.1.12 WTW (Limbus): Nasal-Temporal
The�limbus�is�fitted�to�a�best-fit�ellipse�in�the�reference�top�view�image.�The�maximum�length�in�horizontal�direction�of�the�ellipse�(not�the�ellipse�long�or�short�axis)�is�taken�as�the�Nasal-Tem-poral Limbus parameter white-to-white (WTW).

GALILEI G4 Operator Manual/AM | 101© 2016 Ziemer Ophthalmic Systems AG Doc. No. CM3941-0081-03-AM
9.5.1.1.13 WTW (Limbus): Superior-Inferior (on display only)
The�limbus�is�fitted�to�a�best-fit�ellipse�in�reference�to�the�top�view�image.�The�maximum�length�in vertical direction of the ellipse (not the ellipse long or short axis) is taken as the Superior-In-ferior Limbus parameter.
9.5.1.1.14 Mean Anterior Chamber Angle
The average anterior chamber angle generated from the 3D model is displayed in degrees.
9.5.1.1.15 Anterior Chamber volume ACV
The anterior chamber volume is calculated over a diameter of 12 mm.
9.5.1.1.16 Kappa Distance
The angle Kappa distance, in mm, is related to the apparent distance or displacement between the�pupil�center�and�the�center�of�the�reflection�of�the�4�Purkinje�dots�or�the�line�of�sight.
9.5.1.1.17 Pupil: Average Diameter (Pupil Diam)
The�pupil�is�fitted�to�a�best-fit�circle�in�the�reference�top�view�image.�The�average�diameter�pa-rameter is then taken from this circle.
9.5.1.1.18 Pupil Center location (x, y)
The�center�of�the�best-fit�circle�to�the�pupil�is�given�as�the�pupil�center,�relative�to�the�center�of�the map (0,0).

102 | GALILEI G4 Operator Manual/AM © 2016 Ziemer Ophthalmic Systems AG Doc. No. CM3941-0081-03-AM
9.5.2 Keratoconus Report
Fig. 41 Standard Keratoconus Report screen display
Fig. 42 Keratoconus Report printout
...32.0033.5035.0036.5038.0039.5041.0042.5044.0045.5047.0048.5050.0051.5053.0054.5056.0057.5059.0060.5062.0063.5065.0066.50
D
N
OD
T
9mm
44.2
44.6 44.5
42.7
35.0
34.0
38.3
43.9
37.4
40.439.642.2
41.4
44.3
42.1
45.0
42.2
43.932.9
35.434.8
33.7
41.6 43.1
42.7
40.1 42.6
41.0
36.1
44.5
38.1
44.6
35.4
44.5
34.9
44.3
42.3
43.5
41.6
44.1
42.541.7
41.4
42.1
9060
30
0
1240
210
2
150
3
120
4
330
300
0
-2
-1
-4
-3
1
2
3
4
-3 -2 -1 0-4 ...-85-80-75-70-65-60-55-50-45-40-35-30-25-20-15-10
-505
1015202530354045505560657075
µm
N
OD
T
9mm
1
2 2
-0
-1
8
-11
0
-9
-6-9-4
-4
-2
-7
-2
-9
-17
95
2
-4 -0
-0
2 -0
-0
7
2
7
4
9
4
9
1
1
1
-3
0
-1-4
-4
-1
9060
30
0
1240
210
2
150
3
120
4
330
300
0
-2
-1
-4
-3
1
2
3
4
-3 -2 -1 0-4
...780760740720700680660640620600580560540520500480460440420400380360340320300280260240220µm
N
OD
T
9mm
501
504 512
515
617
618
613
497
616
619617592
609
520
575
518
584
508619
638625
619
585 533
540
603 553
585
643
550
631
544
641
530
649
527
553
549
573
548
567562
570
557
9060
30
0
1240
210
2
150
3
120
4
330
300
0
-2
-1
-4
-3
1
2
3
4
-3 -2 -1 0-4 ...-85-80-75-70-65-60-55-50-45-40-35-30-25-20-15-10
-505
1015202530354045505560657075
µm
N
OD
T
9mm
2
3 2
-1
-9
-3
-8
0
-11
-14-8-13
-18
-4
-13
-3
-16
05
2617
11
-7 1
2
6 -0
4
3
3
2
4
28
6
19
3
-0
3
-7
4
-5-5
-6
-4
9060
30
0
1240
210
2
150
3
120
4
330
300
0
-2
-1
-4
-3
1
2
3
4
-3 -2 -1 0-4
Muster Max 1956 Aug 25 12345
2015 Apr 23 - 13:10, 3d Scan (15/2) (Surf. Align.: On)
ODKeratoconus Report
SW V6.2.0beta6
Anterior Instantaneous Curvature [D] n 1.3375
Corneal Pachymetry [µm]
Ant. Elevation BFTA [µm] Fit Zone 8.0 mm | RadiusBFS 7.68 mm
Post. Elevation BFTA [µm] Fit Zone 8.0 mm | RadiusBFS 6.54 mm
SimK n 1.3375SimK 44.30D R 7.62mm
Flat SimK 43.70D 0° R1 7.72mmSteep SimK 44.90D 90° R2 7.52mm
Astig 1.20D 90° e² (-Q) 0.16Anterior Instantaneous Curvature (Tangential) n 1.3375
Mean K 44.13D R 7.65mmFlat K 43.41D 2° R1 7.78mm
Steep K 44.85D 92° R2 7.53mmAstig 1.44D 92° e² (-Q) 0.16
Total Corneal Power IOL (Ray Traced)Mean TCPIOL 43.35D Central 43.30D
Flat TCPIOL 42.86D 177° Mid 44.22DSteep TCPIOL 43.83D 87° Periph 44.93D
Astig 0.97D 87°Anterior Chamber and Biometry
WTW, N-T 12.41mm Mean Angle 38.9°ACV 172mm³ Kappa Dist 0.06mmAQD 3.69mm ASL endo n/a
+ Pupil Diam 3.68mm location x,y 0.06mm -0.03mmPachymetry
o Thinnest 495µm location x,y -0.39mm -0.31mmCentral 506µm CCT 497µm
Mid 551µmPeriph 622µm Corneal Vol. 28.87mm³
Keratoconus Probability & IndicesKPI 0.6% Kprob 2.3%
CLMIaa 0.30D PPK 0.3%I-S 0.68D DSI 1.57D
SAI 0.72D OSI 0.76DSRI 0.76D CSI 0.22DIAI 0.46D ACP 44.34DAA 100.0% SDP 1.03D
Exam Label and Notes |

GALILEI G4 Operator Manual/AM | 103© 2016 Ziemer Ophthalmic Systems AG Doc. No. CM3941-0081-03-AM
9.5.2.1 Keratoconus Indices
All indices are explained on the following pages.
9.5.2.1.1 Keratoconus Prediction Index (KPI) and Keratoconus Probability (Kprob)
The keratoconus prediction index is a compilation index of DSI, OSI, CSI, SAI, SimK1, SimK2, IAI, and AA. It is simulated on the GALILEI as a percent probability based on a 100-point scale. KPI�and�its�related�indices�are�by�definition�based�on�an�analysis�of�the�anterior�surface.The Keratoconus Probability (Kprob) has been added as an additional indicator in the Keratoco-nus report. It assists the user in interpreting KPI. Kprob is the probability that a keratoconic pat-tern was correctly detected, based on anterior surface axial curvature. Kprob was calculated based on GALILEI data from a unique database of clinically diagnosed normal and Keratoconus patients.For a detailed discussion of KPI and Kprob, refer to the Glossary (section 8 Glossary).
Note: KPI and related indices are currently not available in the U.S.
Caution: Keratoconus indices are designed to be an adjunct to a clinical exam-ination, and should never be used as a sole assessment tool in the diagnosis of keratoconus.

104 | GALILEI G4 Operator Manual/AM © 2016 Ziemer Ophthalmic Systems AG Doc. No. CM3941-0081-03-AM
9.5.2.1.2 Cone Location Magnitude Index (CLMI)
The Cone Location and Magnitude Index (CLMI)8 is an index that supports detecting the pres-ence or the absence of a keratoconic pattern.The Cone Location and Magnitude Index was implemented using The Ohio State University Cor-neal Topography Tool, which is a software tool for the processing and display of topographic data.�The�Cone�Location�and�Magnitude�Index�routine�finds�the�maximum�area-weighted�aver-age in the circle (C1) present within the measured area, with the center point, P1(r,θ), of the cir-cle�being�within�the�search�zone�of�the�map,�where�r�represents�the�radial�distance�from�the�center and θ represents angular position. Next, the area-weighted average of all points outside of C1 is subtracted from the area-weighted average of all points inside of C1, resulting in mag-nitude M1. Next, circle (C2) centered at P2(r, θ�+�180�degrees)�is�analyzed.�The�area-weighted�average of all points outside of C2 is subtracted from the area-weighted average of all points inside of C2, resulting in magnitude M2. If P1 is inside of the central 2.0 mm of the map, then the�Cone�Location�and�Magnitude�Index�=�M1�– r�X�M2;�otherwise�the�Cone�Location�and�Mag-nitude�Index�=�M1�– M2.
In�simple�terms,�the�software�routine�searches�within�the�mapped�area�to�find�the�steepest-area�local region. It then compares that area to the rest of the map to determine whether or not this local maximum region is consistent with corneal asymmetry associated with keratoconus. The magnitude of the Cone Location and Magnitude Index, the radial and angular position of the center of the maximum circle (P1), and the average value inside of C1 are reported.
9.5.2.1.3 Percent Probability of Keratoconus (PPK)
The Percent Probability of Keratoconus (PPK %) is a measure derived from the Cone Location Magnitude Index (CLMI) and denotes a probability that a patient may have keratoconus. In a ret-rospective study of 286 eyes (152 normal eyes and 134 keratoconic eyes) it was found that with a�PPK�of�10�%,�keratoconus�detection�sensitivity�and�specificity�were�87�%�and�88�%�respec-tively�while�with�a�PPK�of�20�%,�detection�sensitivity�and�specificity�were�82�%�and�100�%�re-spectively.
Fig. 43 Graphic showing CLMI index search routine
8 Mahmoud A, Roberts CJ, Lembach RG, Twa MD, Herderick EE, McMahon TT, and the CLEK Study Group: The Cone Location and�Magnitude�Index.�Cornea�2008,�27(4):�480�–�487.

GALILEI G4 Operator Manual/AM | 105© 2016 Ziemer Ophthalmic Systems AG Doc. No. CM3941-0081-03-AM
i: semimeridional position; j: point location relative to center; Pi,j:�corneal�power�on�the�point�(i,j);� ΔA:�area�which�corresponds�to�power�Pi,j
9.5.2.1.9 Inferior-Superior (I S)
Inferior-Superior index is simulated as the difference between the inferior and superior average dioptric�values�approximately�3�mm�peripheral�to�the�corneal�vertex�as�defined�by�the�center�of�the map.
9.5.2.1.10 Opposite Sector Index (OSI)
The simulated opposite sector index reports the greatest difference in average area-corrected power�between�opposite�45°�sectors.
IAI = 3.19 · ln⌃j=2.40
i=1.360
n
A · |Pij (Pij+1 + Pij1)/2|o
⌃j=2.40i=1.360∆A
0.27
�
9.5.2.1.4 Area Analyzed (AA)
The simulated index is the ratio of the actual data area to the area circumscribed by a circle 4.0 mm in radius. It is a percentage value equaling 100 % if the area is completely covered with measurement values.
9.5.2.1.5 Average Central Power (ACP)
ACP is simulated as the average dioptric power of all points within the central 3 mm.
9.5.2.1.6 Central / Surround Index (CSI)
The simulated center / surround index reports the difference between the average area-corrected power between the central area (3-mm diameter) and an annulus surrounding the central area (3�–�6�mm).
9.5.2.1.7 Differential Sector Index (DSI) The simulated differential sector index reports the greatest difference in average area-corrected power�between�any�two�45°�sectors.
9.5.2.1.8 Irregular Astigmatism Index (IAI)
Irregular astigmatism index is simulated as the average summation of area-corrected dioptric variations�along�every�semi-meridian�for�the�entire�analyzed�surface�and�normalized�by�the�av-erage corneal power and number of all measured points. The mathematical description of the simulated IAI index is:
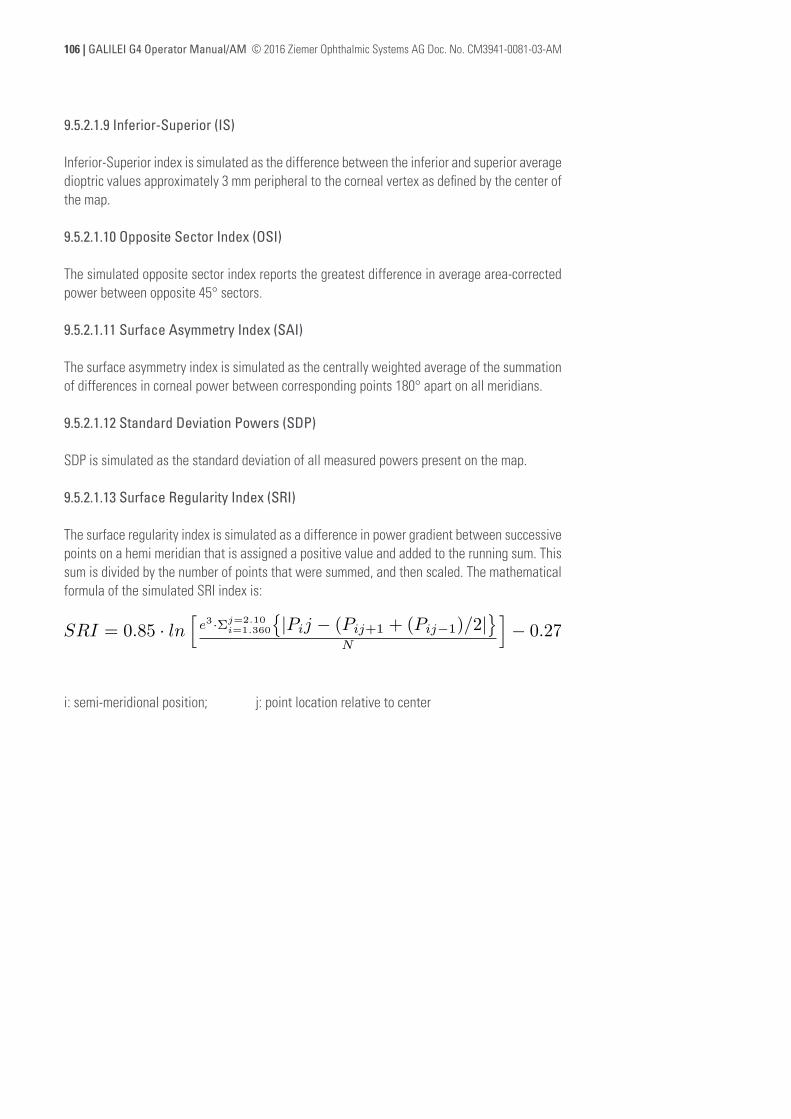
106 | GALILEI G4 Operator Manual/AM © 2016 Ziemer Ophthalmic Systems AG Doc. No. CM3941-0081-03-AM
9.5.2.1.9 Inferior-Superior (IS)
Inferior-Superior index is simulated as the difference between the inferior and superior average dioptric�values�approximately�3�mm�peripheral�to�the�corneal�vertex�as�defined�by�the�center�of�the map.
9.5.2.1.10 Opposite Sector Index (OSI)
The simulated opposite sector index reports the greatest difference in average area-corrected power�between�opposite�45°�sectors.
9.5.2.1.11 Surface Asymmetry Index (SAI)
The surface asymmetry index is simulated as the centrally weighted average of the summation of�differences�in�corneal�power�between�corresponding�points�180°�apart�on�all�meridians.
9.5.2.1.12 Standard Deviation Powers (SDP)
SDP is simulated as the standard deviation of all measured powers present on the map.
9.5.2.1.13 Surface Regularity Index (SRI)
The surface regularity index is simulated as a difference in power gradient between successive points on a hemi meridian that is assigned a positive value and added to the running sum. This sum is divided by the number of points that were summed, and then scaled. The mathematical formula of the simulated SRI index is:
i: semi-meridional position; j: point location relative to center
SRI = 0.85 · lnhe3·⌃j=2.10
i=1.360
n
|Pij (Pij+1 + (Pij1)/2|o
N
i 0.27

GALILEI G4 Operator Manual/AM | 107© 2016 Ziemer Ophthalmic Systems AG Doc. No. CM3941-0081-03-AM
9.5.3 Wavefront Report
Fig. 44 Standard Wavefront screen display, with wavefront map (µm scale) on left and pie chart on right.
Fig. 45 Wavefront Report printout, with Total Corneal Wavefront maps (left: µm; right: Diopters; cf. screen display above)
...-7.00-6.50-6.00-5.50-5.00-4.50-4.00-3.50-3.00-2.50-2.00-1.50-1.00-0.500.000.501.001.502.002.503.003.504.004.505.005.506.006.507.00µm
N
OD
T
9mm
0.56 0.860.42
0.011.41
0.661.190.76
0.04
0.03
-2.54
-1.13
-2.43
-2.57
1.581.891.20
0.07
-3.76
-0.14
-2.13
-1.89
0.13
2.111.58
-0.551.05
90
60
30
0
1
240
210
2
150
3
120
4
330
300
0
-2
-1
-4
-3
1
2
3
4
-3 -2 -1 0-4
Muster Max 1956 Aug 25 12345
2015 Apr 23 - 13:10, 3d Scan (15/2) (Surf. Align.: On)
ODWavefront Report
SW V6.2.0beta6
Total Corneal Wavefront Zernike Coefficiants [µm]
1.31µm -0.05µm -0.46µm -1.23µm
0.28µm -0.13µm -0.14µm -0.01µm -0.20µm
0.29µm 0.05µm -0.03µm 0.27µm -0.04µm -0.08µm
0.08µm 0.05µm 0.03µm 0.02µm
Total Corneal Wavefront [µm] Fit Zone 6.0 mm | RMS 1.38 µmAligned with pupil
Total Corneal Wavefront Zernike Coefficiants [D]
Defocus Astigmatism2. Order
0.36 D 0.94 D @1.2 °Coma
3. OrderTrefoil
3. Order
0.11 D @87.4 ° 0.19 D @11.1 °Sperical
-0.21 D
Other HOA5-8
Total Corneal Wavefront Pie Chart [D]
SimK n 1.3375SimK 44.30D R 7.62mm
Flat SimK 43.70D 0° R1 7.72mmSteep SimK 44.90D 90° R2 7.52mm
Astig 1.20D 90° e² (-Q) 0.16Posterior Axial Curvature
Mean K -6.29D R 6.36mmFlat K -6.09D 7° R1 6.57mm
Steep K -6.48D 97° R2 6.17mmAstig -0.39D 97° e² (-Q) 0.32
Anterior Axial Curvature Zones n 1.3375Central 44.32D 7.61mm
Mid 43.98D 7.67mmPeriph 42.76D 7.89mmKmax 45.17D 7.47mm location x,y 0.04mm 1.20mm
Total Corneal Power IOL (Ray Traced)Mean TCPIOL 43.35D Central 43.30D
Flat TCPIOL 42.86D 177° Mid 44.22DSteep TCPIOL 43.83D 87° Periph 44.93D
Astig 0.97D 87°Pachymetry
o Thinnest 495µm location x,y -0.39mm -0.31mmCentral 506µm CCT 497µm
Mid 551µmPeriph 622µm Corneal Vol. 28.87mm³
Anterior Chamber and BiometryWTW, N-T 12.41mm Mean Angle 38.9°
ACV 172mm³ Kappa Dist 0.06mmAQD 3.69mm ASL endo n/a
+ Pupil Diam 3.68mm location x,y 0.06mm -0.03mmKeratoconus Probability
KPI 0.6% Kprob 2.3%CLMIaa 0.30D PPK 0.3%
Total Corneal Wavefront AberrationsRMS Total 1.38µm 1.06D

108 | GALILEI G4 Operator Manual/AM © 2016 Ziemer Ophthalmic Systems AG Doc. No. CM3941-0081-03-AM
GALILEI displays the wavefront maps of the total cornea (front and back surfaces) in microns and Diopters. Wavefront is an increasingly important way to describe the optical condition (ab-erration) of an eye. The accepted standard in the industry is to use a Zernike Polynomial to de-scribe the surface of a wavefront. The factors of the Zernike polynomial are usually displayed in the shape of a pyramid. You see this pyramid also in GALILEI’s wavefront report. For the sec-ond,�third�and�fourth�order�in�this�pyramid�the�individual�coefficients�are�displayed;�the�orders�five�to�eight�are�displayed�in�a�summarized�fashion.�
You can either view a map of the wavefront, or select a pie chart. Pie charts provide an easy to interpret overview of the proportional representation of the aberration factors present in the measured cornea. RMS is an index that gives the root mean square of the wavefront error for the selected factors.Both�the�displayed�wavefront�maps�and�the�RMS�indices�have�been�re-calculated,�re-centered�on the pupil center (if the pupil was detected), as indicated on top of the wavefront map. All other maps in the GALILEI are centered on the system axis, unless indicated differently.

GALILEI G4 Operator Manual/AM | 109© 2016 Ziemer Ophthalmic Systems AG Doc. No. CM3941-0081-03-AM
9.5.4 IOL Power Report
Fig. 46 Standard IOL Power Report screen display
Fig. 47 IOL Power Report Printout
...37.0038.0039.0040.0041.0042.0043.0044.0045.0046.0047.0048.0049.0050.0051.0052.0053.0054.0055.0056.0057.0058.0059.0060.00
D
T
OS
N
9mm
43.2
43.4 42.9
42.9
41.9
41.6
42.4
42.9
42.2
42.342.442.4 42.2
43.3
41.7
43.0
42.2
43.041.2
40.9
40.5
40.0 40.440.3
41.7
43.0
42.741.0
42.3
41.3
39.9
43.2
40.5
43.4
40.2
43.5
40.1
43.4
42.6
42.7
42.2
43.0
42.042.5
42.3
42.7
9060
30
0
1240
210
2
150
3
120
4
330
300
0
-2
-1
-4
-3
1
2
3
4
-3 -2 -1 0-4 ...37.0038.0039.0040.0041.0042.0043.0044.0045.0046.0047.0048.0049.0050.0051.0052.0053.0054.0055.0056.0057.0058.0059.0060.00
D
T
OS
N
9mm
42.4
42.5 42.1
42.0
43.6
43.1
44.2
42.0
43.9
43.844.143.7 43.7
42.5
43.0
42.0
43.4
42.142.7
42.3
41.8
41.2 41.641.6
42.9
43.2
42.842.2
42.3
42.5
40.9
43.2
41.6
43.4
41.3
43.6
41.2
43.6
42.6
42.9
42.1
43.1
42.142.6
42.3
42.8
9060
30
0
1240
210
2
150
3
120
4
330
300
0
-2
-1
-4
-3
1
2
3
4
-3 -2 -1 0-4
...-4.25-4.50-4.75-5.00-5.25-5.50-5.75-6.00-6.25-6.50-6.75-7.00-7.25-7.50-7.75-8.00-8.25-8.50-8.75-9.00-9.25-9.50-9.75
-10.00D
T
OS
N
9mm
-6.1
-6.1 -6.1
-6.0
-5.8
-5.8
-5.9
-6.1
-5.9
-6.0-6.0-6.1 -6.0
-6.1
-6.0
-6.2
-6.1
-6.1-5.8
-5.8
-5.7
-5.6 -5.7-5.7
-6.0
-6.0
-5.9-5.8
-5.9
-5.9
-5.7
-6.1
-5.8
-6.1
-5.6
-6.1
-5.6
-6.0
-6.0
-5.9
-6.0
-6.0
-5.9-6.0
-5.9
-6.0
9060
30
0
1240
210
2
150
3
120
4
330
300
0
-2
-1
-4
-3
1
2
3
4
-3 -2 -1 0-4 ...-7.00-6.50-6.00-5.50-5.00-4.50-4.00-3.50-3.00-2.50-2.00-1.50-1.00-0.500.000.501.001.502.002.503.003.504.004.505.005.506.006.507.00
D
T
OS
N
9mm
0.0
0.3 0.4
0.20.0
-0.2-0.4
-0.3
0.0
0.1
0.2
-0.2-0.2-0.2
-0.1
-0.1
-0.2
0.2
-0.2
0.40.1
0.2
-0.0
9060
30
0
1240
210
2
150
3
120
4
330
300
0
-2
-1
-4
-3
1
2
3
4
-3 -2 -1 0-4
John Doe 1968 May 28 123
2015 May 28 - 10:17, 3d Scan (15/2) (Surf. Align.: On)
OSIOL Power Report
Anterior Axial Curvature [D] n 1.3375
Posterior Axial Curvature [D]
Total Corneal Power IOL (Ray Traced) [D]
Placido Image
SimK n 1.3375SimK 43.14D R 7.82mm
Flat SimK 42.89D 147° R1 7.87mmSteep SimK 43.38D 57° R2 7.78mm
Astig 0.50D 57° e² (-Q) 0.24Posterior Axial Curvature
Mean K -6.09D R 6.57mmFlat K -6.03D 165° R1 6.63mm
Steep K -6.14D 75° R2 6.52mmAstig -0.11D 75° e² (-Q) 0.25
Total Corneal Power IOL (Ray Traced)Mean TCPIOL 42.23D Central 42.14D
Flat TCPIOL 41.99D 142° Mid 42.79DSteep TCPIOL 42.47D 52° Periph 42.40D
Astig 0.48D 52°Pachymetry
o Thinnest 532µm location x,y 0.26mm -0.14mmCentral 541µm CCT 533µm
Anterior Chamber and BiometryWTW, N-T 12.10mm Mean Angle 31.5°
ACV 132mm³ Kappa Dist 0.22mmAQD 2.92mm ASL endo n/a
+ Pupil Diam 2.98mm location x,y 0.22mm -0.01mmAC Angle N 32.1° AC Angle T 31.3°AC Angle S 30.2° AC Angle I 32.5°
Keratoconus ProbabilityKPI 3.9% Kprob 3.7%
CLMIaa 0.68D PPK 0.7%Total Corneal Zernike Coefficients
Defocus 0.05D -0.07µmAstigmatism 0.32D -0.4µm 146.6°
Coma 0.23D -0.3µm 114.4°Trefoil 0.09D -0.1µm 104.0°
Spherical -0.17D 0.22µmRMS Total 0.44D 0.57µm

110 | GALILEI G4 Operator Manual/AM © 2016 Ziemer Ophthalmic Systems AG Doc. No. CM3941-0081-03-AM
Most important features of the standard IOL Power report are the ray-traced Total Corneal Power map and additional parameters describing the anterior chamber depth and chamber angles.
The Average Anterior Chamber Depth is computed as the distance between the crystalline lens and the posterior cornea (endothelium). The average anterior chamber depth is measured in mm along the central normal line to the line between the outer iris endpoints. The displayed value is�the�average�of�valid�measurements�for�all�Scheimpflug�frames.�
The Average Anterior Segment Length (ASL), calculated for dilated eyes only, is the distance in mm between the posterior cornea (endothelium) and the posterior lens.
ASL endo = AQD + crystalline lens thickness
In the [Settings] [Display] (see Fig. 25) the ASL display can be switched to ASL from the anterior cornea (epithelium). Then the equation is
ASL epith = ACD + crystalline lens thickness
ACD includes the central corneal thickness, therefore
ACD = AQD + CCT
Doctors Hill, Wang and Koch have created the website iol.ascrs.org to facilitate IOL power cal-culation. The GALILEI Total Corneal Power (TCP1 or TCP2; see section 8.5.1 Using Total Corneal Power for more detail) is an input factor to the Prior Myopic LASIK page on this website, allow-ing surgeons to use ray traced Total Corneal Power data to calculate IOL Power. The formula re-quires�the�value�of�the�TCP�Central�Average�of�0-�to�4-mm�zone,�which�can�be�found�in�the�IOL�Power Report (indices section) under Total Corneal Power. Refer to section 8.5 Total Corneal Power (TCP) (ray-traced) of the Glossary for more information.

GALILEI G4 Operator Manual/AM | 111© 2016 Ziemer Ophthalmic Systems AG Doc. No. CM3941-0081-03-AM
9.5.5 Santhiago PTA Report™
Fig. 48 Santhiago PTA Report™ screen display
Fig. 49 Santhiago PTA Report™ printout
. . .1 21 41 61 82 02 22 42 62 83 03 23 43 63 84 04 24 44 64 85 05 25 45 65 8%
T
O S
N
9 m m
3 3
3 33 3
3 3
2 9
2 9
2 9
3 4
2 9
2 82 8
2 82 8
3 3
2 8
3 3
2 8
3 3
2 8
2 82 8
2 8
2 8
3 1
3 02 7
3 0
2 8
2 7
3 1
2 7
3 1
2 8
3 1
2 7
3 1
3 2
3 1
3 2
3 1
3 2
3 1
9 0
6 0
3 0
0
1
2 4 0
2 1 0
2
1 5 0
3
1 2 0
4
3 3 0
3 0 0
0
- 2
- 1
- 4
- 3
1
2
3
4
- 3 - 2 - 1 0- 4 . . .3 7 . 0 03 8 . 0 03 9 . 0 04 0 . 0 04 1 . 0 04 2 . 0 04 3 . 0 04 4 . 0 04 5 . 0 04 6 . 0 04 7 . 0 04 8 . 0 04 9 . 0 05 0 . 0 05 1 . 0 05 2 . 0 05 3 . 0 05 4 . 0 05 5 . 0 05 6 . 0 05 7 . 0 05 8 . 0 05 9 . 0 06 0 . 0 0
D
T
O S
N
9 m m
4 3 . 2
4 3 . 44 2 . 9
4 2 . 9
4 1 . 9
4 1 . 7
4 2 . 4
4 2 . 9
4 2 . 2
4 2 . 44 2 . 4
4 2 . 34 2 . 3
4 3 . 4
4 1 . 7
4 3 . 0
4 1 . 7
4 3 . 0
4 1 . 2
4 0 . 44 0 . 4
4 0 . 9
4 1 . 1
4 2 . 7
4 2 . 24 0 . 4
4 2 . 1
4 1 . 0
4 0 . 1
4 3 . 3
3 9 . 8
4 3 . 5
4 0 . 4
4 3 . 5
3 9 . 9
4 3 . 0
4 2 . 6
4 2 . 4
4 2 . 8
4 2 . 2
4 3 . 0
4 2 . 7
9 0
6 0
3 0
0
1
2 4 0
2 1 0
2
1 5 0
3
1 2 0
4
3 3 0
3 0 0
0
- 2
- 1
- 4
- 3
1
2
3
4
- 3 - 2 - 1 0- 4
P T A L i m i t
PTA34%
0% 35% 40% 100%
PTA thinnest34%
0% 35% 40% 100%
Precaution: The prediction of ectasia is controversial. PTA values can vary and according to several publications there are other risk factors for post lasik ectasia. The PTA method was developed by Marcony R. Santhiago, MD PhD (Am J Ophthalmol 2014;158:87–95) and is based on eyes with normalpreoperative topography. Ziemer Ophthalmic Systems AG and the authors cannot be held responsible for patients that develop ectasia in any case.
John Doe 1968 May 28 123
2015 May 28 - 10:17 (Surf. Align.: On)
OSSanthiago PTA Report™
SW nightly_build_2015-05-28_00-05-00
Santhiago PTA Report™Flap Thickness 80.0um PRK no
Ablation Depth 100.0umAge 47years
Percent Tissue Altered
Pachymetryo Thinnest 532µm location x,y 0.26mm -0.14mm
Central 541µm CCT 533µmMid 581µm
Periph 657µm Corneal Vol. 30.43mm³SimK n 1.3375
SimK 43.14D R 7.82mmFlat SimK (K1) 42.89D 147° R1 7.87mm
Steep SimK (K2) 43.38D 57° R2 7.78mmAstig 0.50D 57° e² (-Q) 0.24
Anterior Axial Curvature Zones n 1.3375Central 43.13D 7.82mm
Mid 42.70D 7.90mmPeriph 40.98D 8.24mmKmax 43.53D 7.75mm location x,y -1.38mm -1.84mm
PTA [%]
PTA Curve
Anterior Axial Curvature [D]
PTA Limit

112 | GALILEI G4 Operator Manual/AM © 2016 Ziemer Ophthalmic Systems AG Doc. No. CM3941-0081-03-AM
The Santhiago PTA Report™ is a tool for estimating the probability of a cornea developing ec-tasia after LASIK or PRK surgery in eyes with normal preoperative topography.
The PTA (percent tissue altered) index was developed by Marcony R. Santhiago, MD PhD (Am J�Ophthalmol�2014;�158:�87-95)�and�is�defined�as�follows:
FT: Flap Thickness; AD: Ablation Depth; CCT: Central Corneal Thickness
The�surgeon�starts�by�choosing�the�approximate�flap�thickness�and�ablation�depth�planned�for�the�patient.�In�case�of�a�PRK�surgery,�the�surgeon�just�selects�the�[PRK]�field,�and�the�[Flap�Thick-ness]�field�will�automatically�be�set�inactive.
The patient’s age will be automatically taken from the patient database. Age is not used in the formula calculating PTA, but according to several publications (Marcony R. Santhiago et al.: Am J�Ophthalmol�2014;�158:�87-95;�J.�Bradley�Randleman�et�al.:�Ophthalmology�2008;�115:�37-50),�it is also considered a prevalent factor when assessing the probability of post-operative ecta-sia. If no information on age is entered into the patient database, it will also not be displayed in the Santhiago PTA Report.
After the surgeon has entered these numerical values, the GALILEI software automatically cal-culates the PTA and the PTA thinnest percentage values. PTA�thinnest�is�defined�as�follows:
FT: Flap Thickness; AD: Ablation Depth;TP: Thinnest Point (displayed as “Thinnest” in the Pachymetry index section)
A PTA value between 0 % and 35 % is within the normal range. A value from 35-40 % indicates a moderate probability of post-operative ectasia and a value above 40 % indicates an elevated probability of post-operative ectasia. For more information on the PTA method, please consult Dr. Santhiago’s original publication (Am J Ophthalmol 2014; 158: 87-95).
The PTA Map shows the calculated PTA percentage on a point-by-point basis.
The PTA Curve graph is composed of the pachymetry curve (black), which displays the thickness of�the�cornea�over�different�zones,�the�PTA�curve�(blue)�and�the�PTA�Limit�curve�(red).�The�PTA�Limit curve shows where the cut-off value of 40 % is situated relative to the pachymetry curve. The�PTA�curve�is�the�PTA�value�per�zone�based�on�the�parameters�entered�(FT,�AD).�If�the�PTA�curve is above the PTA Limit curve, the PTA values are within the normal range, if it is below the PTA Limit curve, the PTA is above 40 % and there is an elevated probability of post-opera-tive ectasia.
The PTA Limit graphic shows once more where the PTA curve is situated relative to the PTA Limit and relative to the anterior and posterior surface of the cornea.
PTAthinnest = (FT +AD)/TP

GALILEI G4 Operator Manual/AM | 113© 2016 Ziemer Ophthalmic Systems AG Doc. No. CM3941-0081-03-AM
Caution: The prediction of ectasia is controversial. PTA values can vary and ac-cording to several publications there are other risk factors for post Lasik ectasia. The PTA method was developed by Marcony R. Santhiago, MD, PhD (Am J Oph-thalmol 2014; 158: 87-95) and is based on eyes with normal preoperative topog-raphy. Ziemer Ophthalmic Systems and the authors cannot be held responsible for patients that develop ectasia in any case.
Note: The Santhiago PTA Report™ software license module is not available for sale in the U.S.

114 | GALILEI G4 Operator Manual/AM © 2016 Ziemer Ophthalmic Systems AG Doc. No. CM3941-0081-03-AM
9.5.6 Z-LASIK Report
The�Z-LASIK�Report�provides�the�first�connection�between�GALILEI�and�FEMTO�LDV�laser.�This�feature facilitates transfer of patient data from GALILEI to FEMTO LDV. The printed Z-LASIK Re-port�is�useful�to�refractive�surgeons�for�explaining�the�Z-LASIK�procedure,�and�patient-specific�settings, to their LASIK patients.In addition to generic GALILEI indices, the Z-LASIK report displays manually entered IOP indices (from�tonometric�examination�with�the�PASCAL�Tonometer)�and�flap�size�indices�for�the�planned�Z-LASIK procedure.The Z-LASIK Report is an optional, licensable feature. For details on how to obtain and activate a software license, refer to section 7.1.6 [Licenses] tab:.
Fig. 50 Z-LASIK Report screen display
In the printed version (see Fig. 51), space is provided for the refractive surgeon’s assessment of the major indices to be documented with tick marks in the “within range” or “outside range” boxes. The surgeon’s decision on the patient’s suitability can also be documented on this re-port.
Note: The Z-LASIK Report is not avail-able in the U.S.

GALILEI G4 Operator Manual/AM | 115© 2016 Ziemer Ophthalmic Systems AG Doc. No. CM3941-0081-03-AM
Fig. 51 Z-LASIK Report printout
Z-LASIK OptimizedSurgery Planning Report
3d Scan (15/2)2015 Apr 23 - 13:10
Muster Max1956 Aug 2512345 OD
Corneal Pachymetry ROI = 10.0 mm Axial Curvature n = 1.3375 ROI = 10.0 mm
Flap Thickness = 100 µm Flap Diameter = 8.5 mm
...750725700675650625600575550525500475450425400375350325300275250225200175µm
N
OD
T
9mm
501
504 512
515
617
618
613
497
609
619617592
609
520
580
518
584
508619
638625
613
585 527
533
609 553
585
643
550
631
544
641
530
649
527
553
573
549
567
548
562570
557
9060
30
0
1240
210
2
150
3
120
4
330
300
0
-2
-1
-4
-3
1
2
3
4
-3 -2 -1 0-4 ...31.5033.0034.5036.0037.5039.0040.5042.0043.5045.0046.5048.0049.5051.0052.5054.0055.5057.0058.5060.0061.5063.0064.5066.00
D
N
OD
T
9mm
44.0
44.6 44.3
43.5
42.3
41.8
43.5
43.9
43.2
44.143.944.2
44.2
44.6
43.6
45.0
44.1
44.041.6
42.342.1
42.0
43.2 43.8
43.7
42.9 43.8
43.1
42.7
44.8
42.8
44.7
42.4
44.5
42.3
44.3
42.9
44.4
43.6
44.2
44.4
43.844.2
43.3
9060
30
0
1240
210
2
150
3
120
4
330
300
0
-2
-1
-4
-3
1
2
3
4
-3 -2 -1 0-4
Z-LASIK Pre-operative Examination and Assessment Planned Z-LASIK Flap Dimensions
within range / outside range
Keratometry 44.30 D 7.62 mm
Astigmatism 1.20 D @90.0 °
Keratoconus Prediction Index 0.6%
White to White (avg) 12.3 mm
Pupil Size (avg) 3.68 mm
Central Corneal Thickness 506 µm
Corneal Thickness (thinnest) 495 µm
Interocular Pressure IOP 0.0 mmHg
Ocular Pulse Amplitude OPA 0.0 mmHg
Flap Diameter 8.5 mm
Flap Thickness 100 µm
Hinge Position Nasal
Notes:
Suitable for Z-LASIK treatment: Yes No Signature:
S/N = 12117065GALILEI V 6.2.0

116 | GALILEI G4 Operator Manual/AM © 2016 Ziemer Ophthalmic Systems AG Doc. No. CM3941-0081-03-AM
9.6 Display Options
To�aid�the�in-depth�analysis�of�specific�cases,�several�display�options�are�available�under�the�[Analyze]�tab:�[Overview],�[Scheimpflug],�[MapX1],�[MapX4]�and�several�diagnostic�tools�(see�section 9.7 Diagnostic Tools).
9.6.1 Overview Display
The [Verify] tab provides an at-a-glance overview of the results. However, this overview is only available�immediately�after�measurement.�It�is�also�the�location�to�compare�a�specific�Scheimp-flug�image�with�the�map�of�choice.
Fig. 52 Overview display screen
9.6.2 Scheimpflug Image Display
Here�the�Scheimpflug�images�are�displayed�from�both�Scheimpflug�views. The [Image Selection] panel provides a graphical representa-tion of the angle and position of the cameras relative to the eye. The yellow line indicates the slit light position for the corresponding Scheimpflug�image.�You�can�choose�to�play�a�movie�of�the�images�continuously by clicking on the play button. Or you can advance indi-vidually�to�a�specific�image�at�the�angle�of�interest�by�clicking�on�the�arrow�buttons.�The�arrow�with�a�bar�will�take�you�directly�to�the�first�or last image of the scan.

GALILEI G4 Operator Manual/AM | 117© 2016 Ziemer Ophthalmic Systems AG Doc. No. CM3941-0081-03-AM
9.6.2.1 Scheimpflug Image Enhancement
Under [Image Control], three options for improving image quality are available: You can select two�fixed�contrast�settings�[Cornea�focused�enhancement]�or�[Lens�focused�enhancement].�For�[Manual enhancement], click on the lower button, then click and drag the crosshair box within the larger box on the right to set the contrast and brightness to your preference. You can also use�the�up�and�down�arrows�on�the�keyboard�for�fine�adjustments�once�you�have�clicked�the�[Crosshair] box.
9.6.2.1.1 Colorized and Inversed black / white Scheimpflug image options
By�clicking�on�[Inversed�Image],�you�will�display�negative�(inverse)�Scheimpflug�images.�This�can�be�helpful�in�making�details�more�apparent�or�printing�to�conserve�toner�ink.�The�[Colorized�Im-age] option changes the gray levels of the image into false colors to bring out more details and are more colorful for illustrations.
9.6.2.2 How to Zoom (enlarge) any Scheimpflug image
To�zoom�any�Scheimpflug�image�anywhere�in�the�software,�make�sure�that�the�mouse�pointer�is�over�the�image�for�which�you�want�to�change�the�zoom�factor.�To�zoom�in�or�out,�press�and�hold�the�[s]�key�and�scroll�with�your�mouse�to�zoom�in�or�out.�When�zoomed�in,�you�can�move�the�image�around�by�pressing�[Shift],�and�left-click�to�drag�the�image�to the desired location. By�pressing�the�[F1]�key�on�the�keyboard,�you�can�reduce�the�image�to�fit-to-screen�size.�By�press-ing�[F2],�the�full-scale�size�(100�%)�is�displayed.
Fig. 53 Colorized�image Fig. 54 Inversed image

118 | GALILEI G4 Operator Manual/AM © 2016 Ziemer Ophthalmic Systems AG Doc. No. CM3941-0081-03-AM
9.6.3 MapX1 Display
As the name indicates, this option provides a full screen view of a particular map. You can also superimpose�this�map�over�the�image�of�the�eye.�To�do�this�you�first�have�to�select�the�[Show�Eye] box at the bottom left of the map. Now you can fade the map with the slider below the map (see image below).In both the MapX1 and the MapX4 (Fig. 55) you can select the map(s) that you want to see. To change the map display, place the mouse pointer over the map that you want to change, and then right-click. Click on [Maps] at the top line. This will bring up the following pop-up:
Fig. 55 Map display options pop-up
One of 13 different maps can be selected by left-clicking with the mouse on the desired map type name on the right hand side of the pop-up.
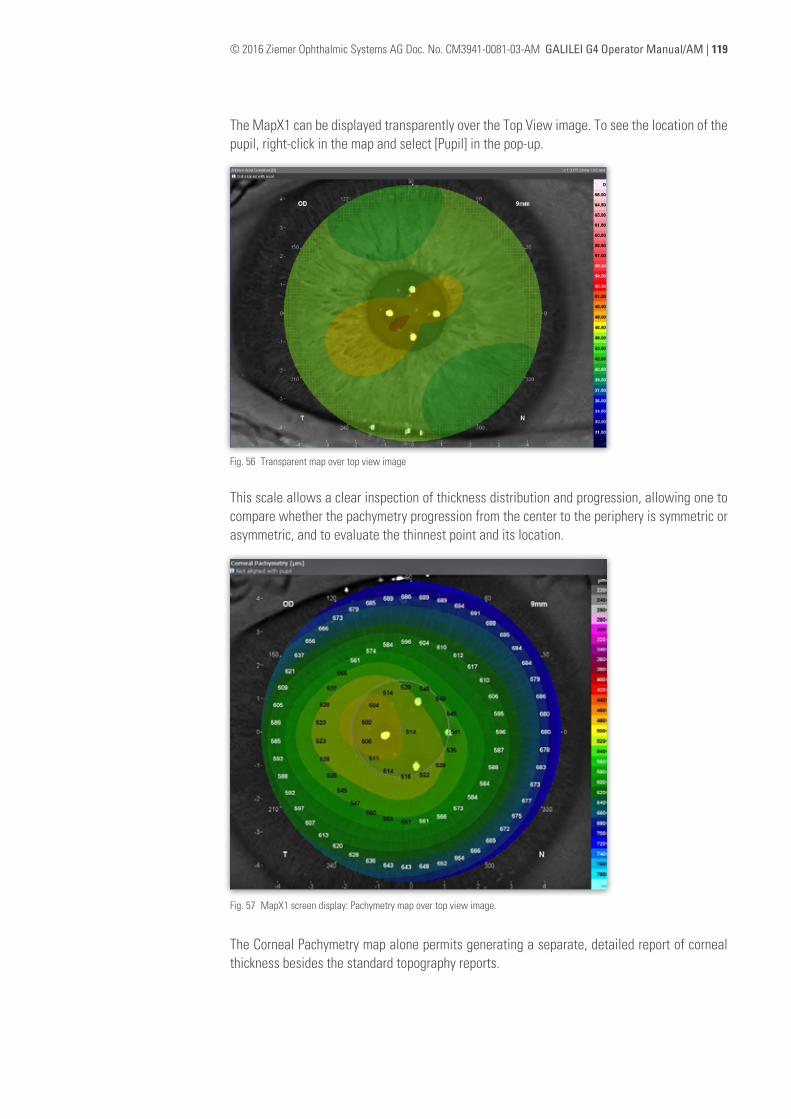
GALILEI G4 Operator Manual/AM | 119© 2016 Ziemer Ophthalmic Systems AG Doc. No. CM3941-0081-03-AM
The MapX1 can be displayed transparently over the Top View image. To see the location of the pupil, right-click in the map and select [Pupil] in the pop-up.
Fig. 56 Transparent map over top view image
Fig. 57 MapX1 screen display: Pachymetry map over top view image.
This scale allows a clear inspection of thickness distribution and progression, allowing one to compare whether the pachymetry progression from the center to the periphery is symmetric or asymmetric, and to evaluate the thinnest point and its location.
The Corneal Pachymetry map alone permits generating a separate, detailed report of corneal thickness besides the standard topography reports.

120 | GALILEI G4 Operator Manual/AM © 2016 Ziemer Ophthalmic Systems AG Doc. No. CM3941-0081-03-AM
9.6.4 MapX4 Display
The�Standard�Profile�has�the�MapX4�with�all�Settings�(Numeric�Values,�Thinnest�Location,�Pu-pil, and Axis) included in the following maps:
• Anterior Axial Curvature map with CGA 1.0 D Default style scale.• Anterior Instantaneous Curvature map with CGA 1.50 D Default style scale.• Anterior�Elevation�(Best�Fit�Sphere)�map�with�CGA�5�micron�ANSI�style�scale.• Anterior�Elevation�(Best�Fit�Toric�Aspheric)�map�with�CGA�5�micron�ANSI�style�scale.
Fig. 58 Standard X4 representation of anterior surface topography.
This MapX4 report is designed to show the topography data of the anterior surface.

GALILEI G4 Operator Manual/AM | 121© 2016 Ziemer Ophthalmic Systems AG Doc. No. CM3941-0081-03-AM
9.6.5 Five Custom reports
You�can�define�up�to�5�reports�with�your�own�Custom�Report�Name.�You�can�individually�select�the individual maps and indices to be displayed. To create a custom report, proceed as follows:
• Create�your�own�profile• Activate [Custom Reports] in the Settings panel• Select�any�of�the�predefined�MapX4�reports
• Now�click�on�[Configure�Current�View].�This�will�bring�up�the�following�pop-up:
Here you can select the maps and indices that you would like to have displayed in your custom report.�You�can�also�change�the�name�of�your�custom�report�as�desired.�By�closing�the�[Custom�Report�Configuration]�window�these�settings�are�saved.�These�custom�reports�together�with�the�report�map�and�scale�settings�can�be�saved�additionally�under�your�Personalized�Layout�Profile.�Refer�to�section�9.1.3�Predefined�and�Personalized�layout�profile�on�how�to�set�up�your�Person-alized�Layout�Profile.

122 | GALILEI G4 Operator Manual/AM © 2016 Ziemer Ophthalmic Systems AG Doc. No. CM3941-0081-03-AM
9.7 Diagnostic Tools
Several�diagnostic�tools�are�available�under�the�[Analyze]�tab,�namely�[Densitometry],�[Eye�Met-rics], [Comparison] (subtraction of two maps, or comparison of fellow eyes), the IOL Calculator]9, and the [Z-LASIK] Report. They are discussed in the subsequent sections.
9.7.1 Densitometry
Under this tab the relative density of the different layers of the anterior chamber across two axes�can�be�studied.�By�dragging�the�mouse�over�the�Scheimpflug�image,�different�locations�can�be�analyzed.�The�user�has�the�same�control�over�the�image�quality�and�selection�of�Scheimpflug�images�as�is�described�in�section�9.6.2�Scheimpflug�Image�Display.�However,�it�is�not�possible�to�zoom�the�Scheimpflug�image�in�this�window.
Fig. 59 Anterior chamber optical density histogram display.
9 Optional feature subject to separate software license

GALILEI G4 Operator Manual/AM | 123© 2016 Ziemer Ophthalmic Systems AG Doc. No. CM3941-0081-03-AM
9.7.2 Eye metrics
Due�to�inherent�optical�limitations�of�Scheimpflug�photography,�some�parts�of�the�Scheimpflug�image are not amenable to ray tracing (For an explanation of ray tracing refer to the Glossary, section�8.4�Ray�Tracing).�Those�zones�are�marked�with�a�red�overlay�in�the�Scheimpflug�images,�indicating that accurate manual measurement is not possible in these areas.
Browse�through�all�Scheimpflug�images�and�choose�the�image�with�the�smallest�red�zone�for�manual�measurements..
9.7.2.1 On-screen measurements
To�perform�a�manual�on-screen�measurement,�place�the�mouse�pointer�over�the�Scheimpflug�image and right-click the mouse. This will bring up a menu as shown below. Select [Pachyme-try] and then left-click once, move the cursor to the desired location on the cornea and click again to display the pachymetry value at the selected location. This can be repeated unlimited times.
Select [Distance] to make manual on-screen measurements with two mouse clicks. First click the mouse to place the starting point; then click again to mark the end-point on the image. By�selecting�[Annotation]�you�can�add�your�comments�to�any�image�at�a�mouse�click.�Selecting�[Show Chamber Values] toggles the chamber angles for that particular meridian. To delete a pachymetry, distance or annotation entry, click [(Select)] and then click on the par-ticular item to highlight it, and then press the [Delete] key on your keyboard. The various options are shown in the images below.Select [Show Chamber Values] in the on-screen measurements menu. The anterior chamber an-gles are automatically determined and displayed if ray-traced data are available for the regions of interest.For Eye Metrics examples see Fig. 60 and Fig. 61.

124 | GALILEI G4 Operator Manual/AM © 2016 Ziemer Ophthalmic Systems AG Doc. No. CM3941-0081-03-AM
Fig. 60 Scheimpflug�image�with�selected�metrics�data.
Fig. 61 Enlarged view of chamber angle.

GALILEI G4 Operator Manual/AM | 125© 2016 Ziemer Ophthalmic Systems AG Doc. No. CM3941-0081-03-AM
9.7.3 Comparing Maps
Fig. 62 Difference map (Example: two scans of two eyes OS / OD)
The�difference�between�two�selectable�maps�can�be�analyzed.�Go�to�[Analyze],�[Comparison]�to�display�the�Difference�Map�screen.�On�the�top�of�the�screen,�select�the�appropriate�A�and�B�ex-ams,�then�the�A�–�B�difference�is�computed.�Right-click�on�the�large�difference�map�to�select�the type of map to be compared, as shown in the image above. There are four options for map realignment. The auto-detect alignment uses multiple map indi-ces�(recommended).�The�Anterior�BFS�alignment�uses�the�Anterior�BFS�(second�recommenda-tion). The�average�difference�values�are�shown�for�the�central,�mid-peripheral�and�peripheral�zones.�The average RMS (root mean square) shows the mean difference in total values between the two maps according to the region of interest (ROI).
Note: Map data recorded with software version 6.0.x and smaller cannot be compared with measurements recorded with 6.1.x and higher.

126 | GALILEI G4 Operator Manual/AM © 2016 Ziemer Ophthalmic Systems AG Doc. No. CM3941-0081-03-AM

GALILEI G4 Operator Manual/AM | 127© 2016 Ziemer Ophthalmic Systems AG Doc. No. CM3941-0081-03-AM
10 OPTIONAL SOFTWARE MODULES
Several optional software features are available for the GALILEI G4. To activate and use any of these modules, a software license must be obtained. The process is described in section 7.1.6 [Licenses] tab:. With software release 6.2 the following licenses are available:
10.1 Overview of available Software Licenses
10.1.1 IOL Calculation Module
Module for selecting IOLs from a built-in database. The database and the formulae available for calculating the optimal implant based of GALILEI data may be complemented with user’s own data. For more details, see section 10.2 IOL Calculator.
10.1.2 Corneal Inlay Module
This software module employs a different algorithm for detecting and tracing edges in Scheimp-flug and Placido images, optimized for corneas with implanted corneal inlays. For more details, see section 10.3 Corneal Inlay Module.
10.1.3 Remote Workstation (RWS)
This module allows viewing and analyzing GALILEI data by remote access, via Internet, from a remote PC client. It is available in a restricted version (max. 3 concurrent users) or an unrestricted version for an unlimited number of active users. For more details, see section 10.4 Remote Work-station.
Note: This feature requires a remote PC operating under Windows 7 or Win-dows XP. The monitor resolution must be at least 1280 x 1024.
10.1.4 Santhiago PTA (Percent Tissue Altered) Report™
The Santhiago PTA Module is a tool for estimating the probability of a cornea developing ecta-sia after LASIK or PRK surgery in eyes with normal preoperative topography. For details, see section 9.5.5 Santhiago PTA Report™.The tab to display the PTA report is located in the lower left corner of the main screen, under [Analyze]. However, this tab is only active if the corresponding software license has been ob-tained and activated.
10.1.5 Z-LASIK Report
Module for generating a report that can be used for Z-LASIK surgery planning. For details, refer to section 9.5.6 Z-LASIK Report.The tab for displaying the Z-LASIK report is located in the lower left corner of the main screen, under [Analyze]. However, this tab is only active if the corresponding software license has been obtained and activated.
Note: The Z-LASIK Report is not avail-able in the U.S.
128 | GALILEI G4 Operator Manual/AM © 2016 Ziemer Ophthalmic Systems AG Doc. No. CM3941-0081-03-AM
Note: Installation requires communication between Ziemer Customer Service, the EMR provider and the clinic’s IT specialist. Contact between these parties should be established before acquiring the license.
Note: The axial length of the eye cannot be measured with the GALILEI and needs to be entered manually. Please read through section 10.2.2 IOL Database carefully regarding the corresponding IOL constants.
10.1.6 DICOM
Module for communication with other devices via the DICOM communication protocol and other electronic medical records (EMR) systems. The GALILEI implementation of DICOM allows ex-porting of reports as encapsulated PDF or JPEG files to a Patient Archiving and Communication System (PACS). Furthermore, importation of patient data from a DICOM Modality Worklist pro-vider to the GALILEI patient database is also supported.
Ziemer’s DICOM Conformance Statement can be obtained from the GALILEI website (http://galilei.ziemergroup.com/dicom-conformance.html). This document reviews the require-ments for the GALILEI DICOM interface.
10.1.7 CSV Export
For Research Purposes Only. Allows exporting indices and map data to CSV (comma-separated values) files that can be opened by Excel. For details, refer to section 10.7 How to open an ex-ported csv sheet.
10.2 IOL Calculator
10.2.1 Introduction
The IOL selector and calculator is a licensable software module which allows you the calcula-tion of IOL’s for Cataract and / or Refractive Surgery, based on the superior GALILEI Dual Scheimp-flug and combined Placido imaging technology. The following values are imported from the GAL-ILEI for IOL calculation:• ACD (= Central Corneal Thickness CCT + Aqueous Depth AQD)• White to White (Nasal – Temporal)• (Total Corneal Power TCP; see note below)• R1 (SimK flat)• R2 (SimK steep)
The IOL calculation is based on the most recent and common formulae used for IOL calculation:• Haigis • Hoffer Q• Holladay • SRK II• SRK / T • Shammas post-LASIK (no-history)

GALILEI G4 Operator Manual/AM | 129© 2016 Ziemer Ophthalmic Systems AG Doc. No. CM3941-0081-03-AM
10.2.2 IOL Database
When you first install the GALILEI IOL Calculator / Selector, the IOL database has one sample IOL data set pre-installed. A database with predefined IOL constants is available on request. Please note that all IOL constants in that database are optimized to be used with the IOL Mas-ter and need further optimization for correct IOL calculation with the GALILEI G4. IOL constants are depending on what system you are using to measure the axial length and from which sys-tem you are using curvature values as well as the anterior chamber depth.
Caution: Since the GALILEI G4 does not measure the axial length (AL), this value, obtained from another device, must be entered manually by the operator for any IOL calculation / selection. Always optimize the lens constant in accor-dance with the measurement method and formula used to calculate IOL power. IOL constants used for axial length values from an optical biometry system differ from IOL constants used for axial length values from other systems. Ziemer does not accept any responsibility for the correctness of lens constant and axial length values used in this GALILEI IOL Calculator / Selector.
We strongly recommend contacting your preferred lens manufacturer to obtain the correspond-ing IOL constants, and to enter these manually into the GALILEI IOL database. For best clinical outcome we strongly recommend you always use personally optimized IOL constants, based on your pre- and postoperative clinical data. Refer to section 10.2.4 Importing IOL data into the da-tabase for further instructions on how to import or alter IOL constants.
The results, namely the recommended next-to-target IOL, given by this IOL Calculator / Selector are based on commonly used formulae as well as the constants of the IOL which the user pre-fers. The next-to-target IOL always needs to be double-checked based on the clinical expertise of the user and available clinical data (e.g. existing 3 months post-operative data). Results fur-nished by this software should be taken as recommendation only.
Any values for curvature as well as the anterior chamber depth (ACD) which are used for IOL calculation and selection are dependent on the used measurement method such as e.g. optical biometry or dual Scheimpflug combined with Placido imaging. SimK or ACD might show minor differences between different devices. A clinical study published in 2011 showed that the GAL-ILEI provided corneal power measurements that lead to accurate IOL power calculation10. An-other study published in 2010 demonstrated that the accuracy of IOL power calculation of the GALILEI is comparable to automated Keratometry and a Placido-based topographer11. Please make sure that all IOL constants used in this IOL calculator are corresponding to the values given by the GALILEI or any other device when entered manually.
10 Giacomo Savini, MD, Piero Barboni, MD, Michele Carbonelli, MD, Kenneth J Hoffer, MD; Accuracy of a dual Scheimpflug an-alyzer and a corneal topography system for intraocular lens power calculation in unoperated eyes; J Cataract Refract Surg 2011; 37:72 – 76 © 2011 ASCRS and ESCRS
11 Shirayama M, Wang L, Koch DD, Weikert MP, Comparison of accuracy of intraocular lens calculations using automated ker-atometry, a Placido-based corneal topographer, and a combined Placido-based and dual Scheimpflug corneal topographer; Cornea 2010 Oct;29(10):1136-8.

130 | GALILEI G4 Operator Manual/AM © 2016 Ziemer Ophthalmic Systems AG Doc. No. CM3941-0081-03-AM
Caution: Toric IOLs. The calculation of toric IOL power and axis has not been clinically validated using this device. The user should follow IOL manufacturer recommendations for power calculations of specific toric IOL models.
Note: Lens constants may depend on the type of equipment used for axial length measurement, individual surgical technique and other factors. For opti-mal results, user may wish to adjust lens constants in the IOL database.
10.2.3 How to use the IOL Calculator
Once the software license has been activated, the IOL Calculator / Selector appears as a sepa-rate panel under the general display list:
Fig. 63 IOL Calculator main screen.
Step 1: After taking a measurement with the GALILEI, go to the IOL Calculator listed under the [Analyze] menu.
Step 2(a): Enter the target refraction in the IOL Calculation View. The field “Target Refraction” Shows a default value of 0. Adapt the target refraction according to the desired visual outcome. Positive or negative entries as well as a value of zero are permitted.
Step 2(b): The selection field next to the “target refraction” field is usually set to its default value “Phakic eye”. This field can be set to “Aphakic eye” or to “Pseudophakic eye” when ap-propriate. For the latter two types of eyes, only the Haigis formula can be used to calculate IOLs. For all other formulas, the calculation result fields (step 3) will remain empty.
Step 2(c): Enter the axial length, as determined on another device, into the field “AL”.
Step 3: Choose your preferred IOL and formulae by using the drop-down menu under “Configu-ration”. You can work with up to 5 configurations from left to right and calculate simultaneously.

GALILEI G4 Operator Manual/AM | 131© 2016 Ziemer Ophthalmic Systems AG Doc. No. CM3941-0081-03-AM
To propagate the IOL type entry or formula, selected in the first column, to the other 4 columns, click [Distribute Model] or [Distribute Formula] as appropriate.
When first using the IOL Calculator software, you will have to feed the IOL database with your preferred IOL constants. You can either import or create your own preferred IOLs with the cor-responding constants (see sections 10.2.4 Importing IOL data into the database and 10.2.5 Man-aging the IOL Database).
Note: The last used combination of formula and preferred IOL is saved and re-used per default setting.
Note: The Haigis IOL constants a0, a1 and a2 must be within defined ranges. If they are out of range, the formula does not indicate any value in the result screen.
Note: You can always switch between different measurements of the same patient in the measurement selector on the upper center part of the display:
Step 4 Computed IOL power and refraction: When all required entries have been made, com-puted IOL power and expected patient refraction will be displayed. On the bottom of the list un-der “Target Refraction”, you can see the IOL to match the target refraction. When no IOL avail-able matches the exact target refraction (e.g. for odd decimal-points) the next possible IOL is shown highlighted in the center of the list under “Closest to target”. Above and beneath, the 4 higher and 4 lower IOLs with the resulting refraction are displayed. At the bottom of the table, the hypothetic IOL diopter values that would result in on-target refraction are displayed.
Step 5 (optional): The values displayed in the ACD, WTW, R1 and R2 fields are values from the measurement taken with the GALILEI. The system allows you to alter these values to compare different results:
• Overwrite any value in the white boxes• Press “Enter” on your keyboard• Click [Calculate] • You can always revert to the original value by pressing the arrow button next to each value.
If manual changes were made, the reset button next to the value becomes active, and an aster-isk appears next to the data field on the report.
Step 6 (if applicable): When you exit the measurement, or take a new measurement, or switch between measurements, the results will not be saved. If you wish to save your configuration and results, you must print the report (either print and save as pdf file, or generate a paper print-out).

132 | GALILEI G4 Operator Manual/AM © 2016 Ziemer Ophthalmic Systems AG Doc. No. CM3941-0081-03-AM
Step 7: Printing / Saving the IOL Report: Click on the [Print] button (Top right of the screen) and select either the appropriate printer or the “print to pdf” option. If the PDF option is selected, the IOL report can subsequently be saved either on the system hard drive or on an external USB storage device.
Fig. 64 IOL Calculator printout

GALILEI G4 Operator Manual/AM | 133© 2016 Ziemer Ophthalmic Systems AG Doc. No. CM3941-0081-03-AM
10.2.4 Importing IOL data into the database
A set of IOLs can be imported to the IOL database as a *.csv file. CSV (comma-separated val-ues) files can be created using Microsoft Excel. The file must have the following row order and naming (field name only):
Field name Description
manufacturer_name Name of the manufacturer of the IOL model
name Name of the IOL model
type Type of the IOL model
remarks Notes for this IOL model
range_from First available IOL in range in [D]
range_to Last available IOL in range in [D]
range_increment Increment to next available IOL starting from range_from in [D]
manufacturer_acd The manufacturer’s ACD constant
manufacturer_a The manufacturer’s A constant
srk2_a The A constant used in SRK2 formula
srkt_a The A constant used in SRKT formula
haigis_a0 The a0 constant used in Haigis formula
haigis_a1 The a1 constant used in Haigis formula
haigis_a2 The a2 constant used in Haigis formula
hofferq_pacd The pACD constant used in Hoffer Q formula
holladay_sf The SF constant used in Holladay formula
shammas_pacd The pACD constant used in the Shammas post-LASIK formula
Step 1: To import IOLs, go to the IOL Database view:
Fig. 65 Accessing IOL Database view

134 | GALILEI G4 Operator Manual/AM © 2016 Ziemer Ophthalmic Systems AG Doc. No. CM3941-0081-03-AM
Step 2: Click the [Import] button:
Step 3: An Explorer window opens. Navigate to your .csv file and click [Open]. The IOLs are added to the list.
Note: If a list is imported multiple times, the IOL dataset will be added each time.
Caution: When importing files or editing / adding IOL data manually, all values entered must be checked to ensure that they are within the specified ranges. Ziemer does not accept any responsibility for manually entered or altered ranges and values.
10.2.5 Managing the IOL Database
You may add, copy, or delete entries in your IOL database. Existing entries may be optimized (edited) individually.
Fig. 66 IOL editor window
Import IOL Delete IOL
Cancel
Save
Add IOL
Copy IOL
Edit IOL
Edit IOL
Confirmation tickbox

GALILEI G4 Operator Manual/AM | 135© 2016 Ziemer Ophthalmic Systems AG Doc. No. CM3941-0081-03-AM
10.2.6 IOL power calculation formulas; literature references
For IOL Power calculation, the equations commonly used in commercial A-Scan biometers and published in the scientific literature (see Table 4) have been implemented in the GALILEI G4.
Formula name Literature reference
SRK II Sanders DR, Retzlaff J, Kraff MC: Comparison of the SRK II formula and other second generation formulas. J Cataract Refract Surg 14: 136-141, 1988
SRK / TRetzlaff J, Sanders DR, Kraff MC: Development of the SRK / T intraocular lens implant power calculation formula. J Cataract Refract Surg 16 (3): 333-340, 1990
Hoffer Q Hoffer KJ: The Hoffer Q formula: A Comparison of theoretic regression formu-las.
Haigis J Cataract Refract Surg 19: 700-712, 1993; Errata 20:677, 1994 http://www.augenklinik.uni-wuerzburg.de/uslab/ioltxt/haid.htm
Holladay I Holladay JT, Prager TC, Chandler TY et al. A three part system for refining in-traocular lens power calculations. J Cataract Refract Surg 14(7): 17-24, 1988
Shammas no-history (post-LASIK)
Shammas HJ, Shammas MC. No-history method of intraocular lens power calculation for cataract surgery after myopic laser in situ keratomileusis. J Cataract Refract Surg. 2007 Jan;33(1):31-6.
The “Shammas no-History” formula has been developed by Shammas & Shammas to address the specific problems associated with patients with an un-documented history of previous re-fractive corneal surgery. It allows reliable IOL prediction in post-LASIK eyes even if no pre-LASIK data are available. The Shammas post-LASIK (no history) formula requires a separate IOL constant (Shammas pACD). This constant must be added in the IOL database before the Shammas formula can be used. Ac-cording to Shammas, the pACD is calculated from the A constant as follows:
pACD = (0.5835 x A) – 64.40
The validity and efficacy of the “Shammas no-history” formula has been confirmed in two pub-lications12, 13.
Table 4 Literature References for IOL Power calculation formulas
12 Intraocular lens power calculations after myopic laser refractive surgery: a comparison of methods in 173 eyes. McCarthy M, Gavanski GM, Paton KE, Holland SP. Ophthalmology. 2011 May;118(5):940-4.
13 Evaluation of intraocular lens power prediction methods using the American Society of Cataract and Refractive Surgeons Post-Keratorefractive Intraocular Lens Power Calculator. Wang L, Hill WE, Koch DD. J Cataract Refract Surg. 2010 Sep;36(9):1466-73.

136 | GALILEI G4 Operator Manual/AM © 2016 Ziemer Ophthalmic Systems AG Doc. No. CM3941-0081-03-AM
10.3 Corneal Inlay Module
10.3.1 Introduction
The feature “Corneal Inlays” is a licensable software module. It allows you to measure eyes with an implanted corneal inlay, such as the KAMRA™ Inlay (AcuFocus, Inc.; http://kamrainlay.com). Current Scheimpflug imaging systems often have difficulties to measure a cornea as the edge detection is disturbed by the presence of an implanted inlay. The enhanced Scheimpflug edge detection implemented in the optional “Corneal Inlays” module allows you to measure eyes with a corneal inlay implanted. It permits advanced post-surgical control of patients with inlays, pro-viding values such as pachymetry, curvature, and wavefront reports.
10.3.2 How to use
If you have purchased this software license, the check box “Measure cornea with inlay im-planted” on the left side under “Enhanced Applications” is activated when taking a measure-ment:
All you have to do is to tell the system that you are about to measure an eye with an inlay implanted before taking a mea-surement. Tick the box “Measure cornea with inlay implanted”. This causes the system to change to the special measurement mode for corneal inlays. Proceed normally to take your mea-surement.
Note: The system will revert to default mea-surement mode after taking a measurement. For multiple measurements in “Corneal In-lays” mode, tick the checkbox each time be-fore initiating a new measurement.
Caution: Since edge detection works differently in “Corneal Inlays” mode, it is recommend to use it only for eyes with implanted inlays. Unreliable results may occur if the “Corneal Inlays” mode is used on normal eyes.

GALILEI G4 Operator Manual/AM | 137© 2016 Ziemer Ophthalmic Systems AG Doc. No. CM3941-0081-03-AM
10.4 Remote Workstation
The RWS can only work if:• You have the GALILEI connected to your local network• You have a RWS license key activated (see section 7.1.6 [Licenses] tab:)• Java version 1.6 or higher has been installed on the remote workstation computer.
To connect the RWS computer, you will need to know the IP address of the GALILEI. The IP ad-dress can be easily found in the GALILEI software by opening [GALILEI] dropdown menu (top left on the screen) and then click on [About GALILEI]. In the [Platform] table, you will see the IP Ad-dress.Now on your intended RWS computer, start your Internet browser and type in the IP Address of the GALILEI machine. This will launch this pop-up:
Now click on the hyperlink [Launch GALILEI Remote Workstation]

138 | GALILEI G4 Operator Manual/AM © 2016 Ziemer Ophthalmic Systems AG Doc. No. CM3941-0081-03-AM
First Java will start; then the applet will be downloaded. Ignore the signature warning and click on [Run]
In the GALILEI Login pop-up, type remote_user as the User Name and galilei as the password. Now your RWS is running and you have full reading and analyzing access to your GALILEI.
10.5 DICOM Connectivity
Digital Imaging and Communications in Medicine (DICOM) is a standard for handling, storing, printing, and transmitting information in medical imaging. It includes a file format definition and a network communications protocol. The communication protocol is an application protocol that uses TCP / IP to communicate between systems. DICOM files can be exchanged between two entities that are capable of receiving image and patient data in DICOM format. The National Electrical Manufacturers Association (NEMA) holds the copyright to this standard. It was devel-oped by the DICOM Standards Committee, whose members are partly also members of NEMA. DICOM enables the integration of scanners, servers, workstations, printers, and network hard-ware from multiple manufacturers into a picture archiving and communication system (PACS). GALILEI has a DICOM conformance statement, which clearly states the DICOM classes that are supported. DICOM has been widely adopted by hospitals and is making in-roads in smaller ap-plications including.

GALILEI G4 Operator Manual/AM | 139© 2016 Ziemer Ophthalmic Systems AG Doc. No. CM3941-0081-03-AM
To aid your planning for your DICOM setup, please request a copy of the GALILEI DICOM Conformance Statement for further information. This document is also available for download from the GALILEI Website in the software section. Link to DICOM Conformance Statement14
Note: DICOM is a separate software package for which a separate license is re-quired. See section 10.1.6 DICOM for details.
Caution: DICOM has been implemented by different EMR systems in slightly different ways, which may bring up compatibility issues. Integrating a GALILEI into a DICOM network may require considerable customization and development work. To make your GALILEI interact properly with other DICOM providers, you may need on-site support *) by Ziemer software specialists and support by your EMR service provider and your IT service integrator. Availability of internet con-nectivity may reduce this need.*) Installation support is not part of the GALILEI DICOM license and is a sepa-rately billable service.
10.5.1 Exporting data to EMR
The EMR module as implemented in v6 software permits exporting GALILEI reports as encapsu-lated PDF or JPEG to Patient Archiving and Communication Systems (PACS). Click on [EMR] (high-lighted by a red arrow) to initiate the export.
14 http://galilei.ziemergroup.com/dicom-conformance.html

140 | GALILEI G4 Operator Manual/AM © 2016 Ziemer Ophthalmic Systems AG Doc. No. CM3941-0081-03-AM
10.6 CSV Data Export
For research purposes, it is often necessary to export index data or map data (point-by-point nu-merical data describing a map). The CSV Export Module generates a comma-separated CSV file and writes it to an external location (e.g., to an USB external storage device). The exported file can then be imported into software that can read comma-separated files (CSV), for example, Ex-cel.With the CSV License activated, the option “Indices to spreadsheet” in the “Export examination data” pop-up panel is activated (see section 4.1.1 Exporting Patient Data), and you can export the indices. Similarly, you can export the map data by selecting the option “Maps to Spread-sheet”, then selecting all map types (Pachymetry, Curvature, Height) for which you would like to export data. “Maps to Spreadsheet” generates separate *.csv files for each examination and map.
10.5.2 Importing patient data via DICOM
To import patient data from a DICOM Modality worklist provider, click on [DICOM] in the Data Source screen, and then click [Import]. The GALILEI software checks automatically for any du-plicate entries in the patient database.

GALILEI G4 Operator Manual/AM | 141© 2016 Ziemer Ophthalmic Systems AG Doc. No. CM3941-0081-03-AM
10.7 How to open an exported csv sheet
The exported csv sheet can be opened with Excel. How to open an exported csv sheet with Ex-cel is described below.
1. Open Excel and click on the tab “Data”:
2. Click on “from Text”:

142 | GALILEI G4 Operator Manual/AM © 2016 Ziemer Ophthalmic Systems AG Doc. No. CM3941-0081-03-AM
3. Select the csv file and click on “import”. The following screen appears:
Be sure “Delimited” is selected. Then click “Next >”.
4. Select “Tab” and “Comma” and click “Next >”:

GALILEI G4 Operator Manual/AM | 143© 2016 Ziemer Ophthalmic Systems AG Doc. No. CM3941-0081-03-AM
5. To complete the procedure, click on “Finish”:

144 | GALILEI G4 Operator Manual/AM © 2016 Ziemer Ophthalmic Systems AG Doc. No. CM3941-0081-03-AM
The comfortable way to study
To learn more about the GALILEI G4 please visit our E-Learning Center (e-learning.ziemergroup.com) or galilei.ziemergroup.com.

GALILEI G4 Operator Manual | 145© 2016 Ziemer Ophthalmic Systems AG Doc. No. CM3941-0081-03
NOTES

146 | GALILEI G4 Operator Manual © 2016 Ziemer Ophthalmic Systems AG Doc. No. CM3941-0081-03

GALILEI G4 Operator Manual | 147© 2016 Ziemer Ophthalmic Systems AG Doc. No. CM3941-0081-03

Ziemer Ophthalmic Systems AGAllmendstrasse 11
CH-2562 Port, Switzerlandwww.ziemergroup.com
Issu
e Da
te: 2
016-
03Do
c. N
o. C
M39
41-0
081-
03
Related Documents