USDA Forest Service, Remote Sensing Applications Center, FSWeb: http://fsweb.rsac.fs.fed.us WWW: http://www.fs.fed.us/eng/rsac/ Operational Use of Landsat in the Intermountain West Current Examples of Resource Agency Applications

Welcome message from author
This document is posted to help you gain knowledge. Please leave a comment to let me know what you think about it! Share it to your friends and learn new things together.
Transcript

USDA Forest Service, Remote Sensing Applications Center, FSWeb: http://fsweb.rsac.fs.fed.us
WWW: http://www.fs.fed.us/eng/rsac/
Operational Use of Landsatin the Intermountain West
Current Examples of Resource Agency Applications

Remote Sensing Applications Center (RSAC)
RSAC Mission:
• Technical support - evaluating and developing remote sensing, image processing, GIS, GPS, and related geospatial technologies.
• Project support and assistance using remote sensing technologies.
• Technology transfer and training to field users.

Operational Applications of Landsat are Extensive, Diverse & Critical
• Mid-level vegetation mapping applications • Landfire refresh• TEUI – basis for natural breaks and classification• Whitebark pine change detection• Aspen decline• Forest health - risk maps• Great lakes change detection• National all-lands disturbance mapping - MTLC• FAO Land cover change• Groundwater Dependent Ecosystem (GDE) Inventory• Strata for inventory - bare earth on WCU• Imputation using FIA plots• Disaster assessment - hurricanes, tornadoes, etc• Post-fire mapping & monitoring applications
USDA Forest Service, Remote Sensing Applications Center, http://fsweb.rsac.fs.fed.us

USDA Forest Service, Remote Sensing Applications Center, http://fsweb.rsac.fs.fed.us
Representative Landsat-based Applications Significant to ID and the IW
• Disturbance Mapping - Fire– Monitoring Trends in Burn Severity
• Existing Vegetation Mapping– Intermountain Region Forests
• Forest Health Monitoring– Whitebark Pine Mortality

Monitoring Trends in Burn Severity (MTBS)Consistently map the burned areas and associated severity of large
fires on all lands in the United States from 1984 to 2010
Jointly implemented by USFS and USGS
•Geospatial data distributed through web-based portals
http://www.mtbs.gov
Presenter
Presentation Notes
Are fires getting larger? Are they more severe? How are the policies enacted by NFP and HFRA affecting fires? MTBS helps fulfill these monitoring objectives and provides a consistent dataset to analyze fire trends and their environmental effects for the past 30 years Work is divided evenly between USGS and USFS
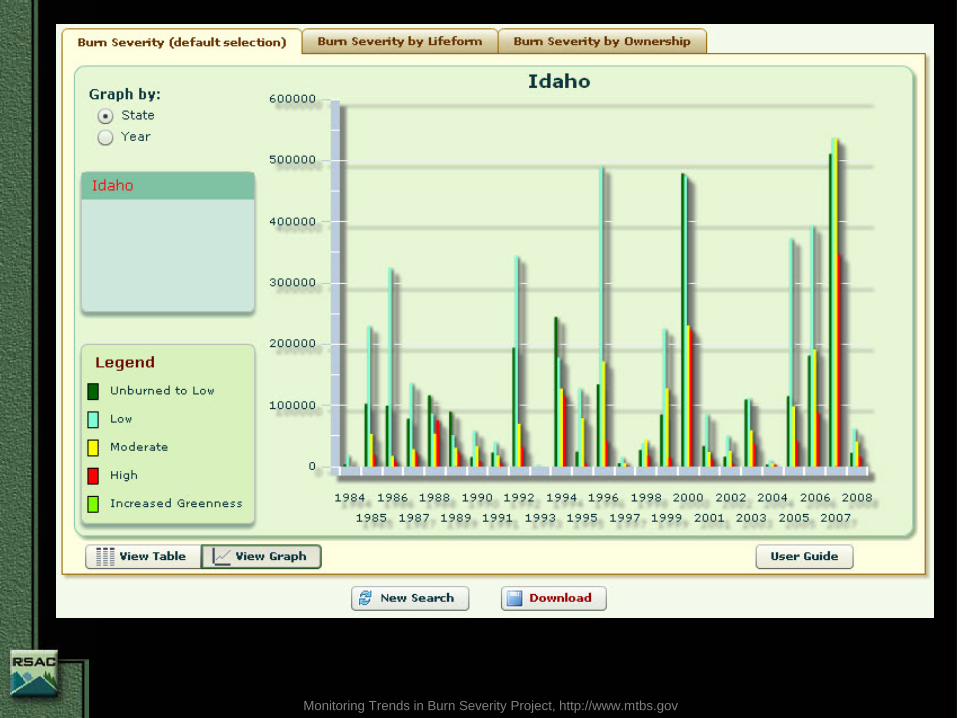
Monitoring Trends in Burn Severity Project, http://www.mtbs.gov

Monitoring Trends in Burn Severity Project, http://www.mtbs.gov

Monitoring Trends in Burn Severity Project, http://www.mtbs.gov
Data Processing Overview• Compile a single MTBS fire occurrence database (FOD) from existing data sources• Based on FOD and prescribed assessment strategy, select pre and post-fire
Landsat scenes• Landsat TM/ETM+ data ordered and acquired from EROS• Analysts perform necessary image pre-processing, image differencing, burned
scar delineation and threshold dNBR images into burn severity classes• Metadata, map products, burn severity data analysis and summary, and reporting
Pre
-fir
e
Pos
t-fi
re
dNBR Burn Severity
Landsat NBR
Difference
Normalized Burn Ratio (NBR)NBR = (NIR – SWIR) / (NIR + SWIR)
dNBR = Pre NBR – Post NBRDifferenced Normalized Burn Ratio (dNBR)
6/8/2005
6/14/2007
Presenter
Presentation Notes
Fires targeted for mapping by the MTBS project are filtered from existing fire occurrence databases 1984-2007 source FOD has over 25,0000 fires MTBS leverages Landsat data to map the location, extent and associated burn severity for each targeted MTBS fire at a spatial resolution of 30m Semi-automated and automated processing tasks are utilized to maintain product consistency Why Landsat TM/ETM+? Necessary spatial/spectral resolution Data record spans an ecologically and climatologically significant time period Resolution synergy with other national/regional datasets MTBS has acquired and processed several thousand Landsat scenes since late 2005 L4, L5 and L7 Mapping/processing: Fires are mapped individually; assessment strategy is dictated by predominate land cover of the fire and FIREMON protocol Burn area and severity mapping is conducted using normalized burn ratio (NBR) and differenced NBR (dNBR) based on Landsat TM/ETM+ imagery Fire mapping and assessment using NBR/dNBR has been used for the past two decades and is scientifically established Operational precedence: NPS fire atlases; USFS/DOI BAER programs Example consists of data for the Day fire in southern California (2006)

Monitoring Trends in Burn Severity Project, http://www.mtbs.gov
MTBS Assessment Strategy• Based on fire type
– Extended Assessment (EA) • Severity based on post-fire assessment at peak of green of next
growing season• Forests/shrublands
– Initial Assessment (IA)• Severity based on immediate post-fire assessment • Grasslands/shrublands
– “Single Scene” Assessment• Lack of suitable pre-fire imagery or other factors; use post-fire
NBR • Conducted on a limited basis (EAs and IAs)
Presenter
Presentation Notes
Assessment strategies are determined primarily by biophysical setting of fire and technical factors Extended assessments are conducted using post-fire satellite data typically acquired during the growing season following a fire Capture delayed first order effects (e.g., latent tree mortality) and dominant second order effects that are ecologically significant (e.g., initial site response and early secondary effects). Desired pre fire satellite data is acquired at seasonal peak of green before fire occurred Initial assessments are conducted using satellite data typically acquired at the first opportunity after fire (3-6 weeks) Capitalize on the maximum post-fire data signal and is used primarily in ecosystems that exhibit rapid post-fire vegetation response (i.e. herbaceous and particular shrubland systems). Pre-fire image is captured on anniversary date of post-fire image Single scene assessments are conducted where no suitable pre-fire image exists or due to other considerations that may impact a dNBR assessment (i.e. hydrology effects, etc.)

Existing Vegetation Mid-Level Mapping
USDA Forest Service, Remote Sensing Applications Center, http://fsweb.rsac.fs.fed.us
IDAHO
Payette NF
Boise NF
Current projects include:– Boise/Payette:
– 5 million acres– 5 Landsat path/rows x 3 dates
– Caribou Targhee:– 3 million acres– 6 Landsat path/rows x 3 dates
– Sawtooth:– million acres– 5 Landsat path/rows x 3 dates
– Salmon Challis:– 4.3 million acres– 5 Landsat path/rows x 3 dates
Salmon NF
Sawtooth NF

Existing Vegetation Mid-Level Mapping
• Process relies on Landsat imagery• Develop information based on national
standards for mid-level mapping• Dominance type, canopy cover, size
USDA Forest Service, Remote Sensing Applications Center, http://fsweb.rsac.fs.fed.us
Input image-cube Field & PI training sites
Data mining develops decision-trees to classify veg
Applied to image-cube to classify & label segments

Map Updates for Mid-Level Mapping• Updating mid-level maps
– Humboldt-Toiyabe NF, NV• ~150 Landsat images used (1998-2009)
– Bridger-Teton NF, WY • 10 Landsat images used (2001-2009)
USDA Forest Service, Remote Sensing Applications Center, http://fsweb.rsac.fs.fed.us
1. Disturbance maps derived from Landsat – fire, conifer mortality, harvest, etc.
2. Develop vegetation crosswalk to reflect disturbance class
3. Integrate updates into existing vegetation map
Presenter
Presentation Notes
Over 150 Landsat images were used to map small fires and update the mid-level vegetation map for the Humboldt-Toiyabe. This doesn’t include the large fires that were already mapped using the MTBS. The Bridger-Teton is using the MTBS data and the conifer mortality maps from the whitebark pine project. We’re not mapping small fires on the BT.

Whitebark Pine Mortality Assesment
USDA Forest Service, Remote Sensing Applications Center, http://fsweb.rsac.fs.fed.us
6 national forests:•Shoshone
•Bridger-Teton•Caribou-Targhee
•Gallatin•Custer
•Beaverhead-Deerlodge
2 national parks:•Yellowstone•Grand Teton
Developed whitebark pine mortality map for Greater Yellowstone Area 2000-2008:– Used in risk
assessment models– Aids in prioritizing
restoration efforts– Assessing impacts of
whitebark mortality on ecosystem components
Study Area – ~14 million acres
Presenter
Presentation Notes
Forest canopy cover density is likely to impact the relationship between change index and actual forest change. Created 3 discrete canopy classes based on the Landfire canopy closure map. High canopy Medium canopy Low canopy Created five discrete change classes from the change index layer. 1-no change to 5 –most change

Whitebark Pine Mortality Assesment
USDA Forest Service, Remote Sensing Applications Center, http://fsweb.rsac.fs.fed.us
Landsat imagery – 5 path/rows– 2 dates, 2000 & 2007/2008
Landfire– Existing vegetation type– Canopy closure
USGS Whitebark pine map (S.Podruzny, C.Schwartz, R.Lawrence, L. Landenburger)
425 1-Hectare field plots
Presenter
Presentation Notes
Approximately a one-hectare area was sampled. At each point, canopy cover and condition were visually estimated over the surrounding 15-20m radius area. Along each transect from plot center to subplot locations, quantitative samples for canopy cover and damage were taken at 5-m intervals using a sighting device. If desired, plotless (basal area) sampling based on individual trees were used to provide more information on species composition and stand structure (the “full plot” protocol). A regression analysis was generated for each canopy cover class for each landsat scene: Low canopy cover Medium canopy cover High canopy cover The resulting regression model was then applied to the other pixels in that canopy class for the same landsat scene.

Whitebark Pine Mortality Assessment
• Products
USDA Forest Service, Remote Sensing Applications Center, http://fsweb.rsac.fs.fed.us
Conifer mortality
Shoshone NF
Yellowstone NP
B-T NF
potential WbP
damage
Grand Teton NP
Whitebark pine relative damage (2000-2008)Conifer mortality for GYA
Presenter
Presentation Notes
Individual landsat scene canopy mortality maps were mosaiced into GYA wide, continuous absolute and relative conifer canopy mortality (left). Whitebark pine areas were identified using the USGS whitebark pine map (right).

USDA Forest Service, Remote Sensing Applications Center, FSWeb: http://fsweb.rsac.fs.fed.us
WWW: http://www.fs.fed.us/eng/rsac/
Parting Thought
Without LDCM & the NLIP, Agencies cannot continue to assess,
monitor & manage at an adequate level of scientific validity
Related Documents