@MetOfficeSpace Operational space weather forecasting at the UK Met Office Suzy Bingham, David Jackson, Siegfried Gonzi, Edmund Henley, Mike Marsh, Emily Down, Michael Sharpe, Sophie Murray*, Diana Morosan*, Michaela Mooney** (* Trinity College Dublin, ** Mullard Space Science Lab) 19 th July 2018 Session D2.3, COSPAR, Pasadena

Welcome message from author
This document is posted to help you gain knowledge. Please leave a comment to let me know what you think about it! Share it to your friends and learn new things together.
Transcript

@MetOfficeSpace
Operational space weather forecasting at the UK Met Office
Suzy Bingham, David Jackson, Siegfried Gonzi, Edmund Henley, Mike Marsh, Emily Down, Michael Sharpe, Sophie Murray*, Diana Morosan*, Michaela Mooney**
(* Trinity College Dublin, ** Mullard Space Science Lab)
19th July 2018
Session D2.3, COSPAR, Pasadena
Outline
• MOSWOC forecasting methods (models/ challenges/ assessment):o Flareso CME & geomagnetic activity o Electron fluxo Proton fluxo Aurora
• NRT forecast verification: o Flareso Geomagnetic storm activity
• Challenges in the way forward
• Summary
MOSWOC forecasting methods

Met Office Space Weather Operations Centre (MOSWOC)
• 24/7 space weather monitoring since 2014
• Set up in response to NRR
• Fully integrated in Met Office Operations Centre
• 2 space weather forecasters on duty (1 dedicated to space weather)
• Provides twice daily forecasts, & timely alerts & warnings
• 14 Forecasters, 6+ Scientists, 4 Programme managers, IT Developers
• National capability supporting: government, military & critical sectors (power, satellite operators, etc)
• Met Office owns risk on behalf of UK Government (Dept. for Business, Energy & Industrial Strategy (BEIS))
• Operations & associated research funded via rolling programme
Public webpages: https://www.metoffice.gov.uk/public/weather/space-weather/

MOSWOC twice daily space weather forecast
Summary for next 4 days
Solar analysis
CME arrival time at Earth predictions
4 day probability forecasts: geomagnetic storms, X-ray flares, high energy protons & high energy electron events
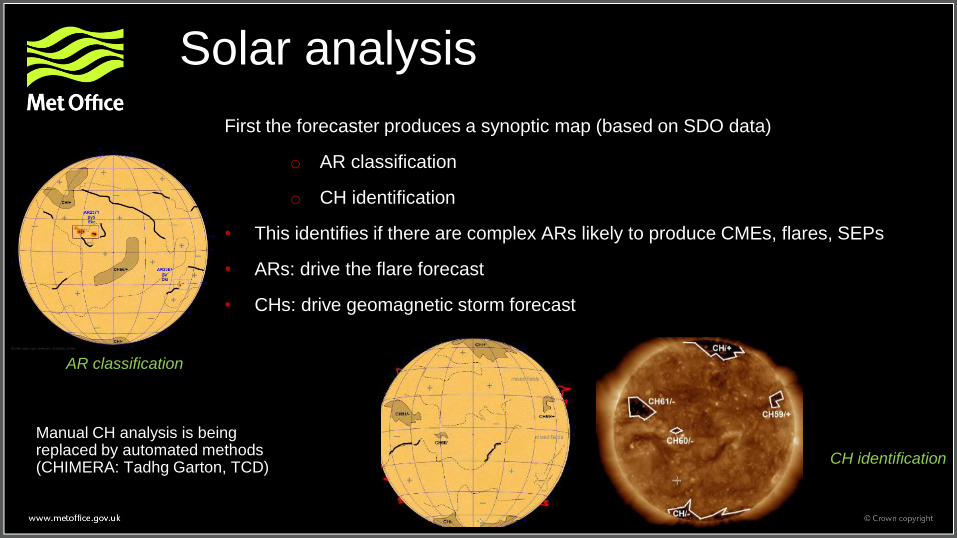
Solar analysis
First the forecaster produces a synoptic map (based on SDO data)
o AR classification
o CH identification
• This identifies if there are complex ARs likely to produce CMEs, flares, SEPs
• ARs: drive the flare forecast
• CHs: drive geomagnetic storm forecast
Manual CH analysis is being replaced by automated methods (CHIMERA: Tadhg Garton, TCD)
AR classification
CH identification
Flare forecast
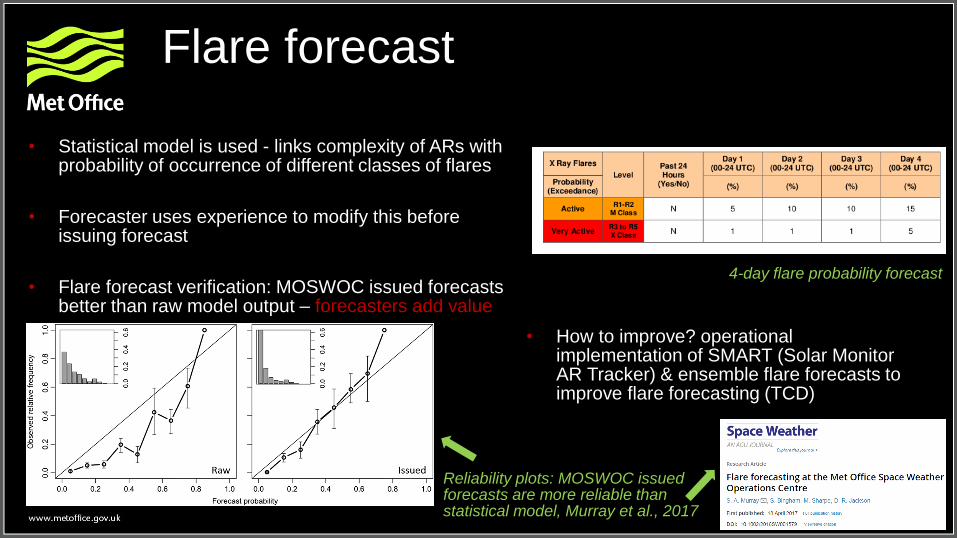
• Statistical model is used - links complexity of ARs with probability of occurrence of different classes of flares
• Forecaster uses experience to modify this before issuing forecast
• Flare forecast verification: MOSWOC issued forecasts better than raw model output – forecasters add value
Reliability plots: MOSWOC issued forecasts are more reliable than statistical model, Murray et al., 2017
4-day flare probability forecast
• How to improve? operational implementation of SMART (Solar Monitor AR Tracker) & ensemble flare forecasts to improve flare forecasting (TCD)
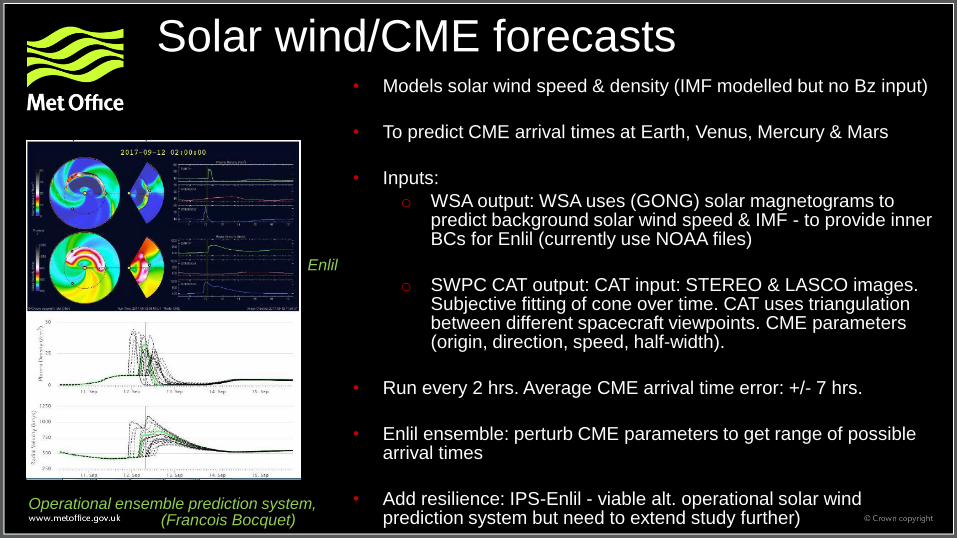
Solar wind/CME forecasts• Models solar wind speed & density (IMF modelled but no Bz input)
• To predict CME arrival times at Earth, Venus, Mercury & Mars
• Inputs:
o WSA output: WSA uses (GONG) solar magnetograms to predict background solar wind speed & IMF - to provide inner BCs for Enlil (currently use NOAA files)
o SWPC CAT output: CAT input: STEREO & LASCO images. Subjective fitting of cone over time. CAT uses triangulation between different spacecraft viewpoints. CME parameters (origin, direction, speed, half-width).
• Run every 2 hrs. Average CME arrival time error: +/- 7 hrs.
• Enlil ensemble: perturb CME parameters to get range of possible arrival times
• Add resilience: IPS-Enlil - viable alt. operational solar wind prediction system but need to extend study further)
Operational ensemble prediction system, (Francois Bocquet)
Enlil

CH influence
CHs influence solar wind and thus geomagnetic storms
How do we assess impact?
• CH perturbations should be picked up in magnetograms and thus WSA-Enlil initial conditions
• Use recurrence model:
o CH size can grow / shrink from one solar rotation to the next
o Driven by ACE/STEREO-A data & assumes spwx (today) = spwx (today - 27.25 days)
“Improving solar wind persistence forecasts: removing transient space weather events, & using observations away from the Sun-Earth line”, Kohutova, et al., Space Weather, 2016
Geomagnetic storm & CME forecasting - Products
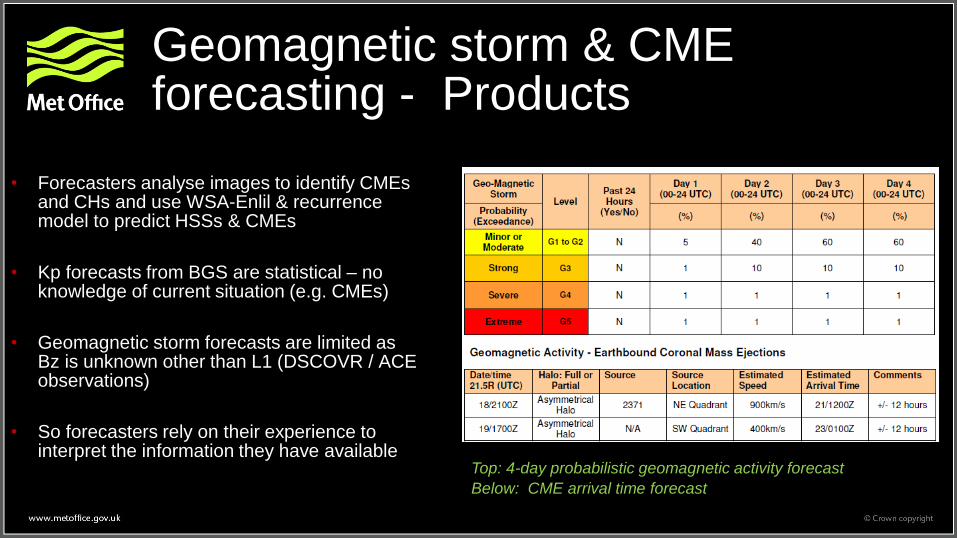
• Forecasters analyse images to identify CMEs and CHs and use WSA-Enlil & recurrence model to predict HSSs & CMEs
• Kp forecasts from BGS are statistical – no knowledge of current situation (e.g. CMEs)
• Geomagnetic storm forecasts are limited as Bz is unknown other than L1 (DSCOVR / ACE observations)
• So forecasters rely on their experience to interpret the information they have available
Top: 4-day probabilistic geomagnetic activity forecast
Below: CME arrival time forecast
High energy electron flux forecasts at GEO
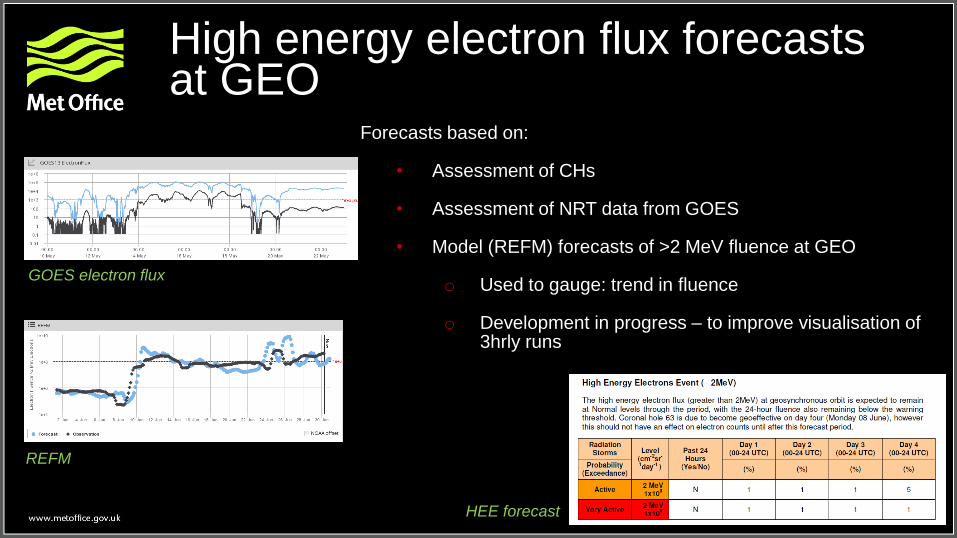
Forecasts based on:
• Assessment of CHs
• Assessment of NRT data from GOES
• Model (REFM) forecasts of >2 MeV fluence at GEO
o Used to gauge: trend in fluence
o Development in progress – to improve visualisation of 3hrly runs
REFM
GOES electron flux
HEE forecast
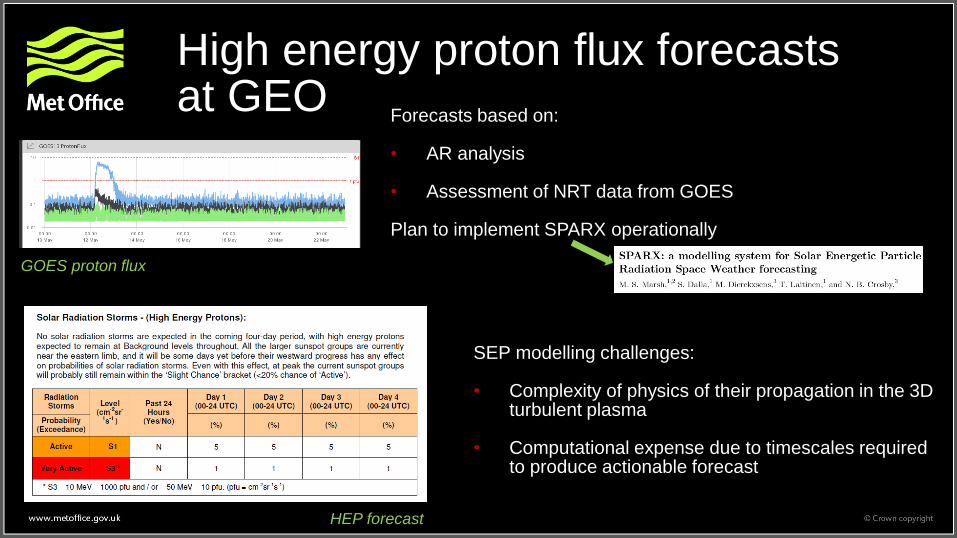
High energy proton flux forecasts at GEO
Forecasts based on:
• AR analysis
• Assessment of NRT data from GOES
Plan to implement SPARX operationally
GOES proton flux
HEP forecast
SEP modelling challenges:
• Complexity of physics of their propagation in the 3D turbulent plasma
• Computational expense due to timescales required to produce actionable forecast
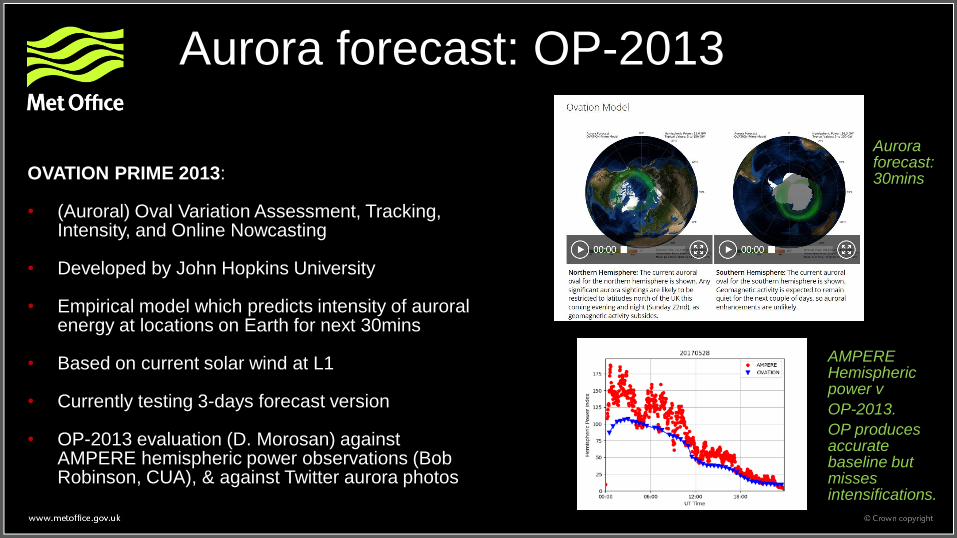
Aurora forecast: OP-2013
OVATION PRIME 2013:
• (Auroral) Oval Variation Assessment, Tracking, Intensity, and Online Nowcasting
• Developed by John Hopkins University
• Empirical model which predicts intensity of auroralenergy at locations on Earth for next 30mins
• Based on current solar wind at L1
• Currently testing 3-days forecast version
• OP-2013 evaluation (D. Morosan) against AMPERE hemispheric power observations (Bob Robinson, CUA), & against Twitter aurora photos
Aurora forecast: 30mins
AMPERE Hemispheric power v
OP-2013.
OP produces accurate baseline but misses intensifications.

Forecast verification
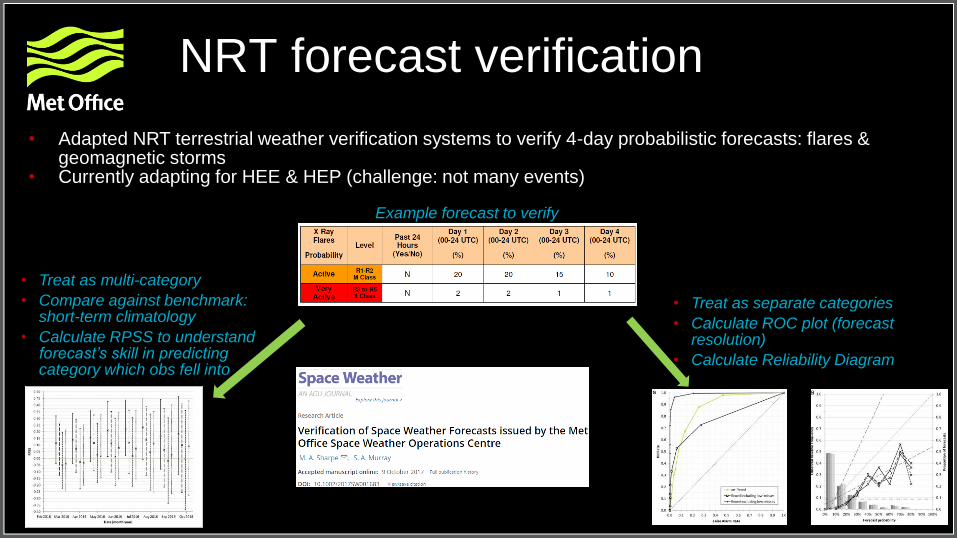
NRT forecast verification
• Adapted NRT terrestrial weather verification systems to verify 4-day probabilistic forecasts: flares & geomagnetic storms
• Currently adapting for HEE & HEP (challenge: not many events)
Example forecast to verify
• Treat as multi-category
• Compare against benchmark: short-term climatology
• Calculate RPSS to understand forecast’s skill in predicting category which obs fell into
• Treat as separate categories
• Calculate ROC plot (forecast resolution)
• Calculate Reliability Diagram

Forecast verification results
• Rolling 12-month analysis using RPSS indicates:
o Day 1 geomagnetic storm activity forecasts typically perform better than a climatology benchmark
o No consistent evidence for flare forecasts (flares are more difficult to predict)
• ROC & Reliability plots suggest: forecasts are skilful at identifying M-class flares & geomag storms,
although both were over-forecast
• It’s early days for operational space weather verification – not enough X-class flare occurrences since service
began, to allow meaningful verification
• Common meteorological verification techniques can be easily adapted for space weather
• Near real-time verification is particularly useful in the operational environment
• Current work: a space weather forecasting metric – monitoring overall progress in space weather forecasting
Challenges in the way forward
Some of the bigger challenges
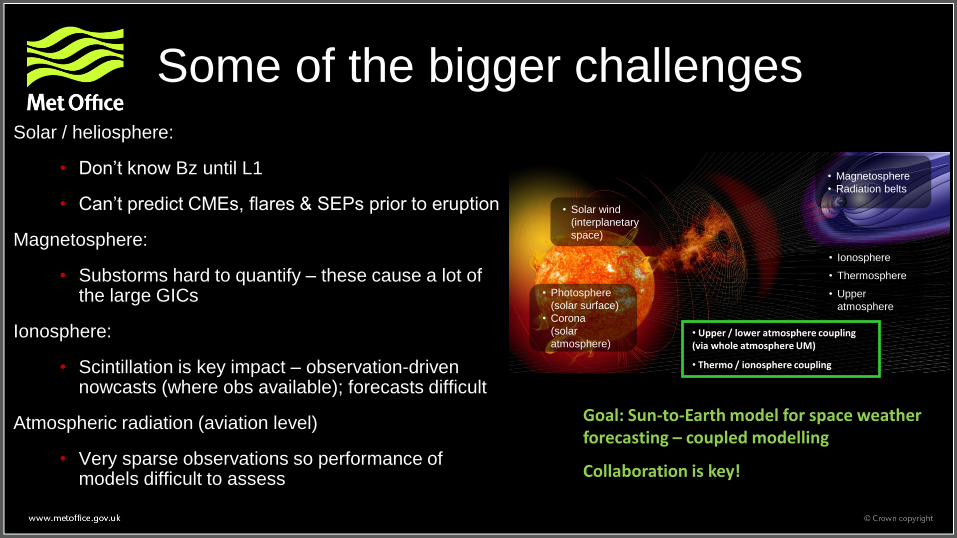
Solar / heliosphere:
• Don’t know Bz until L1
• Can’t predict CMEs, flares & SEPs prior to eruption
Magnetosphere:
• Substorms hard to quantify – these cause a lot of the large GICs
Ionosphere:
• Scintillation is key impact – observation-driven nowcasts (where obs available); forecasts difficult
Atmospheric radiation (aviation level)
• Very sparse observations so performance of models difficult to assess
• Photosphere
(solar surface)
• Corona
(solar
atmosphere)
• Solar wind
(interplanetary
space)
• Magnetosphere
• Radiation belts
• Upper / lower atmosphere coupling (via whole atmosphere UM)
• Thermo / ionosphere coupling
• Ionosphere
• Thermosphere
• Upper
atmosphere
Goal: Sun-to-Earth model for space weather forecasting – coupled modelling
Collaboration is key!
• Apart from DSCOVR and GOES, all observations “science” not “operational”
• Risk to CME monitoring as SOHO and STEREO are beyond planned lifetime. Solutions:
o L1 and L5 missions (USA, ESA, respectively) planned for ~2022 – operational missions
o Alternative observations – ground based radio telescopes (IPS)
• Magnetosphere – quite a lot of GEO obs but few elsewhere
• Ionosphere - well observed but thermosphere & radiation are not
Observation network challenges
Summary
Summary: some key challenges
• 24/7 operational requirements mean limitations (e.g. timescale on which model required to run to provide useful forecast)
• Bz forecasts need to be addressed - short warning time to prepare once we know speed and size of events
• Challenges in coupling models
• Unable to predict CMEs, flares & SEPs prior to eruption
• Sparse & non-operational observations
Collaboration between research and operational communities remains vital in order to implement suitable models & prediction techniques to forecast solar transient impacts

Thank you

Extra slides

CME forecasting: monitoring
CME may not yet be visible in coronagraph so forecaster monitors early warning signs:
• Monitor ARs for flares as can be associated with CMEs
• Any filaments disappeared? – often associated with CMEs
• Type II radio burst? – radio emission at CME shock front
• Any coronal dimming? – localised decrease in plasma density due to escaping plasma can indicate CME –difficult to automate as many intensity changes in corona
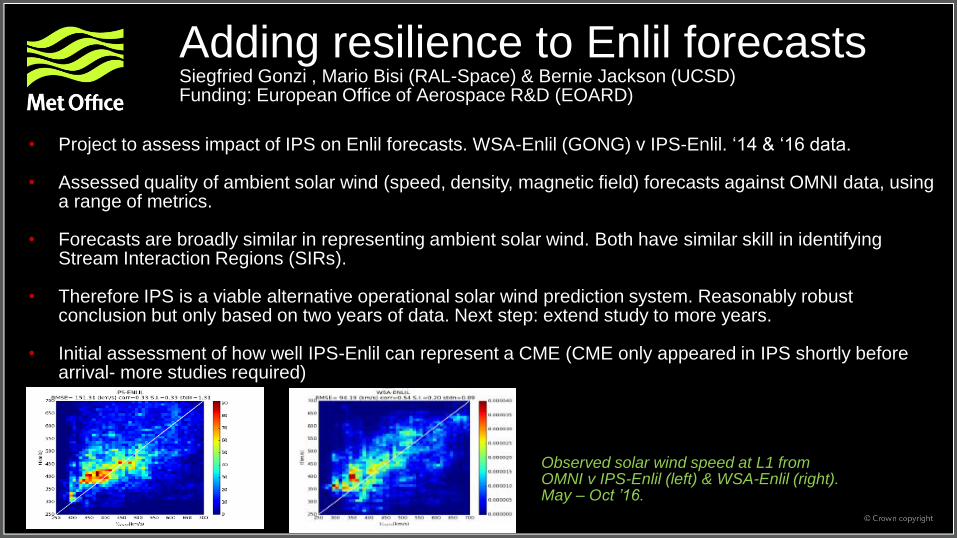
Adding resilience to Enlil forecastsSiegfried Gonzi , Mario Bisi (RAL-Space) & Bernie Jackson (UCSD)Funding: European Office of Aerospace R&D (EOARD)
• Project to assess impact of IPS on Enlil forecasts. WSA-Enlil (GONG) v IPS-Enlil. ‘14 & ‘16 data.
• Assessed quality of ambient solar wind (speed, density, magnetic field) forecasts against OMNI data, using a range of metrics.
• Forecasts are broadly similar in representing ambient solar wind. Both have similar skill in identifying Stream Interaction Regions (SIRs).
• Therefore IPS is a viable alternative operational solar wind prediction system. Reasonably robust conclusion but only based on two years of data. Next step: extend study to more years.
• Initial assessment of how well IPS-Enlil can represent a CME (CME only appeared in IPS shortly before arrival- more studies required)
Observed solar wind speed at L1 from OMNI v IPS-Enlil (left) & WSA-Enlil (right). May – Oct ’16.

OP-2013 evaluationDiana Morosan
Analysed 2 events in ‘17 using Twitter aurora photos. Location & date compared with OP-2013:
• Locations of visible aurora matched very well with OP-2013 predictions in UK, Ireland, Iceland, Sweden, Norway
• OP-2013 didn’t predict the aurora spotted in some SH locations but these sightings were just above the horizon – more investigation required
Hemispheric power comparison with AMPERE data (Bob Robinson, CUA):
• Obtained by averaging aurora energy flux over NH & SH
• HP measurements show that OP-2013 produces an accurate baseline HP for NH but misses transient intensifications in HP derived from AMPERE
• Transient intensifications are still being investigated to rule out instrument effects
AMPERE Hemispheric power v OP-2013
OP-2013 v Twitter sightings

IMAGE satellite comparisonMichaela Mooney: work in progress
• IMAGE satellite: Apr 2000 – Dec 2002, 3 onboard cameras including Wideband Imaging Camera (broadband UV images)
• Longden et al., 2010: technique to identify inner & outer edges of auroralemission from IMAGE data
• Use Longden inner & outer boundaries to create ‘truth’ & compare to OP-2013 probability nowcast
• ROC/reliability & RPS analysis
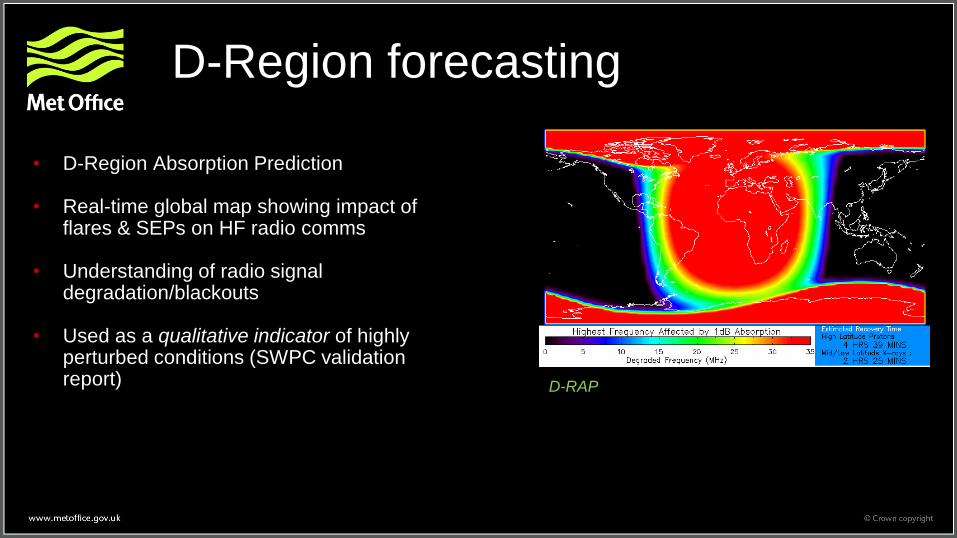
D-Region forecasting
• D-Region Absorption Prediction
• Real-time global map showing impact of flares & SEPs on HF radio comms
• Understanding of radio signal degradation/blackouts
• Used as a qualitative indicator of highly perturbed conditions (SWPC validation report) D-RAP

Towards Coupled Modelling
Thermosphere / ionosphere:
• Raising UM (to ~150 km) in development + coupling to TIEGCM
• Eventually whole atmosphere UM (to ~600 km) to couple with other spwxmodels
Magnetosphere:
• SpWx Modelling Framework (SWMF) (U. of Michigan – used at SWPC) being implemented and tested
• Will enable Magnetosphere / Ionosphere coupling
• Solar wind / magnetosphere coupling, but issues with Bz
• Photosphere
(solar surface)
• Corona
(solar atmosphere)
• Solar wind
(interplanetary
space)
• Magnetosphere
• Radiation belts
•Upper / lower atmosphere coupling (via whole atmosphere UM)
•Thermo / ionosphere coupling
• Ionosphere
• Thermosphere
• Upper
atmosphere
Goal: Sun-to-Earth model for spwx forecasting
Collaboration is key!
Related Documents