© Crown copyright Met Office Operational Shelf Seas Forecasting with SST data assimilation using NEMO-FOAM for the Northwest European Shelf COSS-TT workshop in Miami Jan 2012 O’Dea EJ, Arnold AK, Edwards K, Furner R, Hyder P, Mahdon RD, Martin M, Siddorn J, While J

Welcome message from author
This document is posted to help you gain knowledge. Please leave a comment to let me know what you think about it! Share it to your friends and learn new things together.
Transcript
© Crown copyright Met Office
Operational Shelf Seas Forecasting with SST data assimilation using NEMO-FOAM for the Northwest European ShelfCOSS-TT workshop in Miami Jan 2012
O’Dea EJ, Arnold AK, Edwards K, Furner R, Hyder P, Mahdon RD, Martin M, Siddorn J, While J
© Crown copyright Met Office
Talk Outline
• NWS MFC and AMM
• AMM7 • Physics• Data assimilation• ERSEM
• Operational Monitoring and validation
© Crown copyright Met Office
MyOcean Monitoring and Forecasting Centre for the North West European Continental Shelf (NWS MFC ):
• One of the operational production centres of the GMES FP7 MyOcean project
• Aims to provide the fully validated ocean hindcast, nowcast and forecast products, free of charge at the point of delivery
• Services are in four areas of use: maritime safety; marine resources; coastal and marine environment; and weather, seasonal forecasting & climate
• The MyOcean NWS MFC has built upon the NOOS (North West Shelf Operational Oceanography System ) collaboration and cooperation to deliver improved products, systems and services for users of the Marine Core Services in the NOOS region
© Crown copyright Met Office
NWS MFC: Products + Users• Safety at sea: Ship routing services, offshore operations and
search and rescue operations + oil spill response and remediation.
• Key users: European Maritime Safety Agency (EMSA), users delivering assessments for the Convention for the Marine Environment of the North East Atlantic (OSPAR) and national maritime safety agencies.
• Protection and the sustainable management of living marine resources: aquaculture, fishery research or regional fishery organisations.
• Key users:ICES (International Council for the Exploitation of the Sea ), the FAO (Food and Agriculture Organization of the United Nations ) and national fisheries agencies.
• Water quality monitoring and pollution control• Key users in this context are EEA (The European Environment
Agency ), OSPAR and national environmental agencies. • Support of weather, seasonal and climate prediction services.
• Key Users National and European Weather Services and Climate Research centres should benefit from the NWS MFC products, e.g. bottom boundary conditions for atmospheric models.
© Crown copyright Met Office
NWS MFC Service Provision
• Provided by the operational meteorological centres of the UK and Norway (the Met Office and met.no), with the nominal service being provided by the Met Office and a backup forecast being available to operational users from met.no.
• The hindcast products are provided by the Institute of Marine Research, Bergen (IMR) and the National Oceanography Centre, Liverpool (NOC).
• The dissemination of products is from operationally supported servers maintained at the Met Office and met.no, with full redundancy in the production.
© Crown copyright Met Office
NWS MFC and AMM
• The Met Office forecast production has been updated from the Medium-Resolution Continental Shelf (MRCS; Siddorn et al., 2006) configuration based upon the POLCOMS ocean model (Holt and James, 2001) coupled with the ERSEM ecosystem model (Blackford et al., 2004) system to the Atlantic-Margin Model (AMM7)
• Uses Optimal Interpolation (OI) data assimilation scheme (Martin et al, 2007) already used at the Met Office for the open ocean Forecasting Ocean Assimilation Model (FOAM; Storkey et al., 2010) suite of configurations.
© Crown copyright Met Office
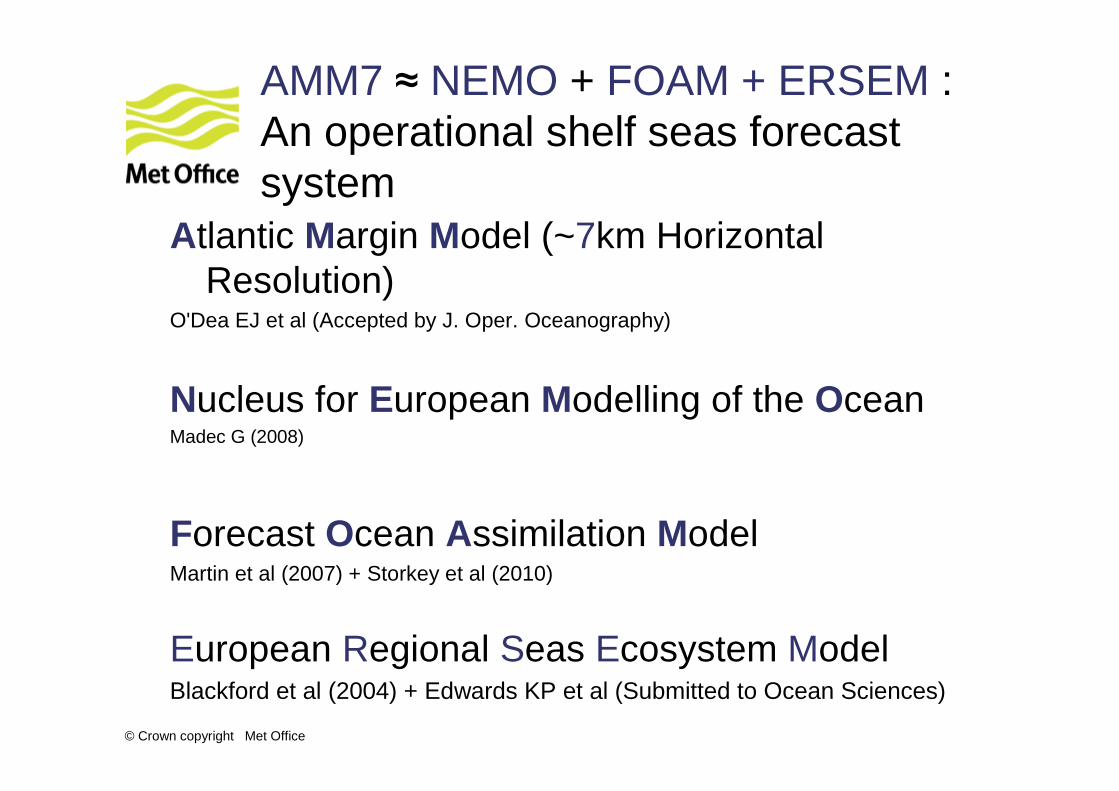
AMM7 � NEMO + FOAM + ERSEM :An operational shelf seas forecast system
Atlantic Margin Model (~7km Horizontal Resolution)
O'Dea EJ et al (Accepted by J. Oper. Oceanography)
Nucleus for European Modelling of the OceanMadec G (2008)
Forecast Ocean Assimilation ModelMartin et al (2007) + Storkey et al (2010)
European Regional Seas Ecosystem ModelBlackford et al (2004) + Edwards KP et al (Submitted to Ocean Sciences)
© Crown copyright Met Office
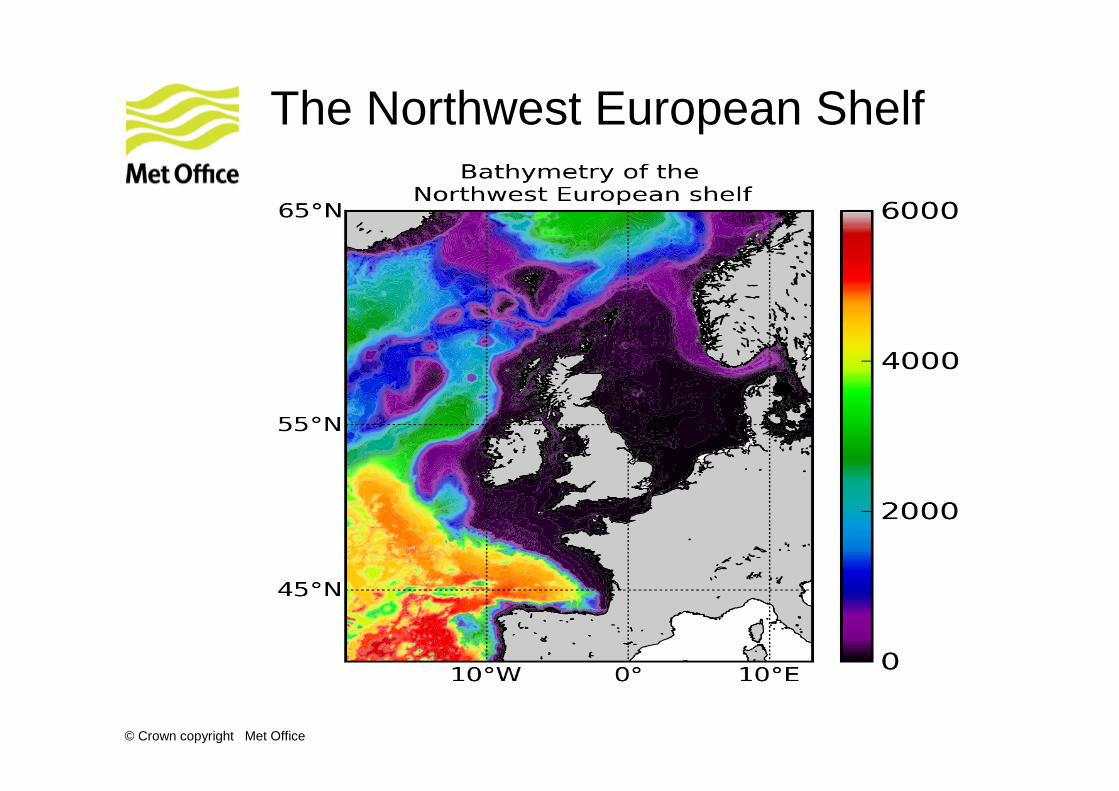
The Northwest European Shelf
© Crown copyright Met Office
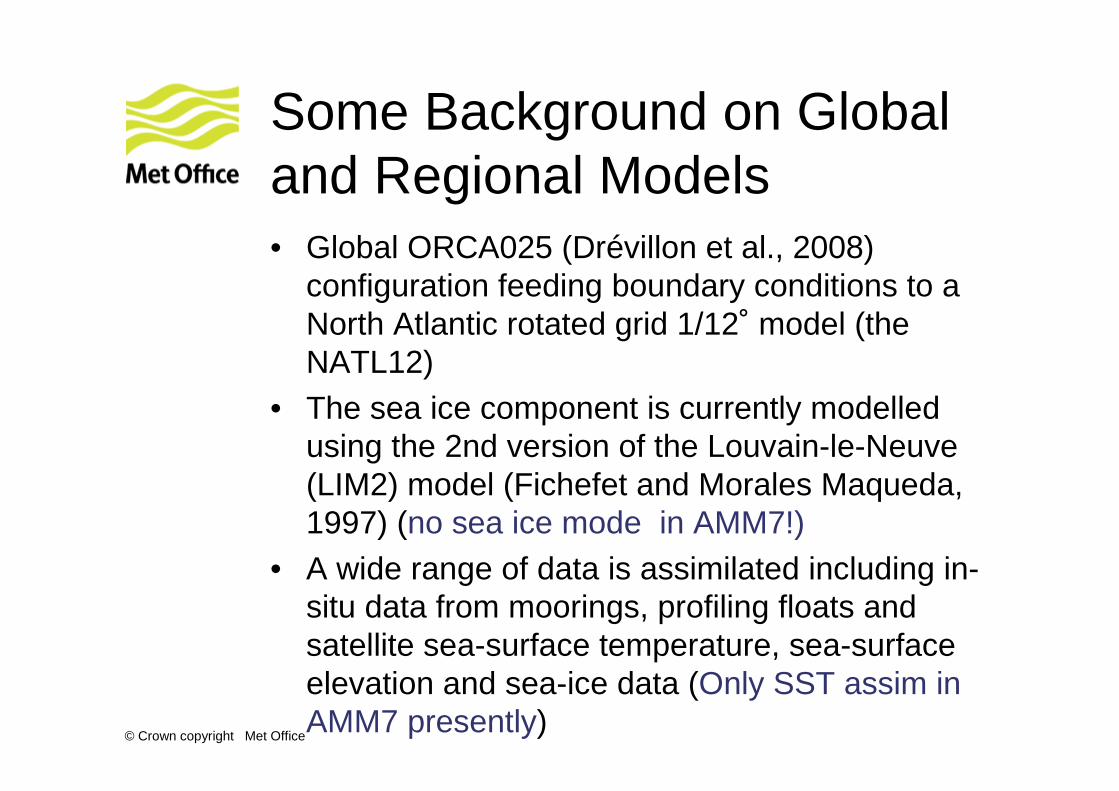
Some Background on Global and Regional Models• Global ORCA025 (Drévillon et al., 2008)
configuration feeding boundary conditions to a North Atlantic rotated grid 1/12˚ model (the NATL12)
• The sea ice component is currently modelled using the 2nd version of the Louvain-le-Neuve(LIM2) model (Fichefet and Morales Maqueda, 1997) (no sea ice mode in AMM7!)
• A wide range of data is assimilated including in-situ data from moorings, profiling floats andsatellite sea-surface temperature, sea-surface elevation and sea-ice data (Only SST assim in AMM7 presently)
© Crown copyright Met Office
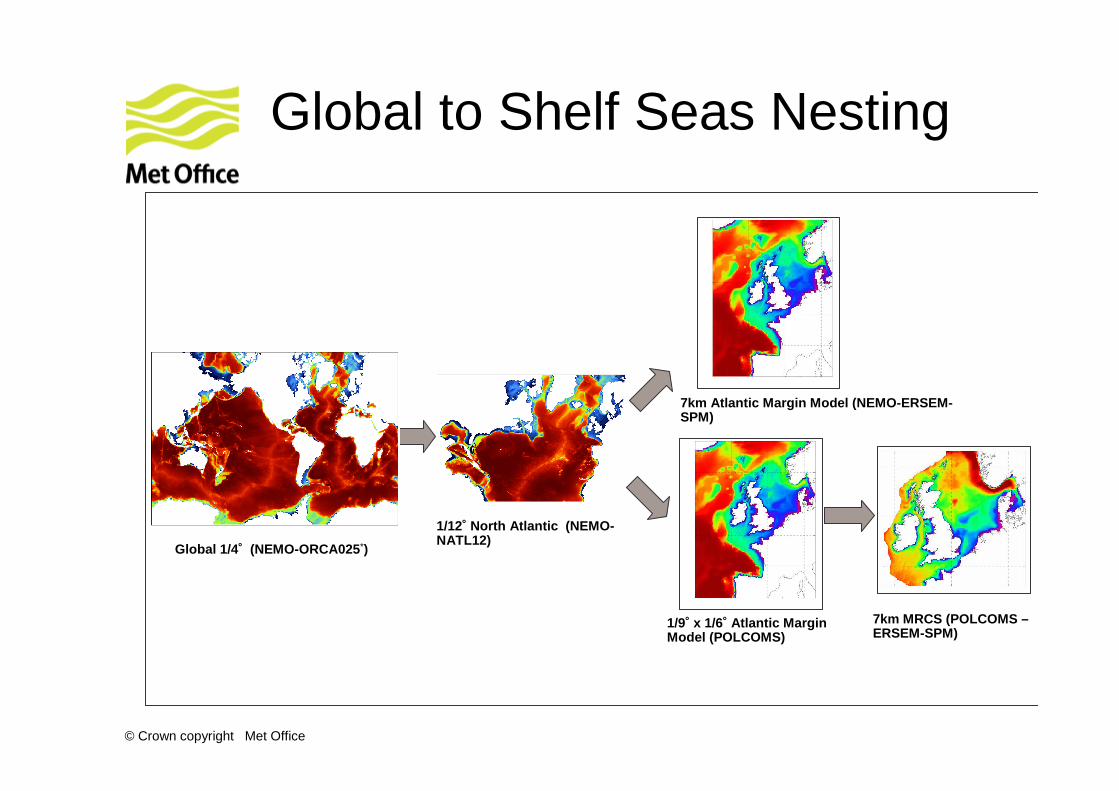
Global to Shelf Seas Nesting
1/12˚ North Atlantic (NEMO-NATL12)
7km Atlantic Margin Model (NEMO-ERSEM-SPM)
Global 1/4˚ (NEMO-ORCA025 *)
7km MRCS (POLCOMS –ERSEM-SPM)
1/9˚ x 1/6˚ Atlantic Margin Model (POLCOMS)
© Crown copyright Met Office
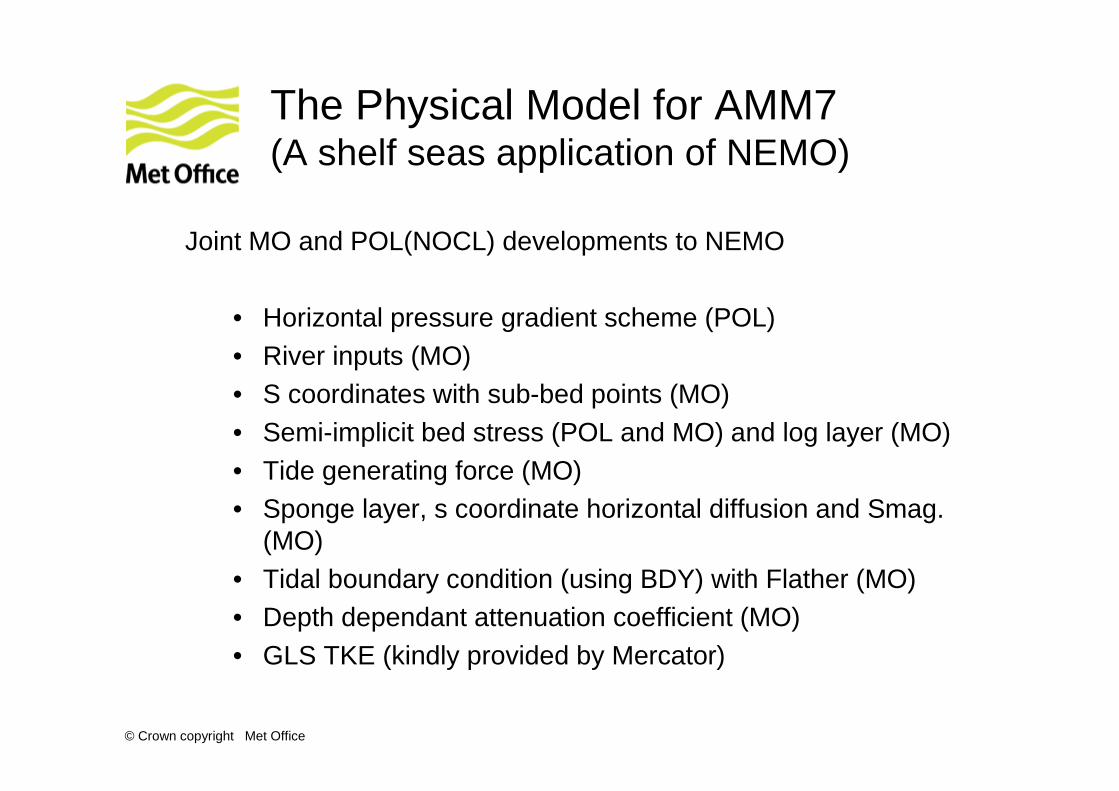
The Physical Model for AMM7(A shelf seas application of NEMO)
Joint MO and POL(NOCL) developments to NEMO
• Horizontal pressure gradient scheme (POL) • River inputs (MO)• S coordinates with sub-bed points (MO)• Semi-implicit bed stress (POL and MO) and log layer (MO)• Tide generating force (MO)• Sponge layer, s coordinate horizontal diffusion and Smag.
(MO)• Tidal boundary condition (using BDY) with Flather (MO)• Depth dependant attenuation coefficient (MO)• GLS TKE (kindly provided by Mercator)
© Crown copyright Met Office
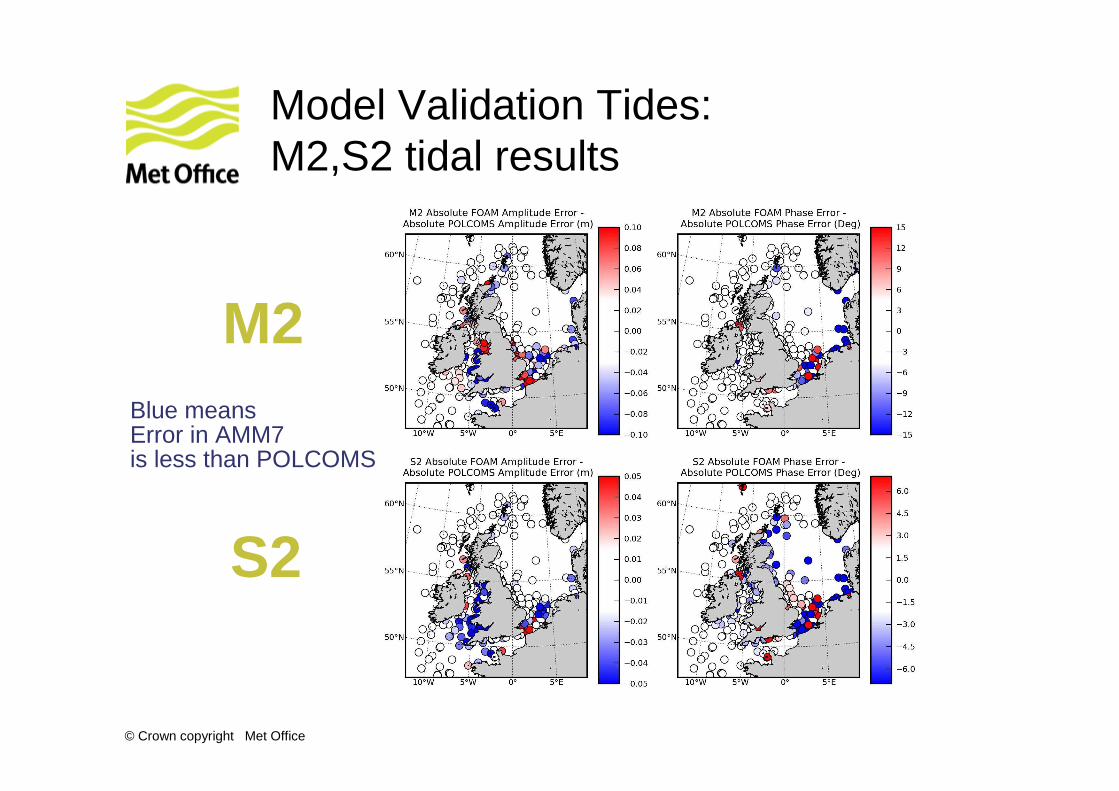
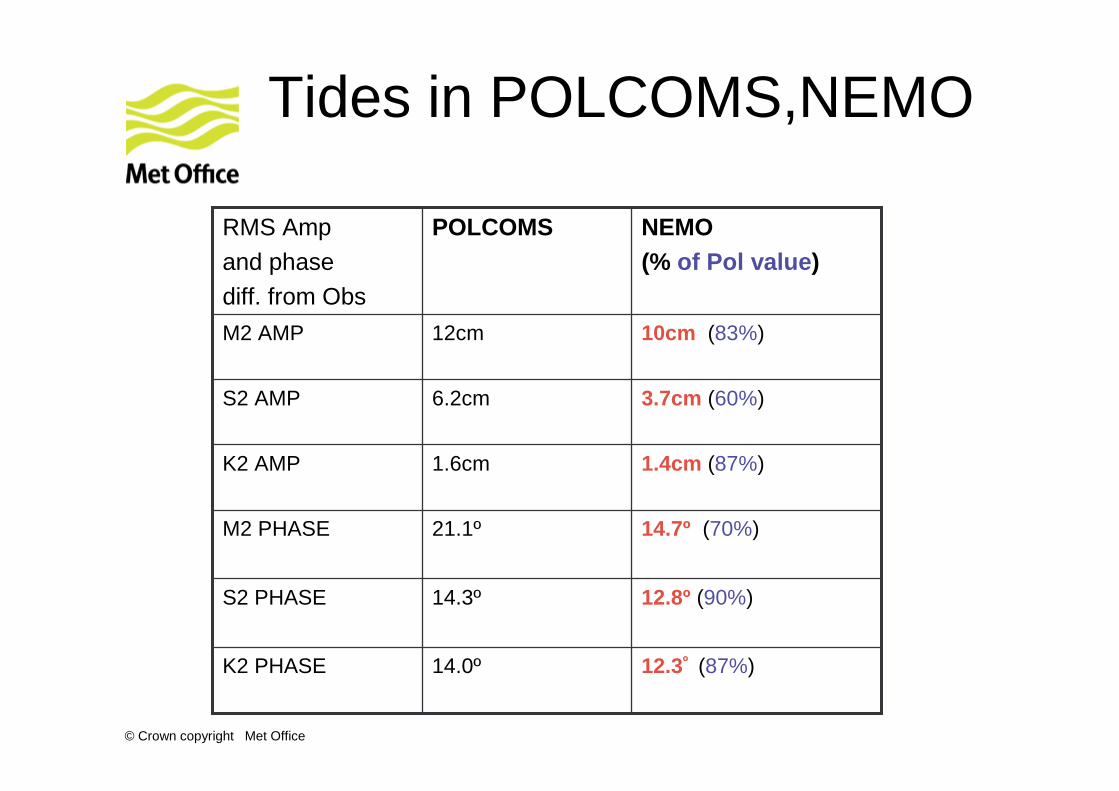
Model Validation Tides:M2,S2 tidal results
M2
S2
Blue meansError in AMM7is less than POLCOMS
© Crown copyright Met Office
12.3º (87%)14.0ºK2 PHASE
12.8º (90%)14.3ºS2 PHASE
14.7º (70%)21.1ºM2 PHASE
1.4cm (87%)1.6cmK2 AMP
3.7cm (60%)6.2cmS2 AMP
10cm (83%)12cmM2 AMP
NEMO(% of Pol value )
POLCOMSRMS Amp
and phase
diff. from Obs
Tides in POLCOMS,NEMO
© Crown copyright Met Office
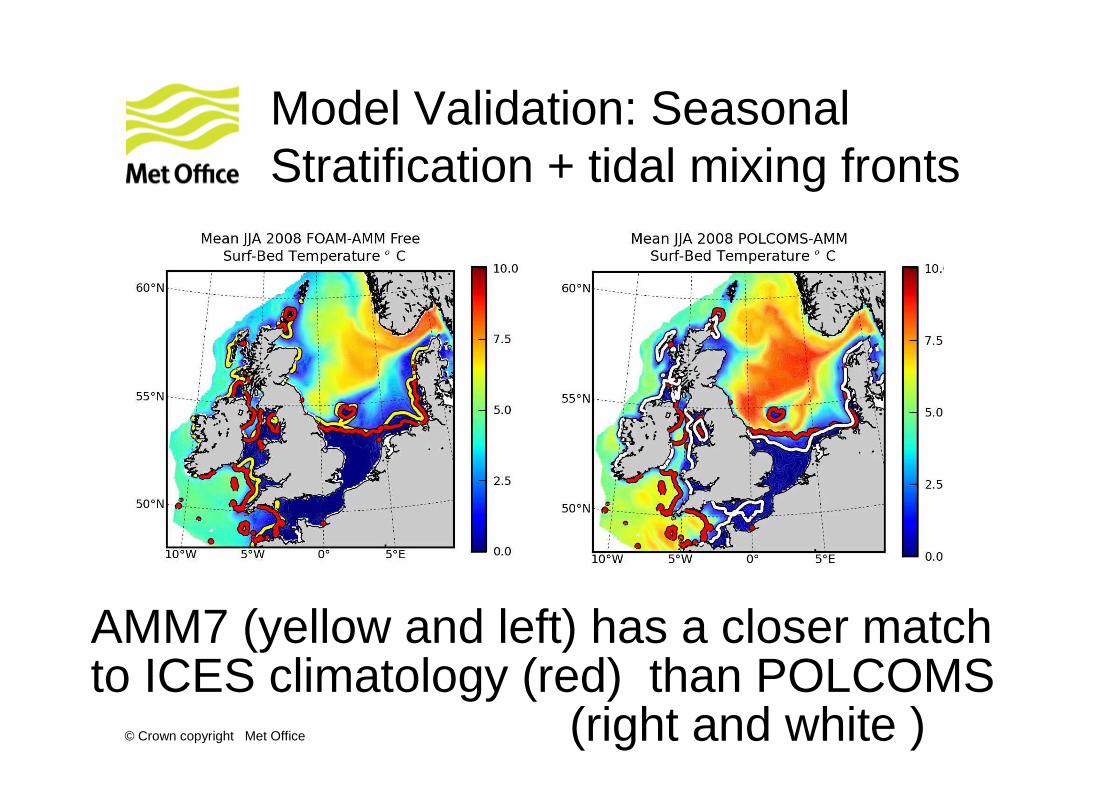
Model Validation: Seasonal Stratification + tidal mixing fronts
AMM7 (yellow and left) has a closer match to ICES climatology (red) than POLCOMS
(right and white )
© Crown copyright Met Office
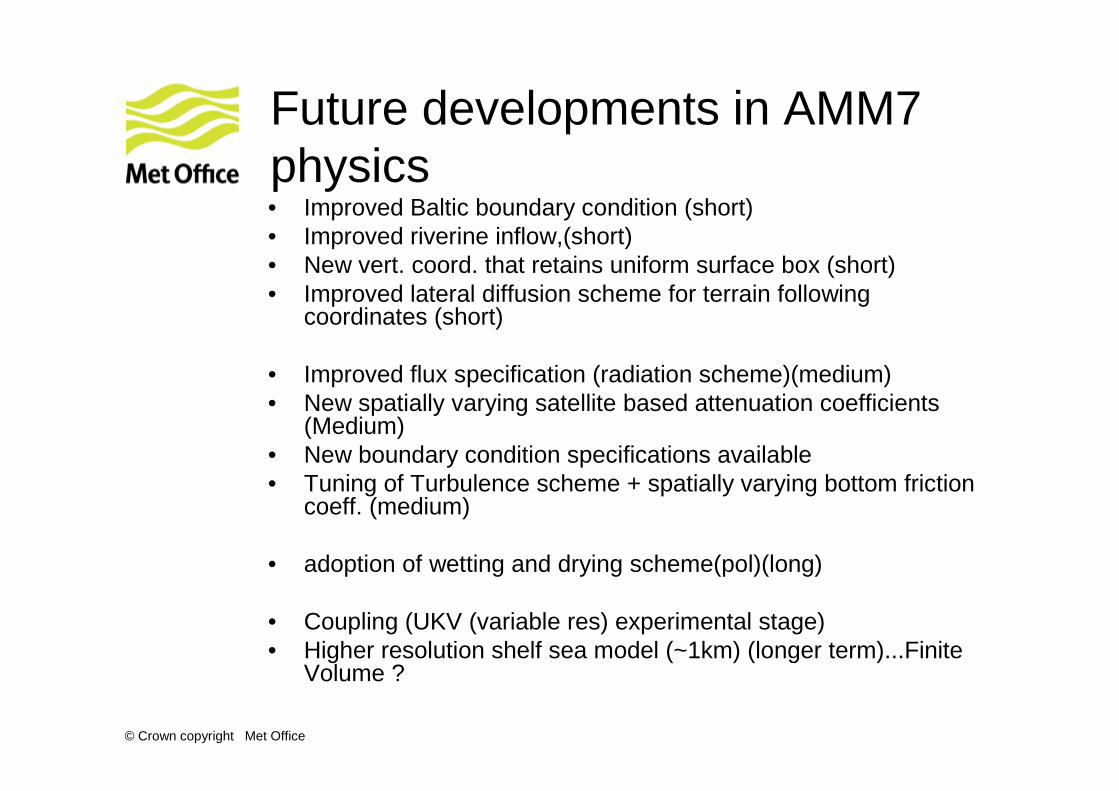
Future developments in AMM7 physics • Improved Baltic boundary condition (short)• Improved riverine inflow,(short) • New vert. coord. that retains uniform surface box (short)• Improved lateral diffusion scheme for terrain following
coordinates (short)
• Improved flux specification (radiation scheme)(medium)• New spatially varying satellite based attenuation coefficients
(Medium)• New boundary condition specifications available • Tuning of Turbulence scheme + spatially varying bottom friction
coeff. (medium)
• adoption of wetting and drying scheme(pol)(long)
• Coupling (UKV (variable res) experimental stage)• Higher resolution shelf sea model (~1km) (longer term)...Finite
Volume ?
© Crown copyright Met Office
Data Assimilation James While, Matthew Martin
© Crown copyright Met Office
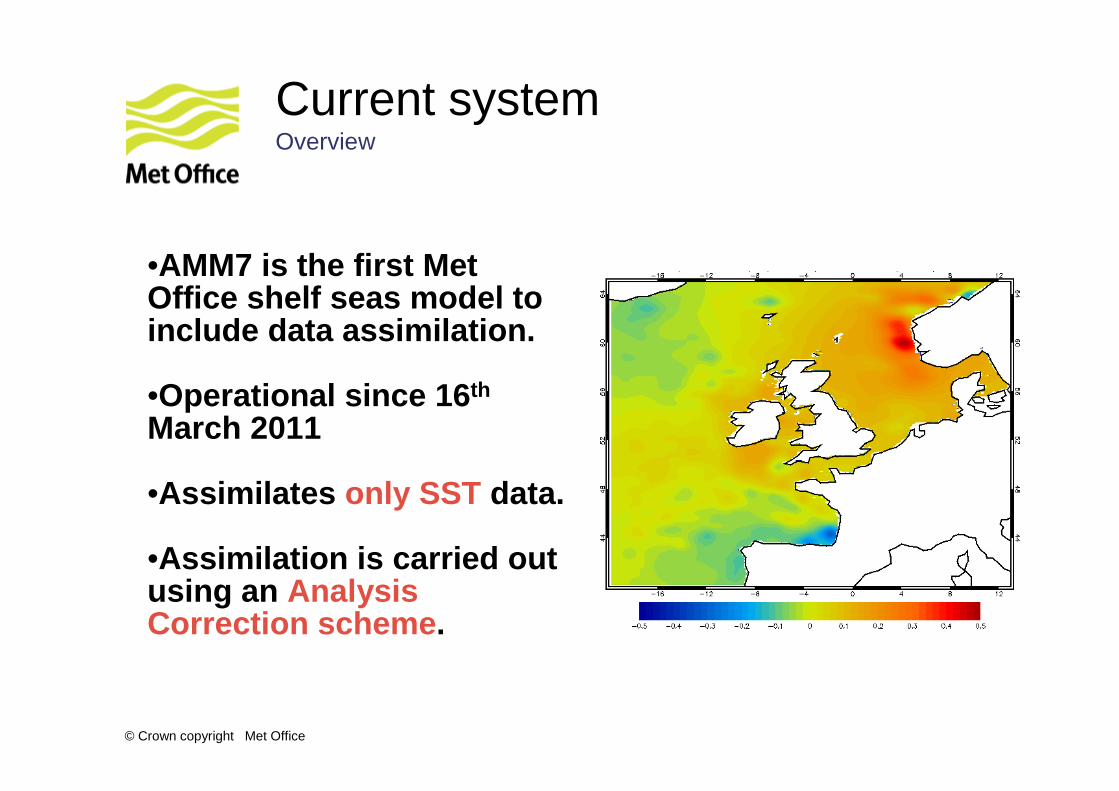
Current system Overview
•AMM7 is the first Met Office shelf seas model to include data assimilation.
•Operational since 16 th
March 2011
•Assimilates only SST data.
•Assimilation is carried out using an Analysis Correction scheme .
© Crown copyright Met Office
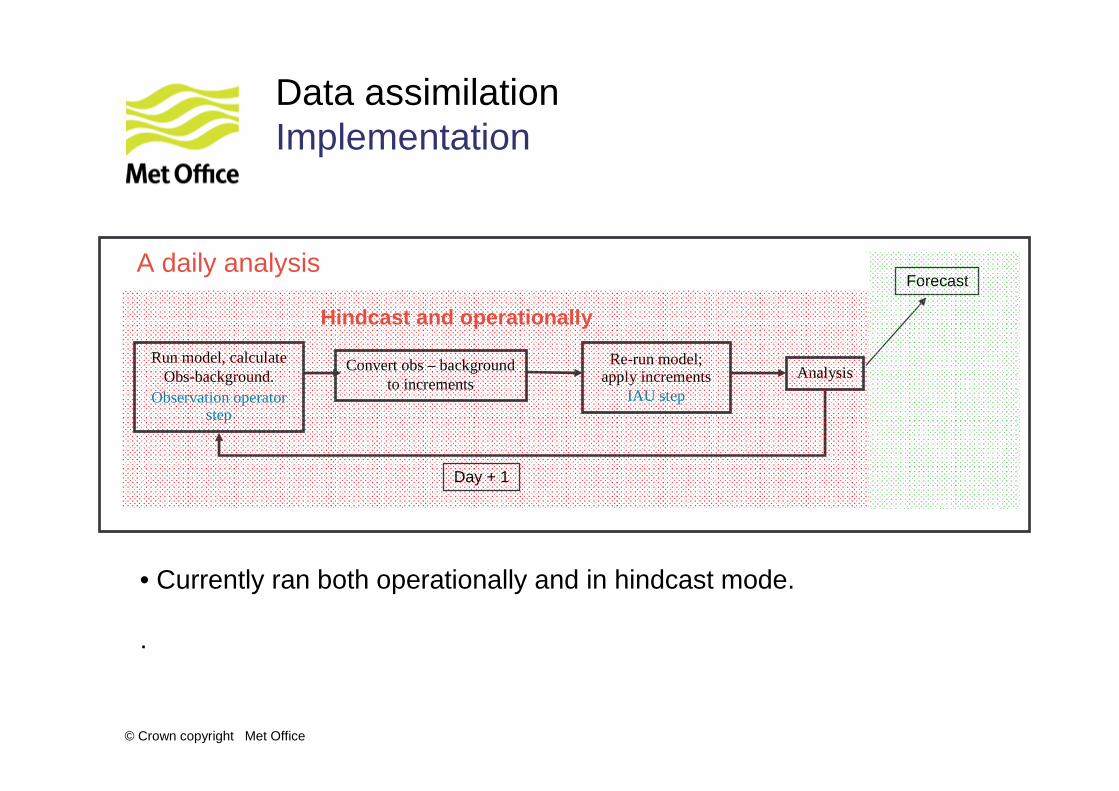
Run model, calculate Obs-background.
Observation operator step
Convert obs – backgroundto increments
Re-run model; apply increments
IAU step
Analysis
A daily analysisForecast
Day + 1
Hindcast and operationally
• Currently ran both operationally and in hindcast mode.
.
Data assimilationImplementation
© Crown copyright Met Office
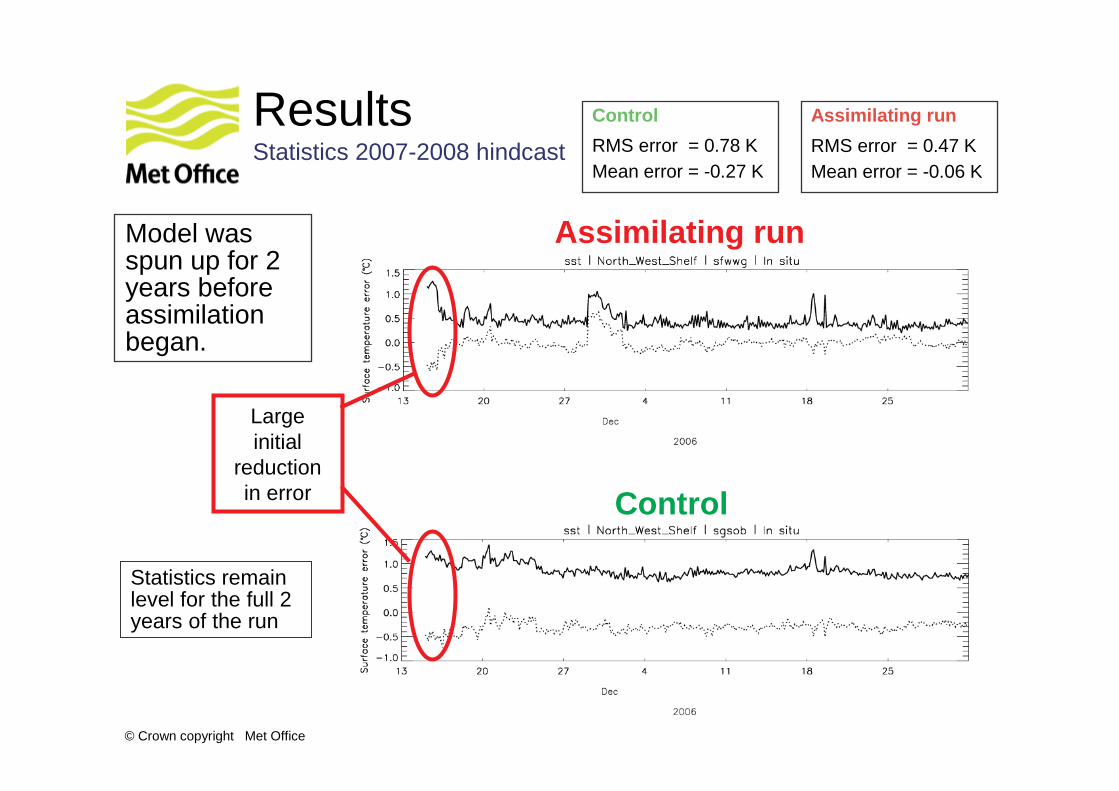
Results Statistics 2007-2008 hindcast
Control
Assimilating run
Large initial
reduction in error
Model was spun up for 2 years before assimilation began.
RMS error = 0.47 KMean error = -0.06 K
Assimilating run
RMS error = 0.78 KMean error = -0.27 K
Control
Statistics remainlevel for the full 2 years of the run
© Crown copyright Met Office
0.5
0.75
0.55
0.75
0.65
0.9
0.22
0.34
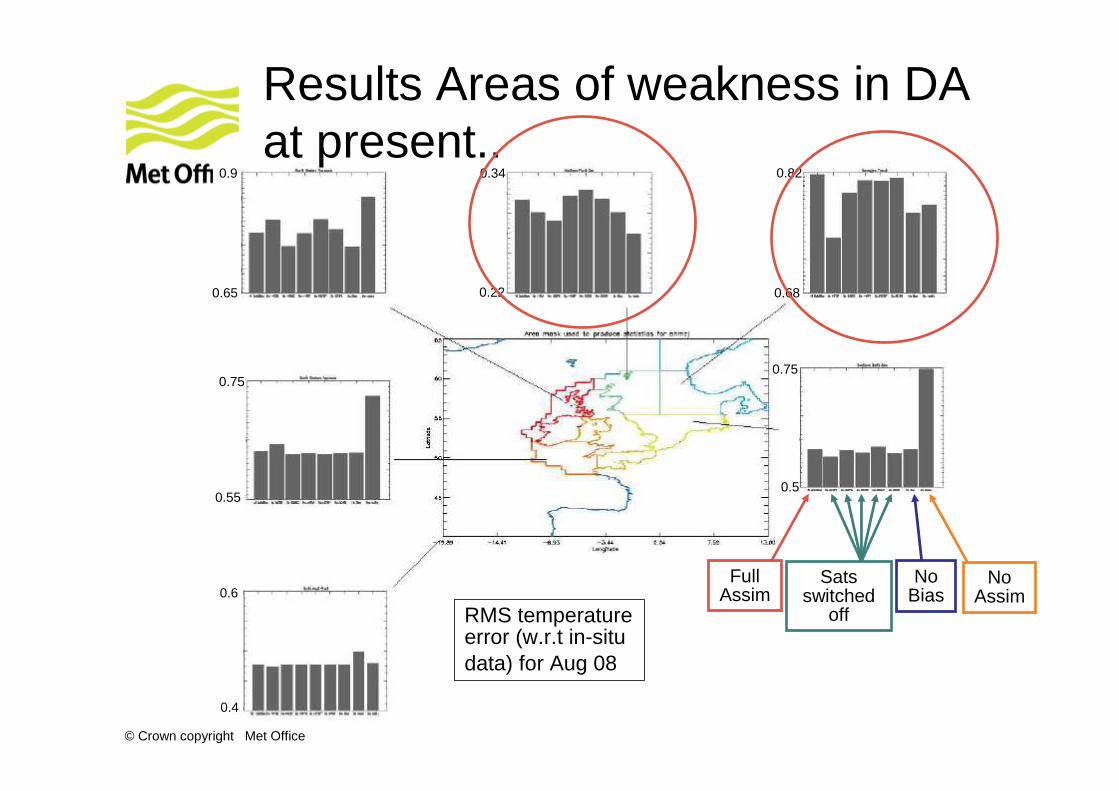
Results Areas of weakness in DA at present..
0.68
0.82
0.6
0.4
RMS temperature error (w.r.t in-situ data) for Aug 08
FullAssim
NoAssim
NoBias
Sats switched
off
© Crown copyright Met Office
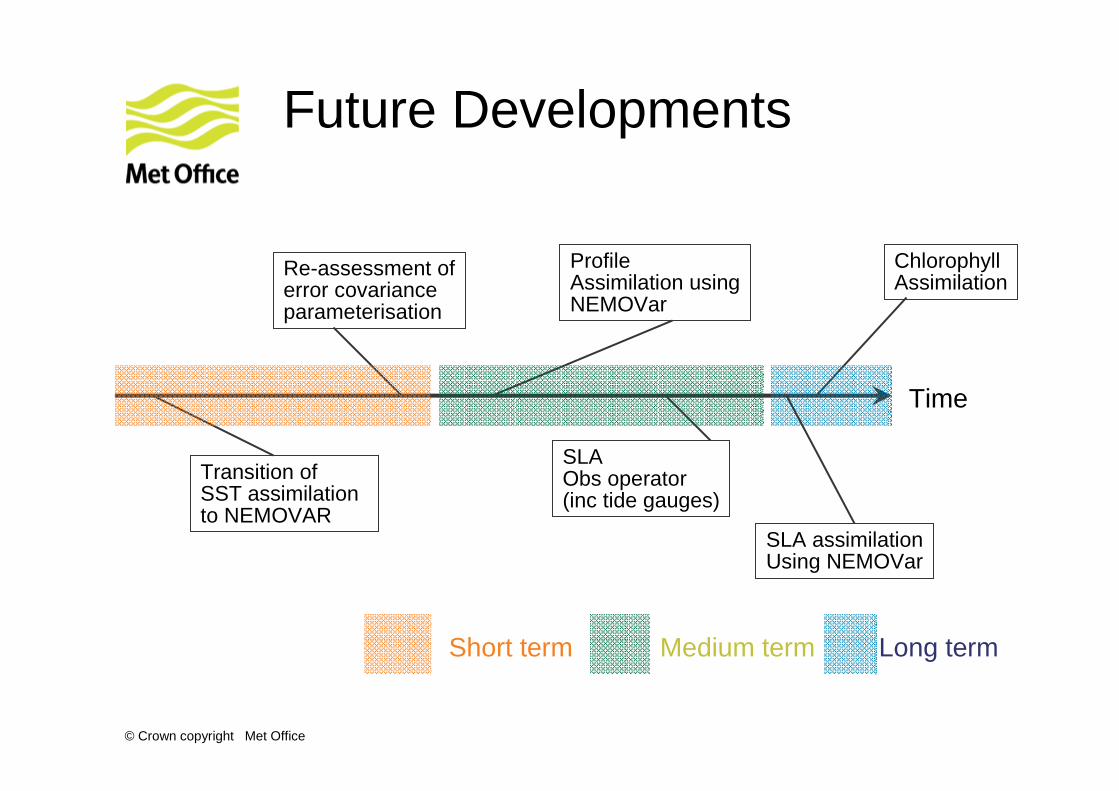
Time
Transition ofSST assimilation to NEMOVAR
Re-assessment oferror covarianceparameterisation
ProfileAssimilation usingNEMOVar
SLA assimilationUsing NEMOVar
Chlorophyll Assimilation
Medium term Long term
SLAObs operator(inc tide gauges)
Short term
Future Developments

© Crown copyright Met Office
NEMO-ERSEMKaren Edwards & Ray Mahdon
© Crown copyright Met Office
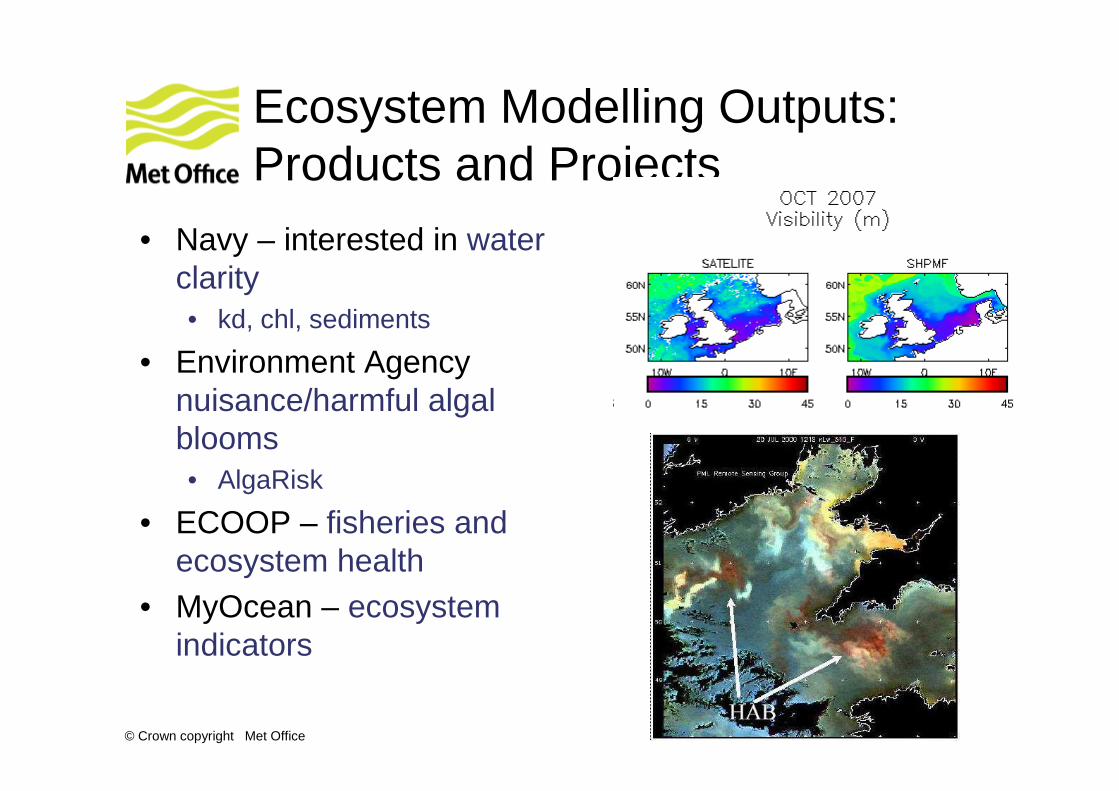
Ecosystem Modelling Outputs:Products and Projects
• Navy – interested in water clarity• kd, chl, sediments
• Environment Agency –nuisance/harmful algal blooms• AlgaRisk
• ECOOP – fisheries and ecosystem health
• MyOcean – ecosystem indicators
From biology
© Crown copyright Met Office
NEMO-ERSEM validation:
• Hindcast completed for 2007 & 2008 with and without SST assimilation.
• Satellite chlorophyll:• use of OBS_STATS from logchl feedback files.• Monthly and seasonal map views & stats.
• In situ data at 4 smartbuoy locations plus PML’sL4.
• WOA nutrients.• Satellite sediment and visibility.
© Crown copyright Met Office
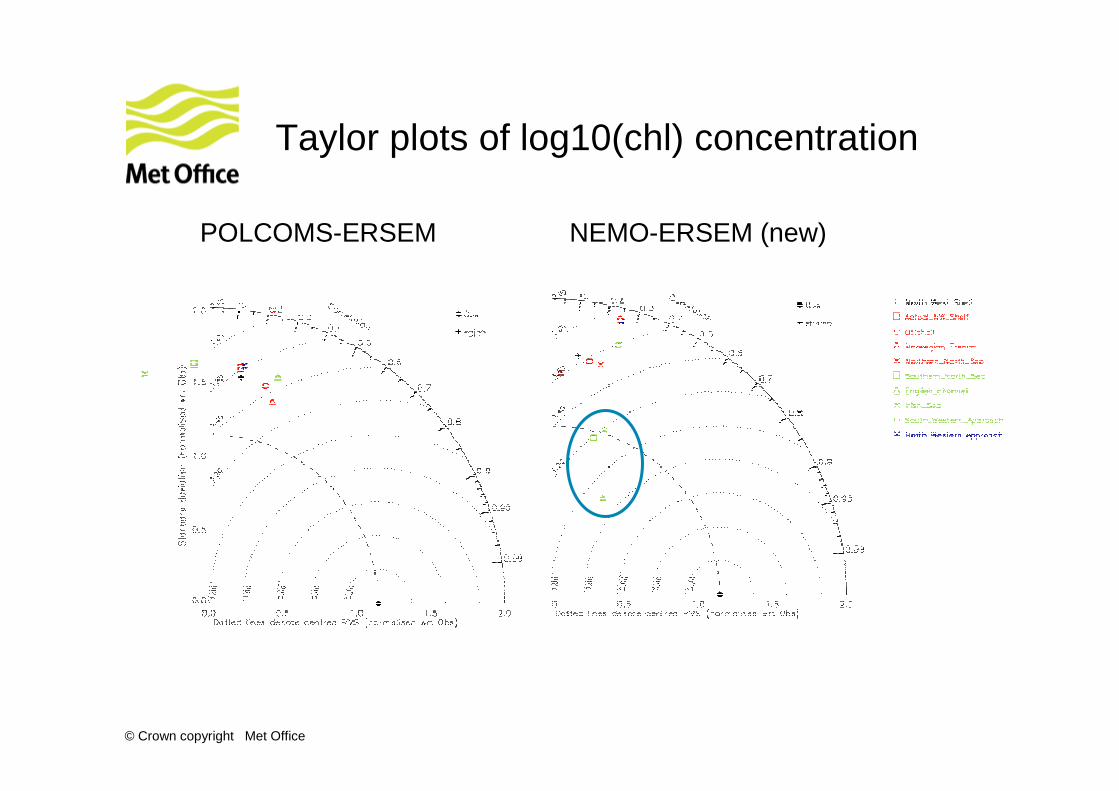
Taylor plots of log10(chl) concentration
POLCOMS-ERSEM NEMO-ERSEM (new)
© Crown copyright Met Office
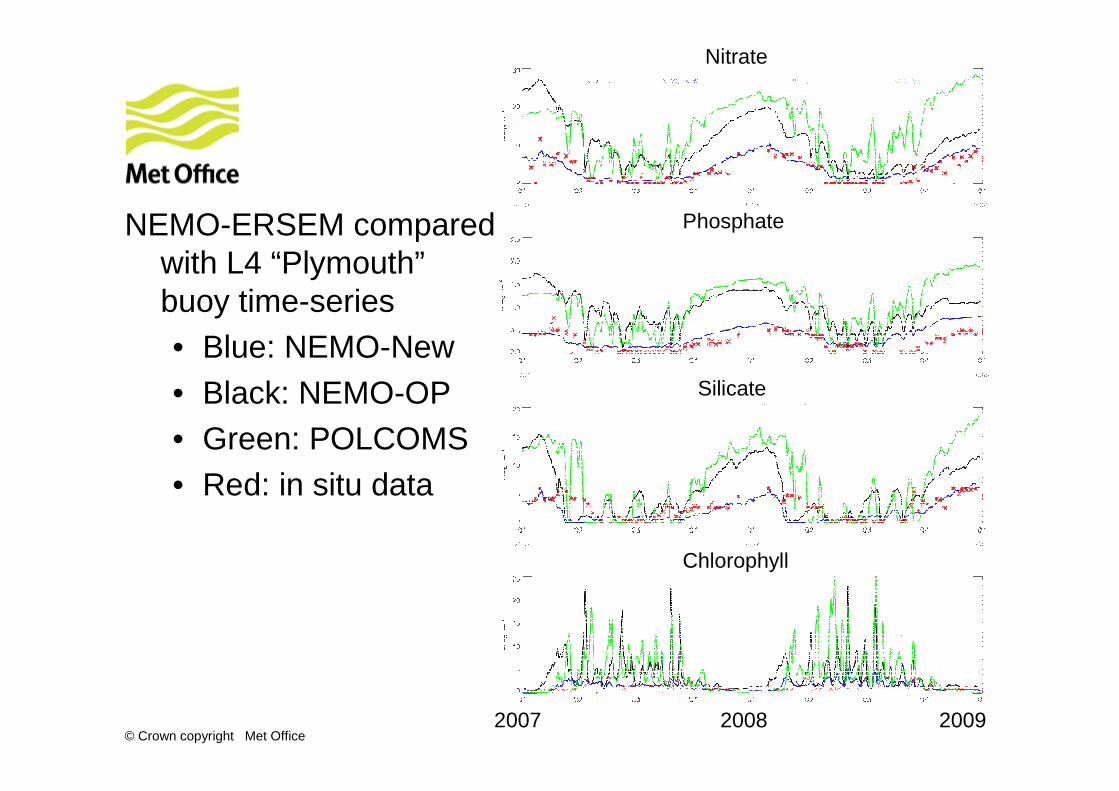
NEMO-ERSEM compared with L4 “Plymouth”buoy time-series • Blue: NEMO-New • Black: NEMO-OP• Green: POLCOMS• Red: in situ data
Nitrate
Phosphate
Silicate
Chlorophyll
200920082007
© Crown copyright Met Office
NEMO-ERSEM Plans
For the next operational change we are planning the following:• Tuning of the ERSEM parameter set.
• Forcing at the open boundaries with monthly WOA nutrient data.
• Updated initial conditions from fully spun-up benthic fields that are in-sync with the pelagic model.
Currently testing:
• Updates to SPM model and visibility calculation.
• Updated river climatology for both UK and European rivers – including new sediment climatology.
In general, the NEMO-ERSEM model performs well when compared to the POLCOMS-ERSEM system on the MRCS domain and shows some skill.
© Crown copyright Met Office
Operational Monitoring + Validation
© Crown copyright Met Office
Monitoring + validation
There are two main functions to the real-time validation:
1) Daily monitoring of products to detect major problems, and to identify significant features in the forecast
2) Monthly examination of accuracy statistics to detect gradual deteriorations in the quality of products, and to confirm that the accuracy level is consistent with the results of the calibration hindcast.
© Crown copyright Met Office
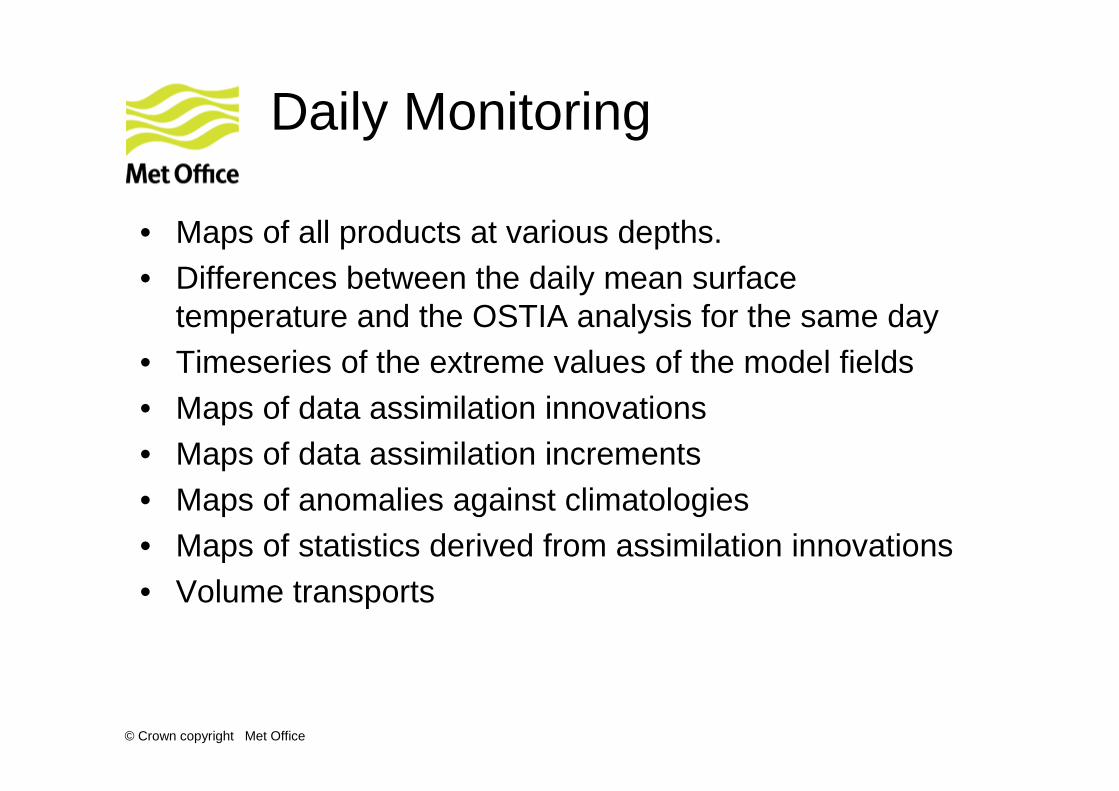
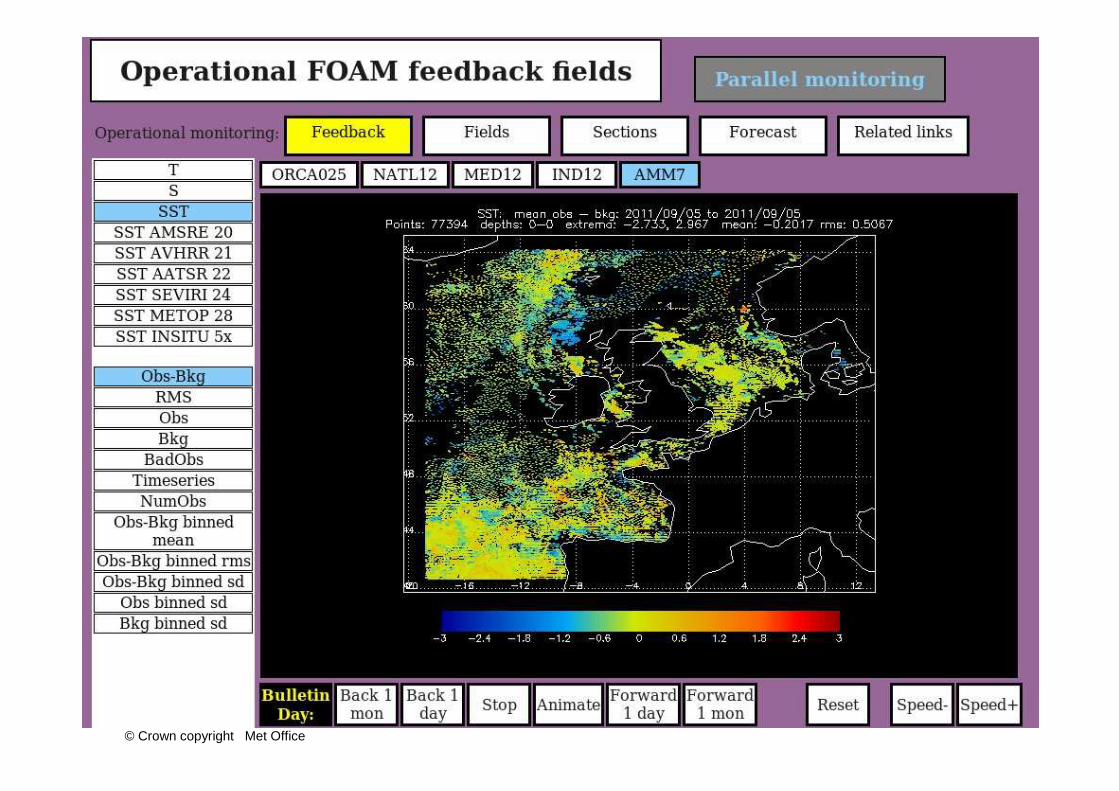
Daily Monitoring
• Maps of all products at various depths. • Differences between the daily mean surface
temperature and the OSTIA analysis for the same day• Timeseries of the extreme values of the model fields• Maps of data assimilation innovations• Maps of data assimilation increments• Maps of anomalies against climatologies• Maps of statistics derived from assimilation innovations• Volume transports
© Crown copyright Met Office
© Crown copyright Met Office
Accuracy Monitoring
• To capture gradual deteriorations in the accuracy, daily accuracy statistics are monitored on a monthly basis.
• Variations in accuracy are also compared to the calibration hindcast to detect deviations from the normal seasonal and interannual variability of the errors.
• If potential problems are detected, then the plots from the monitoring section are useful for investigating the cause.

© Crown copyright Met Office
Thank you
© Crown copyright Met Office
References(1)• Blackford JC, Allen JI and Gilbert FJ (2004). Ecosystem dynamics at six
contrasting sites: a generic model study. Journal of Marine Systems, 52, 191-215.• Drévillon M, Bourdallé-Badie R, Derval C, Drillet Y, Lellouche J-M, Rémy E,
Tranchant B, Benkiran M, Greiner E, Guinhut S, Verbrugge N, Garric G, Testut C-E, Laborie M, Nouel L, Bahurel P, Bricaud C, Crosnier L, Dombrowsky E, Durand E, Ferry N, Hernandez F, Le Galloudec O, Messal F, and Parent L. (2008). The GODAE/Mercator-Océan global ocean forecasting system: results, applications and prospects. J. Operational Ocean. 1: 51-57.
• Edwards KP, Barciela R, Butenschön M, Validation of the NEMO-ERSEM operational ecosystem model for the North West European Continental Shelf. Submitted to Ocean Sciences
• Fichefet T and Morales Maqueda MA (1997) Sensitivity of a global sea ice model to the treatment of ice thermodynamics and dynamics. J Geophys Res 102:12609–12646
• Holt, J.T. and James, I.D. (2001) An s coordinate density evolving model of the northwest European continental shelf 1, Model description and density structure, Journal of Geophysical Research, Oceans, 106, C7, 14015-14034.
• Madec G (2008). « NEMO ocean engine". Note du Pole de modélisation, Institut
Pierre-Simon Laplace (IPSL), France, No 27 ISSN No 1288-1619
© Crown copyright Met Office
References(2)• Martin MJ, Hines A, and Bell MJ (2007). Data assimilation in the FOAM
operational short-range ocean forecasting system: a description of the scheme and its impact. Q.J.R. Meterol. Soc. 133, 981-995
• O'Dea EJ, While J, Furner R, Arnold A, Hyder P, Storkey D, Edwards KP, Siddorn JR, Martin MJ, Liu H and Holt JT (2011). An operational ocean forecast system incorporating SST data assimilation for the tidally driven European North West European shelf. Submitted to J. Oper. Oceanography.
• Siddorn, J.R., Allen, J.I., Blackford, J.C., Gilbert, F.J., Holt, J.T., Holt, M.W., Osborne, J.P., Proctor, R., Mills, D.K. (2006). Modelling the hydrodynamics and ecosystem of the North West European continental shelf for operational oceanography. Journal of Marine Systems, doi:10.1016/j.jmarsys.2006.08.001
• Storkey D, Blockley EW, Furner R, Giuavarc'h C, Lea D, Martin MJ, Barciela RM, Hines A, Hyder P and Siddorn JR (2010) Forecasting the ocean state using NEMO: The new FOAM system. J. Operational Oceanography, 3, 3-15.
© Crown copyright Met Office
Extras…
© Crown copyright Met Office
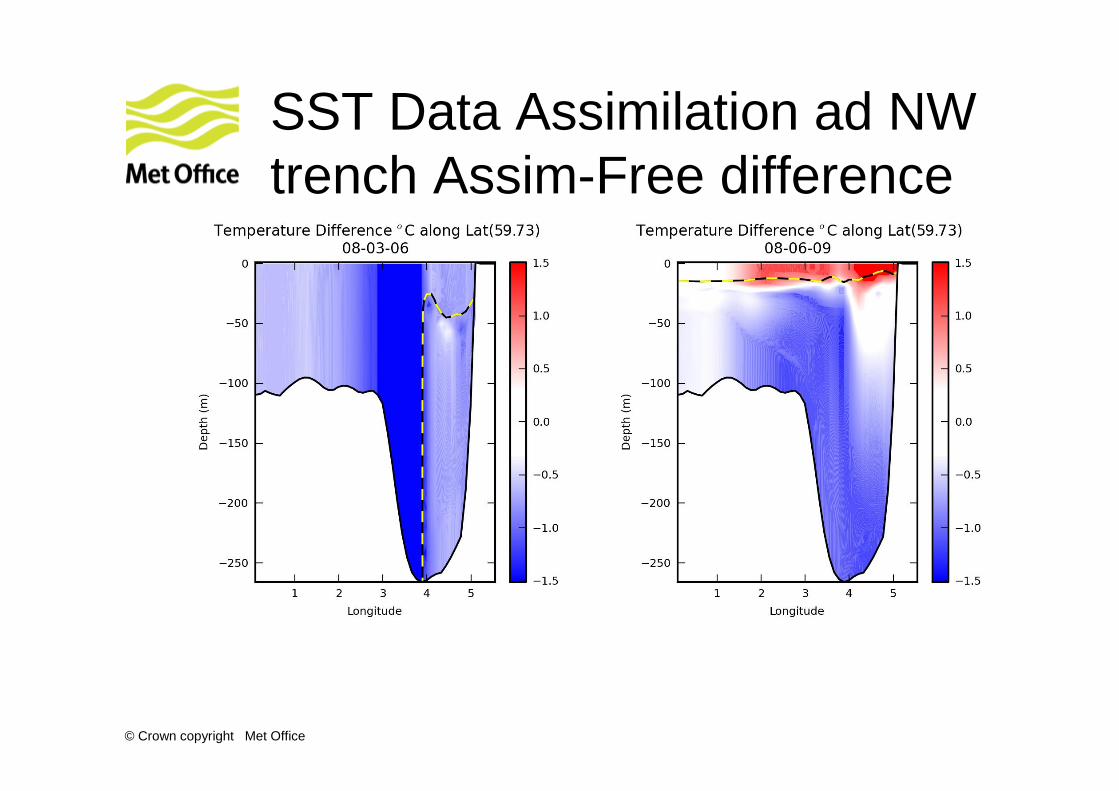
SST Data Assimilation ad NW trench Assim-Free difference
© Crown copyright Met Office
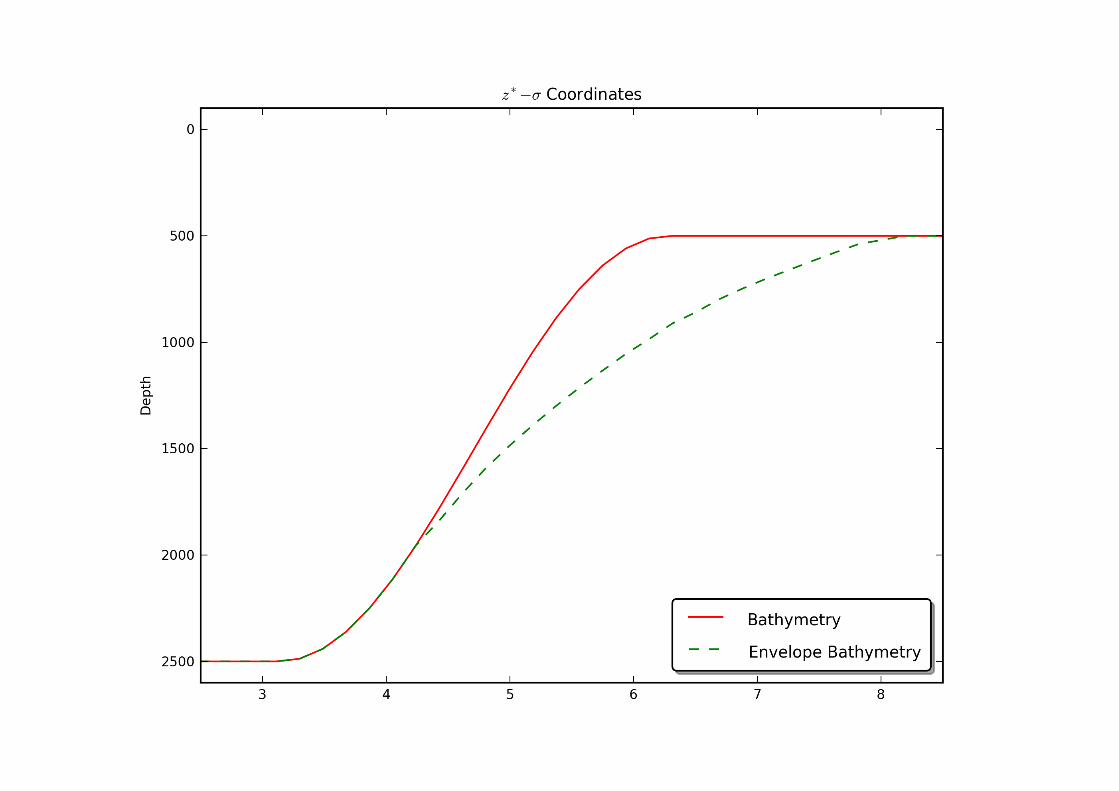
Z*-s-sigma, what is that and how does it help with HPG errors?
© Crown copyright Met Office
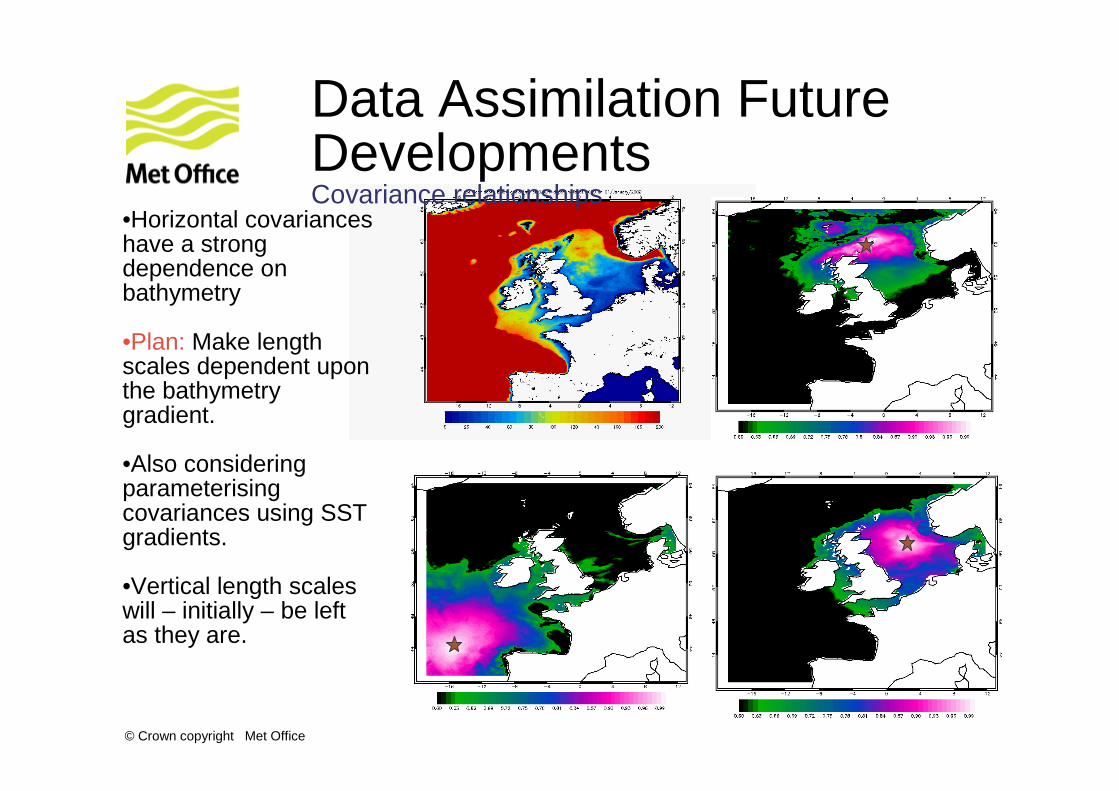
Data Assimilation Future Developments Covariance relationships
•Horizontal covariances have a strong dependence on bathymetry
•Plan: Make length scales dependent upon the bathymetry gradient.
•Also considering parameterising covariances using SST gradients.
•Vertical length scales will – initially – be left as they are.
© Crown copyright Met Office
Data assimilation future developmentsImmediate plans
Upgrading the data assimilation to a 3DVar scheme based on the NEMOVAR code.
At first we will continue to only assimilate SST.
•3DVar scheme.
•More efficient conjugate gradient minimisation of the cost function.
•Diffusion based correlation functions.
•More advanced balance relationships between parameters.
•More flexibility in specifying the spatial covariance relationships
Key differences
© Crown copyright Met Office
Extra Slide on Accuracy
• The Global Ocean Data Assimilation Experiment (GODAE; Bell et al., 2009) metrics are used as a basis for use in evaluating model-based products.
• There are two groups of metrics used: analysis statistics and forecast statistics.
• At present these statistics are all computed in observation space (GODAE class 4), and averaged over pre-defined regions.
• The analysis statistics are derived from the data assimilation innovations (observation minus model differences). These differences are computed using model background fields before the observations are assimilated, and are therefore indicative of the accuracy of the 1-day forecasts.
• Because the data assimilation uses an FGAT (First Guess at Appropriate Time) scheme, these differences use the model value at the same time as the observation
© Crown copyright Met Office
Physical Model
Pelagic Model
Benthic Model
Wind Stress
Heat and MoistureFlux
Irradiation
����C
C,N,P,Si
Detritus
Meio-benthos
AnaerobicBacteria
AerobicBacteria
DepositFeeders
Phyto-plankton
NutrientsPelagic
SuspensionFeeders
Detritus
NutrIents
OxygenatedLayer
Reduced Layer
RedoxDiscontinuity
Layer
Phytoplankton
Zooplankton
Pico-
Flagellates Diatoms
Dissolved
Particulates
Bacteria
Micro- Meso-Hetero-trophs
Small Cells Large Cells
Si
NH4
NO3
PO4
CO2
Sed
Lateral BdyData
Dino-flagellates
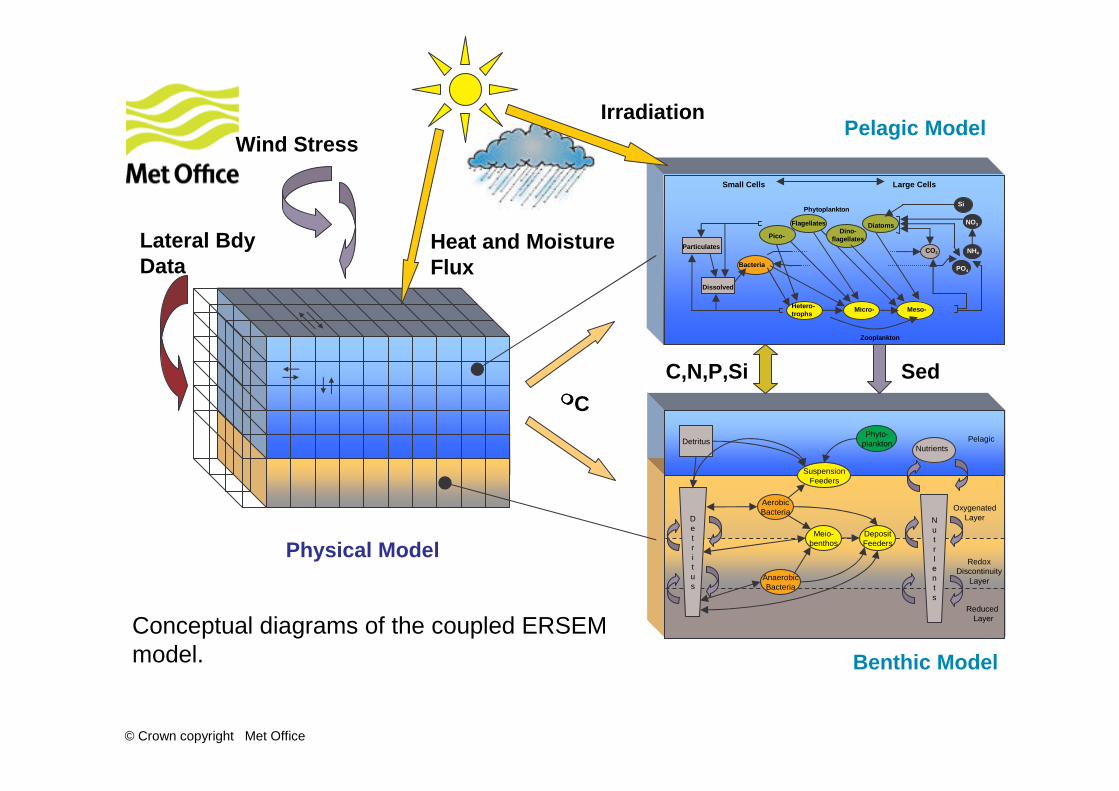
Conceptual diagrams of the coupled ERSEM model.
Related Documents


