operating budget for 2012-13 and beyond cbe.ab.ca 9-44

Welcome message from author
This document is posted to help you gain knowledge. Please leave a comment to let me know what you think about it! Share it to your friends and learn new things together.
Transcript
operating budgetfor 2012-13 and beyond
cbe.ab.ca
9-44

Table of Contents
Budgeting for Success 1
Our Ultimate Goal 1
Operating Budget Highlights 2
Budget-at-a-Glance 2012-13 3
How New Schools are Funded 4
Parents Guide School Fees for 2012-13 4
Board and System Administration Costs 4
Three-Year Financial Plan 5
Budget Assumptions 7
Operating Budget Assumptions Related to Uncertainties 7
Operating Budget Assumptions Related to Strategies 8
Understanding Revenue 11
Provincial Grant Revenues 13
Other Revenue 14
Understanding Expenses 15
Expenses by Block 15
Expenses by Object 16
Reserves 17
Structural Deficit and Available Operating Reserves 18
Staff complement 19
Student enrolment 20
Glossary of terms 21
Alberta Education Budget Report 22
9-45

Page | 1
Budgeting for Success1
The Calgary Board of Education is one of the best public education systems in the world. Outstanding education depends on making wise decisions about how to invest public resources on behalf of more than 104,000 students. It’s an important responsibility. The money we spend educating our youth is one of the most important investments communities can make in their future.
The Province of Alberta projects a total of $40.3 billion in revenue for 2012-13. The Province’s second biggest expense is education for students from Kindergarten to Grade 12. The largest school board in Alberta, the CBE, will receive an estimated $1.069 billion in provincial grant revenue for the 2012-13 school year.
Our Ultimate Goal
Our budget decisions are driven by our ultimate goal – ensuring student success. This goal is expressed by our Board of Trustees’ expectation that each student, in keeping with his or her individual abilities and gifts, will complete high school with a foundation of learning necessary to thrive in life, work and continued learning. This “mega result” encompasses very specific expectations for student outcomes in academic success, character, personal development and citizenship.
Achieving student success requires commitment from every part of the CBE community. It requires a vision of what success looks like for every student, and a plan for how we will get there. This vision is defined by Alberta Education, and reflected in our Three-Year Education Plan.
The Three-Year Education Plan guides our work and connects each CBE employee to our ultimate goal of student success. Everything we do to support students falls under four categories; personalize learning, build our capacity, engage our public and steward our resources.
Stewarding our resources means that we recognize our responsibility to ensure public funding delivers the best possible public education for our students. Building balanced budgets—both operating and capital—is an opportunity to demonstrate the connection between funding and student success.
The most recent provincial budget kept its promise for sustainable funding. The Alberta government provided three-year budgets to enable long-term planning. For the first time, school boards can project their financial plans beyond the next fiscal year. Consequently, for the first time, the Three-Year Education Plan is complemented by a three-year funding model. A three-year, predictable funding model allows us to be more strategic in how we plan for student learning.
1 Throughout this document, the 2011-12 budget figures presented reflect the Fall Updated Budget approved by the Board of Trustees
on Dec. 6, 2011 modified to reflect revenues and expenditures at Nov. 30, 2011 that are deemed to be sustainable into the future. No restatement of 2011-12 budget figures to reflect changes in presentation have been made. Any presentation differences between the
years will be explained as variances.
9-46
Page | 2
Operating Budget Highlights
Our goal in building the budget is to dedicate the maximum possible resources to optimize learning for students in classrooms. We remain focused on this goal as we prepare balanced budgets each year. Our expenditures are measured against the goals of our Three-Year Education Plan to ensure that everything we do contributes as much as possible to student success.
Key highlights of the budgets include:
funding to schools via the Resource Allocation Method (RAM) has increased by $21 million over last year
we expect to hire an additional 163 positions for the next school year
Alberta Education requires us to balance our budgets each year
we expect our enrolment to top 105,654 students at 225 schools across Calgary
the portion of the budget the CBE spends on Board Governance and Administration will drop from 3.7 per cent to 3.4 per cent of our total operating budget, placing the CBE among the most efficient school districts in the province
The budget numbers presented in this report will be finalized in the fall of 2012, to reflect our Sept. 30, 2012 actual enrolment. A fall budget update is produced once all the numbers are finalized. The following “budget-at-a-glance” shows our revenue and how we spend it to support student learning.
9-47
Page | 3
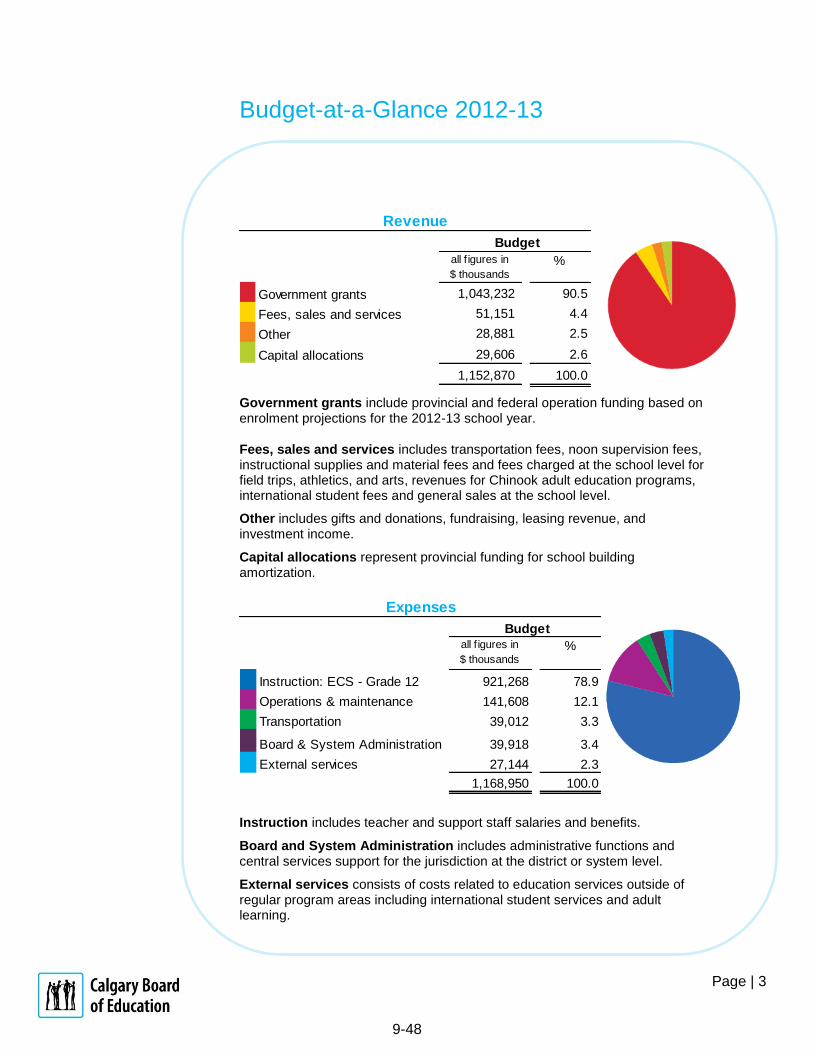
Government grants 1,043,232 90.5
Fees, sales and services 51,151 4.4
Other 28,881 2.5
Capital allocations 29,606 2.6
1,152,870 100.0
2012/13
Budget
all f igures in
$ thousands
%
Revenue
Instruction: ECS - Grade 12 921,268 78.9
Operations & maintenance 141,608 12.1
Transportation 39,012 3.3
Board & System Administration 39,918 3.4
External services 27,144 2.3
1,168,950 100.0
2012/13
Budget
Expenses
all f igures in
$ thousands
%
Budget-at-a-Glance 2012-13
Government grants include provincial and federal operation funding based on enrolment projections for the 2012-13 school year.
Fees, sales and services includes transportation fees, noon supervision fees, instructional supplies and material fees and fees charged at the school level for field trips, athletics, and arts, revenues for Chinook adult education programs, international student fees and general sales at the school level.
Other includes gifts and donations, fundraising, leasing revenue, and investment income.
Capital allocations represent provincial funding for school building amortization.
Instruction includes teacher and support staff salaries and benefits.
Board and System Administration includes administrative functions and central services support for the jurisdiction at the district or system level.
External services consists of costs related to education services outside of regular program areas including international student services and adult learning.
9-48

Page | 4
How New Schools are Funded
New schools are funded by the provincial government through a capital budget. Each year, the CBE submits a detailed, three-year capital plan to the provincial government. It outlines where we need to build new schools, or modernize existing schools to serve the needs of our community. The plan details the top priorities. Although we prepare the plan every year, except for a recent $10.5 million allocation for Chinook Learning Services, no new capital projects have been approved in the past four years.
Capital projects approved a number of years ago mean that four new CBE middle schools (Grades 4-9 or Grades 5-9) will open in September including:
Nose Creek School – Coventry Hills
Twelve Mile Coulee School – Tuscany
Ted Harrison School - Taradale
Captain Nichola Goddard School - Panorama Hills
In addition, major modernization projects are being completed at Western Canada High School and Lord Shaughnessy High School. The new Northwest High School is expected to open in September 2013.
Parents Guide School Fees for 2012-13
The funding we receive does not always cover the cost of services provided by the CBE. For example, the funding provided for transportation is $6.9 million less than the cost of providing the service. In total, the CBE faces a gap of $31 million between what services for students cost, and the funding that is provided. This year we asked parents to help us solve this problem. More than 4,000 parents helped set the framework for fees going forward following a comprehensive community engagement process. This process is continuing as we seek to further engage parents to refine our framework.
Board and System Administration Costs
The province limits our Board and System Administration costs to four per cent of our total operating budget, but we expect to spend well below that next year, so that more funding will flow to students in our classrooms. Of our total operating budget next year, we expect only 3.4 per cent will be spent on administration for our entire system. Board and System Administration includes administrative functions and central services that support students at the district or system level.
The CBE’s Board and System Administration cost was only 3.7 per cent in 2011-12 and is forecast to be 3.4 per cent for next year, placing the CBE among the most efficient districts in Alberta.
Projected Student Enrolment
9-49

Page | 5
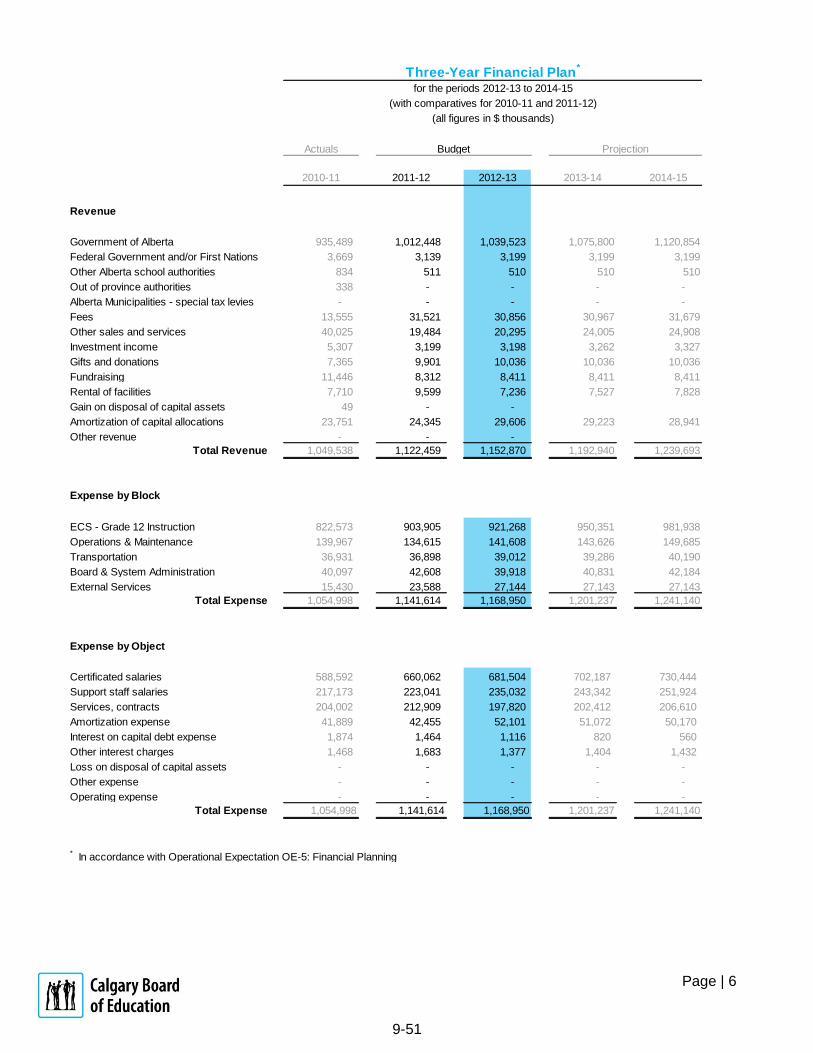
Three-Year Financial Plan
Schools districts used to get their budgets from the provincial government one year at a time. This process made it impossible to connect long-term strategies and three-year education plans to funding. In February 2012, the Alberta government changed the process. For the first time, schools districts were given revenue formulas for three years, fulfilling a commitment to provide predictable funding.
The three-year funding enables school districts to plan further in advance than was ever possible before. The Three-Year Financial Plan chart shows the financial plan for the Calgary Board of Education for the next three years. The comparative information is provided for 2010-11 and 2011-12.
The way the Calgary Board of Education uses funding can be presented in two ways and both are shown. The first breakdown shows expenses by “block.” Blocks are categories of expenses required by Alberta Education. The second breakdown, also required by Alberta Education, shows expenses by commonly used accounting categories called “objects.” Whether viewed by block or by object, the expense total is the same.
The table shows that total revenue for 2012-13 is $16.08 million less than expenses for the same year. The difference represents the CBE’s plan to use $16.08 million of reserves in 2012-13. This use of reserves eliminates the gap between projected revenue and forecast expenses. More detail is provided on page 17.
9-50
Page | 6
Actuals
2010-11 2011-12 2012-13 2013-14 2014-15
Revenue
Government of Alberta 935,489 1,012,448 1,039,523 1,075,800 1,120,854
Federal Government and/or First Nations 3,669 3,139 3,199 3,199 3,199
Other Alberta school authorities 834 511 510 510 510
Out of province authorities 338 - - - -
Alberta Municipalities - special tax levies - - - - -
Fees 13,555 31,521 30,856 30,967 31,679
Other sales and services 40,025 19,484 20,295 24,005 24,908
Investment income 5,307 3,199 3,198 3,262 3,327
Gifts and donations 7,365 9,901 10,036 10,036 10,036
Fundraising 11,446 8,312 8,411 8,411 8,411
Rental of facilities 7,710 9,599 7,236 7,527 7,828
Gain on disposal of capital assets 49 - -
Amortization of capital allocations 23,751 24,345 29,606 29,223 28,941
Other revenue - - -
Total Revenue 1,049,538 1,122,459 1,152,870 1,192,940 1,239,693
Expense by Block
ECS - Grade 12 Instruction 822,573 903,905 921,268 950,351 981,938
Operations & Maintenance 139,967 134,615 141,608 143,626 149,685
Transportation 36,931 36,898 39,012 39,286 40,190
Board & System Administration 40,097 42,608 39,918 40,831 42,184
External Services 15,430 23,588 27,144 27,143 27,143
Total Expense 1,054,998 1,141,614 1,168,950 1,201,237 1,241,140
Expense by Object
Certificated salaries 588,592 660,062 681,504 702,187 730,444
Support staff salaries 217,173 223,041 235,032 243,342 251,924
Services, contracts 204,002 212,909 197,820 202,412 206,610
Amortization expense 41,889 42,455 52,101 51,072 50,170
Interest on capital debt expense 1,874 1,464 1,116 820 560
Other interest charges 1,468 1,683 1,377 1,404 1,432
Loss on disposal of capital assets - - - - -
Other expense - - - - -
Operating expense - - - - -
Total Expense 1,054,998 1,141,614 1,168,950 1,201,237 1,241,140
* In accordance with Operational Expectation OE-5: Financial Planning
Budget Projection
Three-Year Financial Plan*
for the periods 2012-13 to 2014-15
(all figures in $ thousands)
(with comparatives for 2010-11 and 2011-12)
9-51
9-51
9-51

Page | 7
Budget Assumptions
Administration reported budget assumptions to the Board of Trustees on Mar. 20, 2012. The budget assumptions report included two types of information:
1 | financial and economic uncertainties expected to affect the budget. For the operating budget, these include factors like inflation and compensation increases; and
2 | strategies to deliver balanced budgets with the greatest possible benefit for student success.
The intention of the report was to provide the Board of Trustees with insight into how Administration planned to support the Three-Year Education Plan with 2012-13 budget decisions.
Operating Budget Assumptions2 Related to Uncertainties
Compensation changes
All anticipated changes in employee compensation have been included based on current information. Anticipated changes include: compensation increases, step increases, performance increases and benefits.
Enrolment Enrolment projections have been based on the Sept. 30, 2011 actual enrolment of 104,182 and reflect the City of Calgary population changes, market share, and student retention rates (cohort-survival model). Forecasted enrolment figures are:
2012-13 105,654
2013-14 107,781
2014-15 110,271
Inflation Rate The inflation rates were estimated based on the 20-year
trend, which averages two per cent per year in Calgary.
Contractual Obligations
All known changes in contractual obligations have been included based on current information.
2 A Glossary of Terms is provided on Page 21
9-52
Page | 8
Legislative and Regulatory Framework
Any new legislation may affect the budget in areas such as full-day kindergarten, increased age of funded students, and residency requirements. The financial impact of any potential legislative changes cannot be determined at this time.
Operating Budget Assumptions3 Related to Strategies
The CBE will continue to allocate resources—both to schools and for associated
central supports—by way of the following strategies:
full-day Kindergarten programs in 18 identified schools at an approximate cost of $2 million without provincial funding;
First Nations, Métis, and Inuit (FNMI) programs primarily handled through centralized services at an approximate cost of $3 million;
English as a Second Language (ESL) and English-Language Learner (ELL) programs and supports at an approximate cost of $23 million;
specialized programs, unique settings and classroom supports at an approximate cost of $115 million;
small-class supports in Kindergarten to Grade 3 and high school Career and Technology Strategy (CTS) at an approximate cost of $42 million;
AISI project supports at an approximate cost of $7 million;
equity supports in identified schools at an approximate cost of $3 million; and
infrastructure maintenance renewal (IMR) projects at an approximate cost of $18 million
We expect Grade 4 to 12 class sizes to remain below the guideline. Kindergarten to Grade 3—where class-size funding continues—should remain below 20 to 1 on average.
In addition to the allocation strategies which continue, Administration applied the
following strategies to re-allocate resources. The goal is to dedicate the maximum
possible resources to optimize learning for students in classrooms.
3 A Glossary of Terms is provided on Page 21
9-53

Page | 9
Anticipated savings 2012-13 2013-14 2014-15 (all figures in $ millions)
Service Units –Operational Excellence Initiative
Service units have identified initiatives to achieve efficiencies while maintaining services and quality. For example:
9.0 16.0 20.0
1. finding ways to improve productivity without making additional demands on existing resources – this means working smarter;
2. accepting the challenge of determining work we can stop because it does not add sufficient value at this time;
3. improving processes that maximize revenue; 4. integrating functions to increase the impact and
efficiency with a focus on system-wide priorities; and,
5. saving money for the system by better leveraging strategic procurement and sourcing.
A number of these initiatives require several years to fully reap the anticipated savings – especially where benefits are achieved by introducing systems to replace manual processes.
Delaying capital investments and elimination of lease payments
a) Application of amortization To eliminate the structural deficit and balance the budget, we free up funds by temporarily delaying the spending on non-
urgent board-funded capital, such as equipment and technology-- which are funded through the application of amortization expense; and
Utilizing capital reserves for eligible capital expenditures that have typically been funded by the amortization reserve in the past.
To achieve the annual anticipated savings shown will require a draw on Capital Reserves of $5.6 million in 2013-14. By definition, board-funded capital excludes school facilities.
6.0 11.0 4.0
b) Capital lease payments The sale of the former Education Centre, which is assumed to happen during the 2011-12 fiscal year, will enable us to eliminate required lease payments in 2011-12 going forward. The benefit of this strategy is expected to occur in fiscal 2011-12. This increases available reserves that can be applied in 2012-13, and the impact is reflected in the Use of Reserves Strategy.
0.0 0.0 0.0
9-54

Page | 10
Anticipated savings 2012-13 2013-14 2014-15 (all figures in $ millions)
Expiration of one-time AISI funding
Alberta Education provided the CBE with $4.2 million of one-time funding for AISI projects in October 2011. All of the one-time funding was directed to schools for staffing – positions were temporary by definition. The provincial budget confirmed this specific funding expires on Aug. 31, 2012. Consequently and as planned from the outset, the related positions will be eliminated for 2012-13.
4.2 4.2 4.2
School fees More than 4,000 stakeholders participated in a comprehensive community engagement process to help the CBE develop a framework for fees going forward. This process is continuing as we seek to further engage parents to refine the framework.
0.0
0.0
0.0
Use of reserves
a) School reserves Despite best efforts, we anticipate that schools will have unused and unencumbered reserves (also known as “carry forwards”) at 2011-12 fiscal year end. This partly reflects an inability to recruit and place staff on short notice when new funds were made available by Alberta Education in October 2011.
6.0 0.0 0.0
b) Unrestricted Reserves We also anticipate that our use of unrestricted reserves in the current fiscal year will be lower than budget, as a result of gapping tied to unfilled positions (outside of schools) and the elimination of capital lease payments. We have applied this projection to balance the 2012-13 budget.
6.0 1.0 1.0
31.2 32.2 29.2
9-55
Page | 11
Understanding Revenue Alberta Education Grant Funding
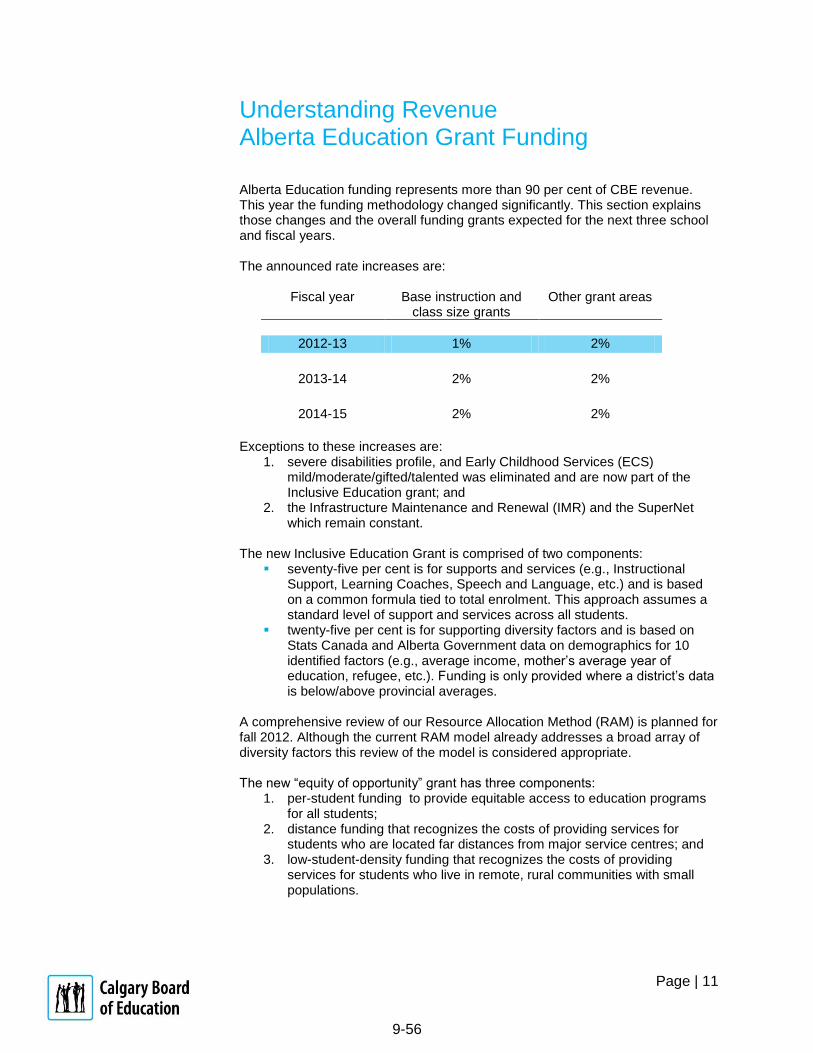
Alberta Education funding represents more than 90 per cent of CBE revenue. This year the funding methodology changed significantly. This section explains those changes and the overall funding grants expected for the next three school and fiscal years. The announced rate increases are:
Fiscal year Base instruction and class size grants
Other grant areas
2012-13 1% 2%
2013-14
2%
2%
2014-15
2%
2%
Exceptions to these increases are:
1. severe disabilities profile, and Early Childhood Services (ECS) mild/moderate/gifted/talented was eliminated and are now part of the Inclusive Education grant; and
2. the Infrastructure Maintenance and Renewal (IMR) and the SuperNet which remain constant.
The new Inclusive Education Grant is comprised of two components:
seventy-five per cent is for supports and services (e.g., Instructional Support, Learning Coaches, Speech and Language, etc.) and is based on a common formula tied to total enrolment. This approach assumes a standard level of support and services across all students.
twenty-five per cent is for supporting diversity factors and is based on Stats Canada and Alberta Government data on demographics for 10 identified factors (e.g., average income, mother’s average year of education, refugee, etc.). Funding is only provided where a district’s data is below/above provincial averages.
A comprehensive review of our Resource Allocation Method (RAM) is planned for fall 2012. Although the current RAM model already addresses a broad array of diversity factors this review of the model is considered appropriate. The new “equity of opportunity” grant has three components:
1. per-student funding to provide equitable access to education programs for all students;
2. distance funding that recognizes the costs of providing services for students who are located far distances from major service centres; and
3. low-student-density funding that recognizes the costs of providing services for students who live in remote, rural communities with small populations.
9-55 9-56
Page | 12
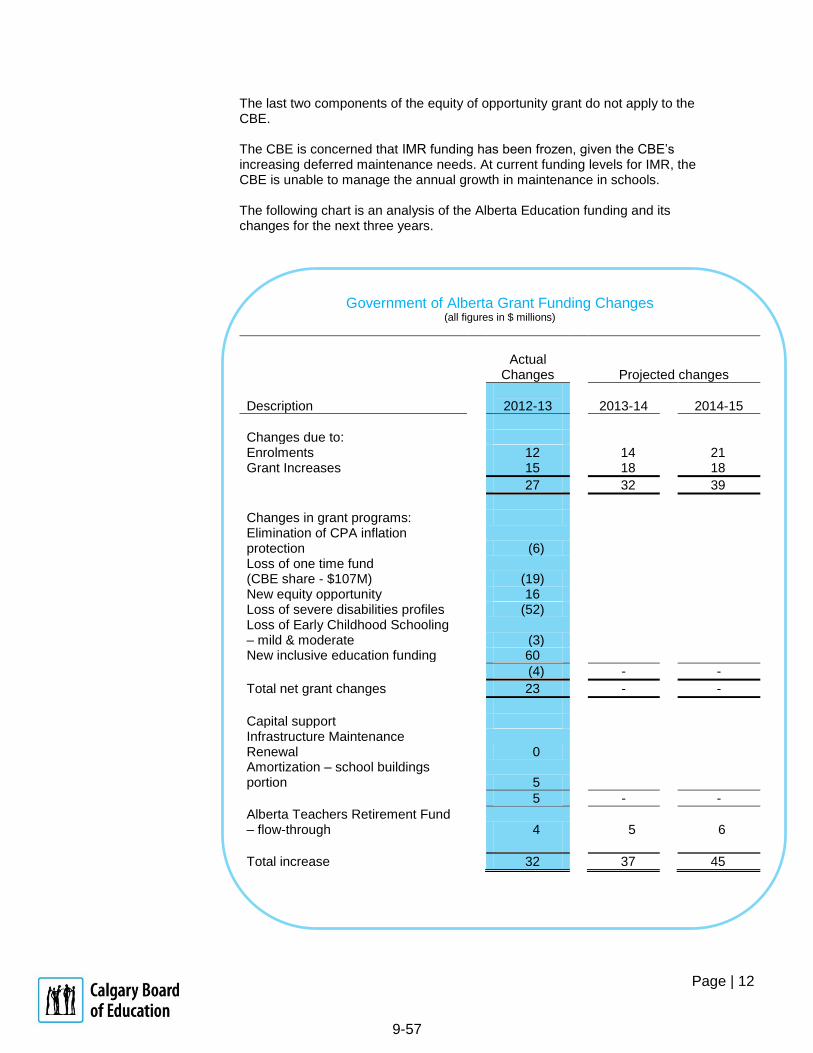
The last two components of the equity of opportunity grant do not apply to the CBE. The CBE is concerned that IMR funding has been frozen, given the CBE’s increasing deferred maintenance needs. At current funding levels for IMR, the CBE is unable to manage the annual growth in maintenance in schools. The following chart is an analysis of the Alberta Education funding and its changes for the next three years.
Government of Alberta Grant Funding Changes (all figures in $ millions)
Actual
Changes
Projected changes
Description
2012-13
2013-14
2014-15
Changes due to: Enrolments 12 14 21 Grant Increases 15 18 18
27 32 39
Changes in grant programs: Elimination of CPA inflation protection
(6)
Loss of one time fund (CBE share - $107M)
(19)
New equity opportunity 16 Loss of severe disabilities profiles (52) Loss of Early Childhood Schooling – mild & moderate
(3)
New inclusive education funding 60
(4) - -
Total net grant changes 23 - -
Capital support Infrastructure Maintenance Renewal
0
Amortization – school buildings portion
5
5 - -
Alberta Teachers Retirement Fund – flow-through
4
5
6
Total increase 32 37 45
9-57
Page | 13
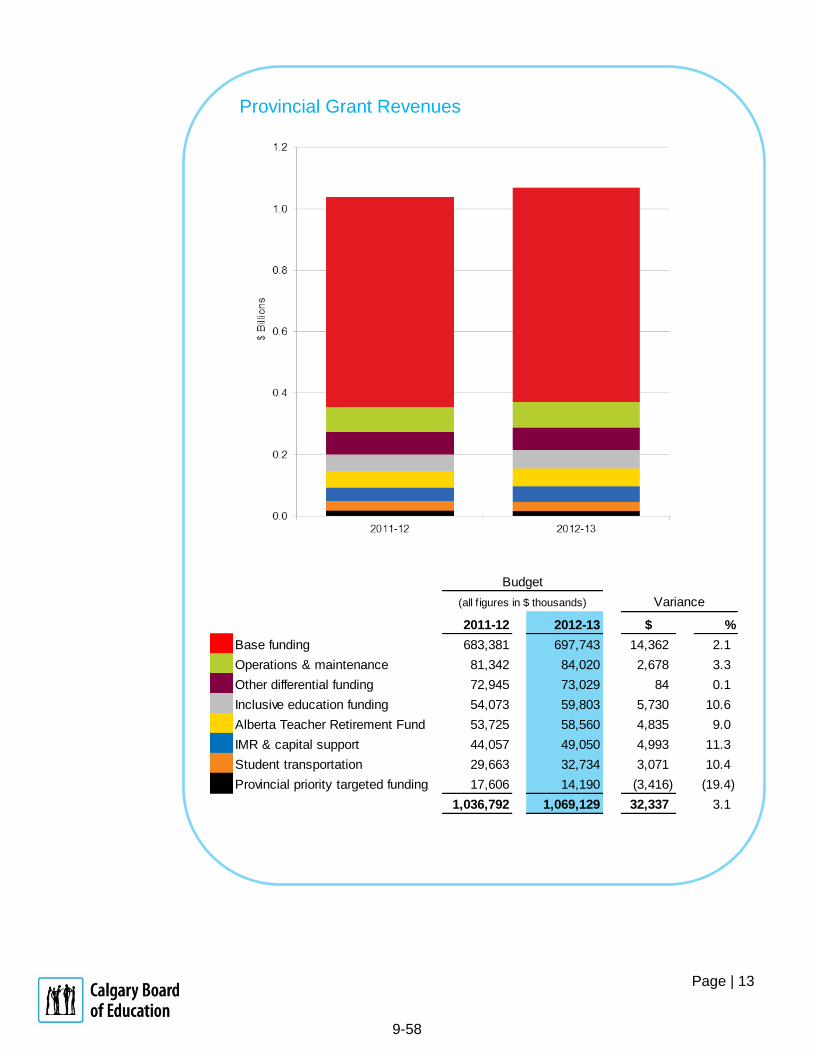
2011-12 2012-13 $ %
Base funding 683,381 697,743 14,362 2.1
Operations & maintenance 81,342 84,020 2,678 3.3
Other differential funding 72,945 73,029 84 0.1
Inclusive education funding 54,073 59,803 5,730 10.6
Alberta Teacher Retirement Fund 53,725 58,560 4,835 9.0
IMR & capital support 44,057 49,050 4,993 11.3
Student transportation 29,663 32,734 3,071 10.4
Provincial priority targeted funding 17,606 14,190 (3,416) (19.4)
1,036,792 1,069,129 32,337 3.1
Variance(all f igures in $ thousands)
Budget
Provincial Grant Revenues
9-58
Page | 14
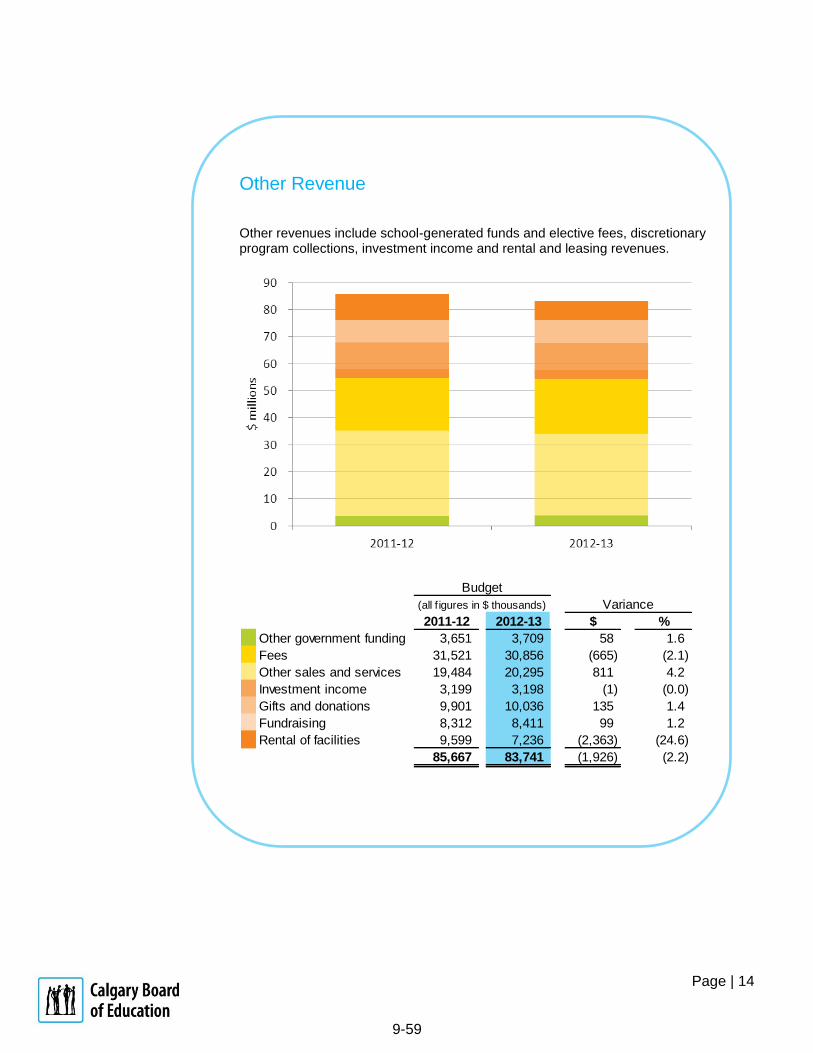
2011-12 2012-13 $ %
Other government funding 3,651 3,709 58 1.6
Fees 31,521 30,856 (665) (2.1)
Other sales and services 19,484 20,295 811 4.2
Investment income 3,199 3,198 (1) (0.0)
Gifts and donations 9,901 10,036 135 1.4
Fundraising 8,312 8,411 99 1.2
Rental of facilities 9,599 7,236 (2,363) (24.6)
85,667 83,741 (1,926) (2.2)
Variance
Budget
(all f igures in $ thousands)
Other Revenue
Other revenues include school-generated funds and elective fees, discretionary program collections, investment income and rental and leasing revenues.
9-59

Page | 15
Understanding Expenses
The way the Calgary Board of Education uses funding can be presented in two ways and both are shown. The first breakdown shows expenses by “block.” Blocks are categories of expenses required by Alberta Education. The second breakdown, also required by Alberta Education, shows expenses by commonly used accounting categories called “objects.” Whether viewed by block or by object, the expense total is the same.
Expenses by Block
Expenses by Block
In building the 2012-13 operating budget, the primary focus was to dedicate the maximum possible resources to optimize learning for students in classrooms.
As a result, the “instructional block” increased by about two per cent. The two per cent increase in the instructional block reflects grant-rate increases as well as the estimated impact of increased enrolment.
The increase in operations and maintenance is mainly related to the four new schools.
9-60
2011/12 2012/13 ($000) %
Instruction: ECS - grade 12 903,905 921,268 17,363 1.9
Operation & maintenance 134,615 141,608 6,993 5.2
Transportation 36,898 39,012 2,114 5.7
Board & System Administration 42,608 39,918 (2,690) (6.3)
External services 23,588 27,144 3,556 15.1
1,141,614 1,168,950 27,336 2.4
Variance(all f igures in $ thousands)
Budget
Page | 16
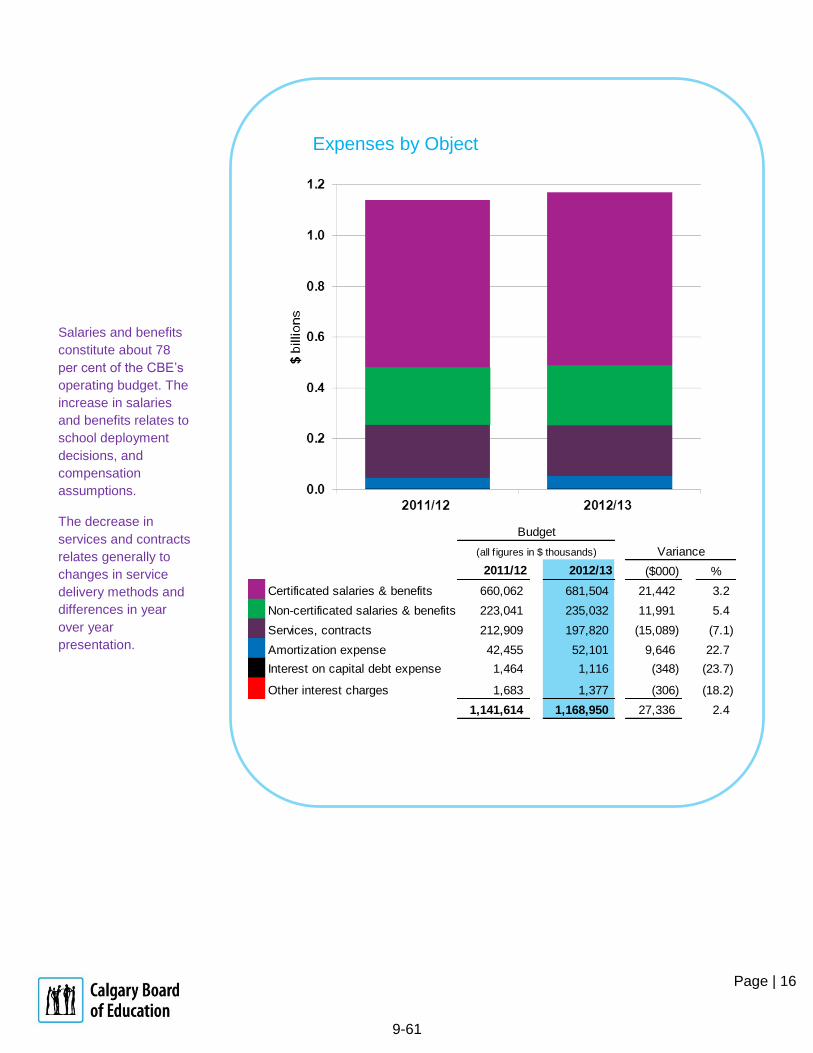
2011/12 2012/13 ($000) %
Certificated salaries & benefits 660,062 681,504 21,442 3.2
Non-certificated salaries & benefits 223,041 235,032 11,991 5.4
Services, contracts 212,909 197,820 (15,089) (7.1)
Amortization expense 42,455 52,101 9,646 22.7
Interest on capital debt expense 1,464 1,116 (348) (23.7)
Other interest charges 1,683 1,377 (306) (18.2)
1,141,614 1,168,950 27,336 2.4
Variance(all f igures in $ thousands)
Budget
Expenses by Object
Expenses by Object
Salaries and benefits
constitute about 78
per cent of the CBE’s
operating budget. The
increase in salaries
and benefits relates to
school deployment
decisions, and
compensation
assumptions.
The decrease in
services and contracts
relates generally to
changes in service
delivery methods and
differences in year
over year
presentation.
9-61

Page | 17
Reserves
The CBE is required to balance its budget every year. When we experience an operational shortfall, we can cover the shortfall by cutting spending, or by using our savings which we call reserves.
The chart below demonstrates all changes in reserves balances year over year.
While we indicate a closing balance of more than $6 million over the next three years, these reserves are not available for general use. These funds are set aside for specific purposes including adult learning (Chinook Learning Services), unrealized investment gains and professional improvement fellowships.
9-62

Page | 18
(5.5)
(19.2)
(8.9)
(16.1)
(8.3)
(1.4)
(20)
(15)
(10)
(5)
0
2010-11Actual
2011-12Approved
Budget2011-12Forecast
2012-13Budget
2013-14Projection
2014-15Projection
$ m
illio
ns
Structural Deficit
Structural Deficit and Available Operating Reserves
Structural Deficit and Available Operating Reserves
.
We entered the current school year with approximately $25 million in reserves. However, with a forecasted $61.7 million shortfall, we budgeted the full use of our reserves to help cover the difference, as directed by the Ministry of Education. Some of our budget strategies for 2012-13 will impact our use of reserves in the current year and has delayed their depletion to 2012-13. This will leave us with no available reserves going forward.
When we use reserves to balance our budget, we
create what is called a “structural deficit,” because we
fund ongoing expenses with “one-time” funding. We
started the current year with a budgeted $19.15 million
structural deficit. Going into the next school year, we
will be using more than $12 million in reserves to
balance the budget. The CBE has strategies in place to
reduce the structural deficit to zero over the next three
years. Once we no longer need to use reserves, we
eliminate structural deficits.
9-63
Page | 19
Staff complement
More than 12,000 people work for the CBE, or the equivalent of 9,014 full-time equivalents (FTEs). In 2012-13, as four new middle schools open and our enrolment grows, we expect to hire an additional 163 FTEs, bringing the total number of full-time positions to 9,177.
Each one of our employees plays an important role in providing learning as unique as every student. While teachers, principals and school-based employees work with students to unlock their passions and potential, they are supported by knowledgeable employees who work in a variety of other departments such as learning services, information technology and human resources.
9-64

Page | 20
2011-12
Actual ProjectionChange from
prior yearProjection
Change from
prior yearProjection
Change from
prior year
Pre-Kindergarten &
Kindergarten 7,769 8,217 448 8,706 489 8,895 189
Elementary (Gr. 1-6) 44,014 45,002 988 46,866 1,864 49,061 2,195
Junior High (Gr. 7-9) 21,505 21,464 (41) 21,221 (243) 21,383 162
Senior High (Gr. 10-12) 25,547 25,541 (6) 25,408 (133) 25,192 (216)
Unique Schools & Programs 1,797 1,780 (17) 1,780 - 1,780 -
Chinook Learning Services 2,935 3,000 65 3,150 150 3,310 160
Cbe-Learn 615 650 35 650 - 650 -
Totals 104,182 105,654 1,472 107,781 2,127 110,271 2,490
Student Enrolment by years and program
2012-13 2013-14 2014-15
Student enrolment
Enrolment projections are based on the Sept. 30, 2011 actual enrolment of 104,182 students, and reflect the City of Calgary population changes, market share, and student retention rates. It is expected that student enrolment will continue to increase between 1.4% and 2.0% annually.
Student Enrolment by year
9-65

School Jurisdiction Code:
Legal Name of School Jurisdiction
Telephone and Fax Numbers
BOARD CHAIR
Name Signature
SUPERINTENDENT
Name Signature
SECRETARY TREASURER
Name Signature
Certified An accurate summary of the year's budget approved by the Board of Trustees at its
meeting held .
c.c. Alberta Educationc/o Robert Mah, Financial Reporting & Accountability Branch8th Floor Commerce Place, 10155-102 Street, Edmonton AB T5J 4L5
E-MAIL: [email protected] (780-427-3855)
May 29, 2012
REPORT
Patricia Cochrane
Naomi Johnson
Deborah Meyers
Date
BUDGET
3030
Tel: (403) 817-4000 Fax: (403) 294-8254
Calgary Board of Education
[School Act, Sections 147(2)(b) and 276]
FOR THE YEAR ENDING AUGUST 31, 2013
9-67 Page | 22
School Jurisdiction Code: 3030
Page
BUDGETED STATEMENT OF OPERATIONS 3
BUDGETED ALLOCATION OF EXPENSES (BY OBJECT) 3
PROJECTED STATEMENT OF CHANGES IN NET ASSETS (SUMMARY) 4
PROJECTED STUDENT STATISTICS 5
PROJECTED STAFFING STATISTICS 6
Color coded cells:blue cells: require the input of data/descriptors wherever applicable. Grey cells: data not applicable - protectedsalmon cells: contain referenced juris. information - protected white cells: within text boxes REQUIRE the input of points and data.
Education Plan. At a minimum, they disclose key budget assumptions, financial & business risks, and specific strategies explaining how this budget willsupport the jurisdiction's plans.
TABLE OF CONTENTS
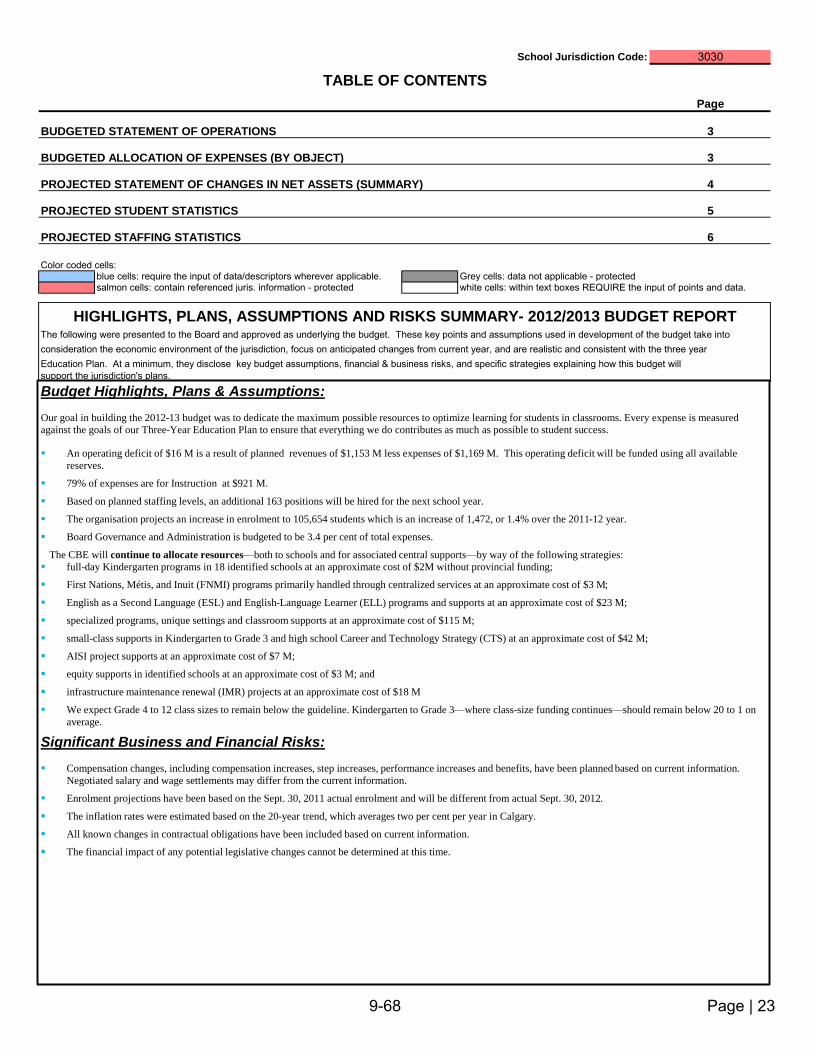
HIGHLIGHTS, PLANS, ASSUMPTIONS AND RISKS SUMMARY- 2012/2013 BUDGET REPORTThe following were presented to the Board and approved as underlying the budget. These key points and assumptions used in development of the budget take intoconsideration the economic environment of the jurisdiction, focus on anticipated changes from current year, and are realistic and consistent with the three year
Budget Highlights, Plans & Assumptions: Our goal in building the 2012-13 budget was to dedicate the maximum possible resources to optimize learning for students in classrooms. Every expense is measured
against the goals of our Three-Year Education Plan to ensure that everything we do contributes as much as possible to student success.
An operating deficit of $16 M is a result of planned revenues of $1,153 M less expenses of $1,169 M. This operating deficit will be funded using all available
reserves.
79% of expenses are for Instruction at $921 M.
Based on planned staffing levels, an additional 163 positions will be hired for the next school year.
The organisation projects an increase in enrolment to 105,654 students which is an increase of 1,472, or 1.4% over the 2011-12 year.
Board Governance and Administration is budgeted to be 3.4 per cent of total expenses.
The CBE will continue to allocate resources—both to schools and for associated central supports—by way of the following strategies:
full-day Kindergarten programs in 18 identified schools at an approximate cost of $2M without provincial funding;
First Nations, Métis, and Inuit (FNMI) programs primarily handled through centralized services at an approximate cost of $3 M;
English as a Second Language (ESL) and English-Language Learner (ELL) programs and supports at an approximate cost of $23 M;
specialized programs, unique settings and classroom supports at an approximate cost of $115 M;
small-class supports in Kindergarten to Grade 3 and high school Career and Technology Strategy (CTS) at an approximate cost of $42 M;
AISI project supports at an approximate cost of $7 M;
equity supports in identified schools at an approximate cost of $3 M; and
infrastructure maintenance renewal (IMR) projects at an approximate cost of $18 M
We expect Grade 4 to 12 class sizes to remain below the guideline. Kindergarten to Grade 3—where class-size funding continues—should remain below 20 to 1 on
average.
Significant Business and Financial Risks: Compensation changes, including compensation increases, step increases, performance increases and benefits, have been planned based on current information.
Negotiated salary and wage settlements may differ from the current information.
Enrolment projections have been based on the Sept. 30, 2011 actual enrolment and will be different from actual Sept. 30, 2012.
The inflation rates were estimated based on the 20-year trend, which averages two per cent per year in Calgary.
All known changes in contractual obligations have been included based on current information.
The financial impact of any potential legislative changes cannot be determined at this time.
9-68 Page | 23

School Jurisdiction Code: 3030
Approved Final Approved
Budget Budget Actual
2012/2013 2011/2012 2010/2011
REVENUES
Government of Alberta $1,039,523,380 $1,012,447,693 $935,488,724
Federal Government and/or First Nations $3,198,579 $3,139,106 $3,668,800
Other Alberta school authorities $509,850 $511,450 $833,727
Out of province authorities $0 $0 $338,256
Alberta Municipalities-special tax levies $0 $0 $0
Fees $30,855,920 $31,520,783 $13,555,335
Other sales and services $20,295,454 $19,483,586 $40,025,079
Investment income $3,198,197 $3,199,113 $5,306,740
Gifts and donations $10,035,797 $9,901,018 $7,364,678
Fundraising $8,411,026 $8,312,076 $11,446,061
Rental of facilities $7,236,414 $9,599,396 $7,710,226
Gain on disposal of capital assets $0 $0 $49,283
Amortization of capital allocations $29,605,490 $24,345,127 $23,751,314
Other revenue $0 $0 $0
TOTAL REVENUES $1,152,870,107 $1,122,459,348 $1,049,538,223EXPENSES
ECS - Grade 12 Instruction $921,268,009 $903,905,587 $822,573,231
Operations & Maintenance of Schools and Maintenance Shops $141,608,215 $134,615,150 $139,966,741
Transportation $39,011,849 $36,898,044 $36,930,965
Board & System Administration $39,918,236 $42,608,465 $40,097,486
External Services $27,143,472 $23,587,462 $15,430,121
TOTAL EXPENSES $1,168,949,781 $1,141,614,708 $1,054,998,544
ANNUAL SURPLUS (DEFICIT) ($16,079,674) ($19,155,360) ($5,460,321)
BUDGETED ALLOCATION OF EXPENSES (BY OBJECT)
Approved Final Approved
Budget Budget Actual2012/2013 2011/2012 2010/2011
EXPENSES
Certificated salaries $561,119,704 $550,901,893 $533,282,337
Certificated benefits $120,384,600 $109,160,095 $55,309,917
Non-certificated salaries and wages $189,075,276 $181,408,415 $178,276,506
Non-certificated benefits $45,957,067 $41,632,347 $38,895,933
Services, contracts, and supplies $197,819,377 $212,909,788 $204,001,783
Capital and debt services
Amortization of capital assets
supported $29,605,490 $24,345,127 $23,751,314
unsupported $22,495,281 $18,109,892 $18,138,004
Interest on capital debt
supported $1,116,395 $1,464,046 $1,874,600
unsupported $0 $0 $0
Other interest charges $1,376,591 $1,683,105 $1,468,151
Loss on disposal of capital assets $0 $0 $0
Other expense $0 $0 $0
TOTAL EXPENSES $1,168,949,781 $1,141,614,708 $1,054,998,544
BUDGETED STATEMENT OF OPERATIONSfor the Year Ending August 31
for the Year Ending August 31
9-69 Page | 24
School Jurisdiction Code: 3030
(1) (2) (3) (4) (5) (6)
ACCUMULATED
TOTAL INVESTMENT IN OPERATING UNRESTRICTED
NET ASSETS CAPITAL SURPLUS NET ASSETS OPERATING CAPITAL
(2+3+6) ASSETS (4+5) RESERVES RESERVES
Actual balances per AFS at August 31, 2011 $149,894,532 $98,646,553 $25,281,534 $2,184,011 $23,097,523 $25,966,445
2011/2012 Estimated impact to net assets for:
Estimated surplus(deficit) ($723,246) ($723,246)
Estimated Board funded capital asset additions $25,595,000 ($25,595,000) $0 $0
Estimated Amortization of capital assets (expense) ($42,455,016) $42,455,016
Estimated Amortization of capital allocations (revenue) $24,345,127 ($24,345,127)
Estimated Unsupported debt principal repayment $1,794,853 ($1,794,853)
Estimated reserve transfers (net) $3,361,737 $0 ($3,361,737)
Estimated Assumptions/Transfers of Operations $0 $0 $0 $6,641,473 ($6,641,473) $0
Estimated Balances for August 31, 2012 $149,171,286 $107,926,517 $18,640,061 $2,184,011 $16,456,050 $22,604,708
2012/2013 Budget Projections for:
Budgeted surplus(deficit) ($16,079,674) ($16,079,674)
Projected Board funded capital asset additions $16,000,194 ($16,000,194) $0 $0
Budgeted Amortization of capital assets (expense) ($52,100,771) $52,100,771
Budgeted Amortization of capital allocations (revenue) $29,605,490 ($29,605,490)
Budgeted Unsupported debt principal repayment $2,600,353 ($2,600,353)
Projected reserve transfers (net) $0 $0 $0
Projected Assumptions/Transfers of Operations $0 $0 $0 $10,000,929 ($10,000,929) $0
Projected Balances for August 31, 2013 $133,091,612 $104,031,783 $6,455,121 $0 $6,455,121 $22,604,708
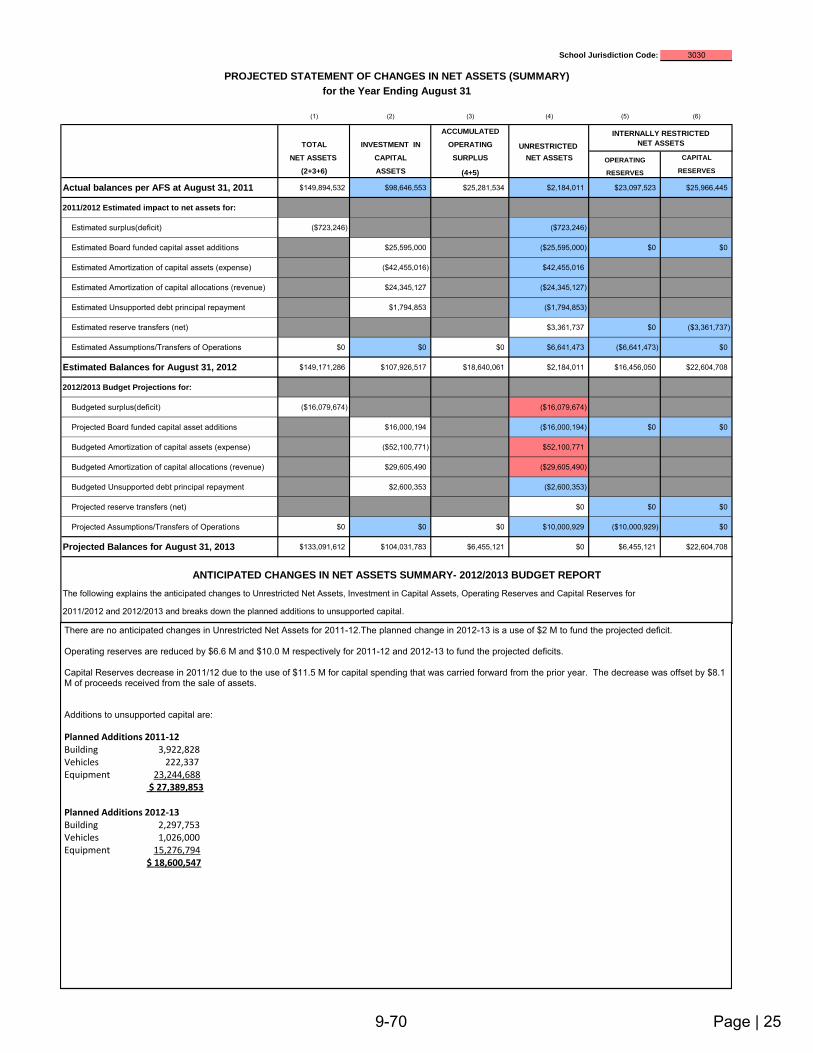
The following explains the anticipated changes to Unrestricted Net Assets, Investment in Capital Assets, Operating Reserves and Capital Reserves for
2011/2012 and 2012/2013 and breaks down the planned additions to unsupported capital.
ANTICIPATED CHANGES IN NET ASSETS SUMMARY- 2012/2013 BUDGET REPORT
PROJECTED STATEMENT OF CHANGES IN NET ASSETS (SUMMARY)
for the Year Ending August 31
INTERNALLY RESTRICTED
NET ASSETS
There are no anticipated changes in Unrestricted Net Assets for 2011-12.The planned change in 2012-13 is a use of $2 M to fund the projected deficit. Operating reserves are reduced by $6.6 M and $10.0 M respectively for 2011-12 and 2012-13 to fund the projected deficits. Capital Reserves decrease in 2011/12 due to the use of $11.5 M for capital spending that was carried forward from the prior year. The decrease was offset by $8.1 M of proceeds received from the sale of assets. Additions to unsupported capital are: Planned Additions 2011-12 Building 3,922,828 Vehicles 222,337 Equipment 23,244,688 $ 27,389,853 Planned Additions 2012-13 Building 2,297,753 Vehicles 1,026,000 Equipment 15,276,794 $ 18,600,547
9-70 Page | 25
School Jurisdiction Code: 3030
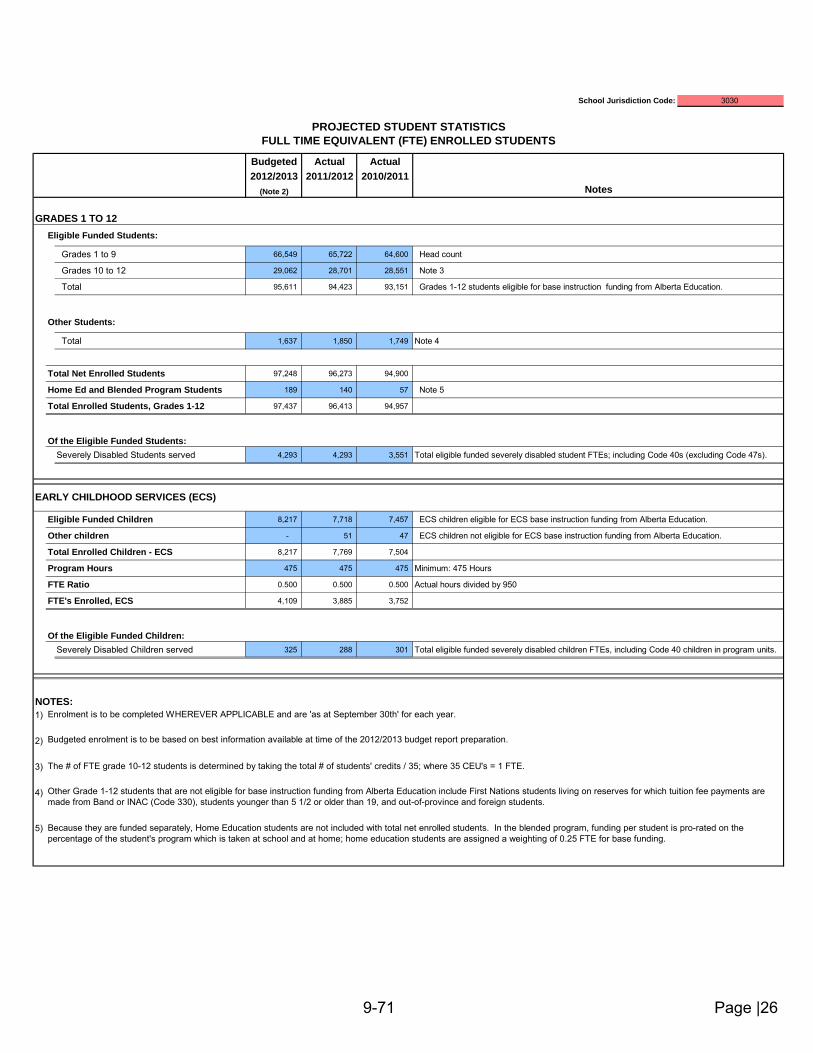
Budgeted Actual Actual
2012/2013 2011/2012 2010/2011
(Note 2)
Eligible Funded Students:
Grades 1 to 9 66,549 65,722 64,600 Head count
Grades 10 to 12 29,062 28,701 28,551 Note 3
Total 95,611 94,423 93,151 Grades 1-12 students eligible for base instruction funding from Alberta Education.
Other Students:
Total 1,637 1,850 1,749 Note 4
Total Net Enrolled Students 97,248 96,273 94,900
Home Ed and Blended Program Students 189 140 57 Note 5
Total Enrolled Students, Grades 1-12 97,437 96,413 94,957
Of the Eligible Funded Students:
Severely Disabled Students served 4,293 4,293 3,551 Total eligible funded severely disabled student FTEs; including Code 40s (excluding Code 47s).
Eligible Funded Children 8,217 7,718 7,457 ECS children eligible for ECS base instruction funding from Alberta Education.
Other children - 51 47 ECS children not eligible for ECS base instruction funding from Alberta Education.
Total Enrolled Children - ECS 8,217 7,769 7,504
Program Hours 475 475 475 Minimum: 475 Hours
FTE Ratio 0.500 0.500 0.500 Actual hours divided by 950
FTE's Enrolled, ECS 4,109 3,885 3,752
Of the Eligible Funded Children:
Severely Disabled Children served 325 288 301 Total eligible funded severely disabled children FTEs, including Code 40 children in program units.
NOTES:
1) Enrolment is to be completed WHEREVER APPLICABLE and are 'as at September 30th' for each year.
2)
3) The # of FTE grade 10-12 students is determined by taking the total # of students' credits / 35; where 35 CEU's = 1 FTE.
4)
5)
PROJECTED STUDENT STATISTICS
FULL TIME EQUIVALENT (FTE) ENROLLED STUDENTS
EARLY CHILDHOOD SERVICES (ECS)
Because they are funded separately, Home Education students are not included with total net enrolled students. In the blended program, funding per student is pro-rated on the percentage of the student's program which is taken at school and at home; home education students are assigned a weighting of 0.25 FTE for base funding.
Notes
GRADES 1 TO 12
Other Grade 1-12 students that are not eligible for base instruction funding from Alberta Education include First Nations students living on reserves for which tuition fee payments are made from Band or INAC (Code 330), students younger than 5 1/2 or older than 19, and out-of-province and foreign students.
Budgeted enrolment is to be based on best information available at time of the 2012/2013 budget report preparation.
9-71 Page |26

School Jurisdiction Code: 3030
Budgeted Actual Actual
2012/2013 2011/2012 2010/2011
School Based 5,728.5 5,649.7 5,729.9 Teacher certification required for performing functions at the school level.
Non-School Based 126.1 127.1 165.8 Teacher certification required for performing functions at the system/central office level.
Total Certificated Staff FTE 5,854.6 5,776.8 5,895.7 FTE for personnel possessing a valid Alberta teaching certificate or equivalency.
Certificated Staffing Change due to:
Enrolment Change 59.4 43.2 10.4 If negative change impact, the small class size initiative is to include any/all teachers retained.
Other Factors 18.4 (162.1) (199.4) Descriptor (required):
Total Change 77.8 (118.9) (189.0) Year-over-year change in Certificated FTE
Breakdown, where total change is Negative:
Continuous contracts terminated - - - FTEs
Non-permanent contracts not being renewed - - - FTEs
Other (retirement, attrition, etc.) - - - Descriptor (required):
Total Negative Change in Certificated FTEs - - - Breakdown required where year-over-year total change in Certificated FTE is 'negative' only.
Instructional 1,941.2 1,853.2 1,932.5 Personnel providing instruction support for schools under 'Instruction' program areas.
Non-Instructional 1,328.2 1,331.5 1,239.7 Personnel in Transportation, Board & System Admin., O&M and External service areas.
Total Non-Certificated Staff FTE 3,269.4 3,184.7 3,172.2 FTE for personnel not possessing a valid Alberta teaching certificate or equivalency.
Non-Certificated Staffing Change due to:
Enrolment Change - - 2.0 FTEs
Other Factors 84.7 12.5 (83.2) Descriptor (required):
Total Change 84.7 12.5 (81.2) Year-over-year change in Non-Certificated FTE
NON-CERTIFICATED STAFF
Principals' decision deployment, change in serivice units' operations
PROJECTED STAFFING STATISTICS
FULL TIME EQUIVALENT (FTE) PERSONNEL
Notes
CERTIFICATED STAFF
Principals' decision deployment
9-72 Page | 27
Related Documents