Operating as an Open-end Equity Fund Since 1962, NI(U)T is the flagship carrier of a diversified portfolio of collective Investment Schemes managed by NITL. With net assets of over PKR 40.464 billion and 56,196 unit holders, it is the first and largest mutual fund in Pakistan.

Welcome message from author
This document is posted to help you gain knowledge. Please leave a comment to let me know what you think about it! Share it to your friends and learn new things together.
Transcript

Operating as an Open-end Equity Fund Since 1962, NI(U)T is the flagship carrier of a
diversified portfolio of collective Investment Schemes managed by NITL. With net assets
of over PKR 40.464 billion and 56,196 unit holders, it is the first and largest mutual fund
in Pakistan.

B e l i e f i n S u c c e s s
N I U T
CORPORATEinformation
FUND NAMENational Investment (Unit) Trust
NAME OF AUDITORSA.F. Ferguson & Co. Chartered Accountants
LIST OF BANKERSAllied Bank Limited
Askari Bank
Bank Al Falah Limited
Bank Al Habib Limited
Faysal Bank Limited
Habib Bank Limited
Habib Metropolitan Bank Limited
MCB Bank Limited
Meezan Bank Limited
National Bank of Pakistan
NIB Bank Limited
Standard Chartered Bank (Pakistan) Limited
Silk Bank Limited
Soneri Bank Limited
Summit Bank (Formerly Arif Habib Bank Limited)
The Bank of Punjab
United Bank Limited
T H I R D Q U A R T E R R E P O R T M A R C H2 0 1 1A N N U A L R E P O R T43
N I U T
NI(U)T Objective
The core objective of NI(U)T is to maximize return for Unit holders, provide a regular stream of current income through dividends, while long term growth is achieved by the management of diversified portfolio and investments into growth and high yielding equity securities.
Profile of Investment Manager
National Investment Trust Ltd. (NITL) is the first Asset Management Company of Pakistan, formed in 1962. NITL is the largest asset management company of Pakistan with approximately Rs. 78 billion assets under management. The family of Funds of NIT comprises of five funds including 3 equity Funds and 2 fixed income nature Funds. NIT’s distribution network comprises of 22 NIT branches, various Authorized bank branches all over Pakistan and Arab Emirates Investment Bank (AEIB) in Dubai(UAE). The Board of Directors of NITL consists of representatives of leading financial institutions, prominent industrialists and nominee of Govt. of Pakistan. The Company has been assigned an Asset Manager rating of “AM2-” by JCR-VIS Credit Rating Company Limited, which denotes the stable outlook of the company and that the asset manager meets high investment management quality standards. All Investment decisions are taken by the Investment Committee of NITL.
Fund Information NI(U)T:
• Launch date 12th November 1962 • Minimum Investment: Rs. 5,000
• Type Open End Equity Fund • Management Fee: 1.00%
• Fund Manager Manzoor Ahmed • Front End Load: 3.00%
• Fund Size as on June 30, 2011 Rs. 40.464 Billion • Back End Load: 0.00%
• Par Value Rs. 10 • Auditors: A.F. Ferguson & Co. Chartered Accountants
• NAV/unit Rs. 32.14 • Trustee: National Bank of Pakistan
• Pricing Mechanism Forward Pricing • Risk Profile Moderate / High
• Benchmark KSE 100 Index • Fund Rating: (Ratings based on 30th June 2010)
3-Star Ranking (Short Term)2-Star Ranking (Long Term)by PACRA
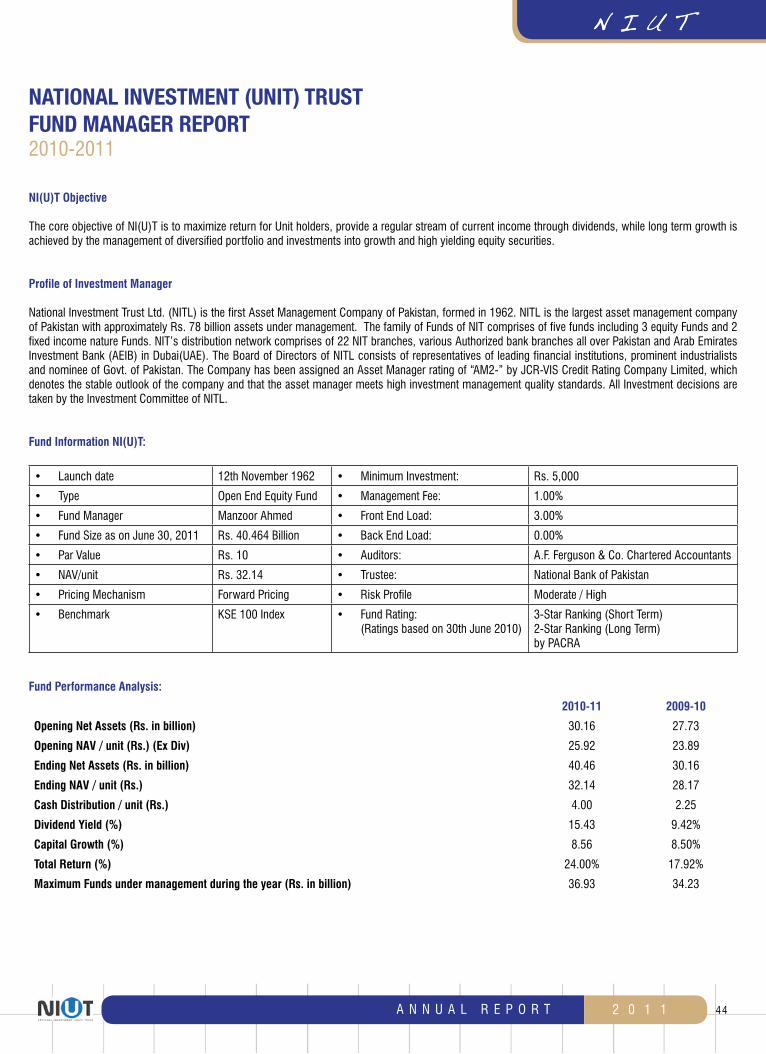
Fund Performance Analysis:
2010-11 2009-10
Opening Net Assets (Rs. in billion) 30.16 27.73
Opening NAV / unit (Rs.) (Ex Div) 25.92 23.89
Ending Net Assets (Rs. in billion) 40.46 30.16
Ending NAV / unit (Rs.) 32.14 28.17
Cash Distribution / unit (Rs.) 4.00 2.25
Dividend Yield (%) 15.43 9.42%
Capital Growth (%) 8.56 8.50%
Total Return (%) 24.00% 17.92%
Maximum Funds under management during the year (Rs. in billion) 36.93 34.23
T H I R D Q U A R T E R R E P O R T M A R C H 2 0 1 1A N N U A L R E P O R T 44
N I U T
NATIONAL INVESTMENT (UNIT) TRUSTFUND MANAGER REPORT2010-2011
N I U T
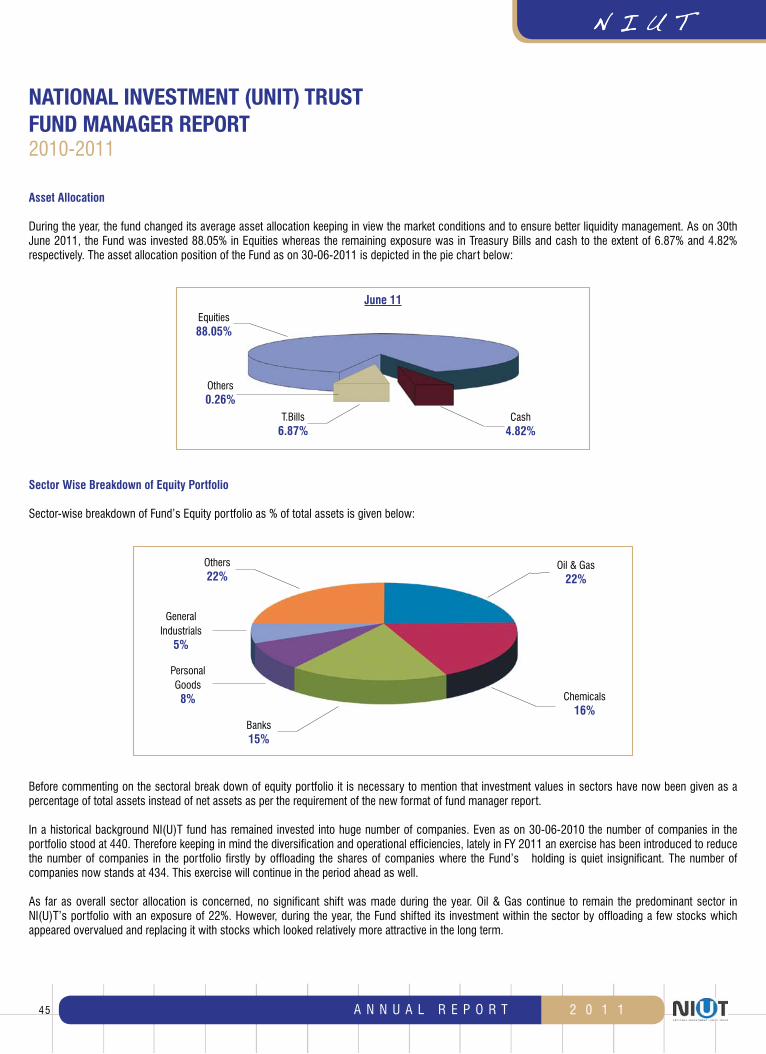
Asset Allocation
During the year, the fund changed its average asset allocation keeping in view the market conditions and to ensure better liquidity management. As on 30th June 2011, the Fund was invested 88.05% in Equities whereas the remaining exposure was in Treasury Bills and cash to the extent of 6.87% and 4.82% respectively. The asset allocation position of the Fund as on 30-06-2011 is depicted in the pie chart below:
Sector Wise Breakdown of Equity Portfolio
Sector-wise breakdown of Fund’s Equity portfolio as % of total assets is given below:
Before commenting on the sectoral break down of equity portfolio it is necessary to mention that investment values in sectors have now been given as a percentage of total assets instead of net assets as per the requirement of the new format of fund manager report.
In a historical background NI(U)T fund has remained invested into huge number of companies. Even as on 30-06-2010 the number of companies in the portfolio stood at 440. Therefore keeping in mind the diversification and operational efficiencies, lately in FY 2011 an exercise has been introduced to reduce the number of companies in the portfolio firstly by offloading the shares of companies where the Fund’s holding is quiet insignificant. The number of companies now stands at 434. This exercise will continue in the period ahead as well.
As far as overall sector allocation is concerned, no significant shift was made during the year. Oil & Gas continue to remain the predominant sector in NI(U)T’s portfolio with an exposure of 22%. However, during the year, the Fund shifted its investment within the sector by offloading a few stocks which appeared overvalued and replacing it with stocks which looked relatively more attractive in the long term.
Equities 88.05%
June 11
T.Bills 6.87%
Others 0.26%
Cash 4.82%
Others22%
Banks 15%
Chemicals 16%
General Industrials
5%
Personal Goods8%
Oil & Gas 22%
T H I R D Q U A R T E R R E P O R T M A R C H2 0 1 1A N N U A L R E P O R T45
N I U T
NATIONAL INVESTMENT (UNIT) TRUSTFUND MANAGER REPORT2010-2011

N I U T
The Chemicals sector was one of the outshinners of the market during the fiscal year 2010-11. The sector outperformed the market by 18% amid high product demand and pricing power of Fertilizers and upward trend in primary margins of PTA. Weight of your Fund in the chemical sector was increased to 16% compared to 13% last year, primarily due to increase in stock prices of the sector. Your Fund had to divest from this sector to bring its investments in compliance with the regulatory requirements. Your Fund made fresh investments in commercial banks in order to maintain its strategic position and also to capture attractive levels. Nevertheless, your Fund’s exposure in the banking sector has dropped to 15% this year as compared to 18% last year mainly due to a decline in the market prices.
Exposure in open-end Mutual Funds has also been greatly reduced to bring portfolio in line with the prevailing rules and regulations.
The Fund also took positions in Personal goods, Industrial Metals, Construction & Material during the year to benefit from opportunities available in these sectors through primary and secondary markets.
It may be pertinent to mention that Fund’s holding in PSO & SNGPL which constitutes about 10% of the portfolio continued to remain frozen under the directive of Government of Pakistan.
Top Ten Holdings
Top ten holdings of the Fund’s portfolio as on June 30th 2011 are as follows:
Fauji Fertilizer Co. Ltd. Siemens Engineering
Pakistan State Oil Pakistan OilFields Ltd.
Bank Al-Habib Ltd. Attock Refinery Ltd.
National Refinery Ltd. Bata Pakistan Ltd.
Habib Metropolitan Bank International Industries Ltd.
Categorization of Unit Holders By Size - (JUNE 2011)
CATEGEORY NI(U)T UNIT HOLDERS % OF HOLDING
Institutional Investors 1,148 72%
Individual 55,048 28%
TOTAL 56,196 100.00%
Stock Market & Fund Performance Review
Amid macro-economic challenges posed to the economy mainly in the aftermath of devastating floods in August 2010, the KSE-100 index gained 28.54% in FY 2010-11. The aggregate market capitalization increased to PKR3.28tn from PKR2.73tn, registering a surge of 20.1%. However, FY11 turned out to be the driest year in the past nine years in terms of market liquidity. The market recorded an average daily volume of 94.5mn shares during FY11, a 41.2% YoY decline, when compared with an average turnover of 162mn shares for FY10. The KSE started off FY11 on a positive note mainly driven by the hopes of early reintroduction of leverage product at the KSE. However raise in the SBP policy rate by 50 bps to 13% and revised government estimates of GDP growth of 2.5%, inflation forecast of 15-20% and fiscal deficit of 6-7% of GDP for FY11 as a result of unprecedented floods, wiped out the gains made by KSE in the early part of the 1st quarter. In the later part of 1st half the SBP further raised the discount rate twice consecutively by 50 bps each taking the policy rate to 14%. Though uncertainty on the political front also increased arising from the RGST issue, yet the KSE-100 managed to gain 2,000 points (up 20%) mainly on the back of foreign investor’s participation in the market.
T H I R D Q U A R T E R R E P O R T M A R C H 2 0 1 1A N N U A L R E P O R T 46
NATIONAL INVESTMENT (UNIT) TRUSTFUND MANAGER REPORT2010-2011
N I U T
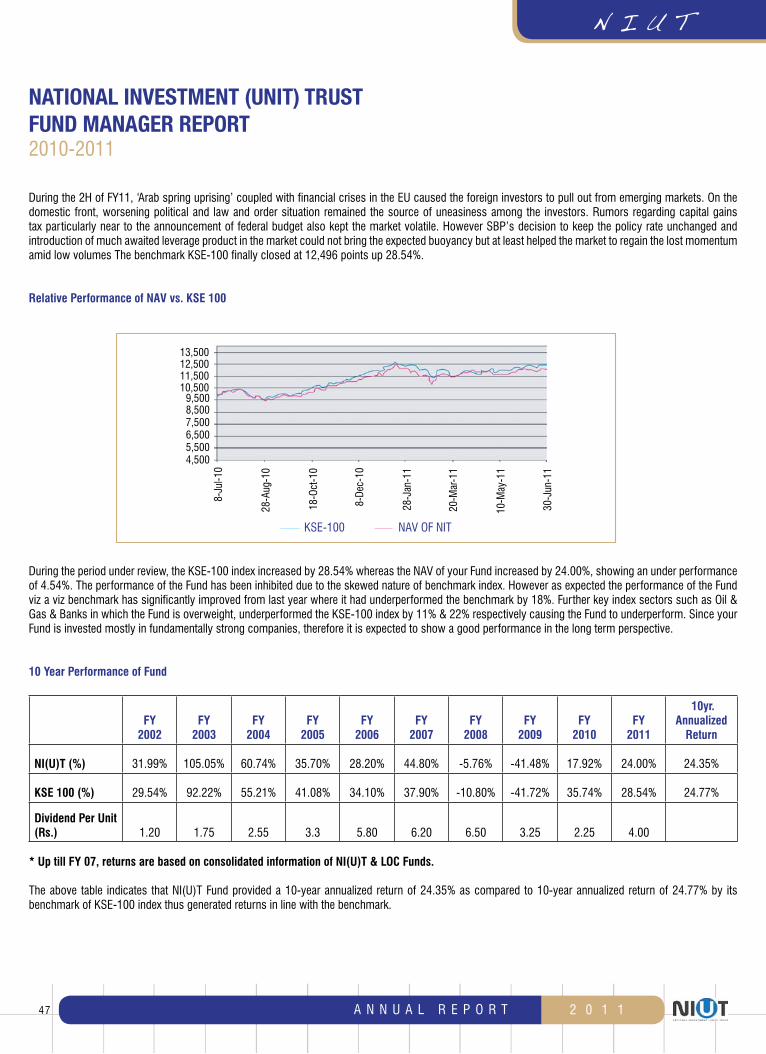
During the 2H of FY11, ‘Arab spring uprising’ coupled with financial crises in the EU caused the foreign investors to pull out from emerging markets. On the domestic front, worsening political and law and order situation remained the source of uneasiness among the investors. Rumors regarding capital gains tax particularly near to the announcement of federal budget also kept the market volatile. However SBP’s decision to keep the policy rate unchanged and introduction of much awaited leverage product in the market could not bring the expected buoyancy but at least helped the market to regain the lost momentum amid low volumes The benchmark KSE-100 finally closed at 12,496 points up 28.54%.
Relative Performance of NAV vs. KSE 100
During the period under review, the KSE-100 index increased by 28.54% whereas the NAV of your Fund increased by 24.00%, showing an under performance of 4.54%. The performance of the Fund has been inhibited due to the skewed nature of benchmark index. However as expected the performance of the Fund viz a viz benchmark has significantly improved from last year where it had underperformed the benchmark by 18%. Further key index sectors such as Oil & Gas & Banks in which the Fund is overweight, underperformed the KSE-100 index by 11% & 22% respectively causing the Fund to underperform. Since your Fund is invested mostly in fundamentally strong companies, therefore it is expected to show a good performance in the long term perspective.
10 Year Performance of Fund
FY
2002FY
2003FY
2004FY
2005FY
2006FY
2007FY
2008FY
2009FY
2010FY
2011
10yr. Annualized
Return
NI(U)T (%) 31.99% 105.05% 60.74% 35.70% 28.20% 44.80% -5.76% -41.48% 17.92% 24.00% 24.35%
KSE 100 (%) 29.54% 92.22% 55.21% 41.08% 34.10% 37.90% -10.80% -41.72% 35.74% 28.54% 24.77%
Dividend Per Unit(Rs.) 1.20 1.75 2.55 3.3 5.80 6.20 6.50 3.25 2.25 4.00
* Up till FY 07, returns are based on consolidated information of NI(U)T & LOC Funds.
The above table indicates that NI(U)T Fund provided a 10-year annualized return of 24.35% as compared to 10-year annualized return of 24.77% by its benchmark of KSE-100 index thus generated returns in line with the benchmark.
8-Ju
l-10
28-A
ug-1
0
18-O
ct-1
0
8-De
c-10
28-J
an-1
1
20-M
ar-1
1
10-M
ay-1
1
30-J
un-1
1
4,5005,5006,5007,5008,5009,500
10,50011,50012,50013,500
KSE-100 NAV OF NIT
T H I R D Q U A R T E R R E P O R T M A R C H2 0 1 1A N N U A L R E P O R T47
NATIONAL INVESTMENT (UNIT) TRUSTFUND MANAGER REPORT2010-2011
N I U T
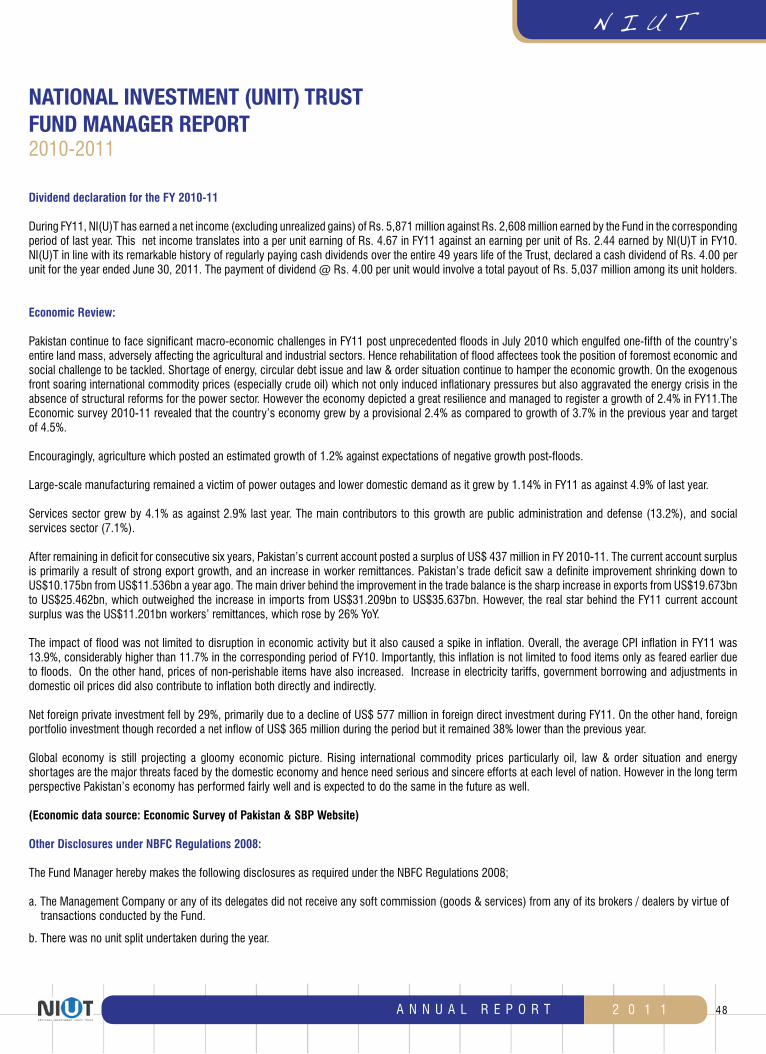
Dividend declaration for the FY 2010-11
During FY11, NI(U)T has earned a net income (excluding unrealized gains) of Rs. 5,871 million against Rs. 2,608 million earned by the Fund in the corresponding period of last year. This net income translates into a per unit earning of Rs. 4.67 in FY11 against an earning per unit of Rs. 2.44 earned by NI(U)T in FY10. NI(U)T in line with its remarkable history of regularly paying cash dividends over the entire 49 years life of the Trust, declared a cash dividend of Rs. 4.00 per unit for the year ended June 30, 2011. The payment of dividend @ Rs. 4.00 per unit would involve a total payout of Rs. 5,037 million among its unit holders.
Economic Review:
Pakistan continue to face significant macro-economic challenges in FY11 post unprecedented floods in July 2010 which engulfed one-fifth of the country’s entire land mass, adversely affecting the agricultural and industrial sectors. Hence rehabilitation of flood affectees took the position of foremost economic and social challenge to be tackled. Shortage of energy, circular debt issue and law & order situation continue to hamper the economic growth. On the exogenous front soaring international commodity prices (especially crude oil) which not only induced inflationary pressures but also aggravated the energy crisis in the absence of structural reforms for the power sector. However the economy depicted a great resilience and managed to register a growth of 2.4% in FY11.The Economic survey 2010-11 revealed that the country’s economy grew by a provisional 2.4% as compared to growth of 3.7% in the previous year and target of 4.5%.
Encouragingly, agriculture which posted an estimated growth of 1.2% against expectations of negative growth post-floods.
Large-scale manufacturing remained a victim of power outages and lower domestic demand as it grew by 1.14% in FY11 as against 4.9% of last year.
Services sector grew by 4.1% as against 2.9% last year. The main contributors to this growth are public administration and defense (13.2%), and social services sector (7.1%).
After remaining in deficit for consecutive six years, Pakistan’s current account posted a surplus of US$ 437 million in FY 2010-11. The current account surplus is primarily a result of strong export growth, and an increase in worker remittances. Pakistan’s trade deficit saw a definite improvement shrinking down to US$10.175bn from US$11.536bn a year ago. The main driver behind the improvement in the trade balance is the sharp increase in exports from US$19.673bn to US$25.462bn, which outweighed the increase in imports from US$31.209bn to US$35.637bn. However, the real star behind the FY11 current account surplus was the US$11.201bn workers’ remittances, which rose by 26% YoY.
The impact of flood was not limited to disruption in economic activity but it also caused a spike in inflation. Overall, the average CPI inflation in FY11 was 13.9%, considerably higher than 11.7% in the corresponding period of FY10. Importantly, this inflation is not limited to food items only as feared earlier due to floods. On the other hand, prices of non-perishable items have also increased. Increase in electricity tariffs, government borrowing and adjustments in domestic oil prices did also contribute to inflation both directly and indirectly.
Net foreign private investment fell by 29%, primarily due to a decline of US$ 577 million in foreign direct investment during FY11. On the other hand, foreign portfolio investment though recorded a net inflow of US$ 365 million during the period but it remained 38% lower than the previous year.
Global economy is still projecting a gloomy economic picture. Rising international commodity prices particularly oil, law & order situation and energy shortages are the major threats faced by the domestic economy and hence need serious and sincere efforts at each level of nation. However in the long term perspective Pakistan’s economy has performed fairly well and is expected to do the same in the future as well.
(Economic data source: Economic Survey of Pakistan & SBP Website)
Other Disclosures under NBFC Regulations 2008:
The Fund Manager hereby makes the following disclosures as required under the NBFC Regulations 2008;
a. The Management Company or any of its delegates did not receive any soft commission (goods & services) from any of its brokers / dealers by virtue of transactions conducted by the Fund.
b. There was no unit split undertaken during the year.
T H I R D Q U A R T E R R E P O R T M A R C H 2 0 1 1A N N U A L R E P O R T 48
NATIONAL INVESTMENT (UNIT) TRUSTFUND MANAGER REPORT2010-2011
T r u s t e e R e p o r t
REPORT OF THE TRUSTEE
National Investment Trust Limited (NITL), the Management Company of National Investment (Unit) Trust (NI(U)T) has, based on
the information provided to the Trustee and to the best of our knowledge, managed NI(U)T in material respects during the period
July 01, 2010 to June 30, 2011 in accordance with the provisions of the Trust Deed dated November 12, 1962 as amended by the
Supplemental Trust Deeds dated June 26, 1968, June 07, 1981, November 27, 1998, November 12, 2002, December 31, 2003
and January 18, 2007, the Non-Banking Finance Companies (Establishment and Regulations) Rules, 2003 and the Non-Banking
Finance Companies and Notified Entities Regulations, 2008.
Sd/- Sd/-
Mirza Babur Baig Aamir Sattar
SVP / Wing Head EVP / Financial Controller
For National Bank of PakistanDated September 07, 2011
T H I R D Q U A R T E R R E P O R T M A R C H2 0 1 1A N N U A L R E P O R T49
A u d i t o r s ’ R e p o r t
INDEPENDENT AUDITORS’ REPORT TO THE UNIT HOLDERS
We have audited the accompanying financial statements of National Investment (Unit) Trust, which comprise the statement of assets and liabilities as at June 30, 2011, and the related income statement, statement of comprehensive income, distribution statement, statement of movement in unit holders’ fund and cash flow statement for the year then ended, and a summary of significant accounting policies and other explanatory notes.
Management Company’s responsibility for the financial statements
The Management Company of the Fund is responsible for the preparation and fair presentation of these financial statements in accordance with approved accounting standards as applicable in Pakistan, and for such internal control as management determines is necessary to enable the preparation of financial statements that are free from material misstatement, whether due to fraud or error.
Auditor’s responsibility
Our responsibility is to express an opinion on these financial statements based on our audit. We conducted our audit in accordance with the International Standards on Auditing as applicable in Pakistan. Those standards require that we comply with ethical requirements and plan and perform the audit to obtain reasonable assurance whether the financial statements are free from material misstatements.
An audit involves performing procedures to obtain audit evidence about the amounts and disclosures in the financial statements. The procedures selected depend on the auditor’s judgment, including the assessment of the risks of material misstatement of the financial statements, whether due to fraud or error. In making those risk assessments, the auditor considers internal control relevant to the entity’s preparation and fair presentation of the financial statements in order to design audit procedures that are appropriate in the circumstances, but not for the purpose of expressing an opinion on the effectiveness of the entity’s internal control. An audit also includes evaluating the appropriateness of accounting policies used and the reasonableness of accounting estimates made by management, as well as evaluating the overall presentation of the financial statements. We believe that the audit evidence we have obtained is sufficient and appropriate to provide a basis for our audit opinion.
Opinion
In our opinion, the financial statements give a true and fair view of the financial position of the Fund as at June 30, 2011, and of its financial performance, cash flows and transactions for the year then ended in accordance with approved accounting standards as applicable in Pakistan.
Other matters
In our opinion, the financial statements have been prepared in all material respects in accordance with the relevant provisions of the Non-Banking Finance Companies and Notified Entities Regulations, 2008.
Sd/-A.F. Ferguson & Co.
Chartered Accountants
Engagement Partner: Rashid A. Jafer
Dated: August 22, 2011Karachi
T H I R D Q U A R T E R R E P O R T M A R C H 2 0 1 1A N N U A L R E P O R T 50

N I U T
Note 2011 2010
(Rupees in ‘000)
ASSETS
Bank balances 4 1,988,677 1,381,120
Receivable from National Investment Trust Limited
- Management Company - 80
Investments 5 39,154,572 29,464,973
Loans and receivables 6 - -
Receivable against sale of investments 51,625 -
Dividend and other receivables 7 52,067 24,483
Deposit with National Clearing Company of Pakistan Limited 2,500 2,500
Total assets 41,249,441 30,873,156
LIABILITIES
Short-term finances 8 - 250,000
Payable to National Investment Trust Limited - Management Company 9 270,788 58,920
Fee payable to Securities and Exchange Commission of Pakistan 10 33,020 29,752
Creditors, accrued and other liabilities 11 173,904 71,620
Unclaimed distribution 12 307,178 306,506
Total liabilities 784,890 716,798
NET ASSETS 40,464,551 30,156,358
Unit holders’ fund (as per statement attached) 40,464,551 30,156,358
Contingencies and commitments 13
(Number of units in ‘000)
Number of units in issue 14 1,259,181 1,070,649
(Rupees)
Net asset value per unit 32.14 28.17
The annexed notes from 1 to 29 and Annexures 1 to 4 form an integral part of these financial statements.
For National Investment Trust Limited(Management Company)
Sd/- Sd/- Sd/-
Managing Director Director Director
E.V.P. / Divisional Head For National Bank of Pakistan (Trustee)
NATIONAL INVESTMENT (UNIT) TRUSTSTATEMENT OF ASSETS AND LIABILITIESAS AT JUNE 30, 2011
T H I R D Q U A R T E R R E P O R T M A R C H2 0 1 1A N N U A L R E P O R T51
N I U T
Note 2011 2010
(Rupees in ‘000)
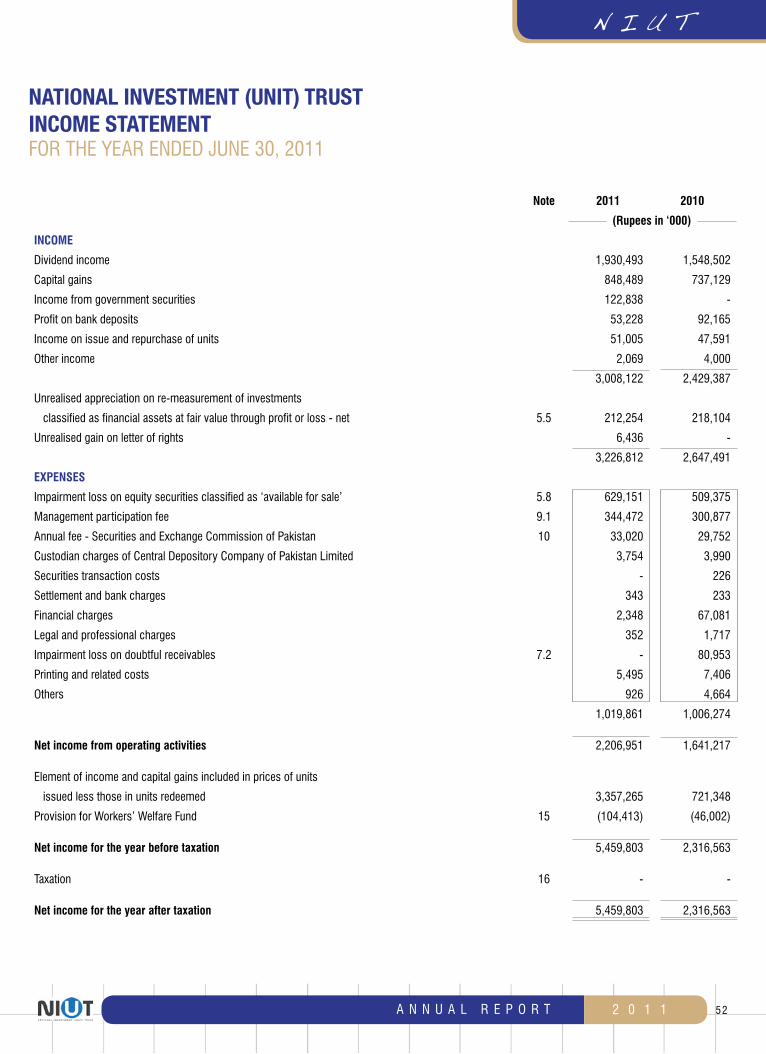
INCOME
Dividend income 1,930,493 1,548,502
Capital gains 848,489 737,129
Income from government securities 122,838 -
Profit on bank deposits 53,228 92,165
Income on issue and repurchase of units 51,005 47,591
Other income 2,069 4,000
3,008,122 2,429,387
Unrealised appreciation on re-measurement of investments
classified as financial assets at fair value through profit or loss - net 5.5 212,254 218,104
Unrealised gain on letter of rights 6,436 -
3,226,812 2,647,491
EXPENSES
Impairment loss on equity securities classified as ‘available for sale’ 5.8 629,151 509,375
Management participation fee 9.1 344,472 300,877
Annual fee - Securities and Exchange Commission of Pakistan 10 33,020 29,752
Custodian charges of Central Depository Company of Pakistan Limited 3,754 3,990
Securities transaction costs - 226
Settlement and bank charges 343 233
Financial charges 2,348 67,081
Legal and professional charges 352 1,717
Impairment loss on doubtful receivables 7.2 - 80,953
Printing and related costs 5,495 7,406
Others 926 4,664
1,019,861 1,006,274
Net income from operating activities 2,206,951 1,641,217
Element of income and capital gains included in prices of units
issued less those in units redeemed 3,357,265 721,348
Provision for Workers’ Welfare Fund 15 (104,413) (46,002)
Net income for the year before taxation 5,459,803 2,316,563
Taxation 16 - -
Net income for the year after taxation 5,459,803 2,316,563
NATIONAL INVESTMENT (UNIT) TRUSTINCOME STATEMENTFOR THE YEAR ENDED JUNE 30, 2011
T H I R D Q U A R T E R R E P O R T M A R C H 2 0 1 1A N N U A L R E P O R T 52

N I U T
Note 2011 2010
(Rupees)
Earnings per unit 17
With unrealised appreciation on re-measurement of investments
classified as financial assets at fair value through profit or loss 4.34 2.16
Without unrealised appreciation on re-measurement of investments
classified as financial assets at fair value through profit or loss and
impairment loss on equity securities classified as ‘available for sale’ 4.67 2.44
The annexed notes from 1 to 29 and Annexures 1 to 4 form an integral part of these financial statements.
NATIONAL INVESTMENT (UNIT) TRUSTINCOME STATEMENTFOR THE YEAR ENDED JUNE 30, 2011
For National Investment Trust Limited(Management Company)
Sd/- Sd/- Sd/-
Managing Director Director Director
E.V.P. / Divisional Head For National Bank of Pakistan (Trustee)
T H I R D Q U A R T E R R E P O R T M A R C H2 0 1 1A N N U A L R E P O R T53
N I U T
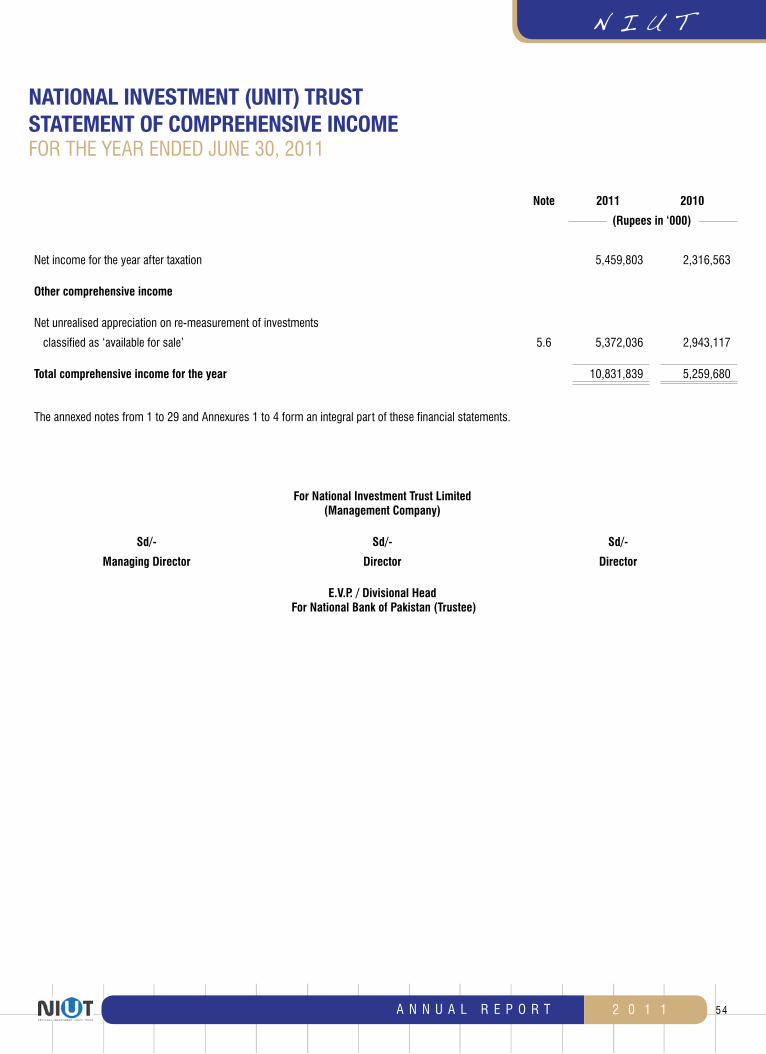
Note 2011 2010
(Rupees in ‘000)
Net income for the year after taxation 5,459,803 2,316,563
Other comprehensive income
Net unrealised appreciation on re-measurement of investments
classified as ‘available for sale’ 5.6 5,372,036 2,943,117
Total comprehensive income for the year 10,831,839 5,259,680
The annexed notes from 1 to 29 and Annexures 1 to 4 form an integral part of these financial statements.
NATIONAL INVESTMENT (UNIT) TRUSTSTATEMENT OF COMPREHENSIVE INCOMEFOR THE YEAR ENDED JUNE 30, 2011
For National Investment Trust Limited(Management Company)
Sd/- Sd/- Sd/-
Managing Director Director Director
E.V.P. / Divisional Head For National Bank of Pakistan (Trustee)
T H I R D Q U A R T E R R E P O R T M A R C H 2 0 1 1A N N U A L R E P O R T 54

N I U T
2011 2010
(Rupees in ‘000)
Undistributed income brought forward 7,715,047 8,719,766
Final distribution for the year ended June 30, 2010: Rs 2.25
per unit (2009: Rs. 3.25 per unit) (2,408,960) (3,321,282)
Net income for the year after taxation 5,459,803 2,316,563
Undistributed income carried forward 10,765,890 7,715,047
The annexed notes from 1 to 29 and Annexures 1 to 4 form an integral part of these financial statements.
NATIONAL INVESTMENT (UNIT) TRUSTDISTRIBUTION STATEMENTFOR THE YEAR ENDED JUNE 30, 2011
For National Investment Trust Limited(Management Company)
Sd/- Sd/- Sd/-
Managing Director Director Director
E.V.P. / Divisional Head For National Bank of Pakistan (Trustee)
T H I R D Q U A R T E R R E P O R T M A R C H2 0 1 1A N N U A L R E P O R T55
N I U T
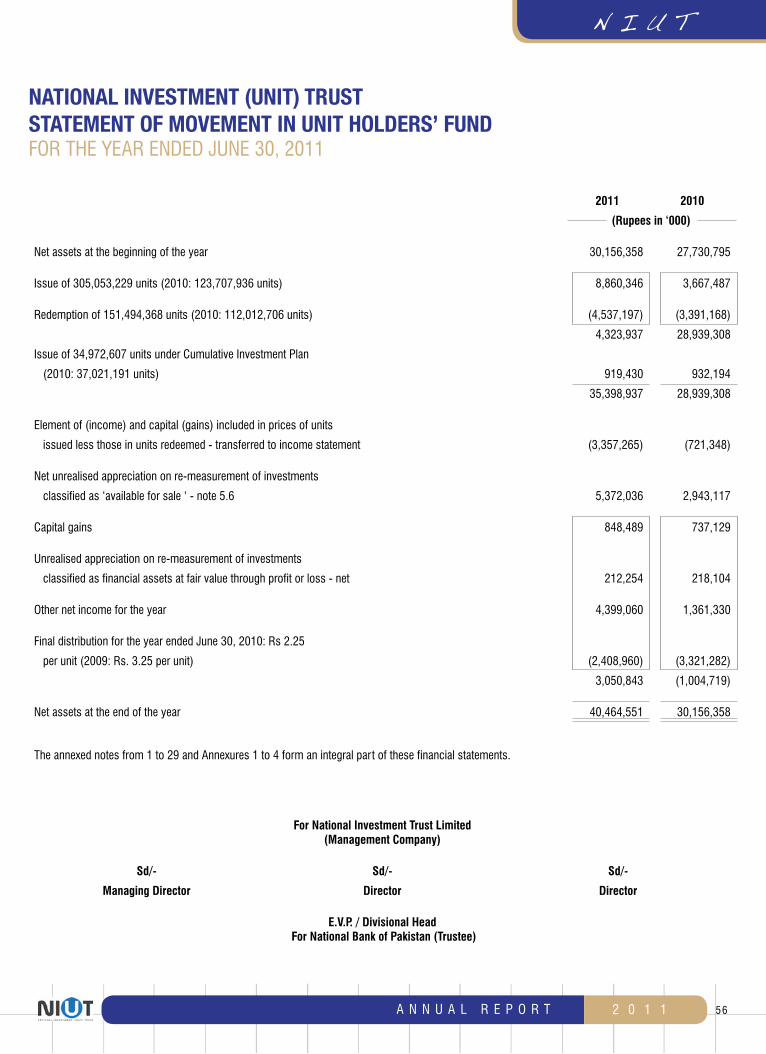
2011 2010
(Rupees in ‘000)
Net assets at the beginning of the year 30,156,358 27,730,795
Issue of 305,053,229 units (2010: 123,707,936 units) 8,860,346 3,667,487
Redemption of 151,494,368 units (2010: 112,012,706 units) (4,537,197) (3,391,168)
4,323,937 28,939,308
Issue of 34,972,607 units under Cumulative Investment Plan
(2010: 37,021,191 units) 919,430 932,194
35,398,937 28,939,308
Element of (income) and capital (gains) included in prices of units
issued less those in units redeemed - transferred to income statement (3,357,265) (721,348)
Net unrealised appreciation on re-measurement of investments
classified as ‘available for sale ‘ - note 5.6 5,372,036 2,943,117
Capital gains 848,489 737,129
Unrealised appreciation on re-measurement of investments
classified as financial assets at fair value through profit or loss - net 212,254 218,104
Other net income for the year 4,399,060 1,361,330
Final distribution for the year ended June 30, 2010: Rs 2.25
per unit (2009: Rs. 3.25 per unit) (2,408,960) (3,321,282)
3,050,843 (1,004,719)
Net assets at the end of the year 40,464,551 30,156,358
The annexed notes from 1 to 29 and Annexures 1 to 4 form an integral part of these financial statements.
NATIONAL INVESTMENT (UNIT) TRUSTSTATEMENT OF MOVEMENT IN UNIT HOLDERS’ FUNDFOR THE YEAR ENDED JUNE 30, 2011
For National Investment Trust Limited(Management Company)
Sd/- Sd/- Sd/-
Managing Director Director Director
E.V.P. / Divisional Head For National Bank of Pakistan (Trustee)
T H I R D Q U A R T E R R E P O R T M A R C H 2 0 1 1A N N U A L R E P O R T 56
N I U T
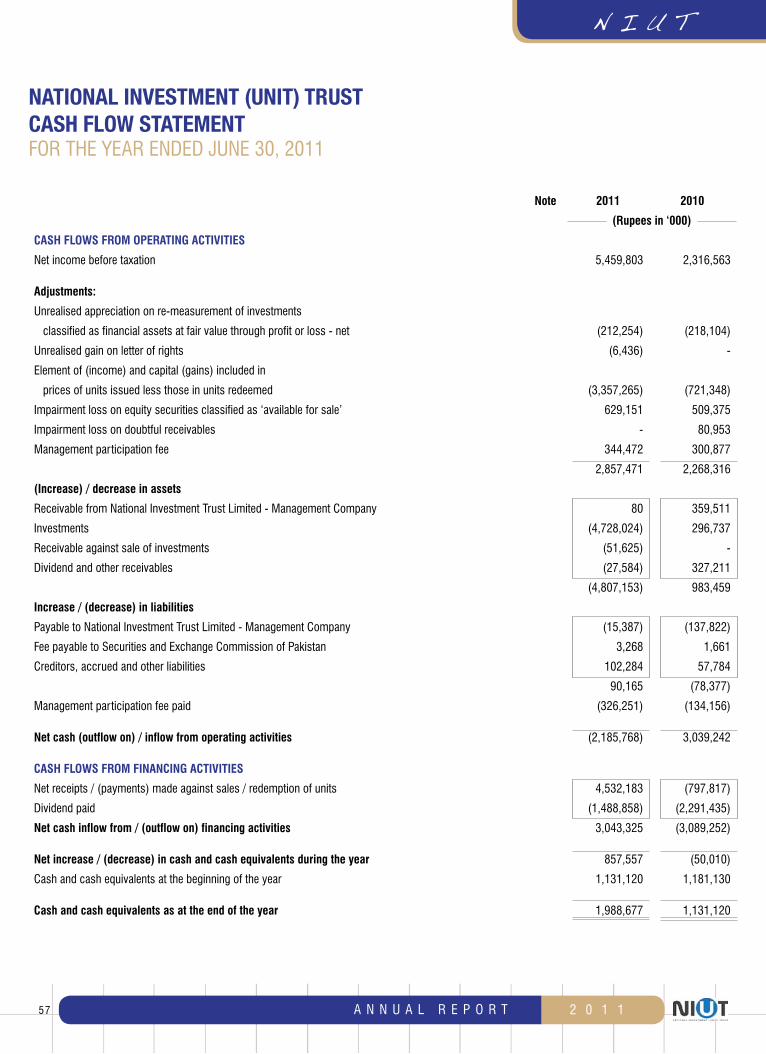
Note 2011 2010
(Rupees in ‘000)
CASH FLOWS FROM OPERATING ACTIVITIES
Net income before taxation 5,459,803 2,316,563
Adjustments:
Unrealised appreciation on re-measurement of investments
classified as financial assets at fair value through profit or loss - net (212,254) (218,104)
Unrealised gain on letter of rights (6,436) -
Element of (income) and capital (gains) included in
prices of units issued less those in units redeemed (3,357,265) (721,348)
Impairment loss on equity securities classified as ‘available for sale’ 629,151 509,375
Impairment loss on doubtful receivables - 80,953
Management participation fee 344,472 300,877
2,857,471 2,268,316
(Increase) / decrease in assets
Receivable from National Investment Trust Limited - Management Company 80 359,511
Investments (4,728,024) 296,737
Receivable against sale of investments (51,625) -
Dividend and other receivables (27,584) 327,211
(4,807,153) 983,459
Increase / (decrease) in liabilities
Payable to National Investment Trust Limited - Management Company (15,387) (137,822)
Fee payable to Securities and Exchange Commission of Pakistan 3,268 1,661
Creditors, accrued and other liabilities 102,284 57,784
90,165 (78,377)
Management participation fee paid (326,251) (134,156)
Net cash (outflow on) / inflow from operating activities (2,185,768) 3,039,242
CASH FLOWS FROM FINANCING ACTIVITIES
Net receipts / (payments) made against sales / redemption of units 4,532,183 (797,817)
Dividend paid (1,488,858) (2,291,435)
Net cash inflow from / (outflow on) financing activities 3,043,325 (3,089,252)
Net increase / (decrease) in cash and cash equivalents during the year 857,557 (50,010)
Cash and cash equivalents at the beginning of the year 1,131,120 1,181,130
Cash and cash equivalents as at the end of the year 1,988,677 1,131,120
NATIONAL INVESTMENT (UNIT) TRUSTCASH FLOW STATEMENTFOR THE YEAR ENDED JUNE 30, 2011
T H I R D Q U A R T E R R E P O R T M A R C H2 0 1 1A N N U A L R E P O R T57
N I U T
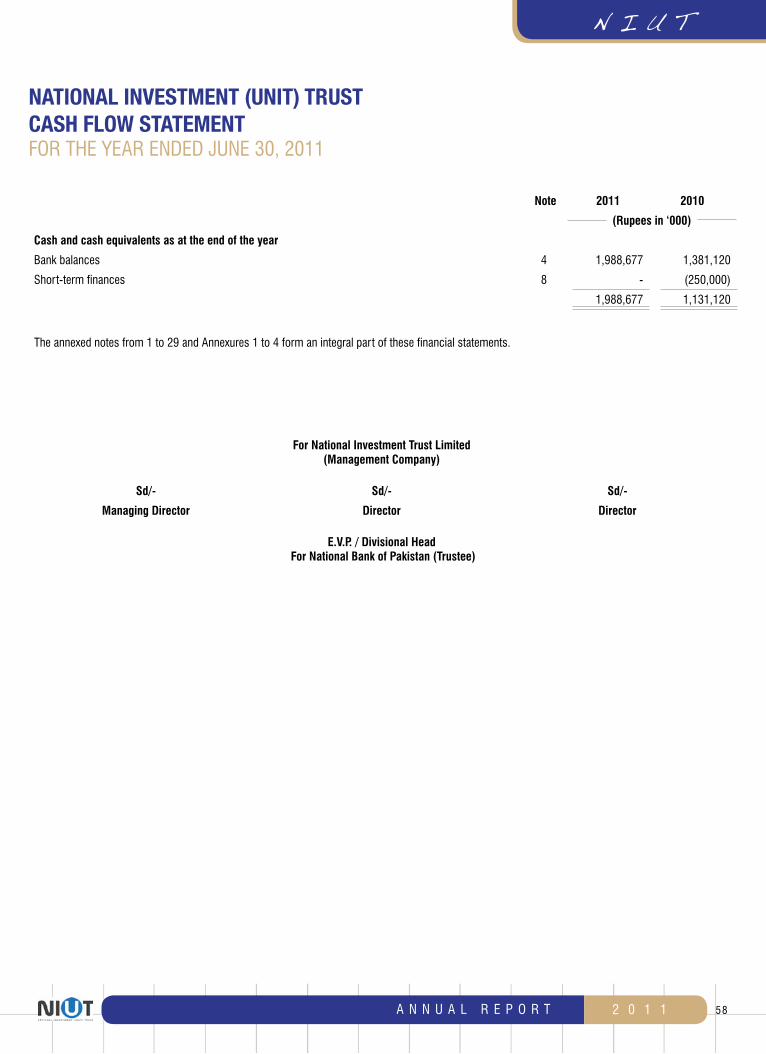
Note 2011 2010
(Rupees in ‘000)
Cash and cash equivalents as at the end of the year
Bank balances 4 1,988,677 1,381,120
Short-term finances 8 - (250,000)
1,988,677 1,131,120
The annexed notes from 1 to 29 and Annexures 1 to 4 form an integral part of these financial statements.
NATIONAL INVESTMENT (UNIT) TRUSTCASH FLOW STATEMENTFOR THE YEAR ENDED JUNE 30, 2011
For National Investment Trust Limited(Management Company)
Sd/- Sd/- Sd/-
Managing Director Director Director
E.V.P. / Divisional Head For National Bank of Pakistan (Trustee)
T H I R D Q U A R T E R R E P O R T M A R C H 2 0 1 1A N N U A L R E P O R T 58
N I U T
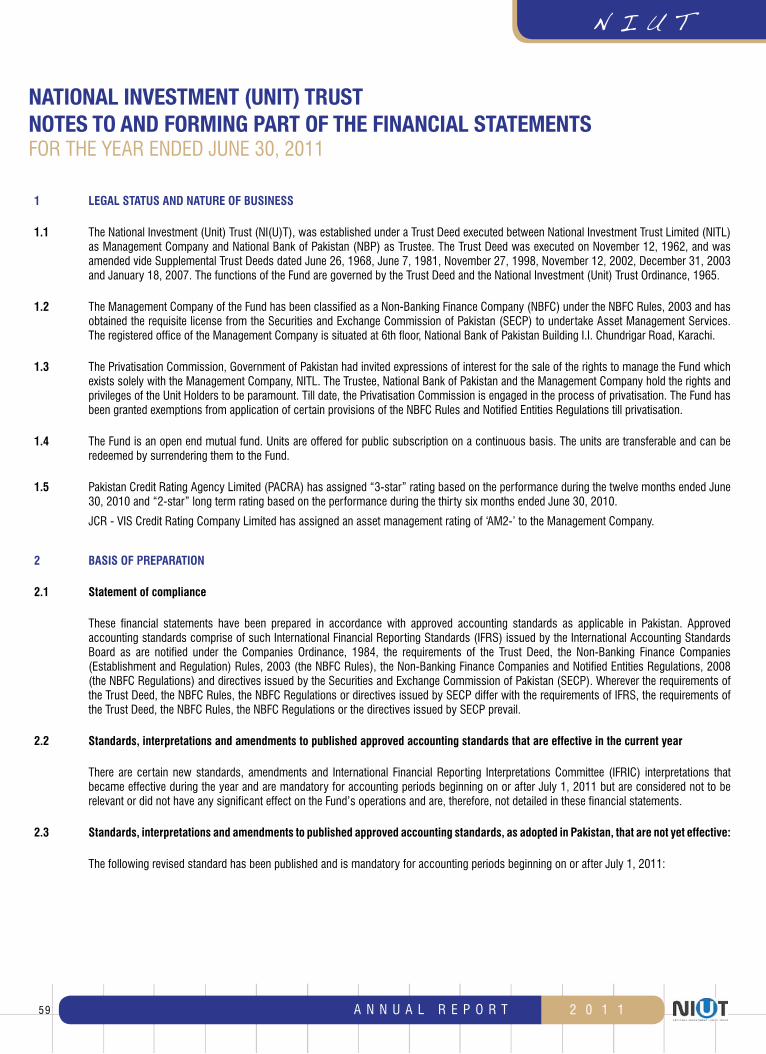
1 LEGAL STATUS AND NATURE OF BUSINESS
1.1 The National Investment (Unit) Trust (NI(U)T), was established under a Trust Deed executed between National Investment Trust Limited (NITL) as Management Company and National Bank of Pakistan (NBP) as Trustee. The Trust Deed was executed on November 12, 1962, and was amended vide Supplemental Trust Deeds dated June 26, 1968, June 7, 1981, November 27, 1998, November 12, 2002, December 31, 2003 and January 18, 2007. The functions of the Fund are governed by the Trust Deed and the National Investment (Unit) Trust Ordinance, 1965.
1.2 The Management Company of the Fund has been classified as a Non-Banking Finance Company (NBFC) under the NBFC Rules, 2003 and has obtained the requisite license from the Securities and Exchange Commission of Pakistan (SECP) to undertake Asset Management Services. The registered office of the Management Company is situated at 6th floor, National Bank of Pakistan Building I.I. Chundrigar Road, Karachi.
1.3 The Privatisation Commission, Government of Pakistan had invited expressions of interest for the sale of the rights to manage the Fund which exists solely with the Management Company, NITL. The Trustee, National Bank of Pakistan and the Management Company hold the rights and privileges of the Unit Holders to be paramount. Till date, the Privatisation Commission is engaged in the process of privatisation. The Fund has been granted exemptions from application of certain provisions of the NBFC Rules and Notified Entities Regulations till privatisation.
1.4 The Fund is an open end mutual fund. Units are offered for public subscription on a continuous basis. The units are transferable and can be redeemed by surrendering them to the Fund.
1.5 Pakistan Credit Rating Agency Limited (PACRA) has assigned “3-star” rating based on the performance during the twelve months ended June 30, 2010 and “2-star” long term rating based on the performance during the thirty six months ended June 30, 2010.
JCR - VIS Credit Rating Company Limited has assigned an asset management rating of ‘AM2-’ to the Management Company.
2 BASIS OF PREPARATION
2.1 Statement of compliance
These financial statements have been prepared in accordance with approved accounting standards as applicable in Pakistan. Approved accounting standards comprise of such International Financial Reporting Standards (IFRS) issued by the International Accounting Standards Board as are notified under the Companies Ordinance, 1984, the requirements of the Trust Deed, the Non-Banking Finance Companies (Establishment and Regulation) Rules, 2003 (the NBFC Rules), the Non-Banking Finance Companies and Notified Entities Regulations, 2008 (the NBFC Regulations) and directives issued by the Securities and Exchange Commission of Pakistan (SECP). Wherever the requirements of the Trust Deed, the NBFC Rules, the NBFC Regulations or directives issued by SECP differ with the requirements of IFRS, the requirements of the Trust Deed, the NBFC Rules, the NBFC Regulations or the directives issued by SECP prevail.
2.2 Standards, interpretations and amendments to published approved accounting standards that are effective in the current year
There are certain new standards, amendments and International Financial Reporting Interpretations Committee (IFRIC) interpretations that became effective during the year and are mandatory for accounting periods beginning on or after July 1, 2011 but are considered not to be relevant or did not have any significant effect on the Fund’s operations and are, therefore, not detailed in these financial statements.
2.3 Standards, interpretations and amendments to published approved accounting standards, as adopted in Pakistan, that are not yet effective:
The following revised standard has been published and is mandatory for accounting periods beginning on or after July 1, 2011:
NATIONAL INVESTMENT (UNIT) TRUSTNOTES TO AND FORMING PART OF THE FINANCIAL STATEMENTSFOR THE YEAR ENDED JUNE 30, 2011
T H I R D Q U A R T E R R E P O R T M A R C H2 0 1 1A N N U A L R E P O R T59

N I U T
IAS 24 (revised), ‘Related party disclosures’, issued in November 2009. It supersedes IAS 24, ‘Related party disclosures’, issued in 2003. The revised standard clarifies and simplifies the definition of a related party and removes the requirement for government-related entities to disclose details of all transactions with the government and other government-related entities. The Fund will apply the revised standard from July 1, 2011. The Fund is currently in the process of assessing the impact, if any, of the revised standard on the related party disclosures.
There are other amendments to the standards, improvements to International Financial Reporting Standards and new interpretations that are mandatory for accounting periods beginning on or after July 1, 2011 but are considered not to be relevant or do not have any significant effect on the Fund’s operations and are therefore not detailed in these financial statements.
2.4 Critical accounting estimates and judgments
The preparation of financial statements in conformity with approved accounting standards requires the use of certain critical accounting estimates. It also requires the management to exercise its judgment in the process of applying the Fund’s accounting policies. Estimates and judgments are continually evaluated and are based on historical experience, including expectations of future events that are believed to be reasonable under the circumstances. The areas where various assumptions and estimates are significant to the Fund’s financial statements or where judgment was exercised in application of accounting policies principally relate to classification and valuation of investments (note 3.1 and note 5).
2.5 Accounting convention
These financial statements have been prepared under the historical cost convention except that certain investments have been carried at fair value.
2.6 Functional and presentation currency
These financial statements are presented in Pak Rupees, which is the Fund’s functional and presentation currency.
3 SUMMARY OF SIGNIFICANT ACCOUNTING POLICIES
The principal accounting policies applied in the preparation of these financial statements are set out below. These policies have been consistently applied unless otherwise stated.
3.1 Financial assets
3.1.1 Classification
The Fund classifies its financial assets in the following categories: loans and receivables, at fair value through profit or loss, available for sale and held to maturity. The classification depends on the purpose for which the financial assets were acquired. Management determines the classification of its financial assets at initial recognition.
a) Loans and receivables
These are non-derivative financial assets with fixed or determinable payments that are not quoted in an active market.
b) Financial assets at fair value through profit or loss
Financial assets that are acquired principally for the purpose of generating profit from short-term fluctuations in prices are classified as held for trading in the ‘Financial assets at fair value through profit or loss’ category.
NATIONAL INVESTMENT (UNIT) TRUSTNOTES TO AND FORMING PART OF THE FINANCIAL STATEMENTSFOR THE YEAR ENDED JUNE 30, 2011
T H I R D Q U A R T E R R E P O R T M A R C H 2 0 1 1A N N U A L R E P O R T 60
N I U T
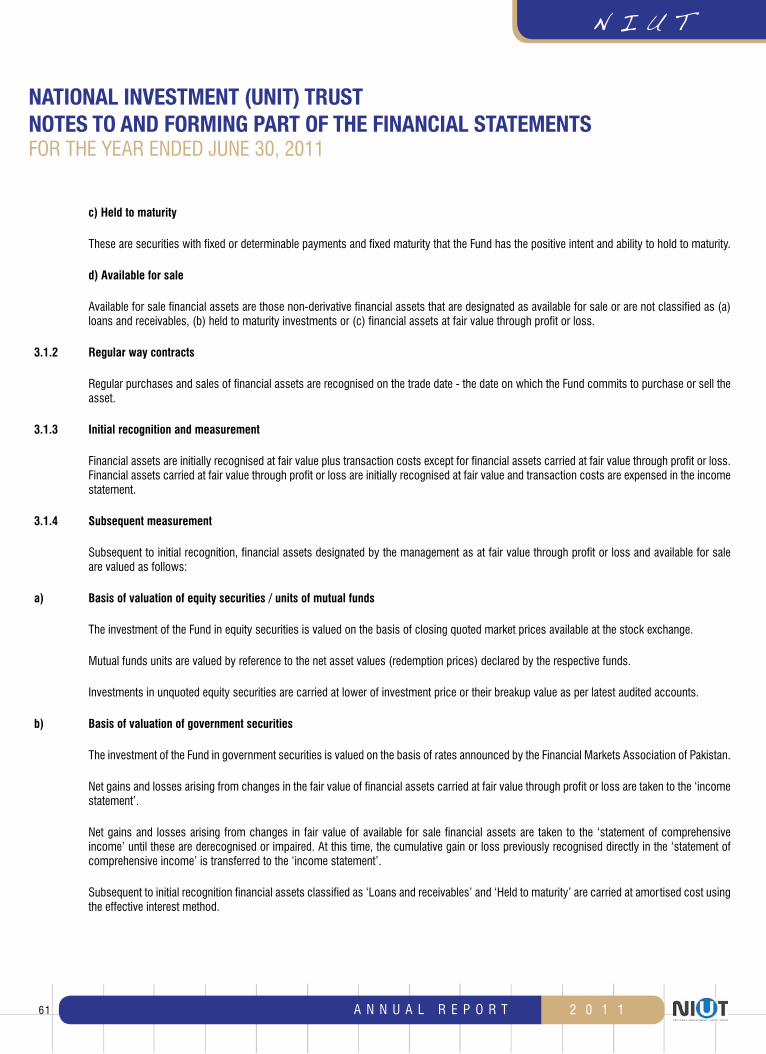
c) Held to maturity
These are securities with fixed or determinable payments and fixed maturity that the Fund has the positive intent and ability to hold to maturity.
d) Available for sale
Available for sale financial assets are those non-derivative financial assets that are designated as available for sale or are not classified as (a) loans and receivables, (b) held to maturity investments or (c) financial assets at fair value through profit or loss.
3.1.2 Regular way contracts
Regular purchases and sales of financial assets are recognised on the trade date - the date on which the Fund commits to purchase or sell the asset.
3.1.3 Initial recognition and measurement
Financial assets are initially recognised at fair value plus transaction costs except for financial assets carried at fair value through profit or loss. Financial assets carried at fair value through profit or loss are initially recognised at fair value and transaction costs are expensed in the income statement.
3.1.4 Subsequent measurement
Subsequent to initial recognition, financial assets designated by the management as at fair value through profit or loss and available for sale are valued as follows:
a) Basis of valuation of equity securities / units of mutual funds
The investment of the Fund in equity securities is valued on the basis of closing quoted market prices available at the stock exchange.
Mutual funds units are valued by reference to the net asset values (redemption prices) declared by the respective funds.
Investments in unquoted equity securities are carried at lower of investment price or their breakup value as per latest audited accounts.
b) Basis of valuation of government securities
The investment of the Fund in government securities is valued on the basis of rates announced by the Financial Markets Association of Pakistan.
Net gains and losses arising from changes in the fair value of financial assets carried at fair value through profit or loss are taken to the ‘income statement’.
Net gains and losses arising from changes in fair value of available for sale financial assets are taken to the ‘statement of comprehensive income’ until these are derecognised or impaired. At this time, the cumulative gain or loss previously recognised directly in the ‘statement of comprehensive income’ is transferred to the ‘income statement’.
Subsequent to initial recognition financial assets classified as ‘Loans and receivables’ and ‘Held to maturity’ are carried at amortised cost using the effective interest method.
NATIONAL INVESTMENT (UNIT) TRUSTNOTES TO AND FORMING PART OF THE FINANCIAL STATEMENTSFOR THE YEAR ENDED JUNE 30, 2011
T H I R D Q U A R T E R R E P O R T M A R C H2 0 1 1A N N U A L R E P O R T61

N I U T
Gain or loss is also recognised in the ‘income statement’ when financial assets carried at amortised cost are derecognised or impaired, and through the amortisation process.
3.1.5 Impairment
The Fund assesses at each reporting date whether there is objective evidence that the financial asset or a group of financial assets is impaired. In the case of equity securities classified as available for sale, a significant or prolonged decline in the fair value of the security below its cost is considered, among other indicators, as an indicator that the securities are impaired. If any such evidence exists for available for sale financial assets, the cumulative loss measured as the difference between the acquisition cost and the current fair value, less any impairment loss on that financial asset previously recognised in income statement is reclassified from unit holders’ fund to ‘income statement’. Impairment losses recognised on equity instruments are not reversed through the income statement.
For financial assets classified as ‘loans and receivables’ and ‘held to maturity’, a provision for impairment is established when there is objective evidence that the Fund will not be able to collect all amounts due according to the original terms. The amount of the provision is determined based on the provisioning criteria specified by SECP.
3.1.6 Derecognition
Financial assets are derecognised when the rights to receive cash flows from the investments have expired or have been transferred and the Fund has transferred substantially all risks and rewards of ownership.
3.1.7 Offsetting of financial assets and liabilities
Financial assets and financial liabilities are offset and the net amount is reported in the Statement of Assets and Liabilities when there is a legally enforceable right to set off the recognised amounts and there is an intention to settle on a net basis, or realise the assets and settle the liabilities simultaneously.
3.2 Cash and cash equivalents
Cash and cash equivalents include stamps in hand, deposits with banks and other short term highly liquid investments with original maturities of three months or less and which are subject to insignificant changes in value, net of short-term finances.
3.3 Derivatives
Derivative instruments are initially recognised at fair value and subsequent to initial measurement each derivative instrument is remeasured to its fair value and the resultant gain or loss is recognised in the income statement.
3.4 Financial liabilities
All financial liabilities are recognised at the time when the Fund becomes a party to the contractual provisions of the instrument. They are initially recognised at fair value and subsequently stated at amortised cost.
A financial liability is derecognised when the obligation under the liability is discharged or cancelled or expired.
3.5 Provisions
Provisions are recognised when the Fund has a present legal or constructive obligation as a result of past events, it is probable that an outflow of resources embodying economic benefits will be required to settle the obligation and a reliable estimate of the amount of obligation can be made. Provisions are regularly reviewed and adjusted to reflect the current best estimate.
NATIONAL INVESTMENT (UNIT) TRUSTNOTES TO AND FORMING PART OF THE FINANCIAL STATEMENTSFOR THE YEAR ENDED JUNE 30, 2011
T H I R D Q U A R T E R R E P O R T M A R C H 2 0 1 1A N N U A L R E P O R T 62

N I U T
3.6 Taxation
The income of the Fund is exempt from income tax under clause 99 of Part I of the Second Schedule to the Income Tax Ordinance, 2001 subject to the condition that not less than ninety percent of its accounting income for the year, as reduced by capital gains, whether realised or unrealised, is distributed among the unit holders.
The Fund is also exempt from the the Provisions of Section 113 (minimum tax) under clause 11A of Part IV of the Second Schedule to the Income Tax Ordinance, 2001.
The Fund provides for deferred taxation using the balance sheet liability method on all major temporary differences between the amounts used for financial reporting purposes and amounts used for taxation purposes. In addition, the Fund also records deferred tax asset on unutilised tax losses to the extent that it is no longer probable that the related tax benefit will be realised. However, the Fund has not recognised any amount in respect of deferred tax in these financial statements as the Fund intends to continue availing the tax exemption in future years by distributing at least ninety percent of its accounting income for the year as reduced by capital gains, whether realised or unrealised, to its unit holders every year.
3.7 Issue and redemption of units
Units issued are recorded at the offer price, determined by the Management Company for the applications received by the distributors during business hours on that date. The offer price represents the net asset value per unit as of the close of the business day plus the allowable sales load, provision for transaction costs and any provision for duties and charges, if applicable. The sales load is payable to the investment facilitators, distributors and the Management Company. Transaction costs are recorded as the income of the Fund.
Units redeemed are recorded at the redemption price, applicable to units for which the distributors receive redemption requests during business hours of that day. The redemption price represents the net asset value per unit as of the close of the business day less any back-end load, any duties, taxes, charges on redemption and any provision for transaction costs, if applicable.
3.8 Proposed distributions
Distributions declared subsequent to the year end reporting date are considered as non-adjusting events and are recognised in the financial statements in the period in which such distributions are declared.
3.9 Element of income / (loss) and capital gains / (losses) included in prices of units issued less those in units redeemed
An equalisation account called the ‘element of income / (loss) and capital gains / (losses) included in prices of units issued less those in units redeemed’ is created, in order to prevent the dilution of per unit income and distribution of income already paid out on redemption.
The “element of income/ (loss) and capital gains/ (losses) in prices of units issued less those in units redeemed” account is credited with the amount representing net income/ (loss) and capital gains/ (losses) accounted for in the net asset value and included in the sale proceeds of units. Upon redemption of units, the “element of income/ (loss) and capital gains/ (losses) in prices of units issued less those in units redeemed” account is debited with the amount representing net income/ (loss) and capital gains/ (losses) accounted for in the net asset value and included in the redemption price.
The net “element of income/ (loss) and capital gains/ (losses) in prices of units issued less those in units redeemed” during an accounting period is transferred to the ‘income statement’.
3.10 Borrowing costs
Borrowings costs directly attributable to the acquisition of qualifying assets (one that takes substantial period of time to get ready for use or sale) are capitalised as part of the cost of the asset. Other borrowing costs are taken to the income statement in the period in which they are incurred. Currently the Fund does not have any qualifying assets.
NATIONAL INVESTMENT (UNIT) TRUSTNOTES TO AND FORMING PART OF THE FINANCIAL STATEMENTSFOR THE YEAR ENDED JUNE 30, 2011
T H I R D Q U A R T E R R E P O R T M A R C H2 0 1 1A N N U A L R E P O R T63

N I U T
3.11 Revenue recognition
- Realised capital gains / (losses) arising on sale of investments are included in the Income Statement on the date at which the transaction takes place.
- Unrealised capital gains / (losses) arising on marking to market of investments classified as ‘Financial assets at fair value through profit or loss’ are included in the Income Statement in the period in which they ise.
- Income from investment in morabaha arrangements, term finance certificates and other redeemable capital is recognised on an accrual basis, except where recovery is doubtful in which case it is credited to suspense account.
- Dividend income is recognised when the right to receive dividend is established.
- Income on government securities, bank deposits and placements is recognised on an accrual basis.
- Income on issue and repurchase of units is recognised when the units are issued and redeemed at the transaction date.
3.12 Net asset value per unit
The net asset value (NAV) per unit, as disclosed on the Statement of Assets and Liabilities, is calculated by dividing the net assets of the Fund by the number of units in issue at the year end.
3.13 Earnings per unit
Earnings per unit (EPU) has been calculated by dividing the net income after taxation by the number of units in issue at the year end as in the opinion of the management determination of weighted average units for calculating EPU is not practicable.
Note 2011 2010
4 BANK BALANCES (Rupees in ‘000)
In current accounts 4.1 500,351 506,570
In deposit accounts 4.2 1,488,294 874,518
Stamps in hand 32 32
1,988,677 1,381,120
4.1 The above include an amount of Rs 339.286 million (2010: Rs 422.533 million) relating to unclaimed distributions.
4.2 Deposit accounts carry profit at the rates ranging from 6% to 13% (2010: 6% to 11.5%) per annum.
NATIONAL INVESTMENT (UNIT) TRUSTNOTES TO AND FORMING PART OF THE FINANCIAL STATEMENTSFOR THE YEAR ENDED JUNE 30, 2011
T H I R D Q U A R T E R R E P O R T M A R C H 2 0 1 1A N N U A L R E P O R T 64
N I U T
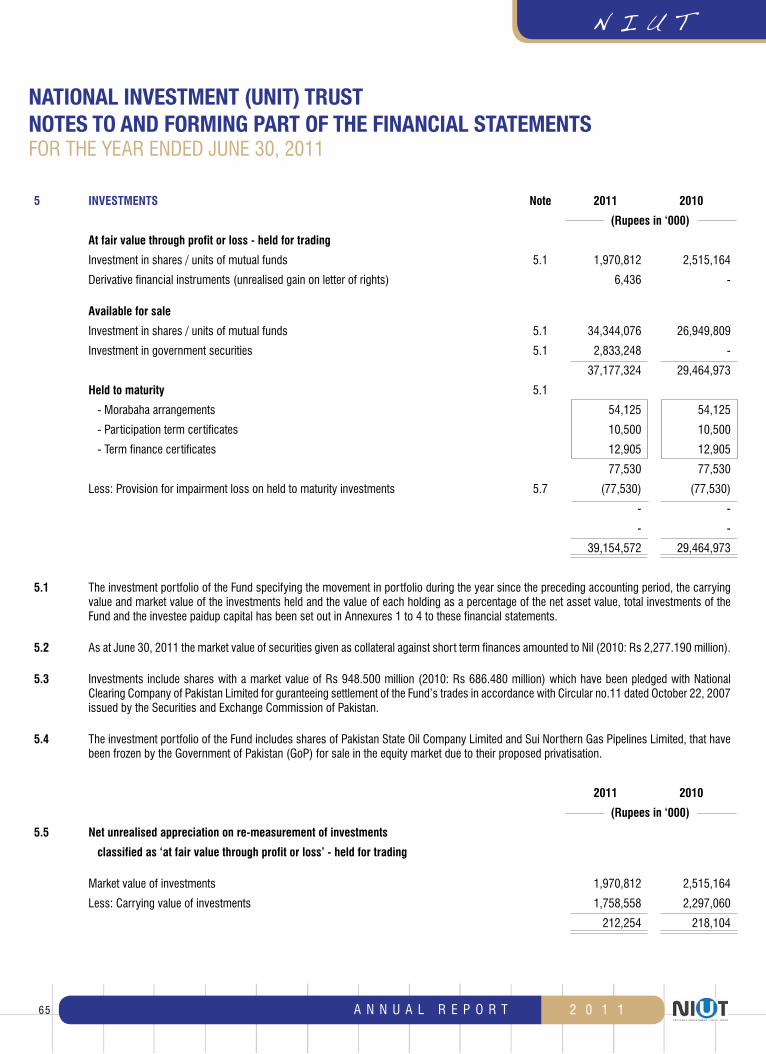
5 INVESTMENTS Note 2011 2010
(Rupees in ‘000)
At fair value through profit or loss - held for trading
Investment in shares / units of mutual funds 5.1 1,970,812 2,515,164
Derivative financial instruments (unrealised gain on letter of rights) 6,436 -
Available for sale
Investment in shares / units of mutual funds 5.1 34,344,076 26,949,809
Investment in government securities 5.1 2,833,248 -
37,177,324 29,464,973
Held to maturity 5.1
- Morabaha arrangements 54,125 54,125
- Participation term certificates 10,500 10,500
- Term finance certificates 12,905 12,905
77,530 77,530
Less: Provision for impairment loss on held to maturity investments 5.7 (77,530) (77,530)
- -
- -
39,154,572 29,464,973
5.1 The investment portfolio of the Fund specifying the movement in portfolio during the year since the preceding accounting period, the carrying value and market value of the investments held and the value of each holding as a percentage of the net asset value, total investments of the Fund and the investee paidup capital has been set out in Annexures 1 to 4 to these financial statements.
5.2 As at June 30, 2011 the market value of securities given as collateral against short term finances amounted to Nil (2010: Rs 2,277.190 million).
5.3 Investments include shares with a market value of Rs 948.500 million (2010: Rs 686.480 million) which have been pledged with National Clearing Company of Pakistan Limited for guranteeing settlement of the Fund’s trades in accordance with Circular no.11 dated October 22, 2007 issued by the Securities and Exchange Commission of Pakistan.
5.4 The investment portfolio of the Fund includes shares of Pakistan State Oil Company Limited and Sui Northern Gas Pipelines Limited, that have been frozen by the Government of Pakistan (GoP) for sale in the equity market due to their proposed privatisation.
2011 2010
(Rupees in ‘000)
5.5 Net unrealised appreciation on re-measurement of investments
classified as ‘at fair value through profit or loss’ - held for trading
Market value of investments 1,970,812 2,515,164
Less: Carrying value of investments 1,758,558 2,297,060
212,254 218,104
NATIONAL INVESTMENT (UNIT) TRUSTNOTES TO AND FORMING PART OF THE FINANCIAL STATEMENTSFOR THE YEAR ENDED JUNE 30, 2011
T H I R D Q U A R T E R R E P O R T M A R C H2 0 1 1A N N U A L R E P O R T65

N I U T
5.6 Net unrealised appreciation on re-measurement of
investments classified as ‘available for sale’
2011 2010
(Rupees in ‘000)
Market value of investments 37,177,324 26,949,809
Less: Carrying value of investments - net of impairment 20,070,471 15,214,992
17,106,853 11,734,817
Less: Net unrealised appreciation in fair value of investments at the beginning of year 11,734,817 8,791,700
5,372,036 2,943,117
5.7 Movement in provision for impairment loss on held to maturity investments
Opening balance 77,530 38,190
Charge for the year - -
Provision in respect of investments tranferred from
NI(U)T-LOC Holders’ Fund - 39,340
Reversals during the year - -
Closing balance 77,530 77,530
5.8 Impairment against equity securities classified as ‘available for sale’
During the year, based on a scrip wise analysis of the deficit arising on revaluation of quoted shares, closed end mutual funds and open end mutual funds classified as ‘available for sale’, it has been determined that an amount of Rs 629.151 million (2010: Rs 509.375 million) should be charged to the income statement as impairment loss. This impairment loss has been fully recognised and the charge has been reflected in the income statement of the Fund.
Note 2011 2010
(Rupees in ‘000)
6 LOANS AND RECEIVABLES
Term finance certificates 6.1 802 802
Less: Provision for impairment loss on term finance certificates (802) (802)
- -
6.1 This represents term finance certificates of Crescent Standard Investment Bank Limited (Pacific Leasing).These carry interest at the rate of Nil % (2010: Nil %) per annum.
NATIONAL INVESTMENT (UNIT) TRUSTNOTES TO AND FORMING PART OF THE FINANCIAL STATEMENTSFOR THE YEAR ENDED JUNE 30, 2011
T H I R D Q U A R T E R R E P O R T M A R C H 2 0 1 1A N N U A L R E P O R T 66
N I U T
Note 2011 2010
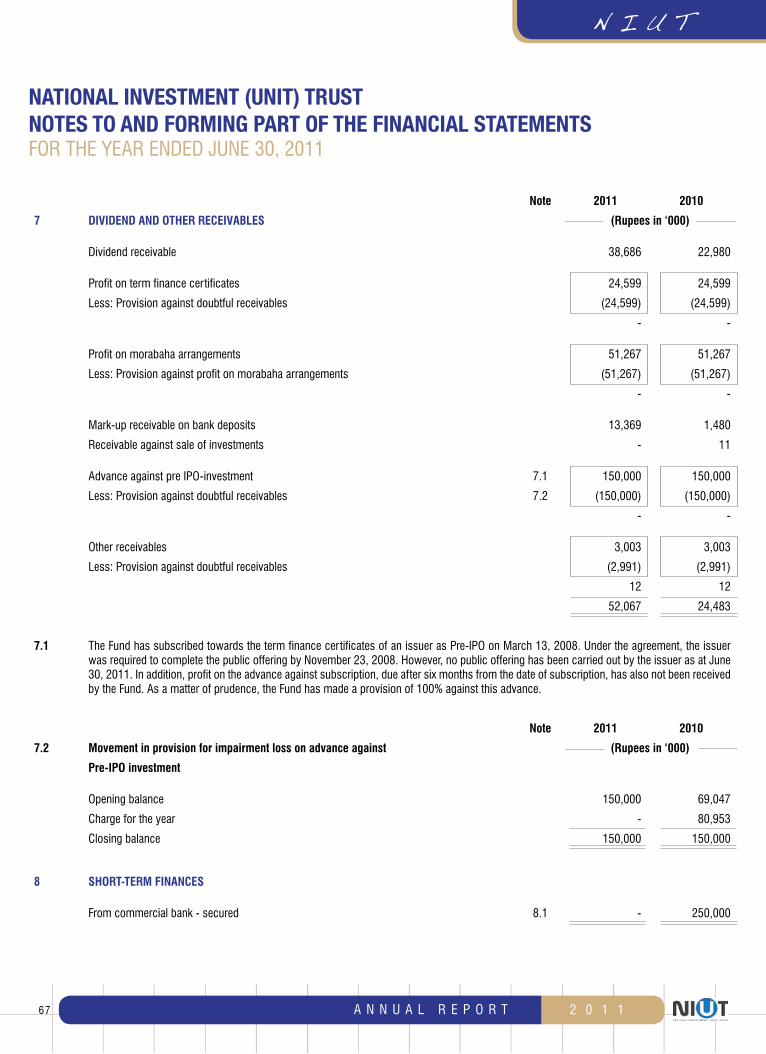
7 DIVIDEND AND OTHER RECEIVABLES (Rupees in ‘000)
Dividend receivable 38,686 22,980
Profit on term finance certificates 24,599 24,599
Less: Provision against doubtful receivables (24,599) (24,599)
- -
Profit on morabaha arrangements 51,267 51,267
Less: Provision against profit on morabaha arrangements (51,267) (51,267)
- -
Mark-up receivable on bank deposits 13,369 1,480
Receivable against sale of investments - 11
Advance against pre IPO-investment 7.1 150,000 150,000
Less: Provision against doubtful receivables 7.2 (150,000) (150,000)
- -
Other receivables 3,003 3,003
Less: Provision against doubtful receivables (2,991) (2,991)
12 12
52,067 24,483
7.1 The Fund has subscribed towards the term finance certificates of an issuer as Pre-IPO on March 13, 2008. Under the agreement, the issuer was required to complete the public offering by November 23, 2008. However, no public offering has been carried out by the issuer as at June 30, 2011. In addition, profit on the advance against subscription, due after six months from the date of subscription, has also not been received by the Fund. As a matter of prudence, the Fund has made a provision of 100% against this advance.
Note 2011 2010
7.2 Movement in provision for impairment loss on advance against (Rupees in ‘000)
Pre-IPO investment
Opening balance 150,000 69,047
Charge for the year - 80,953
Closing balance 150,000 150,000
8 SHORT-TERM FINANCES
From commercial bank - secured 8.1 - 250,000
NATIONAL INVESTMENT (UNIT) TRUSTNOTES TO AND FORMING PART OF THE FINANCIAL STATEMENTSFOR THE YEAR ENDED JUNE 30, 2011
T H I R D Q U A R T E R R E P O R T M A R C H2 0 1 1A N N U A L R E P O R T67
N I U T
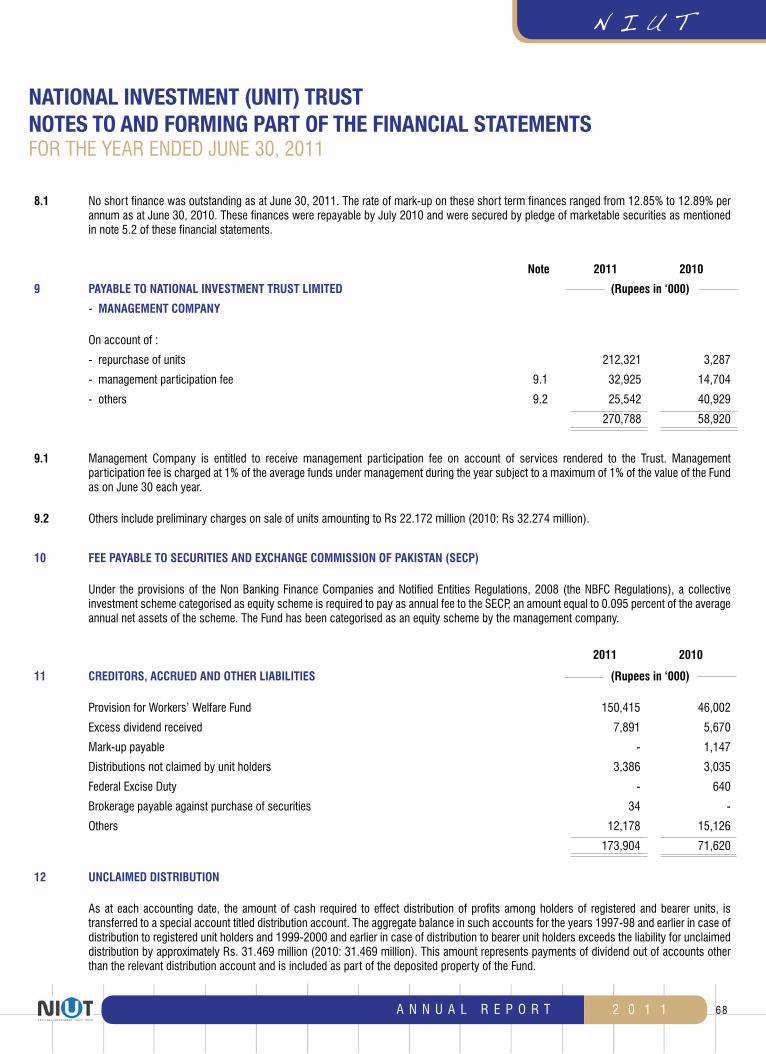
8.1 No short finance was outstanding as at June 30, 2011. The rate of mark-up on these short term finances ranged from 12.85% to 12.89% per annum as at June 30, 2010. These finances were repayable by July 2010 and were secured by pledge of marketable securities as mentioned in note 5.2 of these financial statements.
Note 2011 2010
9 PAYABLE TO NATIONAL INVESTMENT TRUST LIMITED (Rupees in ‘000)
- MANAGEMENT COMPANY
On account of :
- repurchase of units 212,321 3,287
- management participation fee 9.1 32,925 14,704
- others 9.2 25,542 40,929
270,788 58,920
9.1 Management Company is entitled to receive management participation fee on account of services rendered to the Trust. Management participation fee is charged at 1% of the average funds under management during the year subject to a maximum of 1% of the value of the Fund as on June 30 each year.
9.2 Others include preliminary charges on sale of units amounting to Rs 22.172 million (2010: Rs 32.274 million).
10 FEE PAYABLE TO SECURITIES AND EXCHANGE COMMISSION OF PAKISTAN (SECP)
Under the provisions of the Non Banking Finance Companies and Notified Entities Regulations, 2008 (the NBFC Regulations), a collective investment scheme categorised as equity scheme is required to pay as annual fee to the SECP, an amount equal to 0.095 percent of the average annual net assets of the scheme. The Fund has been categorised as an equity scheme by the management company.
2011 2010
11 CREDITORS, ACCRUED AND OTHER LIABILITIES (Rupees in ‘000)
Provision for Workers’ Welfare Fund 150,415 46,002
Excess dividend received 7,891 5,670
Mark-up payable - 1,147
Distributions not claimed by unit holders 3,386 3,035
Federal Excise Duty - 640
Brokerage payable against purchase of securities 34 -
Others 12,178 15,126
173,904 71,620
12 UNCLAIMED DISTRIBUTION
As at each accounting date, the amount of cash required to effect distribution of profits among holders of registered and bearer units, is transferred to a special account titled distribution account. The aggregate balance in such accounts for the years 1997-98 and earlier in case of distribution to registered unit holders and 1999-2000 and earlier in case of distribution to bearer unit holders exceeds the liability for unclaimed distribution by approximately Rs. 31.469 million (2010: 31.469 million). This amount represents payments of dividend out of accounts other than the relevant distribution account and is included as part of the deposited property of the Fund.
NATIONAL INVESTMENT (UNIT) TRUSTNOTES TO AND FORMING PART OF THE FINANCIAL STATEMENTSFOR THE YEAR ENDED JUNE 30, 2011
T H I R D Q U A R T E R R E P O R T M A R C H 2 0 1 1A N N U A L R E P O R T 68

N I U T
13 CONTINGENCIES AND COMMITMENTS
There were no contingencies and commitments outstanding as at June 30, 2011 (2010: Nil).
14 NUMBER OF UNITS IN ISSUE
Registered Bearer Total Total
2011 2010
(Number of units)
Total outstanding at the beginning of the year 1,042,489,838 28,159,530 1,070,649,368 1,021,932,947
Add: Sales during the year 305,053,229 - 305,053,229 123,707,936
Units issued under Cumulative Investment
Plan (CIP) during the year 34,972,607 - 34,972,607 37,021,191
Conversion of bearer units into registered 138,550 (138,550) - -
1,382,654,224 28,020,980 1,410,675,204 1,182,662,074
Less: Repurchases during the year (151,193,678) (300,690) (151,494,368) (112,012,706)
Total units in issue at the end of the year 1,231,460,546 27,720,290 1,259,180,836 1,070,649,368
14.1 Pattern of Unit Holding
Pattern of unit holding as at June 30, 2011:
Category Number of unit holders
Investment Amount
Percentage
Individuals 55,048 11,411,596 28.20%
Associated companies / directors 1 15,602 0.04%
Insurance companies 23 2,648,934 6.55%
Banks / DFIs 39 4,788,289 11.83%
NBFCs 35 1,672,826 4.13%
Retirement funds 465 12,087,176 29.88%
Public Limited companies 14 803,080 1.98%
Others 571 7,037,048 17.39%
56,196 40,464,551 100.00%
Pattern of unit holding as at June 30, 2010:
Category Number of unit holders
Investment Amount
Percentage
Individuals 53,843 10,339,825 34.29%
Associated companies / directors 3 1,321,774 4.38%
Insurance companies 27 2,034,675 6.75%
NATIONAL INVESTMENT (UNIT) TRUSTNOTES TO AND FORMING PART OF THE FINANCIAL STATEMENTSFOR THE YEAR ENDED JUNE 30, 2011
T H I R D Q U A R T E R R E P O R T M A R C H2 0 1 1A N N U A L R E P O R T69
N I U T
Category Number of unit holders
Investment Amount
Percentage
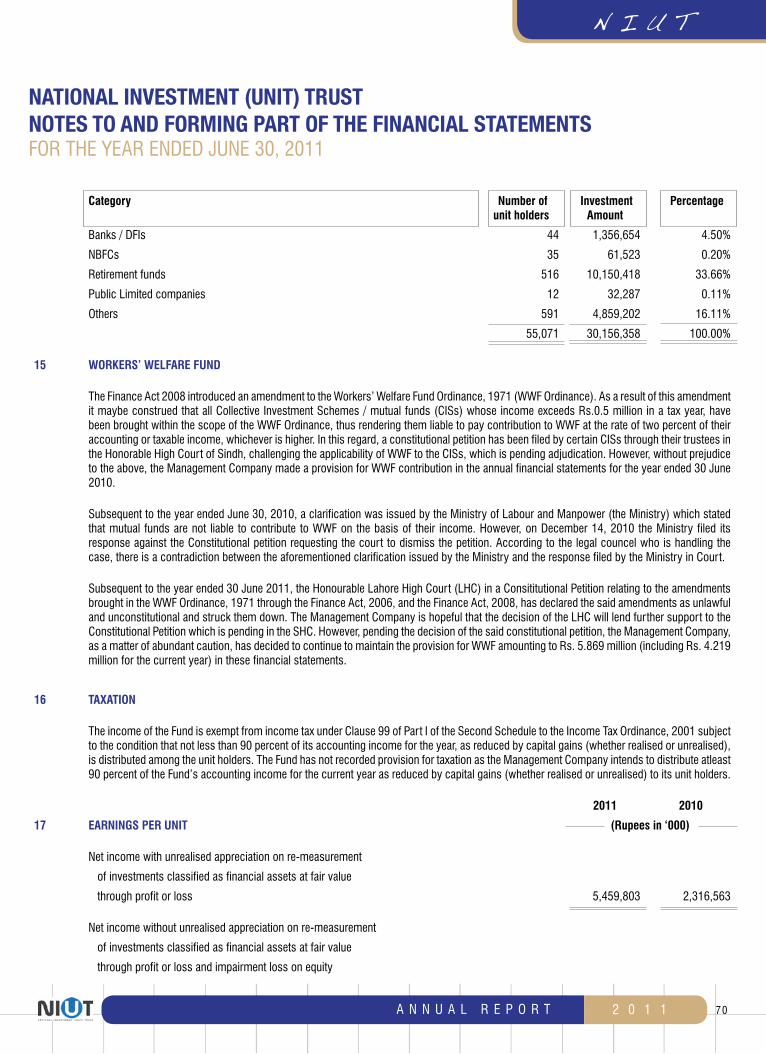
Banks / DFIs 44 1,356,654 4.50%
NBFCs 35 61,523 0.20%
Retirement funds 516 10,150,418 33.66%
Public Limited companies 12 32,287 0.11%
Others 591 4,859,202 16.11%
55,071 30,156,358 100.00%
15 WORKERS’ WELFARE FUND
The Finance Act 2008 introduced an amendment to the Workers’ Welfare Fund Ordinance, 1971 (WWF Ordinance). As a result of this amendment it maybe construed that all Collective Investment Schemes / mutual funds (CISs) whose income exceeds Rs.0.5 million in a tax year, have been brought within the scope of the WWF Ordinance, thus rendering them liable to pay contribution to WWF at the rate of two percent of their accounting or taxable income, whichever is higher. In this regard, a constitutional petition has been filed by certain CISs through their trustees in the Honorable High Court of Sindh, challenging the applicability of WWF to the CISs, which is pending adjudication. However, without prejudice to the above, the Management Company made a provision for WWF contribution in the annual financial statements for the year ended 30 June 2010.
Subsequent to the year ended June 30, 2010, a clarification was issued by the Ministry of Labour and Manpower (the Ministry) which stated that mutual funds are not liable to contribute to WWF on the basis of their income. However, on December 14, 2010 the Ministry filed its response against the Constitutional petition requesting the court to dismiss the petition. According to the legal councel who is handling the case, there is a contradiction between the aforementioned clarification issued by the Ministry and the response filed by the Ministry in Court.
Subsequent to the year ended 30 June 2011, the Honourable Lahore High Court (LHC) in a Consititutional Petition relating to the amendments brought in the WWF Ordinance, 1971 through the Finance Act, 2006, and the Finance Act, 2008, has declared the said amendments as unlawful and unconstitutional and struck them down. The Management Company is hopeful that the decision of the LHC will lend further support to the Constitutional Petition which is pending in the SHC. However, pending the decision of the said constitutional petition, the Management Company, as a matter of abundant caution, has decided to continue to maintain the provision for WWF amounting to Rs. 5.869 million (including Rs. 4.219 million for the current year) in these financial statements.
16 TAXATION
The income of the Fund is exempt from income tax under Clause 99 of Part I of the Second Schedule to the Income Tax Ordinance, 2001 subject to the condition that not less than 90 percent of its accounting income for the year, as reduced by capital gains (whether realised or unrealised), is distributed among the unit holders. The Fund has not recorded provision for taxation as the Management Company intends to distribute atleast 90 percent of the Fund’s accounting income for the current year as reduced by capital gains (whether realised or unrealised) to its unit holders.
2011 2010
17 EARNINGS PER UNIT (Rupees in ‘000)
Net income with unrealised appreciation on re-measurement
of investments classified as financial assets at fair value
through profit or loss 5,459,803 2,316,563
Net income without unrealised appreciation on re-measurement
of investments classified as financial assets at fair value
through profit or loss and impairment loss on equity
NATIONAL INVESTMENT (UNIT) TRUSTNOTES TO AND FORMING PART OF THE FINANCIAL STATEMENTSFOR THE YEAR ENDED JUNE 30, 2011
T H I R D Q U A R T E R R E P O R T M A R C H 2 0 1 1A N N U A L R E P O R T 70
N I U T
2011 2010
(Rupees in ‘000)
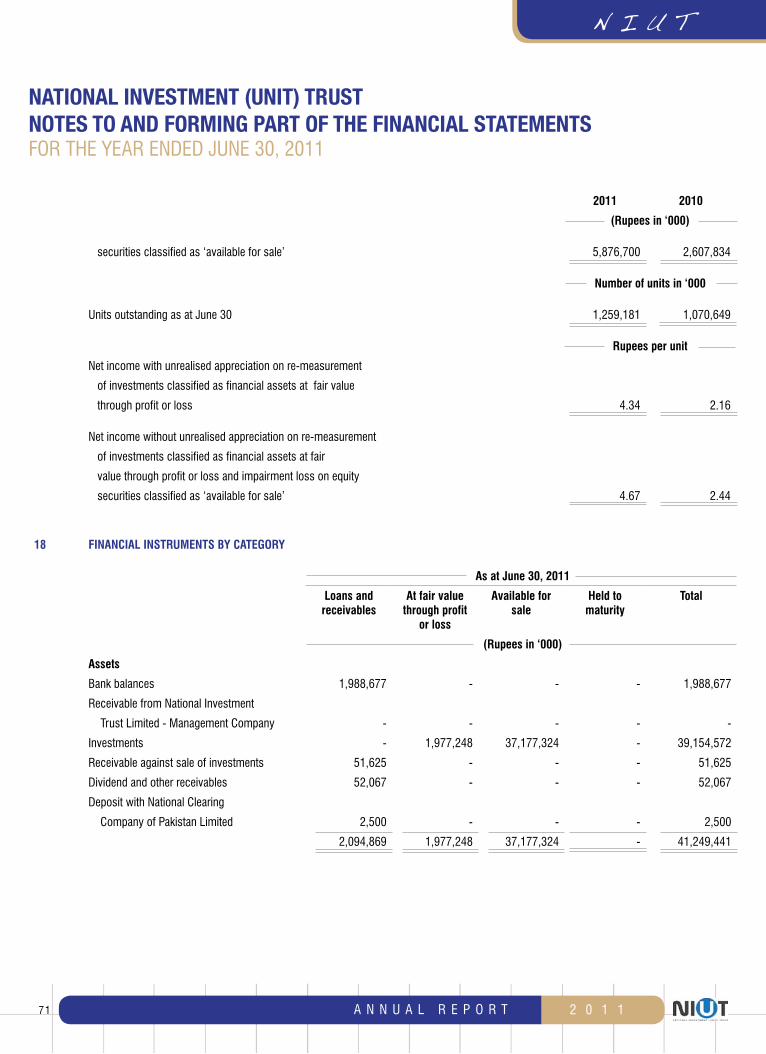
securities classified as ‘available for sale’ 5,876,700 2,607,834
Number of units in ‘000
Units outstanding as at June 30 1,259,181 1,070,649
Rupees per unit
Net income with unrealised appreciation on re-measurement
of investments classified as financial assets at fair value
through profit or loss 4.34 2.16
Net income without unrealised appreciation on re-measurement
of investments classified as financial assets at fair
value through profit or loss and impairment loss on equity
securities classified as ‘available for sale’ 4.67 2.44
18 FINANCIAL INSTRUMENTS BY CATEGORY
As at June 30, 2011
Loans and receivables
At fair value through profit
or loss
Available for sale
Held to maturity
Total
(Rupees in ‘000)
Assets
Bank balances 1,988,677 - - - 1,988,677
Receivable from National Investment
Trust Limited - Management Company - - - - -
Investments - 1,977,248 37,177,324 - 39,154,572
Receivable against sale of investments 51,625 - - - 51,625
Dividend and other receivables 52,067 - - - 52,067
Deposit with National Clearing
Company of Pakistan Limited 2,500 - - - 2,500
2,094,869 1,977,248 37,177,324 - 41,249,441
NATIONAL INVESTMENT (UNIT) TRUSTNOTES TO AND FORMING PART OF THE FINANCIAL STATEMENTSFOR THE YEAR ENDED JUNE 30, 2011
T H I R D Q U A R T E R R E P O R T M A R C H2 0 1 1A N N U A L R E P O R T71

N I U T
As at June 30, 2011
Liabilities at fair value
through profit or loss
Others Total
(Rupees in ‘000)
Liabilities
Short-term finances - - -
Payable to National Investment Trust Limited - Management Company
- 270,788 270,788
Creditors, accrued and other liabilities - 23,385 23,385
Unclaimed distribution - 307,178 307,178
- 601,351 601,351
As at June 30, 2010
Loans and receivables
At fair value through profit
or loss
Available for sale
Held to maturity
Total
(Rupees in ‘000)
Assets
Bank balances 1,381,120 - - - 1,381,120
Receivable from National Investment
Trust Limited - Management Company 80 - - - 80
Investments - 2,515,164 26,949,809 - 29,464,973
Dividend and other receivables 24,483 - - - 24,483
Deposit with National Clearing
Company of Pakistan Limited 2,500 - - - 2,500
1,408,183 2,515,164 26,949,809 - 30,873,156
As at June 30, 2010
Liabilities at fair value
through profit or loss
Others Total
(Rupees in ‘000)
Liabilities
Short-term finances - 250,000 250,000
Payable to National Investment Trust Limited - Management Company
- 58,920 58,920
Creditors, accrued and other liabilities - 24,974 24,974
Unclaimed distribution - 306,506 306,506
- 640,400 640,400
NATIONAL INVESTMENT (UNIT) TRUSTNOTES TO AND FORMING PART OF THE FINANCIAL STATEMENTSFOR THE YEAR ENDED JUNE 30, 2011
T H I R D Q U A R T E R R E P O R T M A R C H 2 0 1 1A N N U A L R E P O R T 72
N I U T
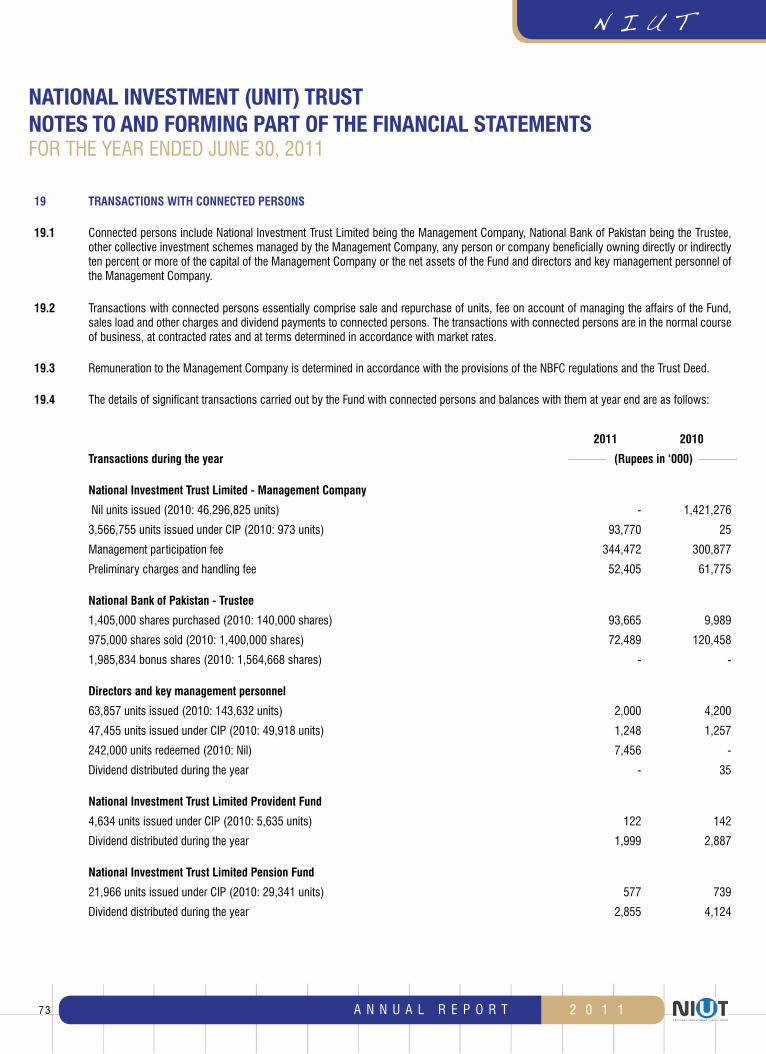
19 TRANSACTIONS WITH CONNECTED PERSONS
19.1 Connected persons include National Investment Trust Limited being the Management Company, National Bank of Pakistan being the Trustee, other collective investment schemes managed by the Management Company, any person or company beneficially owning directly or indirectly ten percent or more of the capital of the Management Company or the net assets of the Fund and directors and key management personnel of the Management Company.
19.2 Transactions with connected persons essentially comprise sale and repurchase of units, fee on account of managing the affairs of the Fund, sales load and other charges and dividend payments to connected persons. The transactions with connected persons are in the normal course of business, at contracted rates and at terms determined in accordance with market rates.
19.3 Remuneration to the Management Company is determined in accordance with the provisions of the NBFC regulations and the Trust Deed.
19.4 The details of significant transactions carried out by the Fund with connected persons and balances with them at year end are as follows:
2011 2010
Transactions during the year (Rupees in ‘000)
National Investment Trust Limited - Management Company
Nil units issued (2010: 46,296,825 units) - 1,421,276
3,566,755 units issued under CIP (2010: 973 units) 93,770 25
Management participation fee 344,472 300,877
Preliminary charges and handling fee 52,405 61,775
National Bank of Pakistan - Trustee
1,405,000 shares purchased (2010: 140,000 shares) 93,665 9,989
975,000 shares sold (2010: 1,400,000 shares) 72,489 120,458
1,985,834 bonus shares (2010: 1,564,668 shares) - -
Directors and key management personnel
63,857 units issued (2010: 143,632 units) 2,000 4,200
47,455 units issued under CIP (2010: 49,918 units) 1,248 1,257
242,000 units redeemed (2010: Nil) 7,456 -
Dividend distributed during the year - 35
National Investment Trust Limited Provident Fund
4,634 units issued under CIP (2010: 5,635 units) 122 142
Dividend distributed during the year 1,999 2,887
National Investment Trust Limited Pension Fund
21,966 units issued under CIP (2010: 29,341 units) 577 739
Dividend distributed during the year 2,855 4,124
NATIONAL INVESTMENT (UNIT) TRUSTNOTES TO AND FORMING PART OF THE FINANCIAL STATEMENTSFOR THE YEAR ENDED JUNE 30, 2011
T H I R D Q U A R T E R R E P O R T M A R C H2 0 1 1A N N U A L R E P O R T73

N I U T
2011 2010
(Rupees in ‘000)
Amount outstanding as at year end
National Investment Trust Limited - Management Company
49,873,755 units held (2010: 46,307,000 units) 1,602,942 1,304,468
Receivable from management company - 80
Payable to management company 270,788 58,920
National Bank of Pakistan - Trustee
Bank balances 494,593 503,021
9,929,176 shares held (2010: 7,513,341 shares) 500,629 481,605
Directors and key management personnel
485,412 units held (2010: 663,285 units) 15,601 18,685
National Investment Trust Limited Provident Fund
947,103 units held (June 30, 2010: 942,469 units) 30,440 26,549
National Investment Trust Limited Pension Fund
1,547,661 units held (June 30, 2010: 1,525,695 units) 49,742 42,979
20 FINANCIAL RISK MANAGEMENT
The Fund’s activities expose it to a variety of financial risks: market risk, credit risk and liquidity risk.
20.1 Market risk
Market risk is the risk that the fair value or the future cash flows of a financial instrument may fluctuate as a result of changes in market prices.
The Management Company manages market risk through diversification of the investment portfolio by exposures and by following the internal guidelines established by the investment committee and regulations laid down by the Securities and Exchange Commission of Pakistan.
Market risk comprises of three types of risk: currency risk, interest rate risk and other price risk.
20.1.1 Currency risk
Currency risk is the risk that the fair value or future cash flows of a financial instrument will fluctuate because of changes in foreign exchange rates. The Fund, at present is not exposed to currency risk as all transactions are carried out in Pak Rupees.
NATIONAL INVESTMENT (UNIT) TRUSTNOTES TO AND FORMING PART OF THE FINANCIAL STATEMENTSFOR THE YEAR ENDED JUNE 30, 2011
T H I R D Q U A R T E R R E P O R T M A R C H 2 0 1 1A N N U A L R E P O R T 74
N I U T
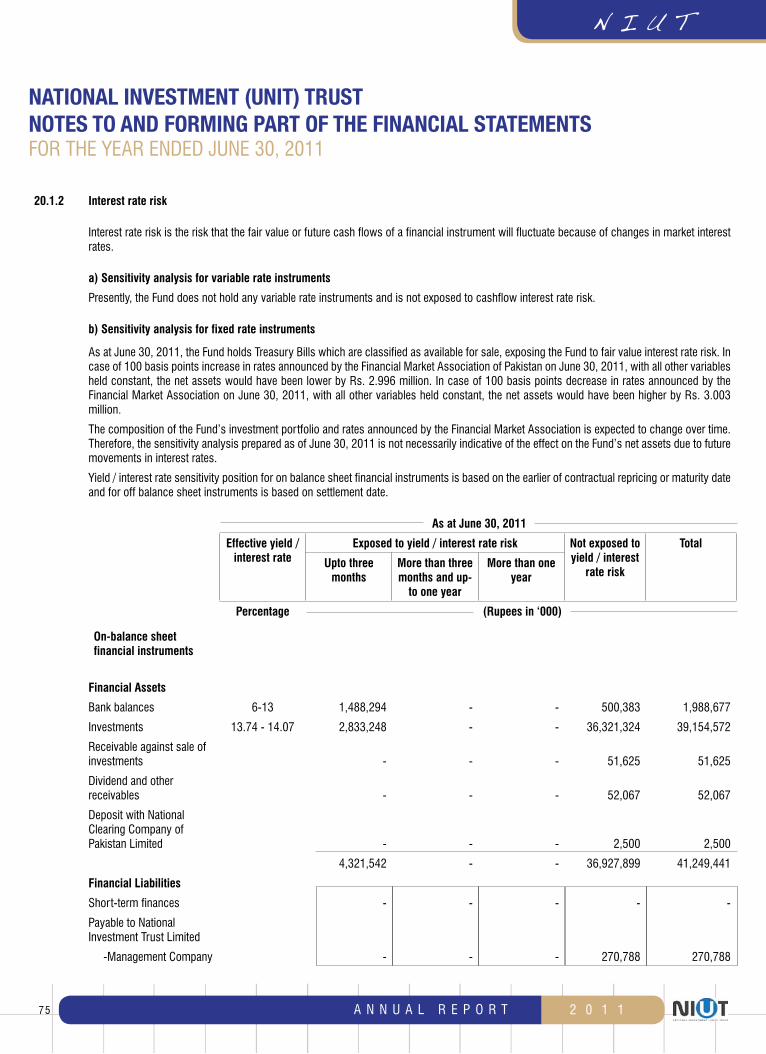
20.1.2 Interest rate risk
Interest rate risk is the risk that the fair value or future cash flows of a financial instrument will fluctuate because of changes in market interest rates.
a) Sensitivity analysis for variable rate instruments
Presently, the Fund does not hold any variable rate instruments and is not exposed to cashflow interest rate risk.
b) Sensitivity analysis for fixed rate instruments
As at June 30, 2011, the Fund holds Treasury Bills which are classified as available for sale, exposing the Fund to fair value interest rate risk. In case of 100 basis points increase in rates announced by the Financial Market Association of Pakistan on June 30, 2011, with all other variables held constant, the net assets would have been lower by Rs. 2.996 million. In case of 100 basis points decrease in rates announced by the Financial Market Association on June 30, 2011, with all other variables held constant, the net assets would have been higher by Rs. 3.003 million.
The composition of the Fund’s investment portfolio and rates announced by the Financial Market Association is expected to change over time. Therefore, the sensitivity analysis prepared as of June 30, 2011 is not necessarily indicative of the effect on the Fund’s net assets due to future movements in interest rates.
Yield / interest rate sensitivity position for on balance sheet financial instruments is based on the earlier of contractual repricing or maturity date and for off balance sheet instruments is based on settlement date.
As at June 30, 2011
Effective yield / interest rate
Exposed to yield / interest rate risk Not exposed to yield / interest
rate risk
Total
Upto three months
More than three months and up-
to one year
More than one year
Percentage (Rupees in ‘000)
On-balance sheet financial instruments
Financial Assets
Bank balances 6-13 1,488,294 - - 500,383 1,988,677
Investments 13.74 - 14.07 2,833,248 - - 36,321,324 39,154,572
Receivable against sale of investments
-
-
-
51,625
51,625
Dividend and other receivables
-
-
-
52,067
52,067
Deposit with National Clearing Company of Pakistan Limited
-
-
-
2,500
2,500
4,321,542 - - 36,927,899 41,249,441
Financial Liabilities
Short-term finances - - - - -
Payable to National Investment Trust Limited
-Management Company - - - 270,788 270,788
NATIONAL INVESTMENT (UNIT) TRUSTNOTES TO AND FORMING PART OF THE FINANCIAL STATEMENTSFOR THE YEAR ENDED JUNE 30, 2011
T H I R D Q U A R T E R R E P O R T M A R C H2 0 1 1A N N U A L R E P O R T75

N I U T
As at June 30, 2011
Effective yield / interest rate
Exposed to yield / interest rate risk Not exposed to yield / interest
rate risk
Total
Upto three months
More than three months and up-
to one year
More than one year
Percentage (Rupees in ‘000)
On-balance sheet financial instruments
Creditors, accrued and other liabilities
- - - 23,385 23,385
Unclaimed distribution - - - 307,178 307,178
- - - 601,351 601,351
On-balance sheet gap 4,321,542 - - 36,326,548 40,648,090
Off-balance sheet financial instruments
- - - - -
Off-balance sheet gap - - - - -
Total interest rate sensitivity gap
4,321,542 - - 36,326,548 40,648,090
Cumulative interest rate sensitivity gap
4,321,542 4,321,542 4,321,542
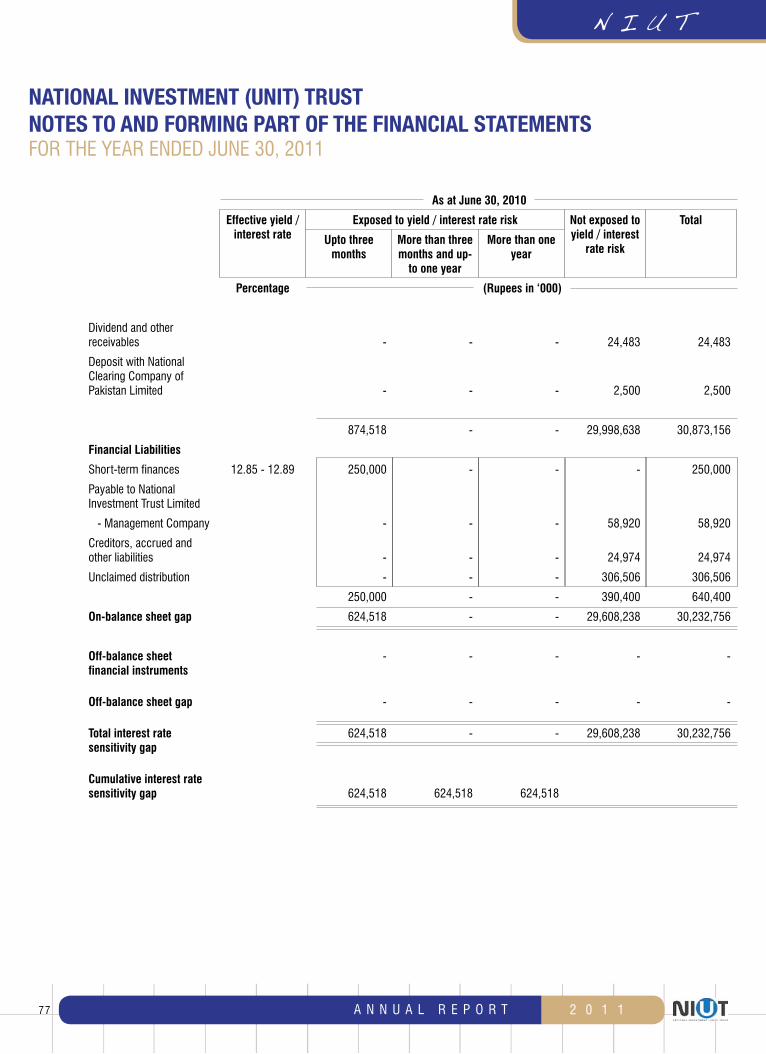
As at June 30, 2010
Effective yield / interest rate
Exposed to yield / interest rate risk Not exposed to yield / interest
rate risk
Total
Upto three months
More than three months and up-
to one year
More than one year
Percentage (Rupees in ‘000)
On-balance sheet financial instruments
Financial Assets
Bank balances 6 - 11.5 874,518 - - 506,602 1,381,120
Receivable from National Investment Trust Limited
-Management Company - - - 80 80
Investments - - - 29,464,973 29,464,973
NATIONAL INVESTMENT (UNIT) TRUSTNOTES TO AND FORMING PART OF THE FINANCIAL STATEMENTSFOR THE YEAR ENDED JUNE 30, 2011
T H I R D Q U A R T E R R E P O R T M A R C H 2 0 1 1A N N U A L R E P O R T 76
N I U T
As at June 30, 2010
Effective yield / interest rate
Exposed to yield / interest rate risk Not exposed to yield / interest
rate risk
Total
Upto three months
More than three months and up-
to one year
More than one year
Percentage (Rupees in ‘000)
Dividend and other receivables
-
-
-
24,483
24,483
Deposit with National Clearing Company of Pakistan Limited
-
-
-
2,500
2,500
874,518 - - 29,998,638 30,873,156
Financial Liabilities
Short-term finances 12.85 - 12.89 250,000 - - - 250,000
Payable to National Investment Trust Limited
- Management Company - - - 58,920 58,920
Creditors, accrued and other liabilities
-
-
-
24,974
24,974
Unclaimed distribution - - - 306,506 306,506
250,000 - - 390,400 640,400
On-balance sheet gap 624,518 - - 29,608,238 30,232,756
Off-balance sheet financial instruments
- - - - -
Off-balance sheet gap - - - - -
Total interest rate sensitivity gap
624,518 - - 29,608,238 30,232,756
Cumulative interest rate sensitivity gap
624,518
624,518
624,518
NATIONAL INVESTMENT (UNIT) TRUSTNOTES TO AND FORMING PART OF THE FINANCIAL STATEMENTSFOR THE YEAR ENDED JUNE 30, 2011
T H I R D Q U A R T E R R E P O R T M A R C H2 0 1 1A N N U A L R E P O R T77

N I U T
20.1.3 Price Risk
Price risk is the risk that the fair value or future cash flows of a financial instrument will fluctuate because of changes in market prices (other than those arising from interest risk or currency risk) whether those changes are caused by factors specific to the individual financial instrument or its issuer, or factors affecting all similar financial instrument traded in the market.
The Fund is exposed to equity price risk because of investments held by the Fund and classified on the Statement of Assets and Liabilities as available for sale and at fair value through profit or loss. To manage its price risk arising from investments in equity securities, the Fund diversifies its portfolio within the eligible stocks prescribed in the Trust Deed. The NBFC Regulations also limit individual equity securities to no more than 10% of net assets, or issued capital of the investee company and sector exposure limit to 30% of net assets or index weight of the security whichever is higher, subject to maximum of 35% of the net assets. However, relaxation in this regard has been obtained from the SECP.
In case of 5% increase / decrease in KSE 100 index on June 30, 2011, with all other variables held constant, net income of the Fund for the year would increase / decrease by Rs 37.835 million (June 30, 2010: Rs 86.061 million) and the net assets would increase / decrease by the same amount, as a result of gains / losses on equity securities included in KSE 100 index classified as at fair value through profit or loss. Other components of equity and net assets of the Fund would increase / decrease by Rs 1,030.937 million (June 30, 2010: Rs. 977.265 million) as a result of gains / (losses) on equity securities included in KSE 100 index classified as available for sale.
The analysis is based on the assumption that the equity index had increased / decreased by 5% with all other variables held constant and all the Fund’s equity instruments moved according to the historical correlation with the index. This represents management’s best estimate of a reasonable possible shift in the KSE 100 index, having regard to the historical volatility of the index. The composition of the Fund’s investment portfolio and the correlation thereof to the KSE 100 index, is expected to change over time. Accordingly, the sensitivity analysis prepared as of June 30, 2011 is not necessarily indicative of the effect on the Fund’s net assets of future movements in the level of KSE 100 index.
20.2 Credit risk
Credit risk represents the risk of a loss if counter parties fail to perform as contracted. Credit risk arises from deposits with banks and financial institutions, receivable from management company, investment in debt securities, credit exposure arising as a result of dividends receivable on equity securities and receivable against sale of investments. For banks and financial institutions, only reputed parties are accepted. Risk attributable to investment in Treasury Bills is limited as these are guaranteed by the Federal Government. Credit risk on dividends receivable is minimal due to statutory protection. All transactions in listed securities are settled / paid for upon delivery using the central clearing company. The risk of default is considered minimal due to inherent systematic measures taken therein.
NATIONAL INVESTMENT (UNIT) TRUSTNOTES TO AND FORMING PART OF THE FINANCIAL STATEMENTSFOR THE YEAR ENDED JUNE 30, 2011
The Fund’s policy is to enter into financial contracts in accordance with the internal risk management policies and investment guidelines approved by the Investment Committee. The Fund does not expect to incur material credit losses on its financial assets.
T H I R D Q U A R T E R R E P O R T M A R C H 2 0 1 1A N N U A L R E P O R T 78
N I U T
The analysis below summarises the credit quality of the Fund’s financial assets as at June 30, 2011 and June 30, 2010.
Bank balances by rating category 2011 2010
A -1+ 25.30% 100.00%
A - 2 74.70% -
100.00% 100.00%
The maximum exposure to credit risk before any credit enhancement as at June 30, 2011 is the carrying amount of the financial assets. Investments in equity securities, however, are not exposed to credit risk.
Concentration of credit risk
Concentration of credit risk exists when changes in economic or industry factors similarly affect groups of counterparties whose aggregate credit exposure is significant in relation to the Fund’s total credit exposure. The Funds portfolio of financial instruments is mostly concentrated in government securities and deposits held with a commercial bank.
20.3 Liquidity risk
Liquidity risk is the risk that the Fund may not be able to generate sufficient cash resources to settle its obligations in full as they fall due or can only do so on terms that are materially disadvantageous.
The Fund is exposed to the daily settlement of equity securities and to daily cash redemptions, if any. The Fund’s approach to managing liquidity is to ensure, as far as possible, that the Fund will always have sufficient liquidity to meet its liabilities when due under both normal and stressed conditions, without incurring unacceptable losses or risking damage to the Fund’s reputation. Its policy is therefore to invest the majority of its assets in investments that are traded in an active market and can be readily disposed of. The Fund’s listed securities are considered readily realisable, as they are listed on the Karachi Stock Exchange.
The Fund has the ability to borrow in the short term to ensure settlement. The maximum amount available to the Fund from the borrowing would be limited to fifteen percent of the net assets upto 90 days and would be secured by the assets of the Fund. The facility would bear interest at commercial rates.
In order to manage the Fund’s overall liquidity, the Fund may also withhold daily redemption requests in excess of ten percent of the units in issue and such requests would be treated as redemption requests qualifying for being processed on the next business day. Such procedure would continue until the outstanding redemption requests come down to a level below ten percent of the units then in issue. The Fund did not withhold any significant redemptions during the year.
The table below analyses the Fund’s financial liabilities into relevant maturity groupings based on the remaining period at the period end date to the contractual maturity date. The amounts in the table are the contractual undiscounted cash flows.
NATIONAL INVESTMENT (UNIT) TRUSTNOTES TO AND FORMING PART OF THE FINANCIAL STATEMENTSFOR THE YEAR ENDED JUNE 30, 2011
T H I R D Q U A R T E R R E P O R T M A R C H2 0 1 1A N N U A L R E P O R T79
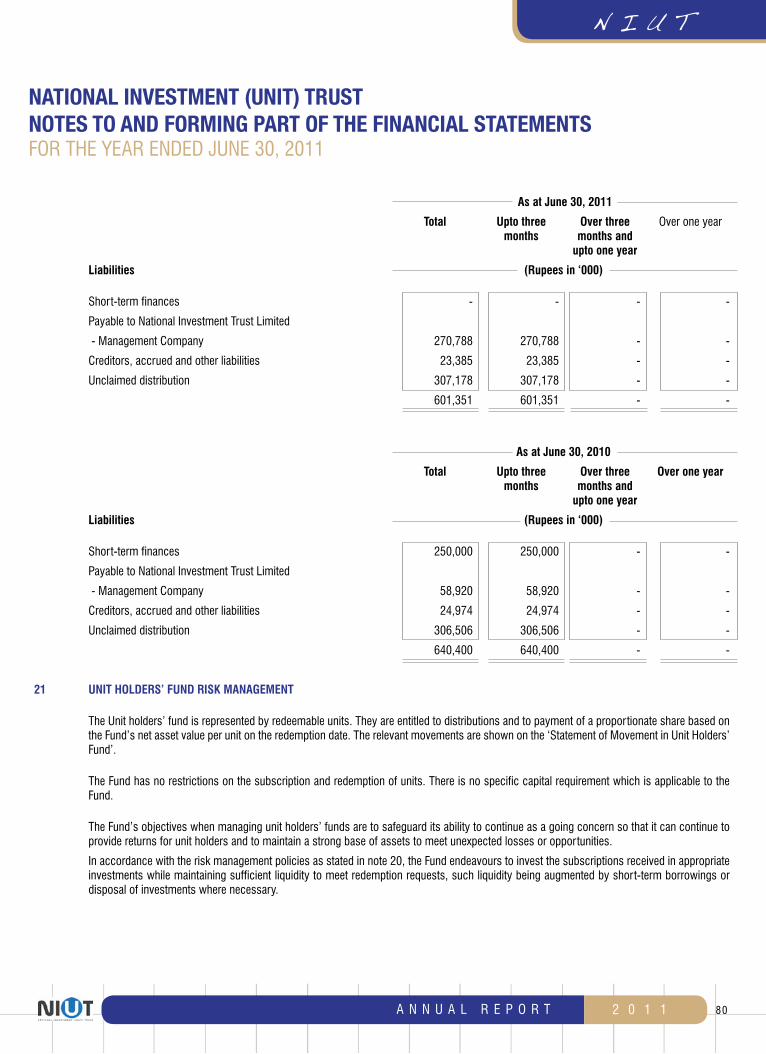
N I U T
As at June 30, 2011
Total Upto three months
Over three months and
upto one year
Over one year
Liabilities (Rupees in ‘000)
Short-term finances - - - -
Payable to National Investment Trust Limited
- Management Company 270,788 270,788 - -
Creditors, accrued and other liabilities 23,385 23,385 - -
Unclaimed distribution 307,178 307,178 - -
601,351 601,351 - -
As at June 30, 2010
Total Upto three months
Over three months and
upto one year
Over one year
Liabilities (Rupees in ‘000)
Short-term finances 250,000 250,000 - -
Payable to National Investment Trust Limited
- Management Company 58,920 58,920 - -
Creditors, accrued and other liabilities 24,974 24,974 - -
Unclaimed distribution 306,506 306,506 - -
640,400 640,400 - -
21 UNIT HOLDERS’ FUND RISK MANAGEMENT
The Unit holders’ fund is represented by redeemable units. They are entitled to distributions and to payment of a proportionate share based on the Fund’s net asset value per unit on the redemption date. The relevant movements are shown on the ‘Statement of Movement in Unit Holders’ Fund’.
The Fund has no restrictions on the subscription and redemption of units. There is no specific capital requirement which is applicable to the Fund.
The Fund’s objectives when managing unit holders’ funds are to safeguard its ability to continue as a going concern so that it can continue to provide returns for unit holders and to maintain a strong base of assets to meet unexpected losses or opportunities.
In accordance with the risk management policies as stated in note 20, the Fund endeavours to invest the subscriptions received in appropriate investments while maintaining sufficient liquidity to meet redemption requests, such liquidity being augmented by short-term borrowings or disposal of investments where necessary.
NATIONAL INVESTMENT (UNIT) TRUSTNOTES TO AND FORMING PART OF THE FINANCIAL STATEMENTSFOR THE YEAR ENDED JUNE 30, 2011
T H I R D Q U A R T E R R E P O R T M A R C H 2 0 1 1A N N U A L R E P O R T 80
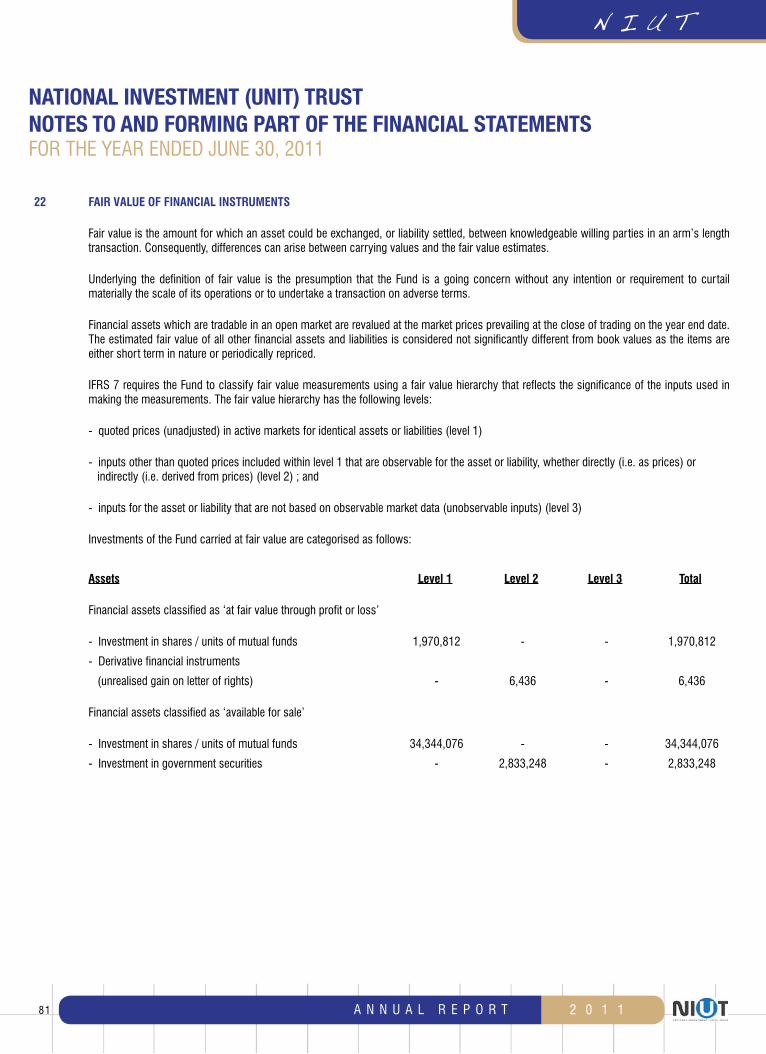
N I U T
22 FAIR VALUE OF FINANCIAL INSTRUMENTS
Fair value is the amount for which an asset could be exchanged, or liability settled, between knowledgeable willing parties in an arm’s length transaction. Consequently, differences can arise between carrying values and the fair value estimates.
Underlying the definition of fair value is the presumption that the Fund is a going concern without any intention or requirement to curtail materially the scale of its operations or to undertake a transaction on adverse terms.
Financial assets which are tradable in an open market are revalued at the market prices prevailing at the close of trading on the year end date. The estimated fair value of all other financial assets and liabilities is considered not significantly different from book values as the items are either short term in nature or periodically repriced.
IFRS 7 requires the Fund to classify fair value measurements using a fair value hierarchy that reflects the significance of the inputs used in making the measurements. The fair value hierarchy has the following levels:
- quoted prices (unadjusted) in active markets for identical assets or liabilities (level 1)
- inputs other than quoted prices included within level 1 that are observable for the asset or liability, whether directly (i.e. as prices) or indirectly (i.e. derived from prices) (level 2) ; and
- inputs for the asset or liability that are not based on observable market data (unobservable inputs) (level 3)
Investments of the Fund carried at fair value are categorised as follows:
Assets Level 1 Level 2 Level 3 Total
Financial assets classified as ‘at fair value through profit or loss’
- Investment in shares / units of mutual funds 1,970,812 - - 1,970,812
- Derivative financial instruments
(unrealised gain on letter of rights) - 6,436 - 6,436
Financial assets classified as ‘available for sale’
- Investment in shares / units of mutual funds 34,344,076 - - 34,344,076
- Investment in government securities - 2,833,248 - 2,833,248
NATIONAL INVESTMENT (UNIT) TRUSTNOTES TO AND FORMING PART OF THE FINANCIAL STATEMENTSFOR THE YEAR ENDED JUNE 30, 2011
T H I R D Q U A R T E R R E P O R T M A R C H2 0 1 1A N N U A L R E P O R T81

N I U T
23 TRANSACTIONS WITH TOP TEN BROKERS / DEALERS
List of top ten brokers by percentage of commission paid for the year ended June 30, 2011
(i) AKD Securities Limited
(ii) Arif Habib Limited
(iii) JS Global Capital Limited
(iv) Amin Tai Securities (Pvt) Limited
(v) Cassim Investment (Pvt) Limited
(vi) KASB Securities Limited
(vii) BMA Capital Management Limited
(viii) Al-Habib Capital Markets (Pvt) Limited
(ix) Taurus Securities Limited
(x) Invest & Finance Securities Limited
List of top ten brokers by percentage of commission paid for the year ended June 30, 2010
(i) JS Global Capital Limited
(ii) AKD Securities Limited
(iii) Arif Habib Limited
(iv) BMA Capital Management Limited
(v) Cassim Investment (Pvt) Limited
(vi) KASB Securities Limited
(vii) Invest and Finance Securities Limited
(viii) Al-Habib Capital Markets (Pvt) Limited
(ix) Concordia Securities (Pvt) Limited
(x) Amin Tai Securities (Pvt) Limited
24 PARTICULARS OF INVESTMENT COMMITTEE AND FUND MANAGER
Details of members of the investment committee of the Fund are as follow:
S.No Name Designation Qualification Experience in years
1 Wazir Ali Khoja Chairman and Managing Director B. Com 40
2 Shahid Anwar Head of MD’s Secretariat and Personnel MBA & DAIBP 34
3 Manzoor Ahmed Chief Operating Officer MBA, DAIBP & Candidate for CFA Level III 22
4 S. Zubair Ahmed Controller of Branches M.Phill, MBA, PGD-General management & PGD-Development Policies
38
5 Aamir Amin Head of Finance CA 14
NATIONAL INVESTMENT (UNIT) TRUSTNOTES TO AND FORMING PART OF THE FINANCIAL STATEMENTSFOR THE YEAR ENDED JUNE 30, 2011
T H I R D Q U A R T E R R E P O R T M A R C H 2 0 1 1A N N U A L R E P O R T 82
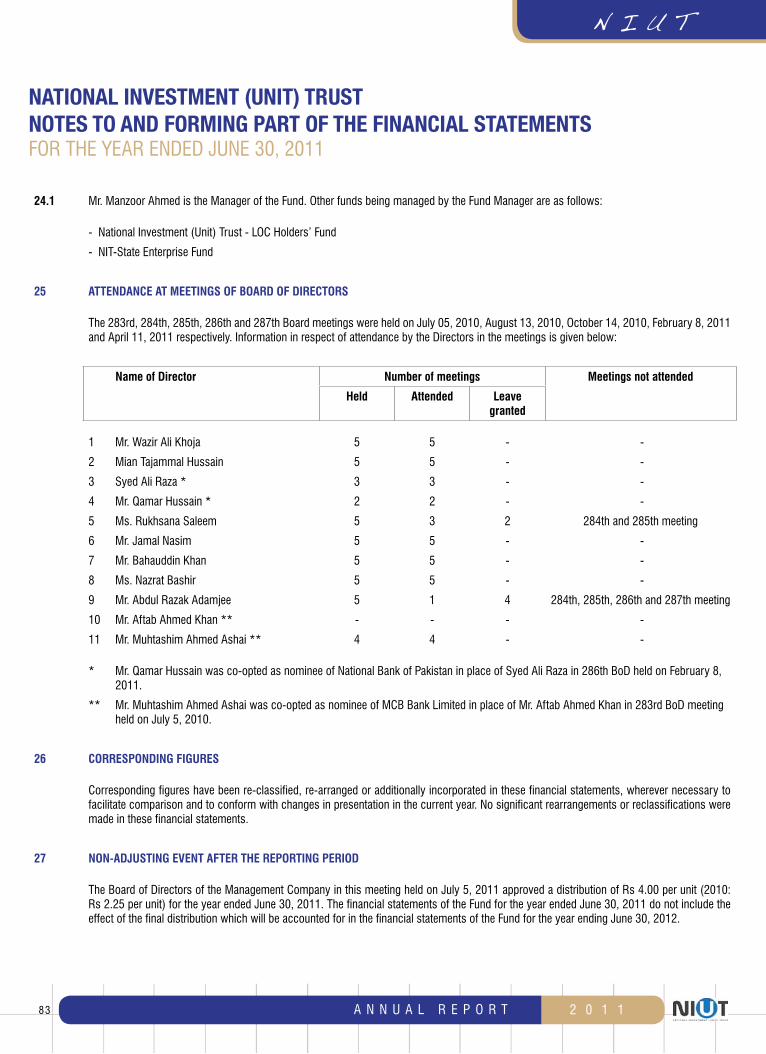
N I U T
24.1 Mr. Manzoor Ahmed is the Manager of the Fund. Other funds being managed by the Fund Manager are as follows:
- National Investment (Unit) Trust - LOC Holders’ Fund
- NIT-State Enterprise Fund
25 ATTENDANCE AT MEETINGS OF BOARD OF DIRECTORS
The 283rd, 284th, 285th, 286th and 287th Board meetings were held on July 05, 2010, August 13, 2010, October 14, 2010, February 8, 2011 and April 11, 2011 respectively. Information in respect of attendance by the Directors in the meetings is given below:
Name of Director Number of meetings Meetings not attended
Held Attended Leave granted
1 Mr. Wazir Ali Khoja 5 5 - -
2 Mian Tajammal Hussain 5 5 - -
3 Syed Ali Raza * 3 3 - -
4 Mr. Qamar Hussain * 2 2 - -
5 Ms. Rukhsana Saleem 5 3 2 284th and 285th meeting
6 Mr. Jamal Nasim 5 5 - -
7 Mr. Bahauddin Khan 5 5 - -
8 Ms. Nazrat Bashir 5 5 - -
9 Mr. Abdul Razak Adamjee 5 1 4 284th, 285th, 286th and 287th meeting
10 Mr. Aftab Ahmed Khan ** - - - -
11 Mr. Muhtashim Ahmed Ashai ** 4 4 - -
* Mr. Qamar Hussain was co-opted as nominee of National Bank of Pakistan in place of Syed Ali Raza in 286th BoD held on February 8, 2011.
** Mr. Muhtashim Ahmed Ashai was co-opted as nominee of MCB Bank Limited in place of Mr. Aftab Ahmed Khan in 283rd BoD meeting held on July 5, 2010.
26 CORRESPONDING FIGURES
Corresponding figures have been re-classified, re-arranged or additionally incorporated in these financial statements, wherever necessary to facilitate comparison and to conform with changes in presentation in the current year. No significant rearrangements or reclassifications were made in these financial statements.
27 NON-ADJUSTING EVENT AFTER THE REPORTING PERIOD
The Board of Directors of the Management Company in this meeting held on July 5, 2011 approved a distribution of Rs 4.00 per unit (2010: Rs 2.25 per unit) for the year ended June 30, 2011. The financial statements of the Fund for the year ended June 30, 2011 do not include the effect of the final distribution which will be accounted for in the financial statements of the Fund for the year ending June 30, 2012.
NATIONAL INVESTMENT (UNIT) TRUSTNOTES TO AND FORMING PART OF THE FINANCIAL STATEMENTSFOR THE YEAR ENDED JUNE 30, 2011
T H I R D Q U A R T E R R E P O R T M A R C H2 0 1 1A N N U A L R E P O R T83
N I U T
28 DATE OF AUTHORISATION FOR ISSUE
These financial statements were authorised for issue on August 22, 2011 by the Board of Directors of the Management Company.
29 GENERAL
29.1 Figures have been rounded off to the nearest thousand rupees unless otherwise specified.
29.2 The bifurcation of undistributed income into realised and unrealised income at the beginning and end of the year as required by the NBFC Regulations has not been disclosed as such bifurcation is not practicable.
NATIONAL INVESTMENT (UNIT) TRUSTNOTES TO AND FORMING PART OF THE FINANCIAL STATEMENTSFOR THE YEAR ENDED JUNE 30, 2011
For National Investment Trust Limited(Management Company)
Sd/- Sd/- Sd/-
Managing Director Director Director
E.V.P. / Divisional Head For National Bank of Pakistan (Trustee)
T H I R D Q U A R T E R R E P O R T M A R C H 2 0 1 1A N N U A L R E P O R T 84

N I U T
SHARES OF COMPANIES - Fully Paidup ordinary shares of Rs. 10 each unless stated otherwise
Name of Investee Company
Number of shares / certificates Balances as at June 30, 2011 Percentage in relation to
As at July 01,
2010
Purchases during the
year
Bonus / Right /
New Issue
Merger / Demerger effects /
Adjustments
Sales
during the year
As at June 30, 2011
Carrying
Value
Market value
Market value as
percentage of net assets
Market value as percentage
of total investments
Paid up capital of the investee
company
Rupees in ‘000
OPEN END MUTUAL FUNDS
Pakistan Strategic Allocation Fund 1,238,865 - - - (1,238,865) - - - - - -
1,238,865 - - - (1,238,865) - - - - -
OIL AND GAS
Attock Refinery Limited 1,663,134 - - - (445,440) 1,217,694 98,097 149,448 0.37 0.38 1.43
Mari Gas Company Limited 168,598 - - - - 168,598 21,813 18,102 0.04 0.05 0.23
National Refinery Limited 405,864 - - - (245,000) 160,864 29,414 56,666 0.14 0.14 0.20
Oil & Gas Development Company Limited 1,831 - - - - 1,831 259 280 - - -
Pakistan Oilfields Limited 44,191 - - - (44,000) 191 41 69 - - -
Pakistan Petroleum Limited 902,665 - 150,533 - (1,053,188) 10 2 2 - - -
Pakistan Refinery Limited 21,616 - - - - 21,616 1,698 1,739 - - 0.06
Pakistan State Oil Company Limited 128,674 - - - (101,000) 27,674 7,201 7,322 0.02 0.02 0.02
Shell Pakistan Limited 2,305 - - - - 2,305 529 519 - - -
3,338,878 - 150,533 - (1,888,628) 1,600,783 159,054 234,147 0.57 0.59
CHEMICALS -
BOC Pakistan Limited 66,660 - - - - 66,660 5,204 6,392 0.02 0.02 0.27
Dawood Hercules Chemicals Limited 294,489 - 883,467 - - 1,177,956 51,668 76,591 0.19 0.20 0.24
Dewan Salman Fibre Limited 1,766,986 - - - - 1,766,986 2,686 4,612 0.01 0.01 0.48
Engro Corporation Limited 66,280 - - - (66,280) - - - - - -
Fauji Fertilizer Bin Qasim Limited 973,090 - - - (973,090) - - - - - -
Fauji Fertilizer Company Limited 1,598,596 - 38,187 - (1,635,845) 938 77 141 - - -
I.C.I Pakistan Limited 328,181 - - - (299,400) 28,781 3,412 4,370 0.01 0.01 0.02
Lotte Pakistan PTA Limited 15,471 - - - - 15,471 125 214 - - -
Sitara Chemical Industries Limited 19,585 - 979 - - 20,564 2,643 2,052 0.01 0.01 -
5,129,338 - 922,633 - (2,974,615) 3,077,356 65,815 94,372 0.24 0.25
FORESTRY AND PAPER -
Century Paper & Board Mills Limited 52,518 - - - - 52,518 840 809 - - 0.07
Security Papers Limited 34,812 - - - - 34,812 1,497 1,410 0.01 0.01 0.08
87,330 - - - - 87,330 2,337 2,219 0.01 0.01
INDUSTRIAL METALS AND MINING
Crescent Steel & Allied Proudcts Limited 16,596 - - - - 16,596 417 433 - - 0.03
International Industries Limited 50,832 - 10,166 - - 60,998 2,846 3,019 0.01 0.01 -
67,428 - 10,166 - - 77,594 3,263 3,452 0.01 0.01
CONSTRUCTION & METERIALS -
Al-Abbas Cement Industries Limited 788,148 - - - - 788,148 2,829 2,081 0.01 0.01 0.43
Cherat Cement Company Limited 56,488 - - - - 56,488 521 508 - - 0.06
D. G. Khan Cement Company Limited 2,919,589 - 416,918 - (835,000) 2,501,507 57,576 57,510 0.14 0.15 0.57
Lucky Cement Limited 1,152,226 - - - (1,148,997) 3,229 201 229 - - -
Maple Leaf Cement Factory Limited 922,806 - - - - 922,806 2,870 1,901 - - 0.25
5,839,257 - 416,918 - (1,983,997) 4,272,178 63,997 62,229 0.15 0.16
GENERAL INDUSTRIALS
Ghani Glass Limited 1,164,347 - 116,434 - - 1,280,781 66,368 67,305 0.17 0.17 1.18
NATIONAL INVESTMENT (UNIT) TRUSTINVESTMENTS - AT FAIR VALUE THROUGH PROFIT OR LOSS -HELD FOR TRADINGAS AT JUNE 30, 2011
T H I R D Q U A R T E R R E P O R T M A R C H2 0 1 1A N N U A L R E P O R T85
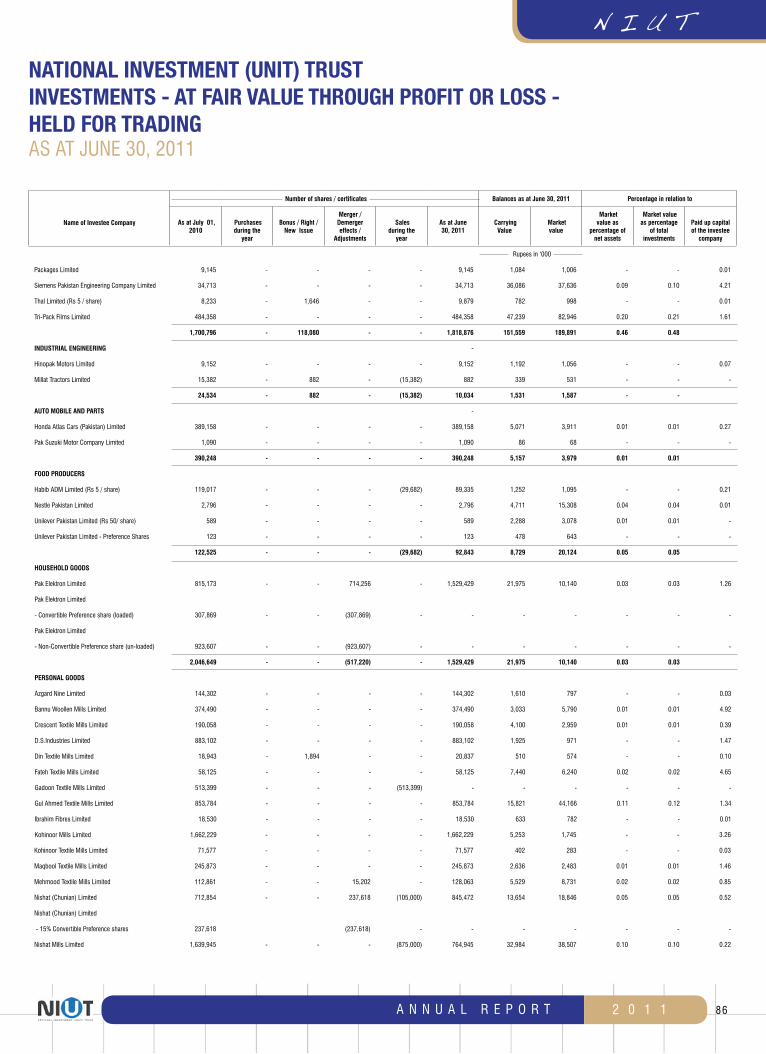
N I U T
Name of Investee Company
Number of shares / certificates Balances as at June 30, 2011 Percentage in relation to
As at July 01,
2010
Purchases during the
year
Bonus / Right /
New Issue
Merger / Demerger effects /
Adjustments
Sales
during the year
As at June 30, 2011
Carrying
Value
Market value
Market value as
percentage of net assets
Market value as percentage
of total investments
Paid up capital of the investee
company
Rupees in ‘000
Packages Limited 9,145 - - - - 9,145 1,084 1,006 - - 0.01
Siemens Pakistan Engineering Company Limited 34,713 - - - - 34,713 36,086 37,636 0.09 0.10 4.21
Thal Limited (Rs 5 / share) 8,233 - 1,646 - - 9,879 782 998 - - 0.01
Tri-Pack Films Limited 484,358 - - - - 484,358 47,239 82,946 0.20 0.21 1.61
1,700,796 - 118,080 - - 1,818,876 151,559 189,891 0.46 0.48
INDUSTRIAL ENGINEERING -
Hinopak Motors Limited 9,152 - - - - 9,152 1,192 1,056 - - 0.07
Millat Tractors Limited 15,382 - 882 - (15,382) 882 339 531 - - -
24,534 - 882 - (15,382) 10,034 1,531 1,587 - -
AUTO MOBILE AND PARTS -
Honda Atlas Cars (Pakistan) Limited 389,158 - - - - 389,158 5,071 3,911 0.01 0.01 0.27
Pak Suzuki Motor Company Limited 1,090 - - - - 1,090 86 68 - - -
390,248 - - - - 390,248 5,157 3,979 0.01 0.01
FOOD PRODUCERS
Habib ADM Limited (Rs 5 / share) 119,017 - - - (29,682) 89,335 1,252 1,095 - - 0.21
Nestle Pakistan Limited 2,796 - - - - 2,796 4,711 15,308 0.04 0.04 0.01
Unilever Pakistan Limited (Rs 50/ share) 589 - - - - 589 2,288 3,078 0.01 0.01 -
Unilever Pakistan Limited - Preference Shares 123 - - - - 123 478 643 - - -
122,525 - - - (29,682) 92,843 8,729 20,124 0.05 0.05
HOUSEHOLD GOODS
Pak Elektron Limited 815,173 - - 714,256 - 1,529,429 21,975 10,140 0.03 0.03 1.26
Pak Elektron Limited
- Convertible Preference share (loaded) 307,869 - - (307,869) - - - - - - -
Pak Elektron Limited
- Non-Convertible Preference share (un-loaded) 923,607 - - (923,607) - - - - - - -
2,046,649 - - (517,220) - 1,529,429 21,975 10,140 0.03 0.03
PERSONAL GOODS
Azgard Nine Limited 144,302 - - - - 144,302 1,610 797 - - 0.03
Bannu Woollen Mills Limited 374,490 - - - - 374,490 3,033 5,790 0.01 0.01 4.92
Crescent Textile Mills Limited 190,058 - - - - 190,058 4,100 2,959 0.01 0.01 0.39
D.S.Industries Limited 883,102 - - - - 883,102 1,925 971 - - 1.47
Din Textile Mills Limited 18,943 - 1,894 - - 20,837 510 574 - - 0.10
Fateh Textile Mills Limited 58,125 - - - - 58,125 7,440 6,240 0.02 0.02 4.65
Gadoon Textile Mills Limited 513,399 - - - (513,399) - - - - - -
Gul Ahmed Textile Mills Limited 853,784 - - - - 853,784 15,821 44,166 0.11 0.12 1.34
Ibrahim Fibres Limited 18,530 - - - - 18,530 633 782 - - 0.01
Kohinoor Mills Limited 1,662,229 - - - - 1,662,229 5,253 1,745 - - 3.26
Kohinoor Textile Mills Limited 71,577 - - - - 71,577 402 283 - - 0.03
Maqbool Textile Mills Limited 245,873 - - - - 245,873 2,636 2,483 0.01 0.01 1.46
Mehmood Textile Mills Limited 112,861 - - 15,202 - 128,063 5,529 8,731 0.02 0.02 0.85
Nishat (Chunian) Limited 712,854 - - 237,618 (105,000) 845,472 13,654 18,846 0.05 0.05 0.52
Nishat (Chunian) Limited
- 15% Convertible Preference shares 237,618 (237,618) - - - - - - -
Nishat Mills Limited 1,639,945 - - - (875,000) 764,945 32,984 38,507 0.10 0.10 0.22
NATIONAL INVESTMENT (UNIT) TRUSTINVESTMENTS - AT FAIR VALUE THROUGH PROFIT OR LOSS -HELD FOR TRADINGAS AT JUNE 30, 2011
T H I R D Q U A R T E R R E P O R T M A R C H 2 0 1 1A N N U A L R E P O R T 86
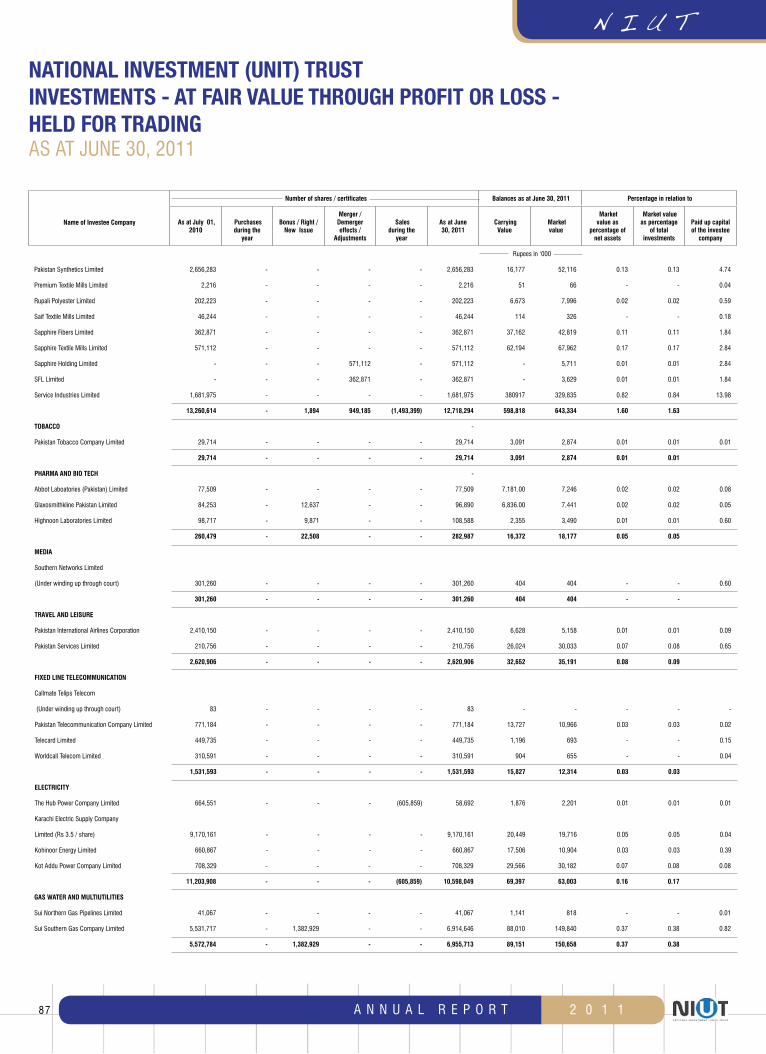
N I U T
Name of Investee Company
Number of shares / certificates Balances as at June 30, 2011 Percentage in relation to
As at July 01,
2010
Purchases during the
year
Bonus / Right /
New Issue
Merger / Demerger effects /
Adjustments
Sales
during the year
As at June 30, 2011
Carrying
Value
Market value
Market value as
percentage of net assets
Market value as percentage
of total investments
Paid up capital of the investee
company
Rupees in ‘000
Pakistan Synthetics Limited 2,656,283 - - - - 2,656,283 16,177 52,116 0.13 0.13 4.74
Premium Textile Mills Limited 2,216 - - - - 2,216 51 66 - - 0.04
Rupali Polyester Limited 202,223 - - - - 202,223 6,673 7,996 0.02 0.02 0.59
Saif Textile Mills Limited 46,244 - - - - 46,244 114 326 - - 0.18
Sapphire Fibers Limited 362,871 - - - - 362,871 37,162 42,819 0.11 0.11 1.84
Sapphire Textile Mills Limited 571,112 - - - - 571,112 62,194 67,962 0.17 0.17 2.84
Sapphire Holding Limited - - - 571,112 - 571,112 - 5,711 0.01 0.01 2.84
SFL Limited - - - 362,871 - 362,871 - 3,629 0.01 0.01 1.84
Service Industries Limited 1,681,975 - - - - 1,681,975 380917 329,835 0.82 0.84 13.98
13,260,614 - 1,894 949,185 (1,493,399) 12,718,294 598,818 643,334 1.60 1.63
TOBACCO -
Pakistan Tobacco Company Limited 29,714 - - - - 29,714 3,091 2,874 0.01 0.01 0.01
29,714 - - - - 29,714 3,091 2,874 0.01 0.01
PHARMA AND BIO TECH -
Abbot Laboatories (Pakistan) Limited 77,509 - - - - 77,509 7,181.00 7,246 0.02 0.02 0.08
Glaxosmithkline Pakistan Limited 84,253 - 12,637 - - 96,890 6,836.00 7,441 0.02 0.02 0.05
Highnoon Laboratories Limited 98,717 - 9,871 - - 108,588 2,355 3,490 0.01 0.01 0.60
260,479 - 22,508 - - 282,987 16,372 18,177 0.05 0.05
MEDIA
Southern Networks Limited
(Under winding up through court) 301,260 - - - - 301,260 404 404 - - 0.60
301,260 - - - - 301,260 404 404 - -
TRAVEL AND LEISURE
Pakistan International Airlines Corporation 2,410,150 - - - - 2,410,150 6,628 5,158 0.01 0.01 0.09
Pakistan Services Limited 210,756 - - - - 210,756 26,024 30,033 0.07 0.08 0.65
2,620,906 - - - - 2,620,906 32,652 35,191 0.08 0.09
FIXED LINE TELECOMMUNICATION
Callmate Telips Telecom
(Under winding up through court) 83 - - - - 83 - - - - -
Pakistan Telecommunication Company Limited 771,184 - - - - 771,184 13,727 10,966 0.03 0.03 0.02
Telecard Limited 449,735 - - - - 449,735 1,196 693 - - 0.15
Worldcall Telecom Limited 310,591 - - - - 310,591 904 655 - - 0.04
1,531,593 - - - - 1,531,593 15,827 12,314 0.03 0.03
ELECTRICITY
The Hub Power Company Limited 664,551 - - - (605,859) 58,692 1,876 2,201 0.01 0.01 0.01
Karachi Electric Supply Company
Limited (Rs 3.5 / share) 9,170,161 - - - - 9,170,161 20,449 19,716 0.05 0.05 0.04
Kohinoor Energy Limited 660,867 - - - - 660,867 17,506 10,904 0.03 0.03 0.39
Kot Addu Power Company Limited 708,329 - - - - 708,329 29,566 30,182 0.07 0.08 0.08
11,203,908 - - - (605,859) 10,598,049 69,397 63,003 0.16 0.17
GAS WATER AND MULTIUTILITIES
Sui Northern Gas Pipelines Limited 41,067 - - - - 41,067 1,141 818 - - 0.01
Sui Southern Gas Company Limited 5,531,717 - 1,382,929 - - 6,914,646 88,010 149,840 0.37 0.38 0.82
5,572,784 - 1,382,929 - - 6,955,713 89,151 150,658 0.37 0.38
NATIONAL INVESTMENT (UNIT) TRUSTINVESTMENTS - AT FAIR VALUE THROUGH PROFIT OR LOSS -HELD FOR TRADINGAS AT JUNE 30, 2011
T H I R D Q U A R T E R R E P O R T M A R C H2 0 1 1A N N U A L R E P O R T87
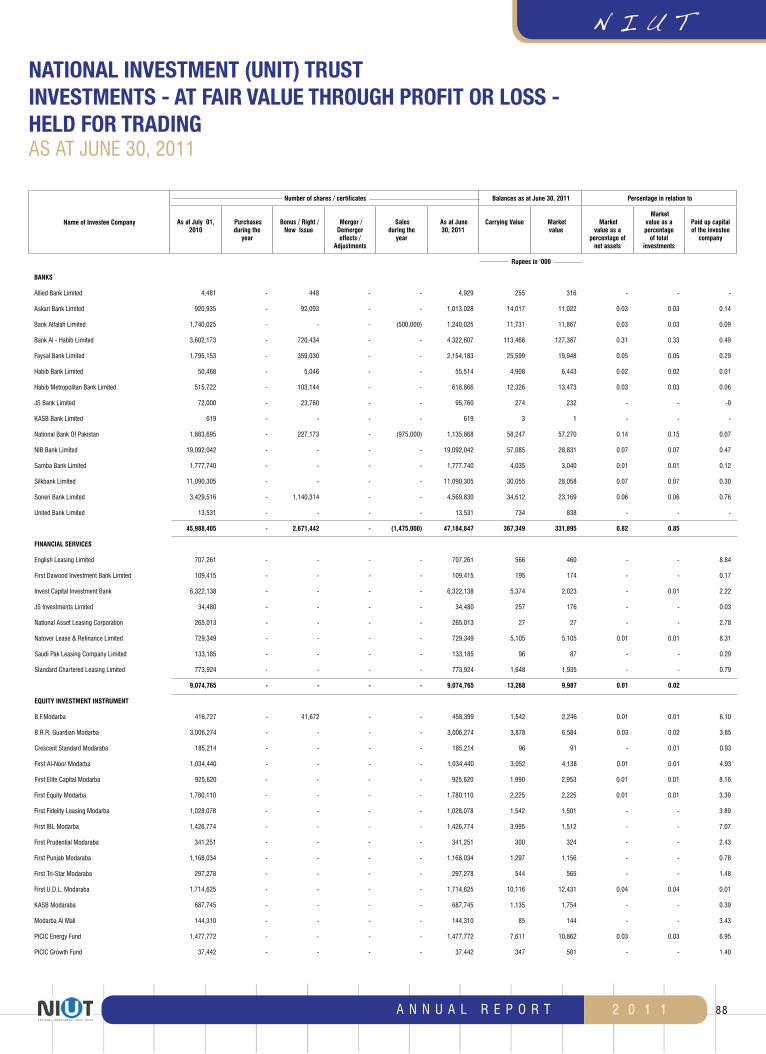
N I U T
Name of Investee Company
Number of shares / certificates Balances as at June 30, 2011 Percentage in relation to
As at July 01,
2010
Purchases during the
year
Bonus / Right /
New Issue
Merger / Demerger effects /
Adjustments
Sales
during the year
As at June 30, 2011
Carrying Value
Market value
Market
value as a percentage of
net assets
Market value as a percentage
of total investments
Paid up capital of the investee
company
Rupees in ‘000
BANKS
Allied Bank Limited 4,481 - 448 - - 4,929 255 316 - - -
Askari Bank Limited 920,935 - 92,093 - - 1,013,028 14,017 11,022 0.03 0.03 0.14
Bank Alfalah Limited 1,740,025 - - - (500,000) 1,240,025 11,731 11,867 0.03 0.03 0.09
Bank Al - Habib Limited 3,602,173 - 720,434 - - 4,322,607 113,468 127,387 0.31 0.33 0.49
Faysal Bank Limited 1,795,153 - 359,030 - - 2,154,183 25,599 19,948 0.05 0.05 0.29
Habib Bank Limited 50,468 - 5,046 - - 55,514 4,908 6,443 0.02 0.02 0.01
Habib Metropolitan Bank Limited 515,722 - 103,144 - - 618,866 12,326 13,473 0.03 0.03 0.06
JS Bank Limited 72,000 - 23,760 - - 95,760 274 232 - - -0
KASB Bank Limited 619 - - - - 619 3 1 - - -
National Bank Of Pakistan 1,883,695 - 227,173 - (975,000) 1,135,868 58,247 57,270 0.14 0.15 0.07
NIB Bank Limited 19,092,042 - - - - 19,092,042 57,085 28,831 0.07 0.07 0.47
Samba Bank Limited 1,777,740 - - - - 1,777,740 4,035 3,040 0.01 0.01 0.12
Silkbank Limited 11,090,305 - - - - 11,090,305 30,055 28,058 0.07 0.07 0.30
Soneri Bank Limited 3,429,516 - 1,140,314 - - 4,569,830 34,612 23,169 0.06 0.06 0.76
United Bank Limited 13,531 - - - - 13,531 734 838 - - -
45,988,405 - 2,671,442 - (1,475,000) 47,184,847 367,349 331,895 0.82 0.85
FINANCIAL SERVICES
English Leasing Limited 707,261 - - - - 707,261 566 460 - - 8.84
First Dawood Investment Bank Limited 109,415 - - - - 109,415 195 174 - - 0.17
Invest Capital Investment Bank 6,322,138 - - - - 6,322,138 5,374 2,023 - 0.01 2.22
JS Investments Limited 34,480 - - - - 34,480 257 176 - - 0.03
National Asset Leasing Corporation 265,013 - - - - 265,013 27 27 - - 2.78
Natover Lease & Refinance Limited 729,349 - - - - 729,349 5,105 5,105 0.01 0.01 8.31
Saudi Pak Leasing Company Limited 133,185 - - - - 133,185 96 87 - - 0.29
Standard Chartered Leasing Limited 773,924 - - - - 773,924 1,648 1,935 - - 0.79
9,074,765 - - - - 9,074,765 13,268 9,987 0.01 0.02
EQUITY INVESTMENT INSTRUMENT
B.F.Modarba 416,727 - 41,672 - - 458,399 1,542 2,246 0.01 0.01 6.10
B.R.R. Guardian Modarba 3,006,274 - - - - 3,006,274 3,878 6,584 0.03 0.02 3.85
Crescent Standard Modaraba 185,214 - - - - 185,214 96 91 - 0.01 0.93
First Al-Noor Modarba 1,034,440 - - - - 1,034,440 3,052 4,138 0.01 0.01 4.93
First Elite Capital Modarba 925,620 - - - - 925,620 1,990 2,953 0.01 0.01 8.16
First Equity Modarba 1,780,110 - - - - 1,780,110 2,225 2,225 0.01 0.01 3.39
First Fidelity Leasing Modarba 1,028,078 - - - - 1,028,078 1,542 1,501 - - 3.89
First IBL Modarba 1,426,774 - - - - 1,426,774 3,995 1,512 - - 7.07
First Prudential Modaraba 341,251 - - - - 341,251 300 324 - - 2.43
First Punjab Modaraba 1,168,034 - - - - 1,168,034 1,297 1,156 - - 0.78
First Tri-Star Modaraba 297,278 - - - - 297,278 544 565 - - 1.48
First U.D.L. Modaraba 1,714,625 - - - - 1,714,625 10,116 12,431 0.04 0.04 0.01
KASB Modaraba 687,745 - - - - 687,745 1,135 1,754 - - 0.39
Modarba Al Mali 144,310 - - - - 144,310 85 144 - - 3.43
PICIC Energy Fund 1,477,772 - - - - 1,477,772 7,611 10,862 0.03 0.03 6.95
PICIC Growth Fund 37,442 - - - - 37,442 347 501 - - 1.40
NATIONAL INVESTMENT (UNIT) TRUSTINVESTMENTS - AT FAIR VALUE THROUGH PROFIT OR LOSS -HELD FOR TRADINGAS AT JUNE 30, 2011
T H I R D Q U A R T E R R E P O R T M A R C H 2 0 1 1A N N U A L R E P O R T 88

N I U T
Name of Investee Company
Number of shares / certificates Balances as at June 30, 2011 Percentage in relation to
As at July 01,
2010
Purchases during the
year
Bonus / Right /
New Issue
Merger / Demerger effects /
Adjustments
Sales
during the year
As at June 30, 2011
Carrying
Value
Market value
Market value as
percentage of net assets
Market value as percentage
of total investments
Paid up capital of the investee
company
Rupees in ‘000
Standard Chartered Modaraba 3,152,598 - - - - 3,152,598 29,004 31,747 0.08 0.08 6.50
Unicap Modaraba 349,197 - - - - 349,197 53 101 - - 2.56
19,173,489 - 41,672 - - 19,215,161 68,812 80,835 0.22 0.22
GRAND TOTAL 129,003,765 - 5,739,657 431,965 (11,705,427) 123,469,960 1,758,558 1,970,812 4.87 5.03
NATIONAL INVESTMENT (UNIT) TRUSTINVESTMENTS - AT FAIR VALUE THROUGH PROFIT OR LOSS -HELD FOR TRADINGAS AT JUNE 30, 2011
T H I R D Q U A R T E R R E P O R T M A R C H2 0 1 1A N N U A L R E P O R T89
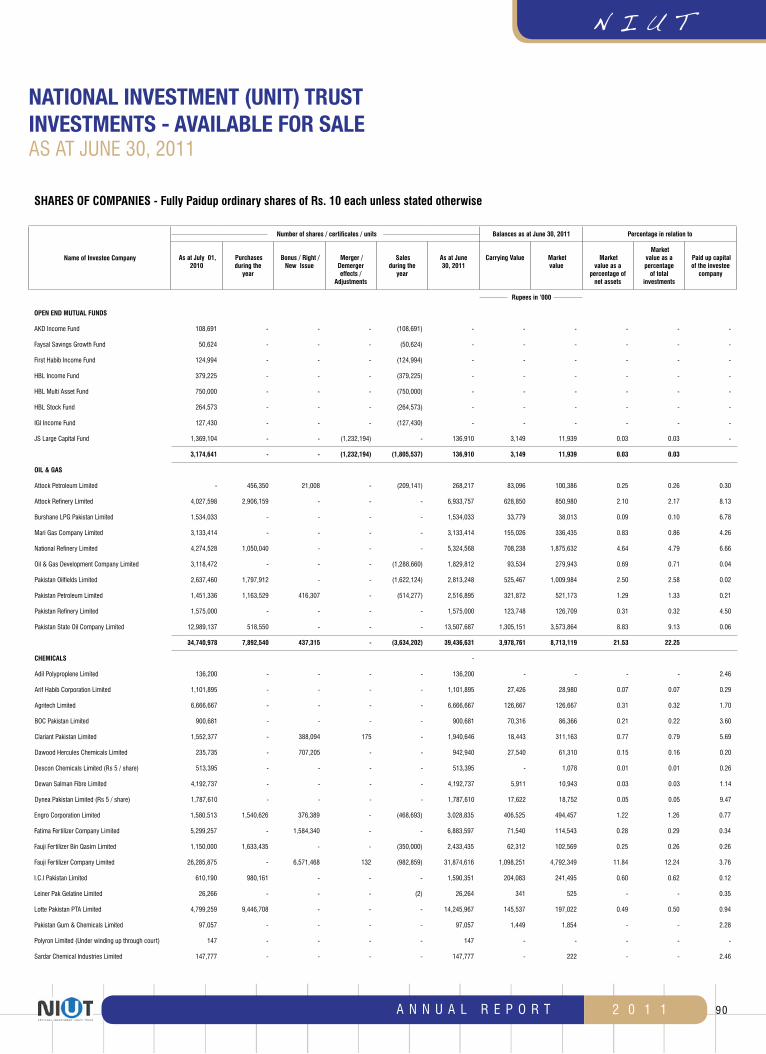
N I U T
SHARES OF COMPANIES - Fully Paidup ordinary shares of Rs. 10 each unless stated otherwise
Name of Investee Company
Number of shares / certificates / units Balances as at June 30, 2011 Percentage in relation to
As at July 01, 2010
Purchases during the
year
Bonus / Right /
New Issue
Merger / Demerger effects /
Adjustments
Sales
during the year
As at June 30, 2011
Carrying Value
Market value
Market
value as a percentage of
net assets
Market value as a percentage
of total investments
Paid up capital of the investee
company
Rupees in ‘000
OPEN END MUTUAL FUNDS
AKD Income Fund 108,691 - - - (108,691) - - - - - -
Faysal Savings Growth Fund 50,624 - - - (50,624) - - - - - -
First Habib Income Fund 124,994 - - - (124,994) - - - - - -
HBL Income Fund 379,225 - - - (379,225) - - - - - -
HBL Multi Asset Fund 750,000 - - - (750,000) - - - - - -
HBL Stock Fund 264,573 - - - (264,573) - - - - - -
IGI Income Fund 127,430 - - - (127,430) - - - - - -
JS Large Capital Fund 1,369,104 - - (1,232,194) - 136,910 3,149 11,939 0.03 0.03 -
3,174,641 - - (1,232,194) (1,805,537) 136,910 3,149 11,939 0.03 0.03
OIL & GAS
Attock Petroleum Limited - 456,350 21,008 - (209,141) 268,217 83,096 100,386 0.25 0.26 0.30
Attock Refinery Limited 4,027,598 2,906,159 - - - 6,933,757 628,850 850,980 2.10 2.17 8.13
Burshane LPG Pakistan Limited 1,534,033 - - - - 1,534,033 33,779 38,013 0.09 0.10 6.78
Mari Gas Company Limited 3,133,414 - - - - 3,133,414 155,026 336,435 0.83 0.86 4.26
National Refinery Limited 4,274,528 1,050,040 - - - 5,324,568 708,238 1,875,632 4.64 4.79 6.66
Oil & Gas Development Company Limited 3,118,472 - - - (1,288,660) 1,829,812 93,534 279,943 0.69 0.71 0.04
Pakistan Oilfields Limited 2,637,460 1,797,912 - - (1,622,124) 2,813,248 525,467 1,009,984 2.50 2.58 0.02
Pakistan Petroleum Limited 1,451,336 1,163,529 416,307 - (514,277) 2,516,895 321,872 521,173 1.29 1.33 0.21
Pakistan Refinery Limited 1,575,000 - - - - 1,575,000 123,748 126,709 0.31 0.32 4.50
Pakistan State Oil Company Limited 12,989,137 518,550 - - - 13,507,687 1,305,151 3,573,864 8.83 9.13 0.06
34,740,978 7,892,540 437,315 - (3,634,202) 39,436,631 3,978,761 8,713,119 21.53 22.25
CHEMICALS -
Adil Polyproplene Limited 136,200 - - - - 136,200 - - - - 2.46
Arif Habib Corporation Limited 1,101,895 - - - - 1,101,895 27,426 28,980 0.07 0.07 0.29
Agritech Limited 6,666,667 - - - - 6,666,667 126,667 126,667 0.31 0.32 1.70
BOC Pakistan Limited 900,681 - - - - 900,681 70,316 86,366 0.21 0.22 3.60
Clariant Pakistan Limited 1,552,377 - 388,094 175 - 1,940,646 18,443 311,163 0.77 0.79 5.69
Dawood Hercules Chemicals Limited 235,735 - 707,205 - - 942,940 27,540 61,310 0.15 0.16 0.20
Descon Chemicals Limited (Rs 5 / share) 513,395 - - - - 513,395 - 1,078 0.01 0.01 0.26
Dewan Salman Fibre Limited 4,192,737 - - - - 4,192,737 5,911 10,943 0.03 0.03 1.14
Dynea Pakistan Limited (Rs 5 / share) 1,787,610 - - - - 1,787,610 17,622 18,752 0.05 0.05 9.47
Engro Corporation Limited 1,580,513 1,540,626 376,389 - (468,693) 3,028,835 406,525 494,457 1.22 1.26 0.77
Fatima Fertilizer Company Limited 5,299,257 - 1,584,340 - - 6,883,597 71,540 114,543 0.28 0.29 0.34
Fauji Fertilizer Bin Qasim Limited 1,150,000 1,633,435 - - (350,000) 2,433,435 62,312 102,569 0.25 0.26 0.26
Fauji Fertilizer Company Limited 26,285,875 - 6,571,468 132 (982,859) 31,874,616 1,098,251 4,792,349 11.84 12.24 3.76
I.C.I Pakistan Limited 610,190 980,161 - - - 1,590,351 204,083 241,495 0.60 0.62 0.12
Leiner Pak Gelatine Limited 26,266 - - - (2) 26,264 341 525 - - 0.35
Lotte Pakistan PTA Limited 4,799,259 9,446,708 - - - 14,245,967 145,537 197,022 0.49 0.50 0.94
Pakistan Gum & Chemicals Limited 97,057 - - - - 97,057 1,449 1,854 - - 2.28
Polyron Limited (Under winding up through court) 147 - - - - 147 - - - - -
Sardar Chemical Industries Limited 147,777 - - - - 147,777 - 222 - - 2.46
NATIONAL INVESTMENT (UNIT) TRUSTINVESTMENTS - AVAILABLE FOR SALEAS AT JUNE 30, 2011
T H I R D Q U A R T E R R E P O R T M A R C H 2 0 1 1A N N U A L R E P O R T 90

N I U T
Name of Investee Company
Number of shares / certificates / units Balances as at June 30, 2011 Percentage in relation to
As at July 01, 2010
Purchases during the
year
Bonus / Right /
New Issue
Merger / Demerger effects /
Adjustments
Sales
during the year
As at June 30, 2011
Carrying Value
Market value
Market
value as a percentage of
net assets
Market value as a percentage
of total investments
Paid up capital of the investee
company
Rupees in ‘000
Sind Alkalis Limited 704,745 - - - - 704,745 - - - - 9.42
Sitara Chemical Industries Limited 662,495 - 33,125 2,533 - 698,153 69,683 69,683 0.17 0.18 3.26
Sitara Peroxide Limited 104,322 - - - - 104,322 926 1,747 0.01 0.01 0.19
United Distributors Pakistan Limited 452,388 - - - - 452,388 - - - - 4.93
Wah-Noble Chemicals Limited 636,624 - - - - 636,624 10,157 23,141 0.06 0.06 7.07
59,644,212 13,600,930 9,660,621 2,840 (1,801,554) 81,107,049 2,364,729 6,684,866 16.52 17.07
FORESTRY AND PAPER -
Century Paper & Board Mills Limited 5,500,015 - - - - 5,500,015 72,545 84,700 0.21 0.21 7.78
Pakistan Paper Prouducts Limited 289,780 - 96,583 387 - 386,750 568 16,247 0.04 0.04 7.74
Security Papers Limited 1,800,000 - - - - 1,800,000 69,300 72,900 0.18 0.19 4.37
7,589,795 - 96,583 387 - 7,686,765 142,413 173,847 0.43 0.44
INDUSTRIAL METALS AND MINING -
Crescent Steel & Allied Products Limited 3,891,245 - - - - 3,891,245 66,268 101,639 0.25 0.26 6.89
Huffaz Seamless Pipe Industries Limited 1,362,396 - - - - 1,362,396 6,758 16,866 0.04 0.04 2.46
International Industries Limited 10,464,279 - 2,092,856 1 - 12,557,136 471,834 621,578 1.54 1.59 10.47
International Steels Limited - 4,800,000 - - - 4,800,000 67,536 65,328 0.16 0.17 1.10
Metropolitan Steel Corporation Limited 98,518 - - - - 98,518 - 896 - - 0.32
Quality Steel Works Limited 2,922 - - - - 2,922 - - - - 0.16
15,819,360 4,800,000 2,092,856 1 - 22,712,217 612,396 806,307 1.99 2.06
CONSTRUCTION AND METERIALS -
Al-Abbas Cement Industries Limited 14,821 - - - - 14,821 42 39 - - 0.01
Attock Cement Pakistan Limited - 869,311 - - - 869,311 42,188 42,188 0.10 0.11 1.00
Balochistan Glass Limited 591,534 - - - - 591,534 858 1,183 - - 0.69
Berger Paints Pakistan Limited 618,426 - - - - 618,426 9,760 8,998 0.02 0.02 3.40
Buxly Paints Limited 175,218 - - - - 175,218 1,354 1,354 0.01 0.01 12.17
Cherat Cement Company Limited 12,699,288 - - - - 12,699,288 114,294 114,294 0.28 0.29 13.29
D. G. Khan Cement Company Limited 951,815 2,310,882 652,539 - - 3,915,236 96,446 90,011 0.22 0.23 0.89
Dadabhoy Construction Technology Limited 69,085 - - - - 69,085 - - - - 2.97
Dewan Cement Limited 4,921,424 - - - - 4,921,424 8,317 8,317 0.02 0.02 1.26
Emco Industries Limited 754,929 - - - - 754,929 1,215 1,215 - - 2.16
Fauji Cement Company Limited - 2,117,670 - - - 2,117,670 8,725 8,725 0.02 0.02 0.31
Fecto Cement Limited 1,727,655 - - - - 1,727,655 9,416 9,416 0.02 0.02 3.44
Karam Ceramices Limited 358,232 - - - - 358,232 1,752 2,543 0.01 0.01 2.46
Kohat Cement Company Limited 245,503 - - - - 245,503 1,500 1,500 0.01 0.01 0.19
Lafarge Pakistan Cement Limited 20,715,094 749,815 - - - 21,464,909 48,097 57,955 0.14 0.15 1.64
Lucky Cement Limited 5,226,818 2,503,409 - - (125,000) 7,605,227 405,646 538,754 1.33 1.38 2.35
Maple Leaf Cement Factory Limited 2,606,440 - - - - 2,606,440 5,369 5,369 0.01 0.01 0.49
Mustehkam Cement Limited 678,819 - - - - 678,819 5,235 7,053 0.02 0.02 0.78
Pioneer Cement Limited 1,286,444 - - - - 1,286,444 7,088 7,088 0.02 0.02 0.57
Shabbir Tiles & Ceramics Limited (Rs 5 / share) 3,535,939 - - - - 3,535,939 23,019 23,019 0.06 0.06 4.90
Thatta Cement Company Limited - 2,884,864 721,216 - - 3,606,080 64,569 72,049 0.18 0.18 4.52
Zeal Pak Cement Factory Limited 486,248 - - - - 486,248 - 214 - - 0.11
57,663,732 11,435,951 1,373,755 - (125,000) 70,348,438 854,890 1,001,284 2.47 2.56
NATIONAL INVESTMENT (UNIT) TRUSTINVESTMENTS - AVAILABLE FOR SALEAS AT JUNE 30, 2011
T H I R D Q U A R T E R R E P O R T M A R C H2 0 1 1A N N U A L R E P O R T91
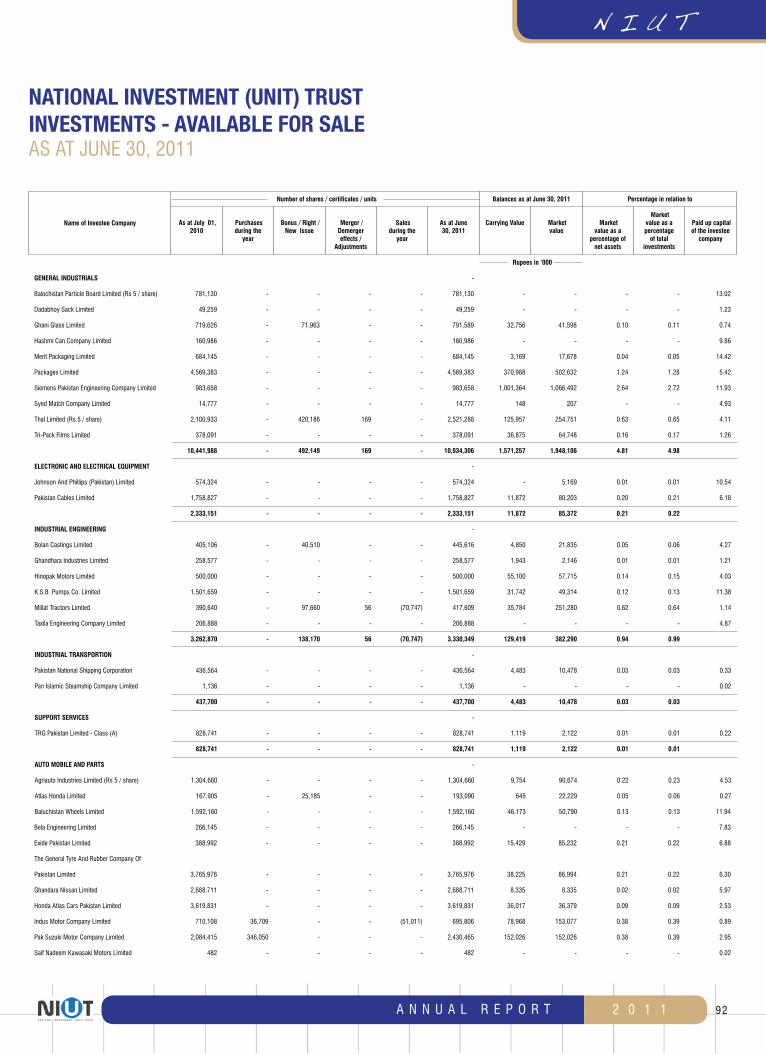
N I U T
Name of Investee Company
Number of shares / certificates / units Balances as at June 30, 2011 Percentage in relation to
As at July 01, 2010
Purchases during the
year
Bonus / Right /
New Issue
Merger / Demerger effects /
Adjustments
Sales
during the year
As at June 30, 2011
Carrying Value
Market value
Market
value as a percentage of
net assets
Market value as a percentage
of total investments
Paid up capital of the investee
company
Rupees in ‘000
GENERAL INDUSTRIALS -
Balochistan Particle Board Limited (Rs 5 / share) 781,130 - - - - 781,130 - - - - 13.02
Dadabhoy Sack Limited 49,259 - - - - 49,259 - - - - 1.23
Ghani Glass Limited 719,626 - 71,963 - - 791,589 32,756 41,598 0.10 0.11 0.74
Hashmi Can Company Limited 160,986 - - - - 160,986 - - - - 9.86
Merit Packaging Limited 684,145 - - - - 684,145 3,169 17,678 0.04 0.05 14.42
Packages Limited 4,569,383 - - - - 4,569,383 370,988 502,632 1.24 1.28 5.42
Siemens Pakistan Engineering Company Limited 983,658 - - - - 983,658 1,001,364 1,066,492 2.64 2.72 11.93
Syed Match Company Limited 14,777 - - - - 14,777 148 207 - - 4.93
Thal Limited (Rs 5 / share) 2,100,933 - 420,186 169 - 2,521,288 125,957 254,751 0.63 0.65 4.11
Tri-Pack Films Limited 378,091 - - - - 378,091 36,875 64,748 0.16 0.17 1.26
10,441,988 - 492,149 169 - 10,934,306 1,571,257 1,948,106 4.81 4.98
ELECTRONIC AND ELECTRICAL EQUIPMENT -
Johnson And Phillips (Pakistan) Limited 574,324 - - - - 574,324 - 5,169 0.01 0.01 10.54
Pakistan Cables Limited 1,758,827 - - - - 1,758,827 11,872 80,203 0.20 0.21 6.18
2,333,151 - - - - 2,333,151 11,872 85,372 0.21 0.22
INDUSTRIAL ENGINEERING -
Bolan Castings Limited 405,106 - 40,510 - - 445,616 4,850 21,835 0.05 0.06 4.27
Ghandhara Industries Limited 258,577 - - - - 258,577 1,943 2,146 0.01 0.01 1.21
Hinopak Motors Limited 500,000 - - - - 500,000 55,100 57,715 0.14 0.15 4.03
K.S.B. Pumps Co. Limited 1,501,659 - - - - 1,501,659 31,742 49,314 0.12 0.13 11.38
Millat Tractors Limited 390,640 - 97,660 56 (70,747) 417,609 35,784 251,280 0.62 0.64 1.14
Taxila Engineering Company Limited 206,888 - - - - 206,888 - - - - 4.87
3,262,870 - 138,170 56 (70,747) 3,330,349 129,419 382,290 0.94 0.99
INDUSTRIAL TRANSPORTION -
Pakistan National Shipping Corporation 436,564 - - - - 436,564 4,483 10,478 0.03 0.03 0.33
Pan Islamic Steamship Company Limited 1,136 - - - - 1,136 - - - - 0.02
437,700 - - - - 437,700 4,483 10,478 0.03 0.03
SUPPORT SERVICES -
TRG Pakistan Limited - Class (A) 828,741 - - - - 828,741 1,119 2,122 0.01 0.01 0.22
828,741 - - - - 828,741 1,119 2,122 0.01 0.01
AUTO MOBILE AND PARTS -
Agriauto Industries Limited (Rs 5 / share) 1,304,660 - - - - 1,304,660 9,754 90,674 0.22 0.23 4.53
Atlas Honda Limited 167,905 - 25,185 - - 193,090 645 22,229 0.05 0.06 0.27
Baluchistan Wheels Limited 1,592,160 - - - - 1,592,160 46,173 50,790 0.13 0.13 11.94
Bela Engineering Limited 266,145 - - - - 266,145 - - - - 7.83
Exide Pakistan Limited 388,992 - - - - 388,992 15,429 85,232 0.21 0.22 6.88
The General Tyre And Rubber Company Of
Pakistan Limited 3,765,976 - - - - 3,765,976 38,225 86,994 0.21 0.22 6.30
Ghandara Nissan Limited 2,688,711 - - - - 2,688,711 8,335 8,335 0.02 0.02 5.97
Honda Atlas Cars Pakistan Limited 3,619,831 - - - - 3,619,831 36,017 36,379 0.09 0.09 2.53
Indus Motor Company Limited 710,108 36,709 - - (51,011) 695,806 78,968 153,077 0.38 0.39 0.89
Pak Suzuki Motor Company Limited 2,084,415 346,050 - - - 2,430,465 152,026 152,026 0.38 0.39 2.95
Saif Nadeem Kawasaki Motors Limited 482 - - - - 482 - - - - 0.02
NATIONAL INVESTMENT (UNIT) TRUSTINVESTMENTS - AVAILABLE FOR SALEAS AT JUNE 30, 2011
T H I R D Q U A R T E R R E P O R T M A R C H 2 0 1 1A N N U A L R E P O R T 92
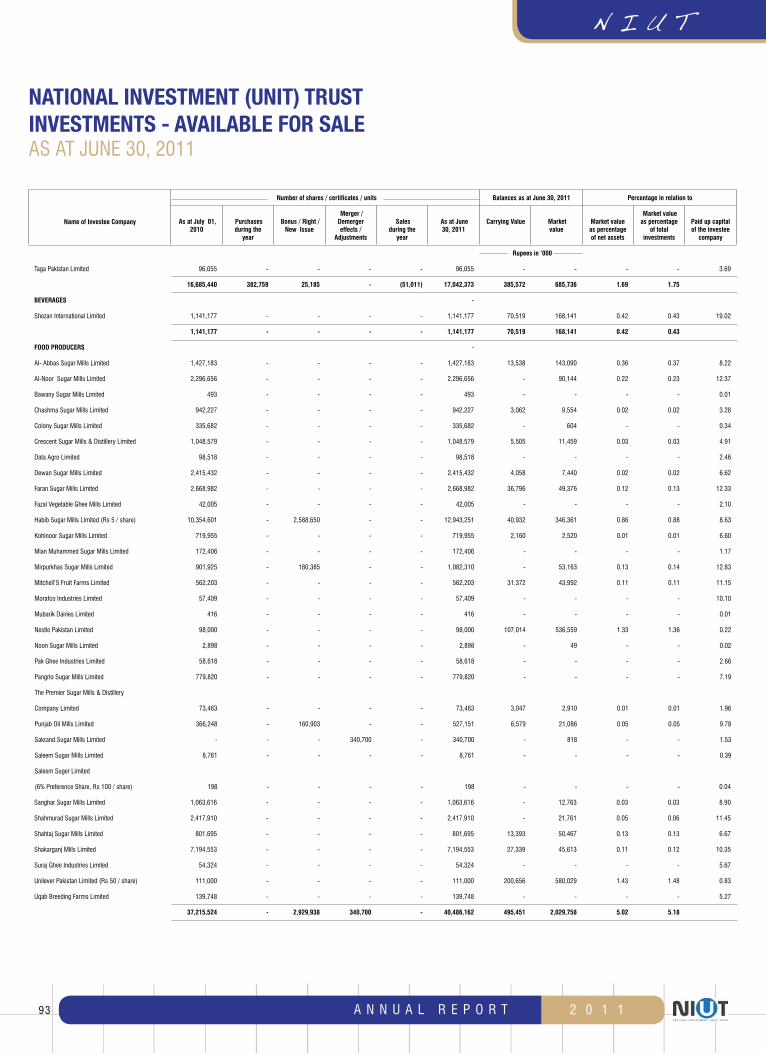
N I U T
Name of Investee Company
Number of shares / certificates / units Balances as at June 30, 2011 Percentage in relation to
As at July 01, 2010
Purchases during the
year
Bonus / Right / New Issue
Merger /Demerger effects /
Adjustments
Sales during the
year
As at June 30, 2011
Carrying Value Market value
Market value as percentage of net assets
Market value as percentage
of total investments
Paid up capital of the investee
company
Rupees in ‘000
Taga Pakistan Limited 96,055 - - - - 96,055 - - - - 3.69
16,685,440 382,759 25,185 - (51,011) 17,042,373 385,572 685,736 1.69 1.75
BEVERAGES -
Shezan International Limited 1,141,177 - - - - 1,141,177 70,519 168,141 0.42 0.43 19.02
1,141,177 - - - - 1,141,177 70,519 168,141 0.42 0.43
FOOD PRODUCERS -
Al- Abbas Sugar Mills Limited 1,427,183 - - - - 1,427,183 13,538 143,090 0.36 0.37 8.22
Al-Noor Sugar Mills Limited 2,296,656 - - - - 2,296,656 - 90,144 0.22 0.23 12.37
Bawany Sugar Mills Limited 493 - - - - 493 - - - - 0.01
Chashma Sugar Mills Limited 942,227 - - - - 942,227 3,062 9,554 0.02 0.02 3.28
Colony Sugar Mills Limited 335,682 - - - - 335,682 - 604 - - 0.34
Crescent Sugar Mills & Distillery Limited 1,048,579 - - - - 1,048,579 5,505 11,459 0.03 0.03 4.91
Data Agro Limited 98,518 - - - - 98,518 - - - - 2.46
Dewan Sugar Mills Limited 2,415,432 - - - - 2,415,432 4,058 7,440 0.02 0.02 6.62
Faran Sugar Mills Limited 2,668,982 - - - - 2,668,982 36,796 49,376 0.12 0.13 12.33
Fazal Vegetable Ghee Mills Limited 42,005 - - - - 42,005 - - - - 2.10
Habib Sugar Mills Limited (Rs 5 / share) 10,354,601 - 2,588,650 - - 12,943,251 40,932 346,361 0.86 0.88 8.63
Kohinoor Sugar Mills Limited 719,955 - - - - 719,955 2,160 2,520 0.01 0.01 6.60
Mian Muhammed Sugar Mills Limited 172,406 - - - - 172,406 - - - - 1.17
Mirpurkhas Sugar Mills Limited 901,925 - 180,385 - - 1,082,310 - 53,163 0.13 0.14 12.83
Mitchell’S Fruit Farms Limited 562,203 - - - - 562,203 31,372 43,992 0.11 0.11 11.15
Morafco Industries Limited 57,409 - - - - 57,409 - - - - 10.10
Mubarik Dairies Limited 416 - - - - 416 - - - - 0.01
Nestle Pakistan Limited 98,000 - - - - 98,000 107,014 536,559 1.33 1.36 0.22
Noon Sugar Mills Limited 2,898 - - - - 2,898 - 49 - - 0.02
Pak Ghee Industries Limited 58,618 - - - - 58,618 - - - - 2.66
Pangrio Sugar Mills Limited 779,820 - - - - 779,820 - - - - 7.19
The Premier Sugar Mills & Distillery
Company Limited 73,463 - - - - 73,463 3,047 2,910 0.01 0.01 1.96
Punjab Oil Mills Limited 366,248 - 160,903 - - 527,151 6,579 21,086 0.05 0.05 9.78
Sakrand Sugar Mills Limited - - - 340,700 - 340,700 - 818 - - 1.53
Saleem Sugar Mills Limited 8,761 - - - - 8,761 - - - - 0.39
Saleem Suger Limited
(6% Preference Share, Rs 100 / share) 198 - - - - 198 - - - - 0.04
Sanghar Sugar Mills Limited 1,063,616 - - - - 1,063,616 - 12,763 0.03 0.03 8.90
Shahmurad Sugar Mills Limited 2,417,910 - - - - 2,417,910 - 21,761 0.05 0.06 11.45
Shahtaj Sugar Mills Limited 801,695 - - - - 801,695 13,393 50,467 0.13 0.13 6.67
Shakarganj Mills Limited 7,194,553 - - - - 7,194,553 27,339 45,613 0.11 0.12 10.35
Suraj Ghee Industries Limited 54,324 - - - - 54,324 - - - - 5.67
Unilever Pakistan Limited (Rs 50 / share) 111,000 - - - - 111,000 200,656 580,029 1.43 1.48 0.83
Uqab Breeding Farms Limited 139,748 - - - - 139,748 - - - - 5.27
37,215,524 - 2,929,938 340,700 - 40,486,162 495,451 2,029,758 5.02 5.18
NATIONAL INVESTMENT (UNIT) TRUSTINVESTMENTS - AVAILABLE FOR SALEAS AT JUNE 30, 2011
T H I R D Q U A R T E R R E P O R T M A R C H2 0 1 1A N N U A L R E P O R T93
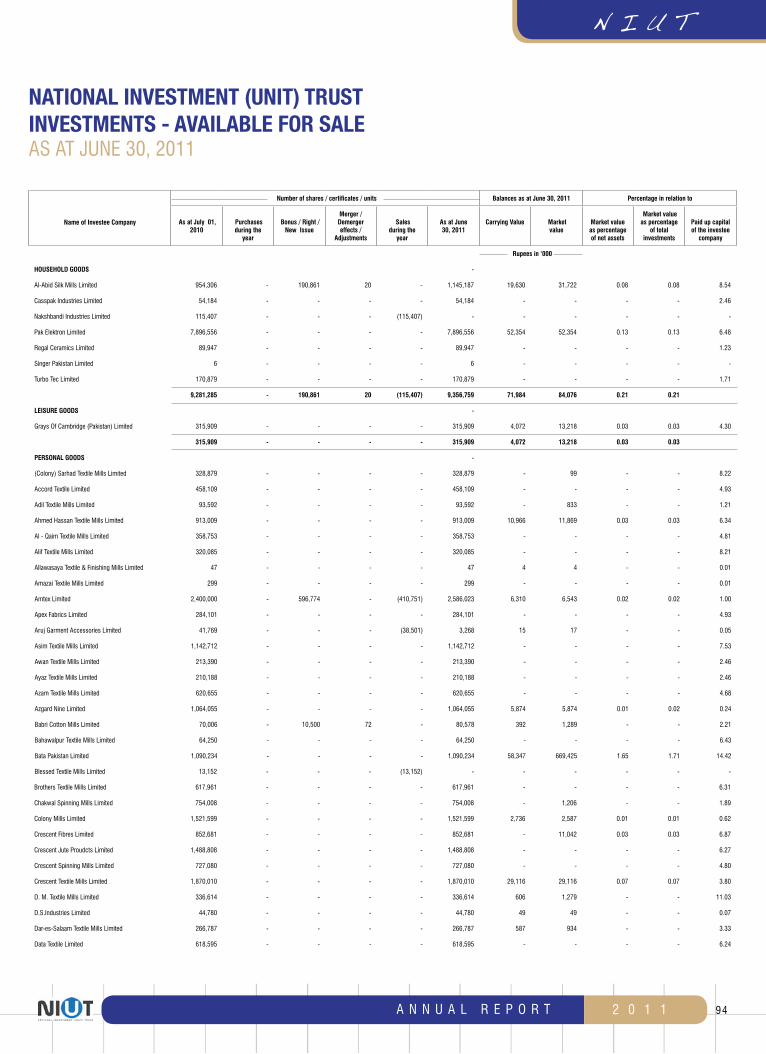
N I U T
Name of Investee Company
Number of shares / certificates / units Balances as at June 30, 2011 Percentage in relation to
As at July 01, 2010
Purchases during the
year
Bonus / Right /
New Issue
Merger / Demerger effects /
Adjustments
Sales
during the year
As at June 30, 2011
Carrying Value
Market value
Market value as percentage of net assets
Market value as percentage
of total investments
Paid up capital of the investee
company
Rupees in ‘000
HOUSEHOLD GOODS -
Al-Abid Silk Mills Limited 954,306 - 190,861 20 - 1,145,187 19,630 31,722 0.08 0.08 8.54
Casspak Industries Limited 54,184 - - - - 54,184 - - - - 2.46
Nakshbandi Industries Limited 115,407 - - - (115,407) - - - - - -
Pak Elektron Limited 7,896,556 - - - - 7,896,556 52,354 52,354 0.13 0.13 6.48
Regal Ceramics Limited 89,947 - - - - 89,947 - - - - 1.23
Singer Pakistan Limited 6 - - - - 6 - - - - -
Turbo Tec Limited 170,879 - - - - 170,879 - - - - 1.71
9,281,285 - 190,861 20 (115,407) 9,356,759 71,984 84,076 0.21 0.21
LEISURE GOODS -
Grays Of Cambridge (Pakistan) Limited 315,909 - - - - 315,909 4,072 13,218 0.03 0.03 4.30
315,909 - - - - 315,909 4,072 13,218 0.03 0.03
PERSONAL GOODS -
(Colony) Sarhad Textile Mills Limited 328,879 - - - - 328,879 - 99 - - 8.22
Accord Textile Limited 458,109 - - - - 458,109 - - - - 4.93
Adil Textile Mills Limited 93,592 - - - - 93,592 - 833 - - 1.21
Ahmed Hassan Textile Mills Limited 913,009 - - - - 913,009 10,966 11,869 0.03 0.03 6.34
Al - Qaim Textile Mills Limited 358,753 - - - - 358,753 - - - - 4.81
Alif Textile Mills Limited 320,085 - - - - 320,085 - - - - 8.21
Allawasaya Textile & Finishing Mills Limited 47 - - - - 47 4 4 - - 0.01
Amazai Textile Mills Limited 299 - - - - 299 - - - - 0.01
Amtex Limited 2,400,000 - 596,774 - (410,751) 2,586,023 6,310 6,543 0.02 0.02 1.00
Apex Fabrics Limited 284,101 - - - - 284,101 - - - - 4.93
Aruj Garment Accessories Limited 41,769 - - - (38,501) 3,268 15 17 - - 0.05
Asim Textile Mills Limited 1,142,712 - - - - 1,142,712 - - - - 7.53
Awan Textile Mills Limited 213,390 - - - - 213,390 - - - - 2.46
Ayaz Textile Mills Limited 210,188 - - - - 210,188 - - - - 2.46
Azam Textile Mills Limited 620,655 - - - - 620,655 - - - - 4.68
Azgard Nine Limited 1,064,055 - - - - 1,064,055 5,874 5,874 0.01 0.02 0.24
Babri Cotton Mills Limited 70,006 - 10,500 72 - 80,578 392 1,289 - - 2.21
Bahawalpur Textile Mills Limited 64,250 - - - - 64,250 - - - - 6.43
Bata Pakistan Limited 1,090,234 - - - - 1,090,234 58,347 669,425 1.65 1.71 14.42
Blessed Textile Mills Limited 13,152 - - - (13,152) - - - - - -
Brothers Textile Mills Limited 617,961 - - - - 617,961 - - - - 6.31
Chakwal Spinning Mills Limited 754,008 - - - - 754,008 - 1,206 - - 1.89
Colony Mills Limited 1,521,599 - - - - 1,521,599 2,736 2,587 0.01 0.01 0.62
Crescent Fibres Limited 852,681 - - - - 852,681 - 11,042 0.03 0.03 6.87
Crescent Jute Proudcts Limited 1,488,808 - - - - 1,488,808 - - - - 6.27
Crescent Spinning Mills Limited 727,080 - - - - 727,080 - - - - 4.80
Crescent Textile Mills Limited 1,870,010 - - - - 1,870,010 29,116 29,116 0.07 0.07 3.80
D. M. Textile Mills Limited 336,614 - - - - 336,614 606 1,279 - - 11.03
D.S.Industries Limited 44,780 - - - - 44,780 49 49 - - 0.07
Dar-es-Salaam Textile Mills Limited 266,787 - - - - 266,787 587 934 - - 3.33
Data Textile Limited 618,595 - - - - 618,595 - - - - 6.24
NATIONAL INVESTMENT (UNIT) TRUSTINVESTMENTS - AVAILABLE FOR SALEAS AT JUNE 30, 2011
T H I R D Q U A R T E R R E P O R T M A R C H 2 0 1 1A N N U A L R E P O R T 94

N I U T
Name of Investee Company
Number of shares / certificates / units Balances as at June 30, 2011 Percentage in relation to
As at July 01,
2010
Purchases during the
year
Bonus / Right /
New Issue
Merger / Demerger effects /
Adjustments
Sales
during the year
As at June 30, 2011
Carrying
Value
Market value
Market value as percentage of net assets
Market value as percentage
of total investments
Paid up capital of the investee
company
Rupees in ‘000
Dawood Lawrencepur Limited 234,768 - 35,215 - - 269,983 6,004 8,639 0.02 0.02 0.46
Dewan Khalid Textile Mills Limited 279,486 - - - - 279,486 307 559 - - 4.92
Dewan Mushtaq Textile Mills Limited 240,424 - - - - 240,424 481 1,080 - - 7.00
Din Textile Mills Limited 281,239 - 28,124 1 - 309,364 3,847 8,523 0.02 0.02 1.52
Ellcot Spinning Mills Limited 706,880 - - - - 706,880 7,509 16,965 0.04 0.04 6.46
Fateh Industries Limited 23,062 - - - - 23,062 - - - - 1.15
Fateh Sports Wear Limited 45,219 - - - - 45,219 - - - - 2.26
Fateh Textile Mills Limited 35,925 - - - - 35,925 3,857 3,857 0.01 0.01 2.87
Fatima Enterprises Limited 628,671 - - - - 628,671 5,468 9,619 0.02 0.02 4.42
Fazal Cloth Mills Limited 1,105,611 - - - - 1,105,611 13,415 60,753 0.15 0.16 5.89
Fazal Textile Mills Limited 67,755 - - - - 67,755 1,231 21,817 0.05 0.06 1.10
Gadoon Textile Mills Limited 1,335,356 - - - (1,335,356) - - - - - -
Ghulam Muhammad Dadabhoy Pudable 49,259 - - - - 49,259 - - - - 0.99
Globe Textile Mills Limited 65,972 - - - - 65,972 346 660 - - 0.40
Gul Ahmed Textile Mills Limited 527,681 - - - - 527,681 9,778 27,297 0.07 0.07 1.52
Gulistan Spinning Mills Limited 292,085 - - - - 292,085 1,129 2,337 0.01 0.01 1.99
Gulistan Textile Mills Limited 734,617 - - - - 734,617 6,011 13,664 0.03 0.03 3.87
Gulshan Spinning Mills Limited 1,002,804 - 200,560 110 - 1,203,474 4,558 13,238 0.03 0.03 5.41
Hafiz Textile Mills Limited 85 - - - - 85 - 2 - - 0.01
Hajra Textile Mills Limited 518,063 - - - - 518,063 - - - - 3.77
Hakkim Textile Mills Limited 257,368 - - - - 257,368 - - - - 4.77
Harum Textile Mills Limited 58,248 - - - - 58,248 - - - - 0.62
I. C. C. Textiles Limited 164,870 - - - - 164,870 176 196 - - 0.55
Ibrahim Fibres Limited 1,800,000 - - - - 1,800,000 53,658 75,996 0.19 0.19 0.58
Ideal Spinning Mills Limited 658,396 - - - - 658,396 922 2,772 0.01 0.01 6.64
Indus Dyeing & Manufacturing Company Limited 525,295 - - - - 525,295 5,509 200,384 0.50 0.51 2.91
Indus Polyester Company Limited
(Under winding up through court) 4 - - - - 4 - - - - -
International Knitwear Limited 119,144 - - - - 119,144 - 626 - - 3.69
Ishaq Textile Mills Limited 443,946 - - - - 443,946 919 2,641 0.01 0.01 4.60
Itti Textile Mills Limited 163,151 - - - - 163,151 - - - - 2.46
J. A. Textile Mills Limited 677,361 - - - - 677,361 - - - - 5.38
J. K. Spinning Mills Limited 324,568 - 16,228 - - 340,796 373 2,420 0.01 0.01 1.85
Junaid Cotton Mills Limited 37,436 - - - - 37,436 - - - - 1.50
Kaiser Arts & Krafts Mills Limited 36,944 - - - - 36,944 - - - - 0.43
Karim Cotton Mills Limited 110,562 - - - - 110,562 - - - - 9.34
Karim Silk Mills Limited 19,223 - - - - 19,223 - - - - 1.97
Khalid Siraj Textile Mills Limited 700,498 - - - - 700,498 - - - - 6.55
Kohinoor Industries Limited 334,468 - - - - 334,468 - 368 - - 1.10
Kohinoor Looms Limited 169,648 - - - - 169,648 - - - - 1.57
Kohinoor Mills Limited 2,859,830 - - - - 2,859,830 3,003 3,003 0.01 0.01 5.62
Kohinoor Spinning Mills Limited 602,327 - - - - 602,327 - 958 - - 0.46
Kohinoor Textile Mills Limited 3,161,234 - - - - 3,161,234 12487 12487 0.03 0.03 1.29
Land Mark Spinning Industries Limited 447,937 - - - - 447,937 - - - - 3.69
NATIONAL INVESTMENT (UNIT) TRUSTINVESTMENTS - AVAILABLE FOR SALEAS AT JUNE 30, 2011
T H I R D Q U A R T E R R E P O R T M A R C H2 0 1 1A N N U A L R E P O R T95
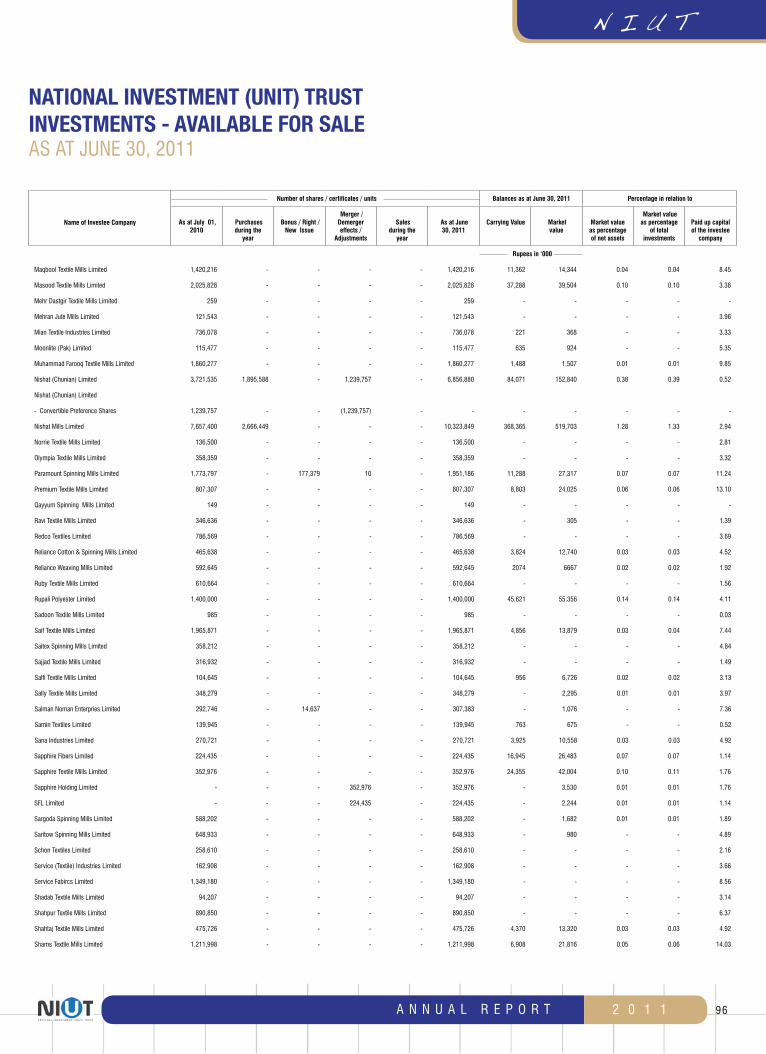
N I U T
Name of Investee Company
Number of shares / certificates / units Balances as at June 30, 2011 Percentage in relation to
As at July 01, 2010
Purchases during the
year
Bonus / Right / New Issue
Merger /Demerger effects /
Adjustments
Sales during the
year
As at June 30, 2011
Carrying Value Market value
Market value as percentage of net assets
Market value as percentage
of total investments
Paid up capital of the investee
company
Rupees in ‘000
Maqbool Textile Mills Limited 1,420,216 - - - - 1,420,216 11,362 14,344 0.04 0.04 8.45
Masood Textile Mills Limited 2,025,828 - - - - 2,025,828 37,288 39,504 0.10 0.10 3.38
Mehr Dastgir Textile Mills Limited 259 - - - - 259 - - - - -
Mehran Jute Mills Limited 121,543 - - - - 121,543 - - - - 3.96
Mian Textile Industries Limited 736,078 - - - - 736,078 221 368 - - 3.33
Moonlite (Pak) Limited 115,477 - - - - 115,477 635 924 - - 5.35
Muhammad Farooq Textile Mills Limited 1,860,277 - - - - 1,860,277 1,488 1,507 0.01 0.01 9.85
Nishat (Chunian) Limited 3,721,535 1,895,588 - 1,239,757 - 6,856,880 84,071 152,840 0.38 0.39 0.52
Nishat (Chunian) Limited
- Convertible Preference Shares 1,239,757 - - (1,239,757) - - - - - - -
Nishat Mills Limited 7,657,400 2,666,449 - - - 10,323,849 368,365 519,703 1.28 1.33 2.94
Norrie Textile Mills Limited 136,500 - - - - 136,500 - - - - 2.81
Olympia Textile Mills Limited 358,359 - - - - 358,359 - - - - 3.32
Paramount Spinning Mills Limited 1,773,797 - 177,379 10 - 1,951,186 11,288 27,317 0.07 0.07 11.24
Premium Textile Mills Limited 807,307 - - - - 807,307 8,803 24,025 0.06 0.06 13.10
Qayyum Spinning Mills Limited 149 - - - - 149 - - - - -
Ravi Textile Mills Limited 346,636 - - - - 346,636 - 305 - - 1.39
Redco Textiles Limited 786,569 - - - - 786,569 - - - - 3.69
Reliance Cotton & Spinning Mills Limited 465,638 - - - - 465,638 3,824 12,740 0.03 0.03 4.52
Reliance Weaving Mills Limited 592,645 - - - - 592,645 2074 6667 0.02 0.02 1.92
Ruby Textile Mills Limited 610,664 - - - - 610,664 - - - - 1.56
Rupali Polyester Limited 1,400,000 - - - - 1,400,000 45,621 55,356 0.14 0.14 4.11
Sadoon Textile Mills Limited 985 - - - - 985 - - - - 0.03
Saif Textile Mills Limited 1,965,871 - - - - 1,965,871 4,856 13,879 0.03 0.04 7.44
Saitex Spinning Mills Limited 358,212 - - - - 358,212 - - - - 4.84
Sajjad Textile Mills Limited 316,932 - - - - 316,932 - - - - 1.49
Salfi Textile Mills Limited 104,645 - - - - 104,645 956 6,726 0.02 0.02 3.13
Sally Textile Mills Limited 348,279 - - - - 348,279 - 2,295 0.01 0.01 3.97
Salman Noman Enterpries Limited 292,746 - 14,637 - - 307,383 - 1,076 - - 7.36
Samin Textiles Limited 139,945 - - - - 139,945 763 675 - - 0.52
Sana Industries Limited 270,721 - - - - 270,721 3,925 10,558 0.03 0.03 4.92
Sapphire Fibers Limited 224,435 - - - - 224,435 16,945 26,483 0.07 0.07 1.14
Sapphire Textile Mills Limited 352,976 - - - - 352,976 24,355 42,004 0.10 0.11 1.76
Sapphire Holding Limited - - - 352,976 - 352,976 - 3,530 0.01 0.01 1.76
SFL Limited - - - 224,435 - 224,435 - 2,244 0.01 0.01 1.14
Sargoda Spinning Mills Limited 588,202 - - - - 588,202 - 1,682 0.01 0.01 1.89
Saritow Spinning Mills Limited 648,933 - - - - 648,933 - 980 - - 4.89
Schon Textiles Limited 258,610 - - - - 258,610 - - - - 2.16
Service (Textile) Industries Limited 162,908 - - - - 162,908 - - - - 3.66
Service Fabircs Limited 1,349,180 - - - - 1,349,180 - - - - 8.56
Shadab Textile Mills Limited 94,207 - - - - 94,207 - - - - 3.14
Shahpur Textile Mills Limited 890,850 - - - - 890,850 - - - - 6.37
Shahtaj Textile Mills Limited 475,726 - - - - 475,726 4,370 13,320 0.03 0.03 4.92
Shams Textile Mills Limited 1,211,998 - - - - 1,211,998 6,908 21,816 0.05 0.06 14.03
NATIONAL INVESTMENT (UNIT) TRUSTINVESTMENTS - AVAILABLE FOR SALEAS AT JUNE 30, 2011
T H I R D Q U A R T E R R E P O R T M A R C H 2 0 1 1A N N U A L R E P O R T 96

N I U T
Name of Investee Company
Number of shares / certificates / units Balances as at June 30, 2011 Percentage in relation to
As at July 01, 2010
Purchases during the
year
Bonus / Right / New Issue
Merger /Demerger effects /
Adjustments
Sales during the
year
As at June 30, 2011
Carrying Value Market value
Market value as percentage of net assets
Market value as percentage
of total investments
Paid up capital of the investee
company
Rupees in ‘000
Siftaq International Limited 108,222 - - - - 108,222 - - - - 3.59
Sind Fine Textile Mills Limited 78,011 - - - - 78,011 - - - - 2.28
Sunrays Textile Mills Limited 271,565 - - - - 271,565 2,741 9,233 0.02 0.02 3.94
Sunshine Cotton Mills Limited 426,521 - - - - 426,521 - - - - 5.43
Suraj Cotton Mills Limited 389,555 - - - - 389,555 4,947 14,394 0.03 0.03 2.16
Taj Textile Mills Limited 1,409,947 - - - - 1,409,947 - 423 - - 4.22
Tariq Cotton Mills Limited 43,100 - - - - 43,100 - - - - 6.16
Tata Textile Mills Limited 2,094,285 - - - - 2,094,285 18,725 67,017 0.17 0.17 12.09
Tawakkal Garments Industries Limited 118,664 - - - - 118,664 - - - - -
Tawakkal Limited 113,264 - - - - 113,264 - - - - 0.81
Treet Corporation Limited 3,550,640 - - - - 3,550,640 8,280 184,704 0.46 0.47 8.49
Tri-Star Polyester Limited 629,772 - - - - 629,772 - - - - 2.93
Yousuf Weaving Mills Limited 1,188,621 - - - - 1,188,621 1,248 1,426 0.01 0.01 2.97
Zahur Cotton Mills Limited 485,694 - - - - 485,694 - - - - 4.93
Zahur Textile Mills Limited 412,147 - - - - 412,147 - - - - 0.55
Zil Limited 340,859 - - - - 340,859 4,865 20,175 0.04 0.05 6.40
88,527,490 4,562,037 1,079,417 577,604 (1,797,760) 92,948,788 934,914 2,533,267 6.26 6.47
TOBACCO -
Pakistan Tobacco Company Limited 1,807,339 - - - - 1,807,339 131,665.00 174,806 0.43 0.45 0.71
1,807,339 - - - - 1,807,339 131,665 174,806 0.43 0.45
HEALTH CARE EQUIPMENT AND SERVICES -
Medi Glass Limited 295,554 - - - - 295,554 - - - - 3.89
295,554 - - - - 295,554 - - - -
PHARMA AND BIO TECH -
Abbot Laboatories (Pakistan) Limited 2,593,029 - - - - 2,593,029 207,961.00 242,422 0.60 0.62 2.65
Ferozsons Laboratories Limited 1,186,216 - 237,243 - - 1,423,459 1,877.00 133,805 0.33 0.34 5.69
Glaxosmithkline Pakistan Limited 6,335,730 - 950,359 1 - 7,286,090 481,135 559,572 1.38 1.43 3.61
Highnoon Laboratories Limited 320,625 - 32,062 1 - 352,688 3,639 11,335 0.03 0.03 1.94
IBL Health Care Limited 295,437 - - - - 295,437 - 2,807 0.01 0.01 1.48
Otsuka Pakistan Limited 105,217 - - - (25,111) 80,106 1,231 2,603 0.01 0.01 0.80
Sanofi-Aventis Limited 229,461 - - - - 229,461 21,056 33,733 0.08 0.08 2.38
Searle Pakistan Limited 904,749 - - - - 904,749 21,204 49,173 0.12 0.13 2.95
Wyeth Pakistan Limited (Rs 100 / share) 111,574 - - - - 111,574 43,913 110,124 0.27 0.28 7.85
12,082,038 - 1,219,664 2 (25,111) 13,276,593 782,016 1,145,574 2.83 2.93
MEDIA -
Eye Television Network Limited 9,159 - - - (9,159) - - - - - -
9,159 - - - (9,159) - - - - -
TRAVEL AND LEISURE -
Pakistan Services Limited 893,795 - - - - 893,795 101,044 127,366 0.31 0.33 2.75
893,795 - - - - 893,795 101,044 127,366 0.31 0.33
FIXED LINE TELECOMMUNICATION -
Pak Datacom Limited 143,119 - - - - 143,119 2,538 4,291 0.01 0.01 1.83
Pakistan Telecommunication Company Limited 7,374,384 - - - - 7,374,384 104,864 104,864 0.26 0.27 0.20
Wateen Telecom Limited 3,500,000 - - - - 3,500,000 7,280 7,280 0.02 0.02 0.57
11,017,503 - - - - 11,017,503 114,682 116,435 0.29 0.30
NATIONAL INVESTMENT (UNIT) TRUSTINVESTMENTS - AVAILABLE FOR SALEAS AT JUNE 30, 2011
T H I R D Q U A R T E R R E P O R T M A R C H2 0 1 1A N N U A L R E P O R T97

N I U T
Name of Investee Company
Number of shares / certificates / units Balances as at June 30, 2011 Percentage in relation to
As at July 01, 2010
Purchases during the
year
Bonus / Right / New Issue
Merger /Demerger effects /
Adjustments
Sales during the
year
As at June 30, 2011
Carrying Value Market value
Market value as percentage of net assets
Market value as percentage
of total investments
Paid up capital of the investee
company
Rupees in ‘000
ELECTRICITY -
The Hub Power Company Limited 14,710,605 350,000 - - (250,000) 14,810,605 215,385 555,398 1.38 1.41 1.28
Karachi Electric Supply Company
Limited (Rs 3.5 / share) 5,667,614 - - - - 5,667,614 11,732 12,185 0.03 0.03 0.03
Kohinoor Energy Limited 410,390 - - - - 410,390 6,771 6,771 0.02 0.02 0.24
Kohinoor Power Company Limited 290,160 - - - - 290,160 795 795 - - 2.30
Kot Addu Power Company Limited 1,231,503 - - - - 1,231,503 38,866 52,474 0.12 0.13 0.14
Nishat Chunian Power Limited 3,000,000 - - - - 3,000,000 30,000 41,160 0.10 0.11 0.82
S. G. Power Limited 323,376 - - - - 323,376 194 291 - - 1.81
Sitara Energy Limited 256,117 - - - - 256,117 4,354 5,058 0.02 0.02 1.34
25,889,765 350,000 - - (250,000) 25,989,765 308,097 674,132 1.67 1.72
GAS WATER AND MULTIUTILITIES -
Sui Northern Gas Pipelines Limited 16,894,303 - - - - 16,894,303 109,282 336,535 0.83 0.86 3.08
Sui Southern Gas Company Limited 10,069,822 - 2,517,455 - - 12,587,277 105,834 272,766 0.68 0.70 1.50
26,964,125 - 2,517,455 - - 29,481,580 215,116 609,301 1.51 1.56
BANKS -
Allied Bank Limited 1,590,381 195,411 168,579 - (100,000) 1,854,371 49,231 118,939 0.29 0.30 0.22
Askari Bank Limited 22,097,586 825,000 2,292,258 897 - 25,215,741 235,452 274,347 0.68 0.70 3.57
Atlas Bank Limited 16,766,336 - - (16,766,336) - - - - - - -
Bank Al - Habib Limited 62,974,317 - 12,594,863 201 - 75,569,381 1,023,632 2,227,030 5.50 5.69 8.60
Bank Alfalah Limited - 10,185,631 - - - 10,185,631 104,848 97,476 0.24 0.25 0.75
Bank Islami Pakistan Limited 599,368 - - - - 599,368 1,924 2,038 0.01 0.01 0.11
Faysal Bank Limited 8,721,298 - 1,744,260 116 - 10,465,674 84,422 96,912 0.24 0.25 1.43
Habib Bank Limited 847,846 424,620 91,427 1 - 1,363,894 99,905 158,294 0.39 0.40 0.12
Habib Metropolitan Bank Limited 58,178,084 - 11,635,616 1,041 - 69,814,741 1,056,392 1,519,867 3.75 3.88 6.66
JS Bank Limited 21,025,241 700,000 6,938,329 - - 28,663,570 69,366 69,366 0.17 0.18 3.52
KASB Bank Limited 1,836,797 - - - - 1,836,797 2,461 2,553 0.01 0.01 0.19
MCB Bank Limited 345,414 251,940 37,585 - (221,500) 413,439 77,653 82,398 0.20 0.21 0.05
National Bank Of Pakistan 5,629,646 1,405,000 1,758,661 1 - 8,793,308 294,879 443,359 1.10 1.13 0.52
NIB Bank Limited 10,608,990 - - - - 10,608,990 16,020 16,020 0.04 0.04 0.26
Samba Bank Limited 10,452,500 - - - - 10,452,500 17,874 17,874 0.04 0.05 0.73
Silkbank Limited 12,524,877 - - - - 12,524,877 26,177 31,688 0.08 0.08 0.34
Soneri Bank Limited 68,757,730 - 22,865,906 - - 91,623,636 464,512 464,512 1.15 1.19 15.21
Summit Bank Limited 842,013 - - 7,544,851 - 8,386,864 24,406 31,535 0.08 0.08 1.16
United Bank Limited 1,228,134 991,090 - - (484,000) 1,735,224 81,838 107,428 0.27 0.27 0.14
305,026,558 14,978,692 60,127,484 (9,219,228) (805,500) 370,108,006 3,730,992 5,761,636 14.24 14.72
NON LIFE INSURANCE -
Union Insurance Company Of Pakistan Limited 306 - - - - 306 - 8 - - -
306 - - - - 306 - 8 - -
REAL STATE INVESTMENT AND SERVICES -
Pace (Pakistan) Limited 525,716 - - - - 525,716 1,146 1,146 0.01 0.01 0.19
525,716 - - - - 525,716 1,146 1,146 0.01 0.01
NATIONAL INVESTMENT (UNIT) TRUSTINVESTMENTS - AVAILABLE FOR SALEAS AT JUNE 30, 2011
T H I R D Q U A R T E R R E P O R T M A R C H 2 0 1 1A N N U A L R E P O R T 98
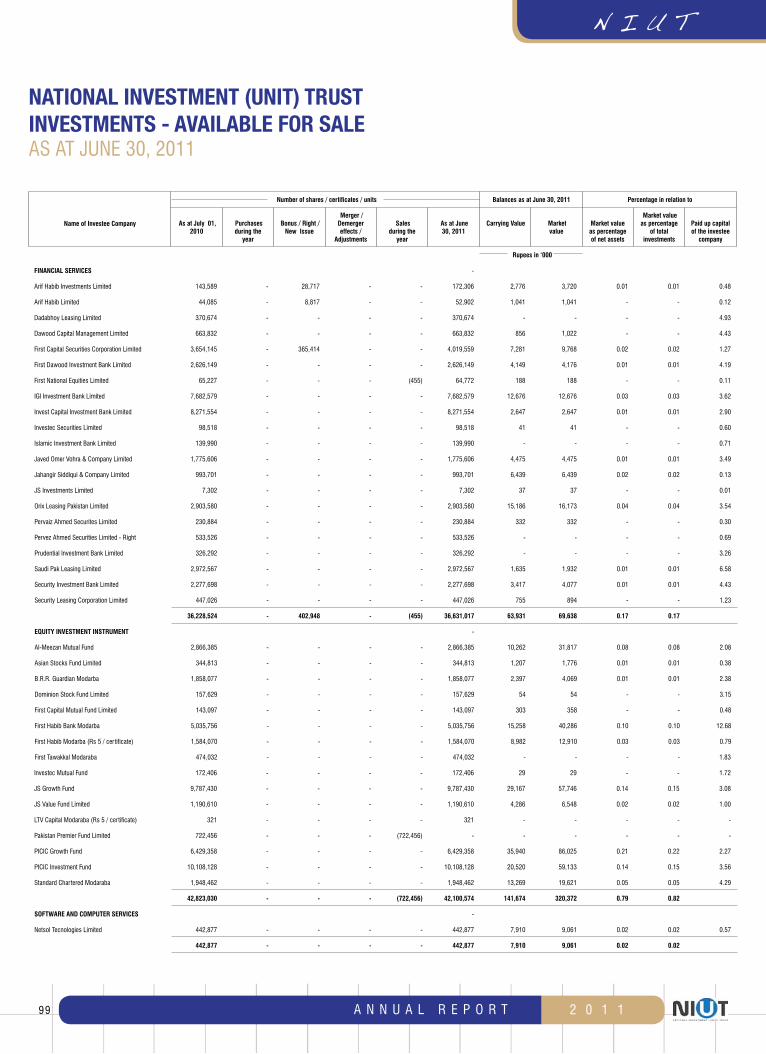
N I U T
Name of Investee Company
Number of shares / certificates / units Balances as at June 30, 2011 Percentage in relation to
As at July 01, 2010
Purchases during the
year
Bonus / Right / New Issue
Merger /Demerger effects /
Adjustments
Sales during the
year
As at June 30, 2011
Carrying Value Market value
Market value as percentage of net assets
Market value as percentage
of total investments
Paid up capital of the investee
company
Rupees in ‘000
FINANCIAL SERVICES -
Arif Habib Investments Limited 143,589 - 28,717 - - 172,306 2,776 3,720 0.01 0.01 0.48
Arif Habib Limited 44,085 - 8,817 - - 52,902 1,041 1,041 - - 0.12
Dadabhoy Leasing Limited 370,674 - - - - 370,674 - - - - 4.93
Dawood Capital Management Limited 663,832 - - - - 663,832 856 1,022 - - 4.43
First Capital Securities Corporation Limited 3,654,145 - 365,414 - - 4,019,559 7,281 9,768 0.02 0.02 1.27
First Dawood Investment Bank Limited 2,626,149 - - - - 2,626,149 4,149 4,176 0.01 0.01 4.19
First National Equities Limited 65,227 - - - (455) 64,772 188 188 - - 0.11
IGI Investment Bank Limited 7,682,579 - - - - 7,682,579 12,676 12,676 0.03 0.03 3.62
Invest Capital Investment Bank Limited 8,271,554 - - - - 8,271,554 2,647 2,647 0.01 0.01 2.90
Investec Securities Limited 98,518 - - - - 98,518 41 41 - - 0.60
Islamic Investment Bank Limited 139,990 - - - - 139,990 - - - - 0.71
Javed Omer Vohra & Company Limited 1,775,606 - - - - 1,775,606 4,475 4,475 0.01 0.01 3.49
Jahangir Siddiqui & Company Limited 993,701 - - - - 993,701 6,439 6,439 0.02 0.02 0.13
JS Investments Limited 7,302 - - - - 7,302 37 37 - - 0.01
Orix Leasing Pakistan Limited 2,903,580 - - - - 2,903,580 15,186 16,173 0.04 0.04 3.54
Pervaiz Ahmed Securites Limited 230,884 - - - - 230,884 332 332 - - 0.30
Pervez Ahmed Securities Limited - Right 533,526 - - - - 533,526 - - - - 0.69
Prudential Investment Bank Limited 326,292 - - - - 326,292 - - - - 3.26
Saudi Pak Leasing Limited 2,972,567 - - - - 2,972,567 1,635 1,932 0.01 0.01 6.58
Security Investment Bank Limited 2,277,698 - - - - 2,277,698 3,417 4,077 0.01 0.01 4.43
Security Leasing Corporation Limited 447,026 - - - - 447,026 755 894 - - 1.23
36,228,524 - 402,948 - (455) 36,631,017 63,931 69,638 0.17 0.17
EQUITY INVESTMENT INSTRUMENT -
Al-Meezan Mutual Fund 2,866,385 - - - - 2,866,385 10,262 31,817 0.08 0.08 2.08
Asian Stocks Fund Limited 344,813 - - - - 344,813 1,207 1,776 0.01 0.01 0.38
B.R.R. Guardian Modarba 1,858,077 - - - - 1,858,077 2,397 4,069 0.01 0.01 2.38
Dominion Stock Fund Limited 157,629 - - - - 157,629 54 54 - - 3.15
First Capital Mutual Fund Limited 143,097 - - - - 143,097 303 358 - - 0.48
First Habib Bank Modarba 5,035,756 - - - - 5,035,756 15,258 40,286 0.10 0.10 12.68
First Habib Modarba (Rs 5 / certificate) 1,584,070 - - - - 1,584,070 8,982 12,910 0.03 0.03 0.79
First Tawakkal Modaraba 474,032 - - - - 474,032 - - - - 1.83
Investec Mutual Fund 172,406 - - - - 172,406 29 29 - - 1.72
JS Growth Fund 9,787,430 - - - - 9,787,430 29,167 57,746 0.14 0.15 3.08
JS Value Fund Limited 1,190,610 - - - - 1,190,610 4,286 6,548 0.02 0.02 1.00
LTV Capital Modaraba (Rs 5 / certificate) 321 - - - - 321 - - - - -
Pakistan Premier Fund Limited 722,456 - - - (722,456) - - - - - -
PICIC Growth Fund 6,429,358 - - - - 6,429,358 35,940 86,025 0.21 0.22 2.27
PICIC Investment Fund 10,108,128 - - - - 10,108,128 20,520 59,133 0.14 0.15 3.56
Standard Chartered Modaraba 1,948,462 - - - - 1,948,462 13,269 19,621 0.05 0.05 4.29
42,823,030 - - - (722,456) 42,100,574 141,674 320,372 0.79 0.82
SOFTWARE AND COMPUTER SERVICES -
Netsol Tecnologies Limited 442,877 - - - - 442,877 7,910 9,061 0.02 0.02 0.57
442,877 - - - - 442,877 7,910 9,061 0.02 0.02
NATIONAL INVESTMENT (UNIT) TRUSTINVESTMENTS - AVAILABLE FOR SALEAS AT JUNE 30, 2011
T H I R D Q U A R T E R R E P O R T M A R C H2 0 1 1A N N U A L R E P O R T99

N I U T
Name of Investee Company
Number of shares / certificates / units Balances as at June 30, 2011 Percentage in relation to
As at July 01, 2010
Purchases during the
year
Bonus / Right / New Issue
Merger /Demerger effects /
Adjustments
Sales during the
year
As at June 30, 2011
Carrying Value Market value
Market value as percentage of net assets
Market value as percentage
of total investments
Paid up capital of the investee
company
Rupees in ‘000
TECHNOLOGY HARDWARE AND EQUIPMENT -
Pakistan Telephone Cables Limited 91,424 - - - - 91,424 149 323 - - 0.44
91,424 - - - - 91,424 149 323 - -
DELISTED / UNQUOTED COMPANIES
Adamjee Floorings 59,110 - - - - 59,110 - - - - -
Adamjee Industries 121 - - - - 121 - - - - -
Adamjee Paper 269,806 - - - - 269,806 - - - - -
Afsar Textile Mills Limited 64,184 - - - - 64,184 - - - - -
Al-Hussany Industries Limited 61,573 - - - - 61,573 - - - - 2.46
Arag Industries Limited 189,220 - - - - 189,220 - - - - -
Aslo Electronics 39,407 - - - - 39,407 - - - - -
Aswan Tentage Limited 168,712 - - - - 168,712 - - - - -
Balochistan Tower 74,114 - - - - 74,114 - - - - -
Bankers Equity Limited (under winding
up through court) 3,408,091 - - - - 3,408,091 - - - - -
Bawany Textile Mills Limited 84,233 - - - - 84,233 - - - - -
Central Cotton Limited 34,948 - - - - 34,948 - - - - -
Chilya C. Board 43,200 - - - - 43,200 - - - - -
Crescent Knitwear Limited 81,277 - - - - 81,277 - - - - -
Crown Textile Limited 317,647 - - - - 317,647 - - - - -
Ghaffar Textile Mills Limited 45,835 - - - - 45,835 - - - - -
Greaves Aircondition 59,110 - - - - 59,110 - - - - -
Gypsum Corporation 165,017 - - - - 165,017 - - - - -
H-Shaikh 113,022 - - - - 113,022 - - - - -
Hyderabad Electronic 98,518 - - - - 98,518 - - - - -
Indus Bank Limited 147 - - - - 147 - - - - -
Industrial Development Bank Of Pakistan Limited 1,970 - - - - 1,970 - - - - -
Innovative Investment Bank Limited 35,227 - - - - 35,227 - 352 - - 0.35
Karachi Pipe 156,102 - - - - 156,102 - - - - -
Kohinoor Cotton Limited 62,553 - - - - 62,553 - - - - -
Lafayette Industries Synthetics Limited 92,360 - - - - 92,360 - - - - 2.59
Marr Fabrics Limited 118,221 - - - - 118,221 - - - - 4.93
Mehran Bank Limited 738,590 - - - - 738,590 - - - - -
Mohib Textile Mills Limited 159,813 - - - - 159,813 - - - - 1.33
National Construction Overseas 24,629 - - - - 24,629 - - - - -
National Match Industries 26,452 - - - - 26,452 - - - - -
Naveed Textile Mills Limited 70,637 - - - - 70,637 - - - - 3.62
Nowshera Engineering 26,057 - - - - 26,057 - - - - -
Nusrat Textile Mills Limited 306,342 - - - - 306,342 - - - - -
Pak Paper Corporation 103,848 - - - - 103,848 - - - - -
Pearl Fabrics 229,970 - - - - 229,970 - - - - -
Premier Board 29,998 - - - - 29,998 - - - - -
Punjab Building 443,845 - - - - 443,845 - - - - -
Punjab Cotton 56,155 - - - - 56,155 - - - - -
NATIONAL INVESTMENT (UNIT) TRUSTINVESTMENTS - AVAILABLE FOR SALEAS AT JUNE 30, 2011
T H I R D Q U A R T E R R E P O R T M A R C H 2 0 1 1A N N U A L R E P O R T 100
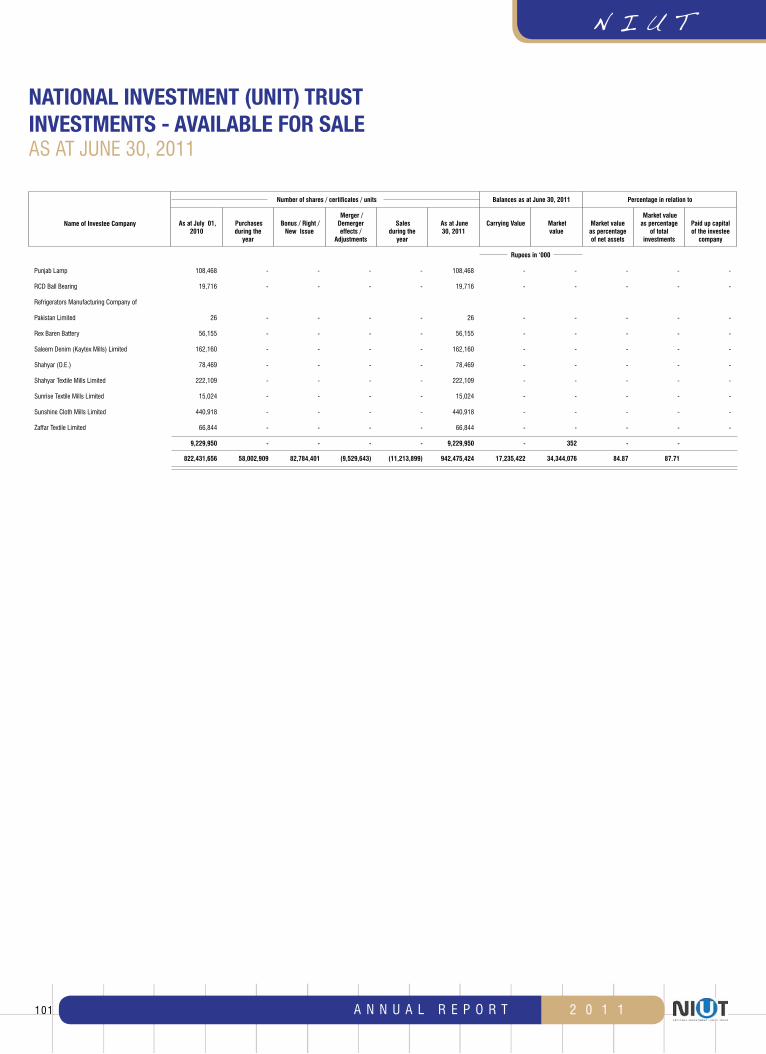
N I U T
Name of Investee Company
Number of shares / certificates / units Balances as at June 30, 2011 Percentage in relation to
As at July 01, 2010
Purchases during the
year
Bonus / Right / New Issue
Merger /Demerger effects /
Adjustments
Sales during the
year
As at June 30, 2011
Carrying Value Market value
Market value as percentage of net assets
Market value as percentage
of total investments
Paid up capital of the investee
company
Rupees in ‘000
Punjab Lamp 108,468 - - - - 108,468 - - - - -
RCD Ball Bearing 19,716 - - - - 19,716 - - - - -
Refrigerators Manufacturing Company of
Pakistan Limited 26 - - - - 26 - - - - -
Rex Baren Battery 56,155 - - - - 56,155 - - - - -
Saleem Denim (Kaytex Mills) Limited 162,160 - - - - 162,160 - - - - -
Shahyar (O.E.) 78,469 - - - - 78,469 - - - - -
Shahyar Textile Mills Limited 222,109 - - - - 222,109 - - - - -
Sunrise Textile Mills Limited 15,024 - - - - 15,024 - - - - -
Sunshine Cloth Mills Limited 440,918 - - - - 440,918 - - - - -
Zaffar Textile Limited 66,844 - - - - 66,844 - - - - -
9,229,950 - - - - 9,229,950 - 352 - -
822,431,656 58,002,909 82,784,401 (9,529,643) (11,213,899) 942,475,424 17,235,422 34,344,076 84.87 87.71
NATIONAL INVESTMENT (UNIT) TRUSTINVESTMENTS - AVAILABLE FOR SALEAS AT JUNE 30, 2011
T H I R D Q U A R T E R R E P O R T M A R C H2 0 1 1A N N U A L R E P O R T101

N I U T
MARKET TREASURY BILLS
Issue Date Tenor Face Value Balance as at June 30, 2011 Market value as a percentage of net
assets
Market value as a percentage of total
investments As at July 1, 2010 Purchases during the year
Sales / matured during the year
As at June 30, 2011
Carrying Value Market Value Appreciation / (Diminution)
Rupees in ‘000
Market Treasury Bills
June 2, 2011 3 Months - 1,000,000,000 - 1,000,000,000 980,488 979,843 (645) 2.42% 2.50%
May 19, 2011 3 Months - 400,000,000 - 400,000,000 394,227 393,941 (286) 0.97% 1.01%
May 5, 2011 3 Months - 1,399,000,000 - 1,399,000,000 1,385,677 1,384,844 (833) 3.42% 3.54%
April 21, 2011 3 Months - 75,000,000 - 75,000,000 74,657 74,620 (37) 0.18% 0.19%
April 7, 2011 3 Months - 200,000,000 200,000,000 - - - - - -
March 24, 2011 3 Months - 50,000,000 50,000,000 - - - - - -
March 10, 2011 3 Months - 150,000,000 150,000,000 - - - - - -
June 17, 2010 12 Months - 360,000,000 360,000,000 - - - - - -
February 24, 2011 3 Months - 200,000,000 200,000,000 - - - - - -
February 10, 2011 3 Months - 375,000,000 375,000,000 - - - - - -
December 30, 2010 3 Months - 1,137,500,000 1,137,500,000 - - - - - -
October 7, 2010 3 Months - 1,295,000,000 1,295,000,000 - - - - - -
September 26, 2009 12 Months - 750,000,000 750,000,000 - - - - - -
Total 7,391,500,000 4,517,500,000 2,874,000,000 2,835,049 2,833,248 (1,801) 7.00% 7.24%
NATIONAL INVESTMENT (UNIT) TRUSTINVESTMENTS - AVAILABLE FOR SALEAS AT JUNE 30, 2011
T H I R D Q U A R T E R R E P O R T M A R C H 2 0 1 1A N N U A L R E P O R T 102

N I U T
S. No Name At cost % age of net assets
Opening Redemptions during the year Closing
Rupees in ‘000
Investment under Morabaha Arrangements
1 Textile Management (Private) Limited 4,125 - 4,125 0.01%
2 Pak China Fertilizers Limited 27,000 - 27,000 0.06%
3 Quaidabad Woolen Mills Limited 23,000 - 23,000 0.06%
Sub-total 54,125 - 54,125 0.13%
Less : Provision for impairment loss (54,125) - (54,125) -0.13%
- - - -
Participation Term Certificates
1 Adamjee Paper & Board Mills Limited 10,500 - 10,500 0.03%
Less : Provision for impairment loss (10,500) - (10,500) -0.03%
- - - -
Term Finance Certificates and Redeemable Capital
1 Adamjee Paper & Board Mills Limited 8,125 - 8,125 0.02%
2 Brothers Steel Mills Limited 1,959 - 1,959 0.00%
3 Naimat Basal Oil & Gas Securitization Company Limited
2 - 2 0.00%
4 Pakistan Telecommunication Limited (PTC) / BEL
2,819 - 2,819 0.01%
Sub-total 12,905 - 12,905 0.03%
Less : Provision for impairment loss (12,905) - (12,905) -0.03%
- - - -
Total 77,530 - 77,530 0.19%
Less: Provision for impairment (77,530) - (77,530) -0.19%
- - - -
NATIONAL INVESTMENT (UNIT) TRUSTINVESTMENTS - HELD TO MATURITYAS AT JUNE 30, 2011
T H I R D Q U A R T E R R E P O R T M A R C H2 0 1 1A N N U A L R E P O R T103
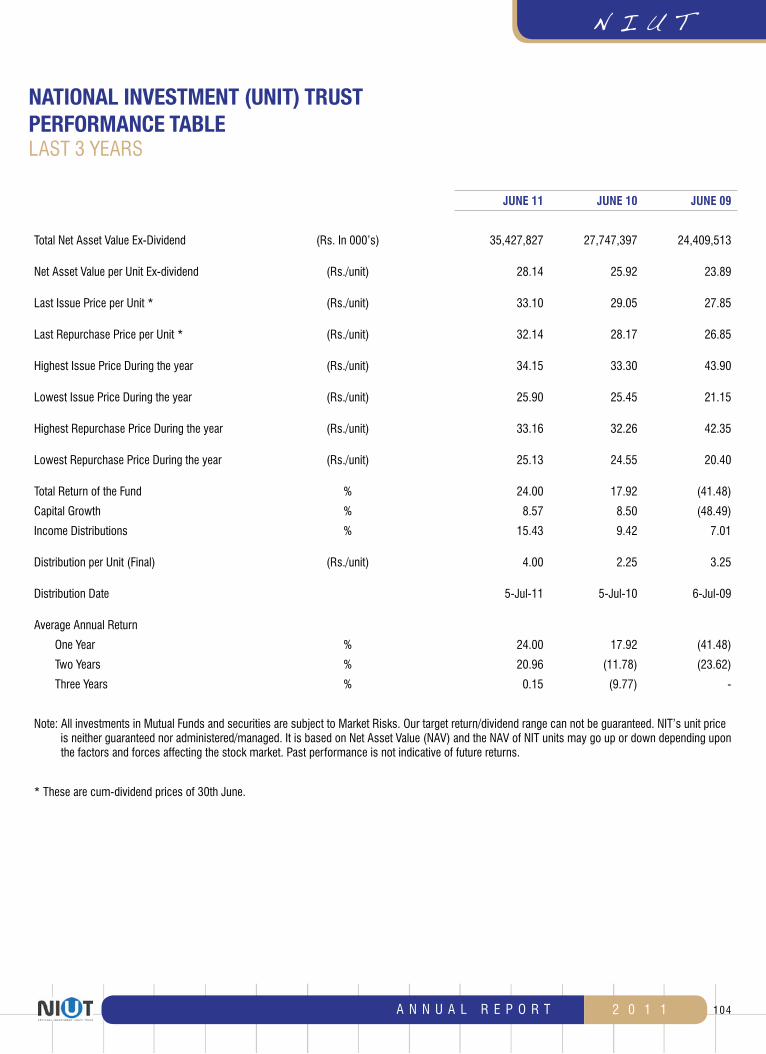
N I U T
NATIONAL INVESTMENT (UNIT) TRUSTPERFORMANCE TABLELAST 3 YEARS
JUNE 11 JUNE 10 JUNE 09
Total Net Asset Value Ex-Dividend (Rs. In 000’s) 35,427,827 27,747,397 24,409,513
Net Asset Value per Unit Ex-dividend (Rs./unit) 28.14 25.92 23.89
Last Issue Price per Unit * (Rs./unit) 33.10 29.05 27.85
Last Repurchase Price per Unit * (Rs./unit) 32.14 28.17 26.85
Highest Issue Price During the year (Rs./unit) 34.15 33.30 43.90
Lowest Issue Price During the year (Rs./unit) 25.90 25.45 21.15
Highest Repurchase Price During the year (Rs./unit) 33.16 32.26 42.35
Lowest Repurchase Price During the year (Rs./unit) 25.13 24.55 20.40
Total Return of the Fund % 24.00 17.92 (41.48)
Capital Growth % 8.57 8.50 (48.49)
Income Distributions % 15.43 9.42 7.01
Distribution per Unit (Final) (Rs./unit) 4.00 2.25 3.25
Distribution Date 5-Jul-11 5-Jul-10 6-Jul-09
Average Annual Return
One Year % 24.00 17.92 (41.48)
Two Years % 20.96 (11.78) (23.62)
Three Years % 0.15 (9.77) -
Note: All investments in Mutual Funds and securities are subject to Market Risks. Our target return/dividend range can not be guaranteed. NIT’s unit price is neither guaranteed nor administered/managed. It is based on Net Asset Value (NAV) and the NAV of NIT units may go up or down depending upon the factors and forces affecting the stock market. Past performance is not indicative of future returns.
* These are cum-dividend prices of 30th June.
T H I R D Q U A R T E R R E P O R T M A R C H 2 0 1 1A N N U A L R E P O R T 104
Related Documents


